Shareholder Report
|
12 Months Ended |
|
Feb. 28, 2026
USD ($)
Holding
|
|---|
| Shareholder Report [Line Items] |
|
| Document Type |
N-CSR
|
| Amendment Flag |
false
|
| Registrant Name |
CM ADVISORS FAMILY OF FUNDS
|
| Entity Central Index Key |
0001208252
|
| Entity Investment Company Type |
N-1A
|
| Document Period End Date |
Feb. 28, 2026
|
| Shareholder Report Annual or Semi-Annual |
Annual Shareholder Report
|
| C000029067 |
|
| Shareholder Report [Line Items] |
|
| Fund Name |
CM Advisors Fixed Income Fund
|
| Trading Symbol |
CMFIX
|
| Annual or Semi-Annual Statement [Text Block] |
This annual shareholder report contains important information about CM Advisors Fixed Income Fund (the "Fund") for the period of March 1, 2025 to February 28, 2026.
|
| Additional Information [Text Block] |
You can find additional information about the Fund at https://cmadvisorsfunds.com/our-fund/cm-advisors-fixed-income-fund. You can also request this information by contacting us at (888) 859-5856.
|
| Additional Information Phone Number |
(888) 859-5856
|
| Additional Information Website |
<span style="font-weight: 700; box-sizing: border-box; color: rgb(0, 0, 0); display: inline; flex-wrap: nowrap; font-size: 12px; grid-area: auto; line-height: 18px; margin: 0px; overflow: visible; text-align: left; text-align-last: left; white-space-collapse: preserve-breaks;">https://cmadvisorsfunds.com/our-fund/cm-advisors-fixed-income-fund</span>
|
| Expenses [Text Block] |
What were the Fund’s annualized costs for the last year?(based on a hypothetical $10,000 investment) Table SummaryFund Name | Costs of a $10,000 investment | Costs paid as a percentage of a $10,000 investment |
|---|
CM Advisors Fixed Income Fund | $91 | 0.87% |
|---|
|
| Expenses Paid, Amount |
$ 91
|
| Expense Ratio, Percent |
0.87%
|
| Performance Past Does Not Indicate Future [Text] |
The Fund's past performance is not a good predictor of how the Fund will perform in the future.
|
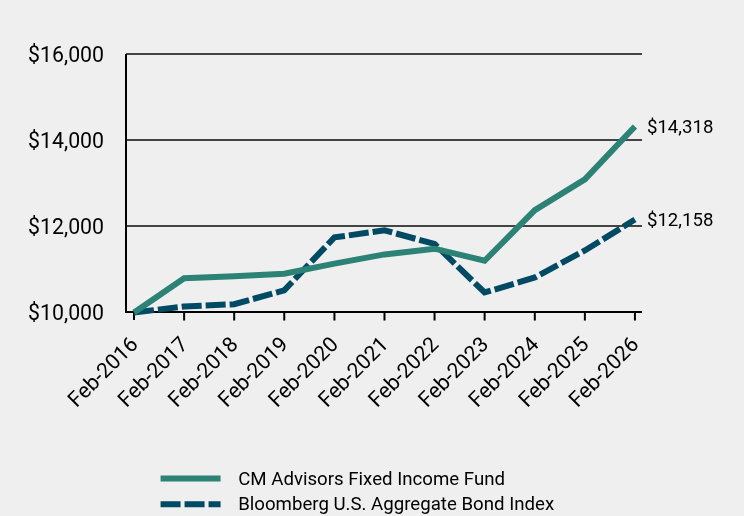
| Line Graph [Table Text Block] |
Table Summary | CM Advisors Fixed Income Fund | Bloomberg U.S. Aggregate Bond Index |
|---|
Feb-2016 | $10,000 | $10,000 |
|---|
Feb-2017 | $10,795 | $10,142 |
|---|
Feb-2018 | $10,842 | $10,193 |
|---|
Feb-2019 | $10,901 | $10,516 |
|---|
Feb-2020 | $11,135 | $11,744 |
|---|
Feb-2021 | $11,349 | $11,907 |
|---|
Feb-2022 | $11,482 | $11,592 |
|---|
Feb-2023 | $11,201 | $10,465 |
|---|
Feb-2024 | $12,374 | $10,813 |
|---|
Feb-2025 | $13,090 | $11,441 |
|---|
Feb-2026 | $14,318 | $12,158 |
|---|
|
| Average Annual Return [Table Text Block] |
Average Annual Total Returns Table Summary | 1 Year | 5 Years | 10 Years |
|---|
CM Advisors Fixed Income Fund | 9.38% | 4.76% | 3.65% |
|---|
Bloomberg U.S. Aggregate Bond Index | 6.26% | 0.42% | 1.97% |
|---|
The Fund's past performance is not a good predictor of how the Fund will perform in the future. The graph and table do not reflect the deduction of taxes that a shareholder would pay on fund distributions or redemption of fund shares. For updated performance call (888) 859-5856. |
| No Deduction of Taxes [Text Block] |
The graph and table do not reflect the deduction of taxes that a shareholder would pay on fund distributions or redemption of fund shares.
|
| AssetsNet |
$ 31,708,972
|
| Holdings Count | Holding |
87
|
| Advisory Fees Paid, Amount |
$ 0
|
| InvestmentCompanyPortfolioTurnover |
29.00%
|
| Additional Fund Statistics [Text Block] |
- Net Assets$31,708,972
- Number of Portfolio Holdings87
- Advisory Fee (net of waivers)$0
- Portfolio Turnover29%
|
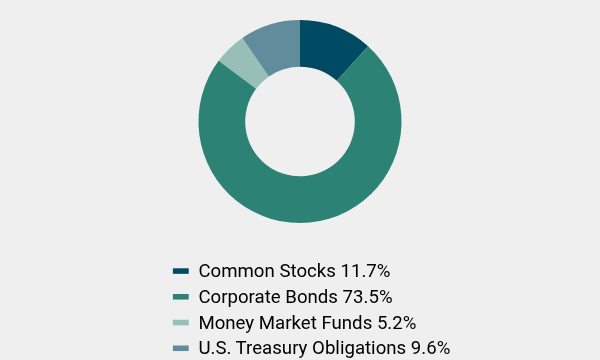
| Holdings [Text Block] |
Asset Weighting (% of total investments)Table SummaryValue | Value |
|---|
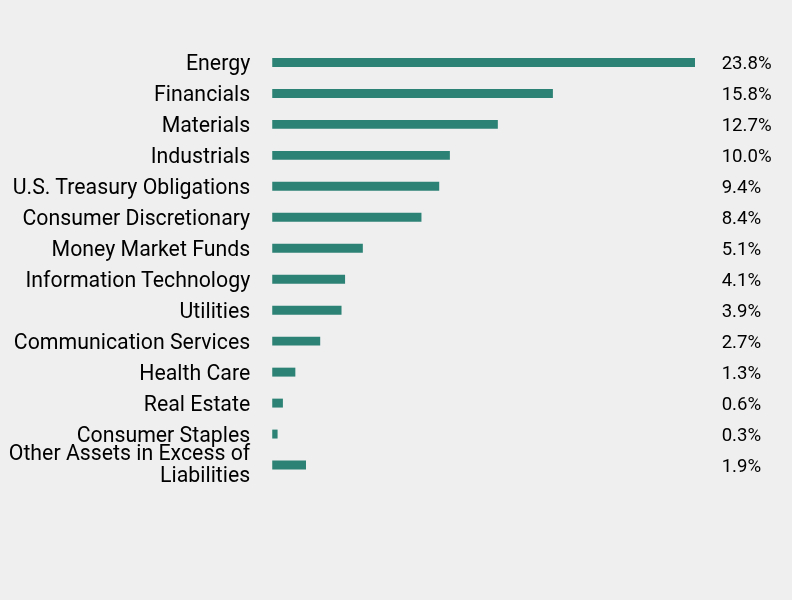
Common Stocks | 11.7% | Corporate Bonds | 73.5% | Money Market Funds | 5.2% | U.S. Treasury Obligations | 9.6% | Sector Weighting (% of net assets)Table SummaryValue | Value |
|---|
Other Assets in Excess of Liabilities | 1.9% | Consumer Staples | 0.3% | Real Estate | 0.6% | Health Care | 1.3% | Communication Services | 2.7% | Utilities | 3.9% | Information Technology | 4.1% | Money Market Funds | 5.1% | Consumer Discretionary | 8.4% | U.S. Treasury Obligations | 9.4% | Industrials | 10.0% | Materials | 12.7% | Financials | 15.8% | Energy | 23.8% | Top 10 Holdings (% of net assets)Table SummaryHolding Name | % of Net Assets |
|---|
PHI Group, Inc. | 11.5% |
|---|
JPMorgan Chase & Company, 1.100%, due 06/22/26 | 2.0% |
|---|
Occidental Petroleum Corporation, 7.875%, due 09/15/31 | 2.0% |
|---|
United Rentals North America, Inc., 5.250%, due 01/15/30 | 1.9% |
|---|
Exelon Corporation, 7.600%, due 04/01/32 | 1.8% |
|---|
Olin Corporation, 5.000%, due 02/01/30 | 1.8% |
|---|
Masco Corporation, 7.750%, due 08/01/29 | 1.7% |
|---|
Western Gas Partners L.P., 4.650%, due 07/01/26 | 1.7% |
|---|
Polaris, Inc., 6.950%, due 03/15/29 | 1.7% |
|---|
Citigroup, Inc., 5.000%, due 06/18/29 | 1.7% |
|---|
|
| Material Fund Change [Text Block] |
No material changes occurred during the year ended February 28, 2026. |