Shareholder Report
|
12 Months Ended |
|
Feb. 28, 2026
USD ($)
Holding
|
|---|
| Shareholder Report [Line Items] |
|
| Document Type |
N-CSR
|
| Amendment Flag |
false
|
| Registrant Name |
Northern Lights Fund Trust IV
|
| Entity Central Index Key |
0001644419
|
| Entity Investment Company Type |
N-1A
|
| Document Period End Date |
Feb. 28, 2026
|
| Shareholder Report Annual or Semi-Annual |
Annual Shareholder Report
|
| C000254728 |
|
| Shareholder Report [Line Items] |
|
| Fund Name |
FM Compounders Equity ETF
|
| Trading Symbol |
FMCE
|
| Security Exchange Name |
NYSEArca
|
| Additional Information Phone Number |
1-888-530-2448
|
| Additional Information Website |
https://fmexcelsioretfs.com/fmce/details/
|
| Expenses [Text Block] |
What were the Fund’s costs for the last year?(based on a hypothetical $10,000 investment) Table SummaryFund Name | Costs of a $10,000 investment | Costs paid as a percentage of a $10,000 investment |
|---|
FM Compounders Equity ETF | $72 | 0.70% |
|---|
|
| Expenses Paid, Amount |
$ 72
|
| Expense Ratio, Percent |
0.70%
|
| Factors Affecting Performance [Text Block] |
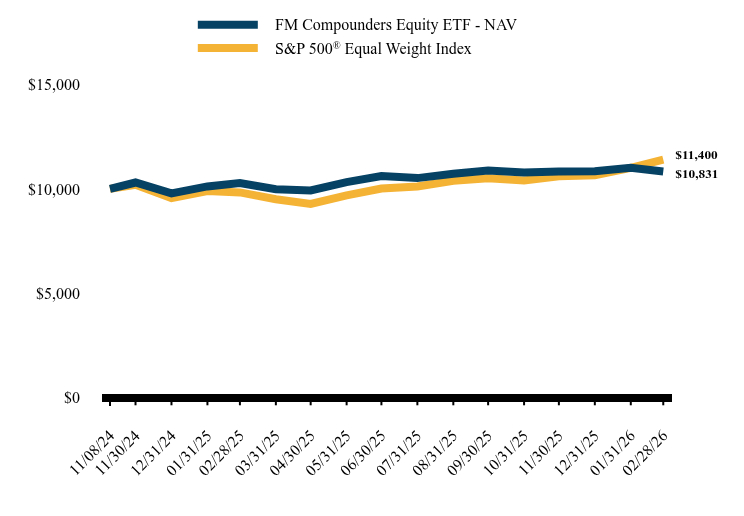
How did the Fund perform during the reporting period? For the fiscal year ended February 28, 2026, FM Compounders Equity ETF ("FMCE") returned 5.42% vs the S&P 500 Equal Weighted of 15.96%. FMCE’s underperformance was driven largely by a continued market rotation out of financial and software stocks. The largest contributors to FMCE's performance in the period (enumerated with return contribution) were: AMAT (+3.22%), ASML (+2.60%) and INTC (+2.39%). The largest detractors were SNPS (-1.18%), CRM (-1.12%) and PGR (-1.06%). |
| Performance Past Does Not Indicate Future [Text] |
The Fund’s past performance is not a good predictor of how the Fund will perform in the future.
|
| Line Graph [Table Text Block] |
Table Summary | FM Compounders Equity ETF - NAV | S&P 500® Equal Weight Index |
|---|
11/08/24 | $10,000 | $10,000 |
|---|
11/30/24 | $10,304 | $10,195 |
|---|
12/31/24 | $9,785 | $9,557 |
|---|
01/31/25 | $10,118 | $9,891 |
|---|
02/28/25 | $10,274 | $9,831 |
|---|
03/31/25 | $9,978 | $9,499 |
|---|
04/30/25 | $9,926 | $9,281 |
|---|
05/31/25 | $10,322 | $9,685 |
|---|
06/30/25 | $10,616 | $10,017 |
|---|
07/31/25 | $10,516 | $10,115 |
|---|
08/31/25 | $10,729 | $10,387 |
|---|
09/30/25 | $10,882 | $10,503 |
|---|
10/31/25 | $10,785 | $10,403 |
|---|
11/30/25 | $10,833 | $10,601 |
|---|
12/31/25 | $10,847 | $10,649 |
|---|
01/31/26 | $11,013 | $11,010 |
|---|
02/28/26 | $10,831 | $11,400 |
|---|
|
| Average Annual Return [Table Text Block] |
Table Summary | 1 Year | Since Inception (November 8, 2024) |
|---|
FM Compounders Equity ETF - NAV
| 5.42% | 6.30% |
|---|
S&P 500® Equal Weight Index | 15.96% | 10.55% |
|---|
|
| Performance Inception Date |
Nov. 08, 2024
|
| No Deduction of Taxes [Text Block] |
The graph and table do not reflect the deduction of taxes that a shareholder would pay on fund distributions or redemption of fund shares.
|
| AssetsNet |
$ 62,645,210
|
| Holdings Count | Holding |
30
|
| Advisory Fees Paid, Amount |
$ 436,620
|
| InvestmentCompanyPortfolioTurnover |
46.00%
|
| Additional Fund Statistics [Text Block] |
Table SummaryNet Assets | $62,645,210 |
|---|
Number of Portfolio Holdings | 30 |
|---|
Advisory Fee | $436,620 |
|---|
Portfolio Turnover | 46% |
|---|
|
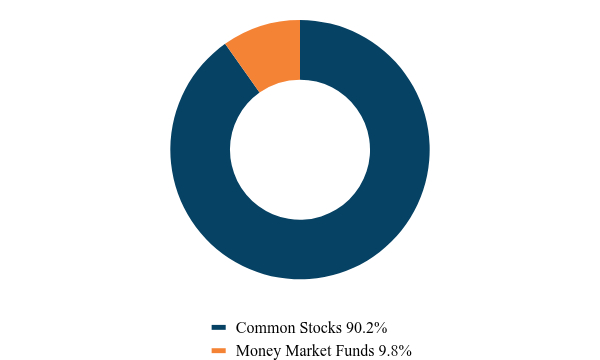
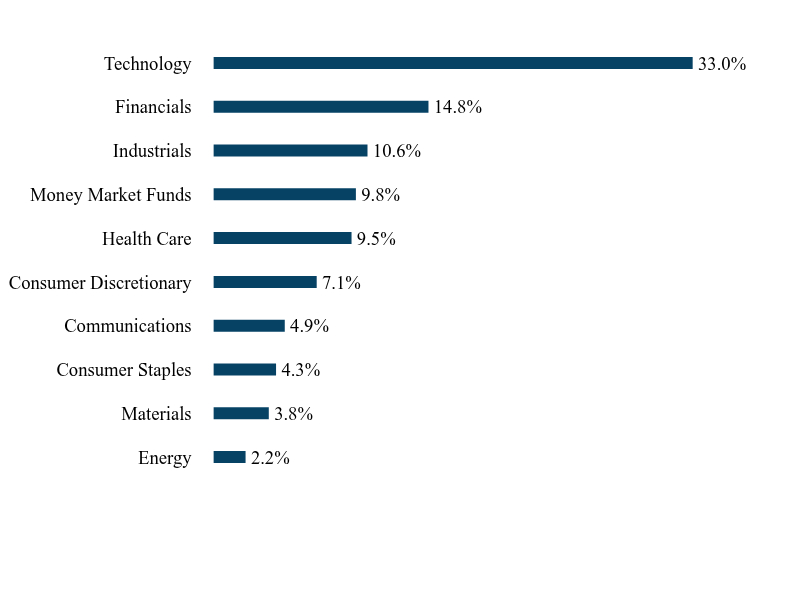
| Holdings [Text Block] |
Asset Weighting (% of total investments)Table SummaryValue | Value |
|---|
Common Stocks | 90.2% | Money Market Funds | 9.8% | Sector Weighting (% of net assets)Table SummaryValue | Value |
|---|
Energy | 2.2% | Materials | 3.8% | Consumer Staples | 4.3% | Communications | 4.9% | Consumer Discretionary | 7.1% | Health Care | 9.5% | Money Market Funds | 9.8% | Industrials | 10.6% | Financials | 14.8% | Technology | 33.0% | |
| Largest Holdings [Text Block] |
Top 10 Equity Holdings (% of net assets) Table SummaryHolding Name | % of Net Assets |
|---|
General Electric Company | 5.1% |
|---|
Intel Corporation | 4.8% |
|---|
Berkshire Hathaway, Inc. - Class B | 4.6% |
|---|
Progressive Corporation (The) | 4.2% |
|---|
Visa, Inc. - Class A | 4.0% |
|---|
Danaher Corporation | 3.9% |
|---|
Amazon.com, Inc. | 3.8% |
|---|
Linde PLC | 3.8% |
|---|
ASML Holding N.V. | 3.8% |
|---|
Salesforce, Inc. | 3.6% |
|---|
|
| Material Fund Change [Text Block] |
No material changes occurred during the year ended February 28, 2026. |
| C000232649 |
|
| Shareholder Report [Line Items] |
|
| Fund Name |
FM Focus Equity ETF
|
| Trading Symbol |
FMCX
|
| Security Exchange Name |
NYSEArca
|
| Additional Information Phone Number |
1-888-530-2448
|
| Additional Information Website |
https://fmexcelsioretfs.com/fmcx/details/
|
| Expenses [Text Block] |
What were the Fund’s costs for the last year?(based on a hypothetical $10,000 investment) Table SummaryFund Name | Costs of a $10,000 investment | Costs paid as a percentage of a $10,000 investment |
|---|
FM Focus Equity ETF | $73 | 0.70% |
|---|
|
| Expenses Paid, Amount |
$ 73
|
| Expense Ratio, Percent |
0.70%
|
| Factors Affecting Performance [Text Block] |
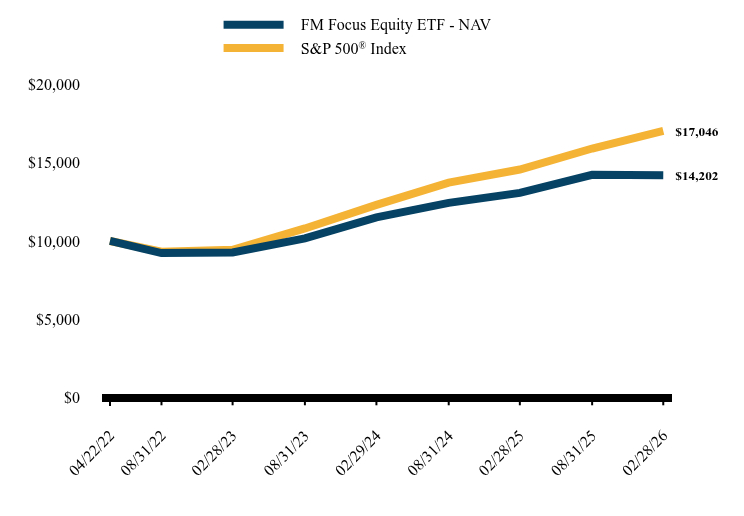
How did the Fund perform during the reporting period? For the fiscal year ended February 28, 2026, FM Focus Equity ETF ("FMCX")returned 8.61% vs. the S&P 500 Index of 16.99%. FMCX’s underperformance was driven largely by a continued market rotation out of financial and software stocks. The largest contributors to FMCX's performance in the period (enumerated with return contribution) were: AMAT (+3.34%), GE (+3.08%) and GEV US (+2.27%). The largest detractors were KKR (-1.92%), CRM (-1.49%) and SNPS (-1.17%). |
| Performance Past Does Not Indicate Future [Text] |
The Fund's past performance is not a good predictor of how the Fund will perform in the future.
|
| Line Graph [Table Text Block] |
Table Summary | FM Focus Equity ETF - NAV | S&P 500® Index |
|---|
04/22/22 | $10,000 | $10,000 |
|---|
08/31/22 | $9,224 | $9,316 |
|---|
02/28/23 | $9,266 | $9,433 |
|---|
08/31/23 | $10,167 | $10,801 |
|---|
02/29/24 | $11,513 | $12,306 |
|---|
08/31/24 | $12,440 | $13,732 |
|---|
02/28/25 | $13,075 | $14,571 |
|---|
08/31/25 | $14,233 | $15,913 |
|---|
02/28/26 | $14,202 | $17,046 |
|---|
|
| Average Annual Return [Table Text Block] |
Table Summary | 1 Year | Since Inception (April 22, 2022) |
|---|
FM Focus Equity ETF - NAV
| 8.61% | 9.53% |
|---|
S&P 500® Index | 16.99% | 14.84% |
|---|
|
| Performance Inception Date |
Apr. 22, 2022
|
| No Deduction of Taxes [Text Block] |
The graph and table do not reflect the deduction of taxes that a shareholder would pay on fund distributions or redemption of fund shares.
|
| AssetsNet |
$ 108,523,011
|
| Holdings Count | Holding |
30
|
| Advisory Fees Paid, Amount |
$ 745,050
|
| InvestmentCompanyPortfolioTurnover |
67.00%
|
| Additional Fund Statistics [Text Block] |
Table SummaryNet Assets | $108,523,011 |
|---|
Number of Portfolio Holdings | 30 |
|---|
Advisory Fee | $745,050 |
|---|
Portfolio Turnover | 67% |
|---|
|
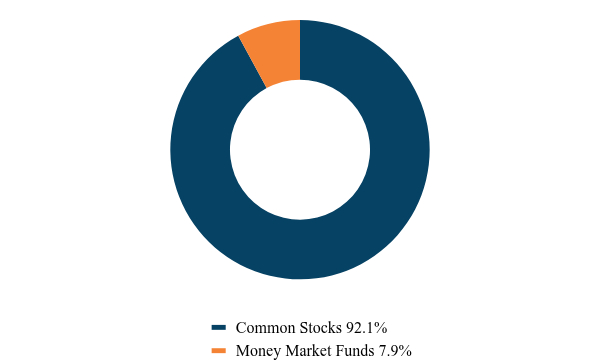
| Holdings [Text Block] |
Asset Weighting (% of total investments)Table SummaryValue | Value |
|---|
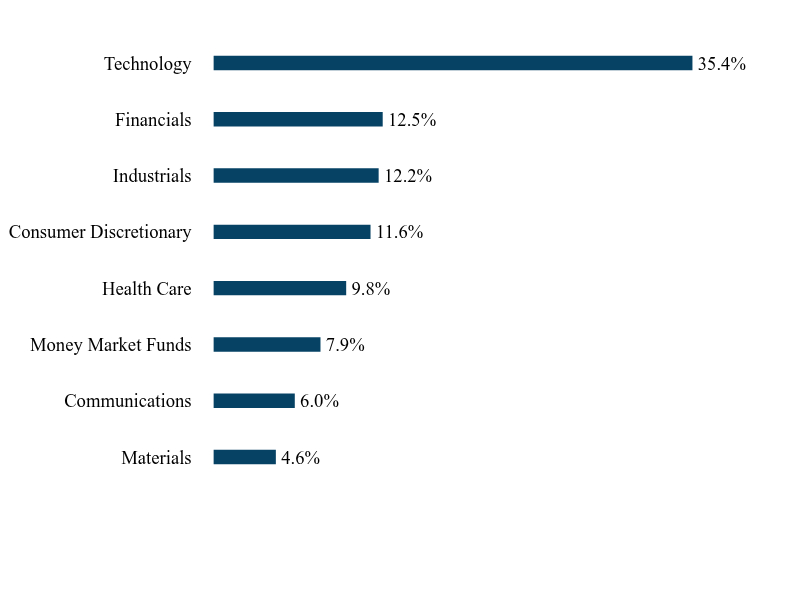
Common Stocks | 92.1% | Money Market Funds | 7.9% | Sector Weighting (% of net assets)Table SummaryValue | Value |
|---|
Materials | 4.6% | Communications | 6.0% | Money Market Funds | 7.9% | Health Care | 9.8% | Consumer Discretionary | 11.6% | Industrials | 12.2% | Financials | 12.5% | Technology | 35.4% | |
| Largest Holdings [Text Block] |
Top 10 Equity Holdings (% of net assets) Table SummaryHolding Name | % of Net Assets |
|---|
General Electric Company | 6.5% |
|---|
Microsoft Corporation | 6.3% |
|---|
Berkshire Hathaway, Inc. - Class A | 4.9% |
|---|
Linde PLC | 4.6% |
|---|
KKR & Company, Inc. | 4.4% |
|---|
O'Reilly Automotive, Inc. | 4.2% |
|---|
Danaher Corporation | 4.1% |
|---|
Amazon.com, Inc. | 4.1% |
|---|
Intel Corporation | 3.9% |
|---|
Applied Materials, Inc. | 3.8% |
|---|
|
| Material Fund Change [Text Block] |
No material changes occurred during the year ended February 28, 2026. |