pure in Thousands
Pay Versus Performance Table
In accordance with SEC rules, the following table sets forth information with respect to how “compensation actually paid” (“CAP”) to our NEOs aligns with company performance. CAP is an SEC-defined term that does not necessarily reflect the amounts ultimately realized by the NEOs or how the Compensation Committee views the link between company performance and NEO compensation. In addition, a significant portion of CAP relates to changes in the fair value of unvested equity awards over the course of each year. Unvested equity awards remain subject to risk from forfeiture and vesting conditions and potential future declines in value based on changes in the price of our common stock. The ultimate values actually realized by our NEOs from unvested equity awards cannot be determined until the awards vest.
| (a) | (b) | (c) | (d) | (e) | (f) | (g) | (h) | (i) |
| Value of initial fixed | ||||||||
| Year | Summary | Compensation | Average Summary | Average Compensation | PVH Total | Peer Group Total | Net Income5 | Non-GAAP |
| 2025 | 16,165,385 | (1,144,750) | 4,272,028 | 952,540 | 73.70 | 68.73 | 25,300 | 790,535 |
| 2024 | 16,278,038 | 1,029,384 | 4,353,536 | 2,403,575 | 103.49 | 84.99 | 598,500 | 865,200 |
| 2023 | 15,613,904 | 31,275,630 | 4,868,455 | 6,435,205 | 140.02 | 78.65 | 663,600 | 951,795 |
| 2022 | 12,139,075 | 9,531,057 | 3,912,972 | 3,363,964 | 101.26 | 89.13 | 200,400 | 908,543 |
| 2021 | 14,714,208 | 15,456,925 | 5,199,568 | 3,543,319 | 106.89 | 96.33 | 952,300 | 983,494 |
1 Column (b) contains compensation amounts reported in the “Total” column of the Summary Compensation Table (“SCT”) for Mr. Larsson, our Chief Executive Officer. Column (d) contains the average of the compensation amounts reported in the “Total” column of the SCT for our NEOs other than our Chief Executive Officer (“Other NEOs”) for each of the years listed. The Other NEOs are as follows:
• 2025: Messrs. Coughlin, Savman and Olsson, and Mses. Rytz Goldman, Stone and Serrano;
• 2024: Messrs. Coughlin and Savman and Martijn Hagman, our former Chief Executive Officer, PVH Europe, and Mses. Rytz Goldman and Serrano;
• 2023: Messrs. Coughlin and Hagman, and Ms. Serrano and Julie A. Fuller, our former Executive Vice President, Chief People Officer;
• 2022: Messrs. Coughlin and Hagman, Ms. Fuller, James W. Holmes, previously our Interim CFO, Mark D. Fischer, Executive Vice President, General Counsel and Secretary, and Patricia Donnelly, our former CEO PVH Americas and CK Global;
• 2021: Messrs. Holmes and Coughlin, Mses. Fuller and Donnelly, Michael A. Shaffer, our former Chief Operating & Financial Officer, and Cheryl Abel-Hodges, our former Chief Executive Officer, Calvin Klein.
2 Compensation actually paid to our CEO in each of the years listed reflects the respective amounts set forth in column (b) of the table above, adjusted in accordance with SEC rules. The adjustments for 2025 are set forth in the table below. The dollar amounts in column (b) of the table above do not reflect the actual amount of compensation earned by or paid to our CEO during the applicable year.
Adjustments to determine CAP to the Chief Executive Officer for 2025:
| 2025 | ||
| Summary Compensation Table Column | $16,165,385 | |
| Subtract aggregate change in the actuarial present value of accumulated benefit under pension plans reported in the “Change in Pension Value and Nonqualified Deferred Compensation Earnings” column of the SCT | (45,080) | |
| Subtract amounts reported under the “Stock Awards” column in the SCT | (12,200,530) | |
| Add the fair value of awards granted during the covered year that remain unvested as of covered year end* | 7,215,132 | |
| Add (subtract) the change in fair value of awards granted in any prior year that were outstanding and unvested as of the covered year end* | (10,545,502) | |
| Add (subtract) the change in fair value of awards granted in any prior year that vested during the covered year* | (1,734,155) | |
| Compensation Actually Paid to CEO | $(1,144,750) |
* The fair values of our market-based PSUs are estimated as of each measurement date using the Monte Carlo simulation model, using assumptions updated for each measurement date. The fair values of our non-market-based PSUs are equal to the closing price of our common stock on each measurement date, reduced for the present value of any dividends expected to be paid on our common stock, as these contingently issuable PSUs do not accrue dividends. Changes in fair value of awards granted in any prior year are measured by comparing fair value as of the end of the covered year (for awards unvested as of the covered year-end) or at vesting (for awards that vested during the covered year) to the fair value as of the end of the prior year.
3 Compensation actually paid to our Other NEOs in each of the years listed reflects the respective amounts set forth in column (d) of the table above, adjusted in accordance with SEC rules. The adjustments for 2025 are set forth in the table below. The dollar amounts in column (d) of the table above do not reflect the actual amount of compensation earned by or paid to our Other NEOs during the applicable year.
Adjustments to determine CAP to Other NEOs for 2025:
| 2025 | ||
| Average SCT Total for Other NEOs | $4,272,028 | |
| Subtract amounts reported under the “Stock Awards” column in the SCT | (2,028,297) | |
| Add the fair value of awards granted during the covered year that remain unvested as of covered year end* | 597,587 | |
| Add (subtract) the change in fair value of awards granted in any prior year that were outstanding and unvested as of the covered year end* | (429,598) | |
| Add (subtract) the change in fair value of awards granted in any prior year that vested during the covered year* | (117,881) | |
| Subtract the fair value of awards granted in any prior year that were forfeited during the covered year* | (1,341,299) | |
| Average Compensation Actually Paid to Other NEOs | $952,540 |
* The fair values of our market-based PSUs are estimated as of each measurement date using the Monte Carlo simulation model, using assumptions updated for each measurement date. The fair values of our non-market-based PSUs are equal to the closing price of our common stock on each measurement date, reduced for the present value of any dividends expected to be paid on our common stock, as these contingently issuable PSUs do not accrue dividends. Changes in fair value of awards granted in any prior year are measured by comparing fair value as of the end of the covered year (for awards unvested as of the covered year-end) or at vesting (for awards that vested during the covered year) to the fair value as of the end of the prior year.
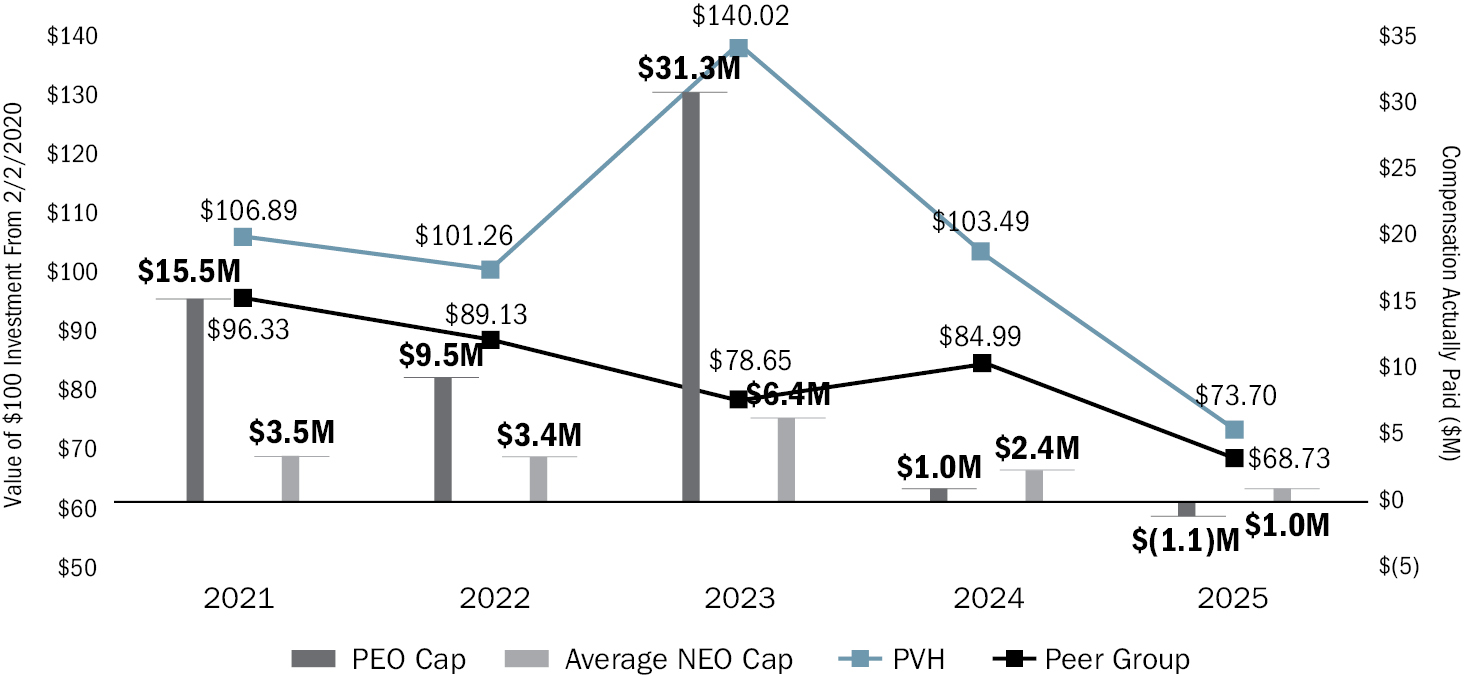
4 We utilized the S&P 500 Apparel, Accessories & Luxury Goods Index for our peer group TSR in 2020 and 2021. We are no longer included in the S&P 500 Apparel, Accessories & Luxury Good Index and, as a result, no longer use it as our industry peer group. We are now in the S&P 1500 Apparel, Accessories & Luxury Goods Index (the “New Index”), which we utilized for our 2022, 2023, 2024 and 2025 peer group TSR and in the stock performance graph required by Item 201(e) of Regulation S-K. The New Index TSR amount for 2021 is $104.29. TSR assumes an initial investment of $100 in our common stock on February 1, 2021, and reinvestment of dividends. A hypothetical $100 investment in the New Index using the same methodology is shown for comparison.
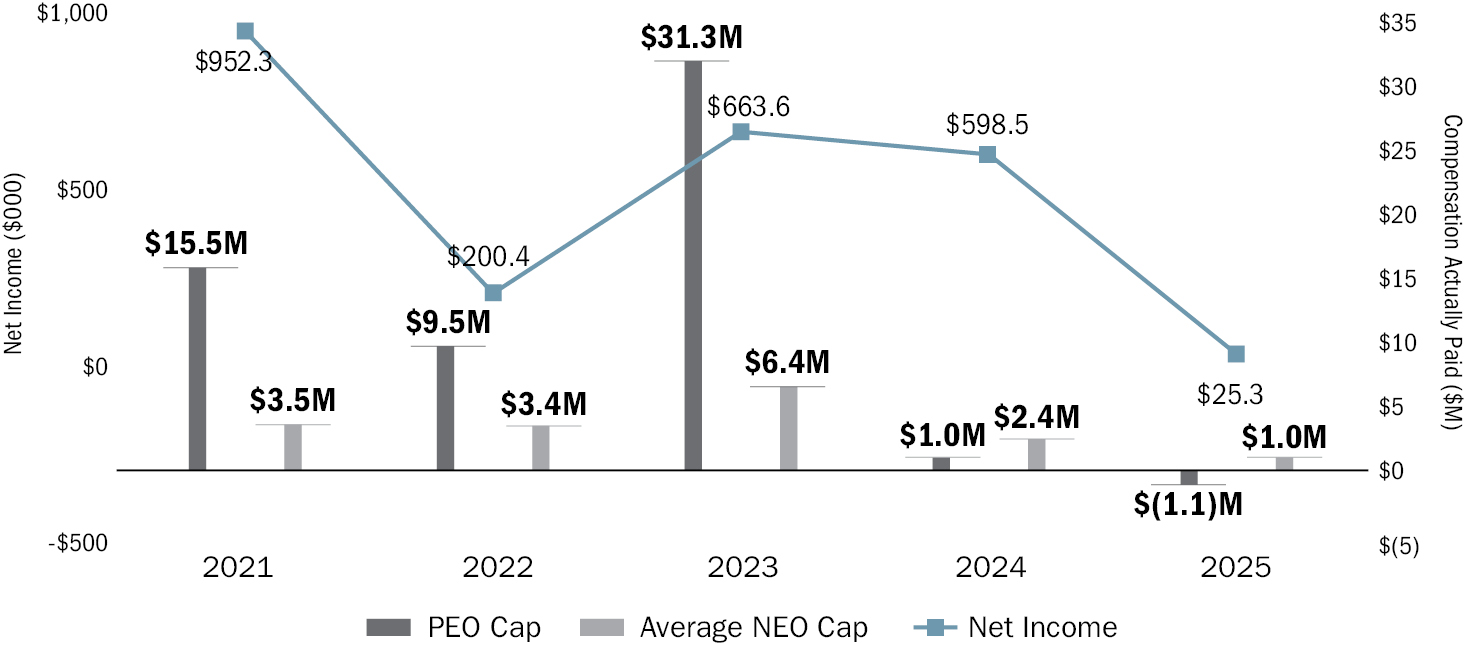
5 Reflects Net Income in the company’s Consolidated Statements of Operations included in the company’s Annual Report on Form 10-K for the applicable fiscal year.
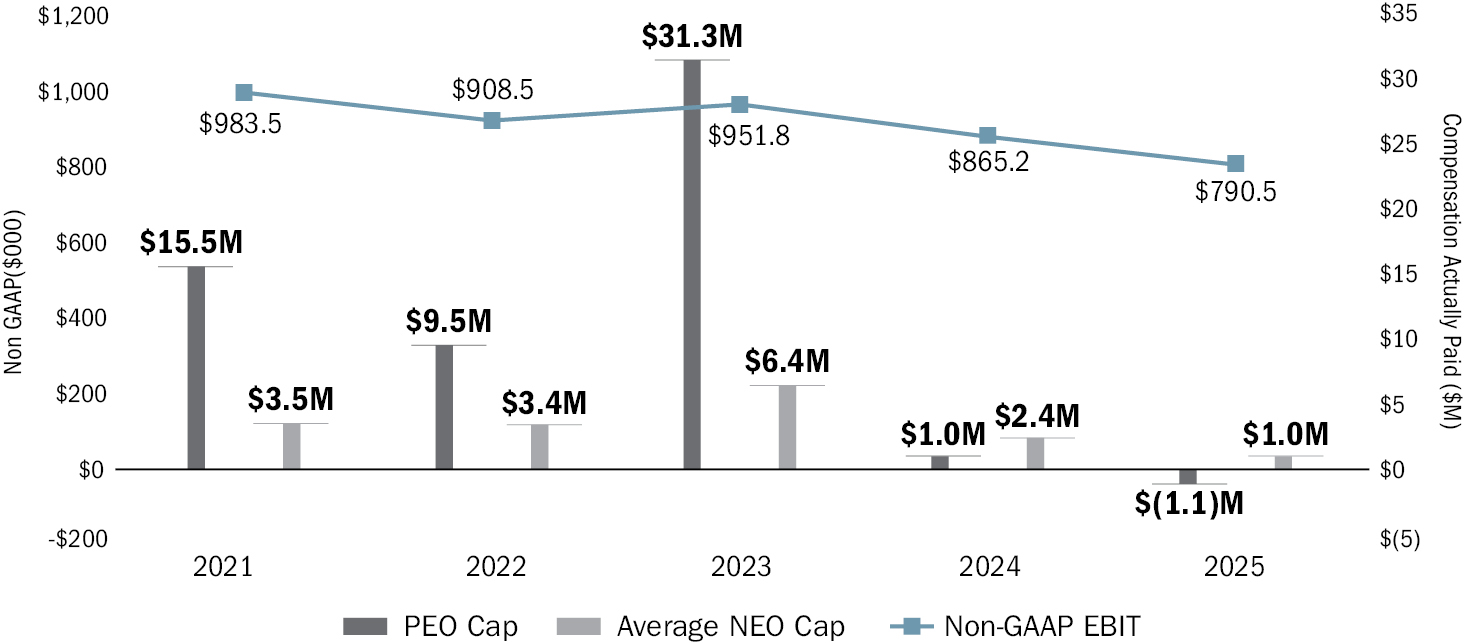
6 The company-selected financial measure is EBIT on a non-GAAP basis. We calculate our EBIT on a non-GAAP basis by starting with our GAAP results and then apply a list of adjustments and exclusions approved by the Compensation Committee when it makes performance-based awards. See reconciliations on Exhibit A.
• 2025: Messrs. Coughlin, Savman and Olsson, and Mses. Rytz Goldman, Stone and Serrano;
• 2024: Messrs. Coughlin and Savman and Martijn Hagman, our former Chief Executive Officer, PVH Europe, and Mses. Rytz Goldman and Serrano;
• 2023: Messrs. Coughlin and Hagman, and Ms. Serrano and Julie A. Fuller, our former Executive Vice President, Chief People Officer;
• 2022: Messrs. Coughlin and Hagman, Ms. Fuller, James W. Holmes, previously our Interim CFO, Mark D. Fischer, Executive Vice President, General Counsel and Secretary, and Patricia Donnelly, our former CEO PVH Americas and CK Global;
• 2021: Messrs. Holmes and Coughlin, Mses. Fuller and Donnelly, Michael A. Shaffer, our former Chief Operating & Financial Officer, and Cheryl Abel-Hodges, our former Chief Executive Officer, Calvin Klein.
Adjustments to determine CAP to the Chief Executive Officer for 2025:
| 2025 | ||
| Summary Compensation Table Column | $16,165,385 | |
| Subtract aggregate change in the actuarial present value of accumulated benefit under pension plans reported in the “Change in Pension Value and Nonqualified Deferred Compensation Earnings” column of the SCT | (45,080) | |
| Subtract amounts reported under the “Stock Awards” column in the SCT | (12,200,530) | |
| Add the fair value of awards granted during the covered year that remain unvested as of covered year end* | 7,215,132 | |
| Add (subtract) the change in fair value of awards granted in any prior year that were outstanding and unvested as of the covered year end* | (10,545,502) | |
| Add (subtract) the change in fair value of awards granted in any prior year that vested during the covered year* | (1,734,155) | |
| Compensation Actually Paid to CEO | $(1,144,750) |
* The fair values of our market-based PSUs are estimated as of each measurement date using the Monte Carlo simulation model, using assumptions updated for each measurement date. The fair values of our non-market-based PSUs are equal to the closing price of our common stock on each measurement date, reduced for the present value of any dividends expected to be paid on our common stock, as these contingently issuable PSUs do not accrue dividends. Changes in fair value of awards granted in any prior year are measured by comparing fair value as of the end of the covered year (for awards unvested as of the covered year-end) or at vesting (for awards that vested during the covered year) to the fair value as of the end of the prior year.
Adjustments to determine CAP to Other NEOs for 2025:
| 2025 | ||
| Average SCT Total for Other NEOs | $4,272,028 | |
| Subtract amounts reported under the “Stock Awards” column in the SCT | (2,028,297) | |
| Add the fair value of awards granted during the covered year that remain unvested as of covered year end* | 597,587 | |
| Add (subtract) the change in fair value of awards granted in any prior year that were outstanding and unvested as of the covered year end* | (429,598) | |
| Add (subtract) the change in fair value of awards granted in any prior year that vested during the covered year* | (117,881) | |
| Subtract the fair value of awards granted in any prior year that were forfeited during the covered year* | (1,341,299) | |
| Average Compensation Actually Paid to Other NEOs | $952,540 |
* The fair values of our market-based PSUs are estimated as of each measurement date using the Monte Carlo simulation model, using assumptions updated for each measurement date. The fair values of our non-market-based PSUs are equal to the closing price of our common stock on each measurement date, reduced for the present value of any dividends expected to be paid on our common stock, as these contingently issuable PSUs do not accrue dividends. Changes in fair value of awards granted in any prior year are measured by comparing fair value as of the end of the covered year (for awards unvested as of the covered year-end) or at vesting (for awards that vested during the covered year) to the fair value as of the end of the prior year.
|
PVH TSR vs. Peer Group TSR vs. CAP |
|
|
PVH Net Income vs. CAP |
|
|
PVH Non-GAAP EBIT vs. CAP |
|
Pay Versus Performance: Most Important Measures
In the company’s assessment, the following chart lists the most important financial performance measures we use to link compensation actually paid to the NEOs, as determined in accordance with SEC rules, to company performance for 2025. The Compensation Discussion & Analysis discusses the ways we use these measures in our NEO compensation program and how they are important to and linked with our performance.
| Most Important Financial Performance Measures | |
| EBIT Relative TSR Revenue ROIC |
| [1] | Column (b) contains compensation amounts reported in the “Total” column of the Summary Compensation Table (“SCT”) for Mr. Larsson, our Chief Executive Officer. Column (d) contains the average of the compensation amounts reported in the “Total” column of the SCT for our NEOs other than our Chief Executive Officer (“Other NEOs”) for each of the years listed. The Other NEOs are as follows: • 2025: Messrs. Coughlin, Savman and Olsson, and Mses. Rytz Goldman, Stone and Serrano; • 2024: Messrs. Coughlin and Savman and Martijn Hagman, our former Chief Executive Officer, PVH Europe, and Mses. Rytz Goldman and Serrano; • 2023: Messrs. Coughlin and Hagman, and Ms. Serrano and Julie A. Fuller, our former Executive Vice President, Chief People Officer; • 2022: Messrs. Coughlin and Hagman, Ms. Fuller, James W. Holmes, previously our Interim CFO, Mark D. Fischer, Executive Vice President, General Counsel and Secretary, and Patricia Donnelly, our former CEO PVH Americas and CK Global; • 2021: Messrs. Holmes and Coughlin, Mses. Fuller and Donnelly, Michael A. Shaffer, our former Chief Operating & Financial Officer, and Cheryl Abel-Hodges, our former Chief Executive Officer, Calvin Klein. |
|||||||||||||||||
| [2] | Compensation actually paid to our CEO in each of the years listed reflects the respective amounts set forth in column (b) of the table above, adjusted in accordance with SEC rules. The adjustments for 2025 are set forth in the table below. The dollar amounts in column (b) of the table above do not reflect the actual amount of compensation earned by or paid to our CEO during the applicable year. Adjustments to determine CAP to the Chief Executive Officer for 2025:
* The fair values of our market-based PSUs are estimated as of each measurement date using the Monte Carlo simulation model, using assumptions updated for each measurement date. The fair values of our non-market-based PSUs are equal to the closing price of our common stock on each measurement date, reduced for the present value of any dividends expected to be paid on our common stock, as these contingently issuable PSUs do not accrue dividends. Changes in fair value of awards granted in any prior year are measured by comparing fair value as of the end of the covered year (for awards unvested as of the covered year-end) or at vesting (for awards that vested during the covered year) to the fair value as of the end of the prior year. |
|||||||||||||||||
| [3] | Compensation actually paid to our Other NEOs in each of the years listed reflects the respective amounts set forth in column (d) of the table above, adjusted in accordance with SEC rules. The adjustments for 2025 are set forth in the table below. The dollar amounts in column (d) of the table above do not reflect the actual amount of compensation earned by or paid to our Other NEOs during the applicable year. Adjustments to determine CAP to Other NEOs for 2025:
* The fair values of our market-based PSUs are estimated as of each measurement date using the Monte Carlo simulation model, using assumptions updated for each measurement date. The fair values of our non-market-based PSUs are equal to the closing price of our common stock on each measurement date, reduced for the present value of any dividends expected to be paid on our common stock, as these contingently issuable PSUs do not accrue dividends. Changes in fair value of awards granted in any prior year are measured by comparing fair value as of the end of the covered year (for awards unvested as of the covered year-end) or at vesting (for awards that vested during the covered year) to the fair value as of the end of the prior year. |
|||||||||||||||||
| [4] | We utilized the S&P 500 Apparel, Accessories & Luxury Goods Index for our peer group TSR in 2020 and 2021. We are no longer included in the S&P 500 Apparel, Accessories & Luxury Good Index and, as a result, no longer use it as our industry peer group. We are now in the S&P 1500 Apparel, Accessories & Luxury Goods Index (the “New Index”), which we utilized for our 2022, 2023, 2024 and 2025 peer group TSR and in the stock performance graph required by Item 201(e) of Regulation S-K. The New Index TSR amount for 2021 is $104.29. TSR assumes an initial investment of $100 in our common stock on February 1, 2021, and reinvestment of dividends. A hypothetical $100 investment in the New Index using the same methodology is shown for comparison. | |||||||||||||||||
| [5] | Reflects Net Income in the company’s Consolidated Statements of Operations included in the company’s Annual Report on Form 10-K for the applicable fiscal year. | |||||||||||||||||
| [6] | The company-selected financial measure is EBIT on a non-GAAP basis. We calculate our EBIT on a non-GAAP basis by starting with our GAAP results and then apply a list of adjustments and exclusions approved by the Compensation Committee when it makes performance-based awards. See reconciliations on Exhibit A. | |||||||||||||||||
| [7] | The fair values of our market-based PSUs are estimated as of each measurement date using the Monte Carlo simulation model, using assumptions updated for each measurement date. The fair values of our non-market-based PSUs are equal to the closing price of our common stock on each measurement date, reduced for the present value of any dividends expected to be paid on our common stock, as these contingently issuable PSUs do not accrue dividends. Changes in fair value of awards granted in any prior year are measured by comparing fair value as of the end of the covered year (for awards unvested as of the covered year-end) or at vesting (for awards that vested during the covered year) to the fair value as of the end of the prior year. |