Pay vs Performance Disclosure
|
12 Months Ended |
|
Feb. 01, 2026
USD ($)
|
Feb. 02, 2025
USD ($)
|
Jan. 28, 2024
USD ($)
|
Jan. 29, 2023
USD ($)
|
Jan. 30, 2022
USD ($)
|
| Pay vs Performance Disclosure |
|
|
|
|
|
|
| Pay vs Performance Disclosure, Table |
|
Pay
versus Performance
The
following table shows the past five fiscal years’ total compensation for the named executive officers as set forth in the Summary
Compensation Table, the total compensation actually paid (“CAP”) to the named executive officers, the Company’s total
shareholder return (“TSR”), the peer group’s total shareholder return over the same period, the Company’s net
income, and the Company’s EPS as the company-selected performance measure. Fiscal
Year 2026 Pay versus Performance Table
| Year | | | Summary compensation table total for CEO(1) | | | Compensation actually paid to CEO(2) | | | Average summary compensation table total for other NEOs(1) | | | Average compensation actually paid to other NEOs(2) | | | Total shareholder return(3) | | | Peer group total shareholder return(3) | | | Net income | | | EPS | | | | | | ($) | | | ($) | | | ($) | | | ($) | | | ($) | | | ($) | | | ($, in thousands) | | | ($) | | | 2026 | | | | 1,856,877 | | | | 1,623,199 | | | | 936,024 | | | | 620,374 | | | | 56.18 | | | | 99.88 | | | | (26,967 | ) | | | (2.54 | ) | | 2025 | | | | 1,624,654 | | | | 57,920 | | | | 705,987 | | | | 97,258 | | | | 63.19 | | | | 109.27 | | | | (12,507 | ) | | | (1.19 | ) | | 2024 | | | | 1,215,181 | | | | 1,444,583 | | | | 567,507 | | | | 617,865 | | | | 117.75 | | | | 102.30 | | | | 9,865 | | | | 0.91 | | | 2023 | | | | 1,186,994 | | | | 1,067,309 | | | | 538,642 | | | | 462,562 | | | | 92.52 | | | | 95.20 | | | | (4,312 | ) | | | (0.37 | ) | | 2022 | | | | 798,169 | | | | 406,825 | | | | 577,484 | | | | 244,027 | | | | 90.30 | | | | 119.43 | | | | 11,718 | | | | 0.97 | |
| (1) | The
principal executive officers and other named executive officers for fiscal years 2022 - 2026 are the following: |
| Year | | CEO | | Other NEOs | | 2026 | | Jeremy R. Hoff | | C. Earl Armstrong III, Anne J. Smith | | 2025 | | Jeremy R. Hoff | | Paul A. Huckfeldt, Anne J. Smith, Tod R. Phelps | | 2024 | | Jeremy R. Hoff | | Paul A. Huckfeldt, Anne J. Smith, Tod R. Phelps | | 2023 | | Jeremy R. Hoff | | Paul A. Huckfeldt, Anne J. Smith, Tod R. Phelps | | 2022 | | Jeremy R. Hoff | | Paul A. Huckfeldt, Anne J. Smith, Tod R. Phelps, D. Lee Boone |
| (2) | SEC
rules require certain adjustments be made to the Summary Compensation Table totals to determine compensation “actually paid”
as reported in the Pay versus Performance table. The following table details these adjustments: |
Year | | | Executives | | Summary Compensation Table Total | | | Deduct Reported Change in Actuarial Present Value of Pension Benefits | | | Add Pension Benefit Adjustments(a) | | | Deduct Reported Value of Equity Awards | | | Add Equity Award Adjustments(b) | | | Compensation Actually Paid | | | | | | | | ($) | | | ($) | | | ($) | | | ($) | | | ($) | | | ($) | | | 2026 | | | CEO | | | 1,856,877 | | | | - | | | | - | | | | (1,162,088 | ) | | | 928,410 | | | | 1,623,199 | | | | | | Other NEOs | | | 936,024 | | | | (111,346 | ) | | | 25,507 | | | | (289,420 | ) | | | 59,609 | | | | 620,374 | |
| (a) | SEC
rules require certain adjustments be made to pension compensation totals to determine CAP. The following table details these adjustments: |
| Year | | | Executives | | Service Cost (i) | | | Prior Service Cost (ii) | | | Total Pension Value Adjustment | | | | | | | | ($) | | | ($) | | | ($) | | | 2026 | | | CEO | | | - | | | | - | | | | - | | | | | | Other NEOs | | | 25,507 | | | | - | | | | 25,507 | |
| (b) | SEC
rules require certain adjustments be made to equity award totals to determine CAP. The following table details these adjustments: |
| Year | | Executive | | Year end fair value of equity awards granted during the year | | | Year over year change in fair value of outstanding and unvested equity awards | | | Fair value as of vesting date of equity awards granted and vested in the year | | | Year over year change in fair value of equity awards granted in prior years that vested in the year | | | Fair value at the end of the prior year of equity awards that failed to meet vesting conditions in the year | | | Value of dividends or other earnings paid on stock or option awards not otherwise reflected in fair value or total compensation | | | Total equity award adjustments | | | | | | | | ($) | | | | ($) | | | | ($) | | | | ($) | | | | ($) | | | | ($) | | | | ($) | | | 2026 | | CEO | | | 1,222,525 | | | | 55,721 | | | | - | | | | (80,698 | ) | | | (269,138 | ) | | | - | | | | 928,410 | | | | | Other NEOs | | | 173,978 | | | | 1,387 | | | | - | | | | (11,781 | ) | | | (103,975 | ) | | | | | | | 59,609 | |
| (3) | Total
shareholder return (TSR) is determined based on the value of an initial fixed investment of $100 at the beginning of the 2022 fiscal
year. The peer group TSR prepared by Zacks Investment Research, Inc. represents cumulative, weighted TSR of the peer group under Standard
Industrial Classification (SIC) Codes 2510 and 2511, which includes home furnishings companies that are publicly traded in the United
States or Canada. For more information regarding the peer group TSR, refer to the performance graph that is included in the 2026 Form
10-K, as filed with the SEC. |
|
|
|
|
|
| Company Selected Measure Name |
|
EPS
|
|
|
|
|
| Named Executive Officers, Footnote |
|
| (1) | The
principal executive officers and other named executive officers for fiscal years 2022 - 2026 are the following: |
| Year | | CEO | | Other NEOs | | 2026 | | Jeremy R. Hoff | | C. Earl Armstrong III, Anne J. Smith | | 2025 | | Jeremy R. Hoff | | Paul A. Huckfeldt, Anne J. Smith, Tod R. Phelps | | 2024 | | Jeremy R. Hoff | | Paul A. Huckfeldt, Anne J. Smith, Tod R. Phelps | | 2023 | | Jeremy R. Hoff | | Paul A. Huckfeldt, Anne J. Smith, Tod R. Phelps | | 2022 | | Jeremy R. Hoff | | Paul A. Huckfeldt, Anne J. Smith, Tod R. Phelps, D. Lee Boone |
|
|
|
|
|
| PEO Total Compensation Amount |
[1] |
$ 1,856,877
|
$ 1,624,654
|
$ 1,215,181
|
$ 1,186,994
|
$ 798,169
|
| PEO Actually Paid Compensation Amount |
[2] |
$ 1,623,199
|
57,920
|
1,444,583
|
1,067,309
|
406,825
|
| Adjustment To PEO Compensation, Footnote |
|
| (2) | SEC
rules require certain adjustments be made to the Summary Compensation Table totals to determine compensation “actually paid”
as reported in the Pay versus Performance table. The following table details these adjustments: |
Year | | | Executives | | Summary Compensation Table Total | | | Deduct Reported Change in Actuarial Present Value of Pension Benefits | | | Add Pension Benefit Adjustments(a) | | | Deduct Reported Value of Equity Awards | | | Add Equity Award Adjustments(b) | | | Compensation Actually Paid | | | | | | | | ($) | | | ($) | | | ($) | | | ($) | | | ($) | | | ($) | | | 2026 | | | CEO | | | 1,856,877 | | | | - | | | | - | | | | (1,162,088 | ) | | | 928,410 | | | | 1,623,199 | | | | | | Other NEOs | | | 936,024 | | | | (111,346 | ) | | | 25,507 | | | | (289,420 | ) | | | 59,609 | | | | 620,374 | |
| (a) | SEC
rules require certain adjustments be made to pension compensation totals to determine CAP. The following table details these adjustments: |
| Year | | | Executives | | Service Cost (i) | | | Prior Service Cost (ii) | | | Total Pension Value Adjustment | | | | | | | | ($) | | | ($) | | | ($) | | | 2026 | | | CEO | | | - | | | | - | | | | - | | | | | | Other NEOs | | | 25,507 | | | | - | | | | 25,507 | |
| (b) | SEC
rules require certain adjustments be made to equity award totals to determine CAP. The following table details these adjustments: |
| Year | | Executive | | Year end fair value of equity awards granted during the year | | | Year over year change in fair value of outstanding and unvested equity awards | | | Fair value as of vesting date of equity awards granted and vested in the year | | | Year over year change in fair value of equity awards granted in prior years that vested in the year | | | Fair value at the end of the prior year of equity awards that failed to meet vesting conditions in the year | | | Value of dividends or other earnings paid on stock or option awards not otherwise reflected in fair value or total compensation | | | Total equity award adjustments | | | | | | | | ($) | | | | ($) | | | | ($) | | | | ($) | | | | ($) | | | | ($) | | | | ($) | | | 2026 | | CEO | | | 1,222,525 | | | | 55,721 | | | | - | | | | (80,698 | ) | | | (269,138 | ) | | | - | | | | 928,410 | | | | | Other NEOs | | | 173,978 | | | | 1,387 | | | | - | | | | (11,781 | ) | | | (103,975 | ) | | | | | | | 59,609 | |
|
|
|
|
|
| Non-PEO NEO Average Total Compensation Amount |
[1] |
$ 936,024
|
705,987
|
567,507
|
538,642
|
577,484
|
| Non-PEO NEO Average Compensation Actually Paid Amount |
[2] |
$ 620,374
|
97,258
|
617,865
|
462,562
|
244,027
|
| Adjustment to Non-PEO NEO Compensation Footnote |
|
| (2) | SEC
rules require certain adjustments be made to the Summary Compensation Table totals to determine compensation “actually paid”
as reported in the Pay versus Performance table. The following table details these adjustments: |
Year | | | Executives | | Summary Compensation Table Total | | | Deduct Reported Change in Actuarial Present Value of Pension Benefits | | | Add Pension Benefit Adjustments(a) | | | Deduct Reported Value of Equity Awards | | | Add Equity Award Adjustments(b) | | | Compensation Actually Paid | | | | | | | | ($) | | | ($) | | | ($) | | | ($) | | | ($) | | | ($) | | | 2026 | | | CEO | | | 1,856,877 | | | | - | | | | - | | | | (1,162,088 | ) | | | 928,410 | | | | 1,623,199 | | | | | | Other NEOs | | | 936,024 | | | | (111,346 | ) | | | 25,507 | | | | (289,420 | ) | | | 59,609 | | | | 620,374 | |
| (a) | SEC
rules require certain adjustments be made to pension compensation totals to determine CAP. The following table details these adjustments: |
| Year | | | Executives | | Service Cost (i) | | | Prior Service Cost (ii) | | | Total Pension Value Adjustment | | | | | | | | ($) | | | ($) | | | ($) | | | 2026 | | | CEO | | | - | | | | - | | | | - | | | | | | Other NEOs | | | 25,507 | | | | - | | | | 25,507 | |
| (b) | SEC
rules require certain adjustments be made to equity award totals to determine CAP. The following table details these adjustments: |
| Year | | Executive | | Year end fair value of equity awards granted during the year | | | Year over year change in fair value of outstanding and unvested equity awards | | | Fair value as of vesting date of equity awards granted and vested in the year | | | Year over year change in fair value of equity awards granted in prior years that vested in the year | | | Fair value at the end of the prior year of equity awards that failed to meet vesting conditions in the year | | | Value of dividends or other earnings paid on stock or option awards not otherwise reflected in fair value or total compensation | | | Total equity award adjustments | | | | | | | | ($) | | | | ($) | | | | ($) | | | | ($) | | | | ($) | | | | ($) | | | | ($) | | | 2026 | | CEO | | | 1,222,525 | | | | 55,721 | | | | - | | | | (80,698 | ) | | | (269,138 | ) | | | - | | | | 928,410 | | | | | Other NEOs | | | 173,978 | | | | 1,387 | | | | - | | | | (11,781 | ) | | | (103,975 | ) | | | | | | | 59,609 | |
|
|
|
|
|
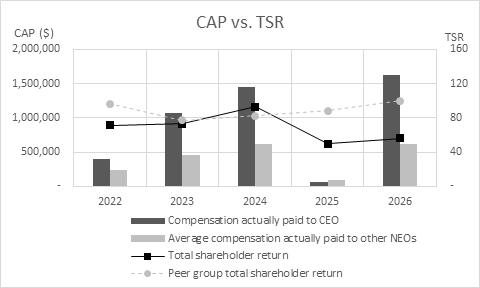
| Compensation Actually Paid vs. Total Shareholder Return |
|
CAP
versus the Company’s TSR and peer group’s TSR
|
|
|
|
|
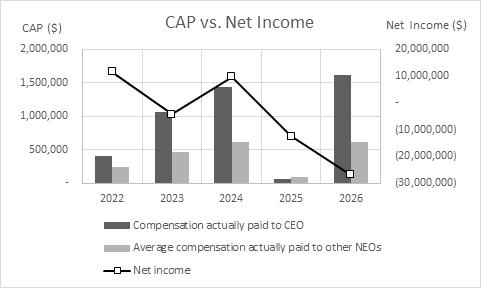
| Compensation Actually Paid vs. Net Income |
|
CAP versus Net Income
|
|
|
|
|
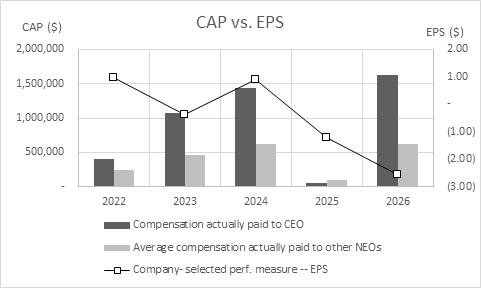
| Compensation Actually Paid vs. Company Selected Measure |
|
CAP versus Company-selected Measure (EPS)
|
|
|
|
|
| Total Shareholder Return Vs Peer Group |
|
| (3) | Total
shareholder return (TSR) is determined based on the value of an initial fixed investment of $100 at the beginning of the 2022 fiscal
year. The peer group TSR prepared by Zacks Investment Research, Inc. represents cumulative, weighted TSR of the peer group under Standard
Industrial Classification (SIC) Codes 2510 and 2511, which includes home furnishings companies that are publicly traded in the United
States or Canada. For more information regarding the peer group TSR, refer to the performance graph that is included in the 2026 Form
10-K, as filed with the SEC. |
|
|
|
|
|
| Tabular List, Table |
|
Company
Financial Performance Measures
The
items listed below represent the most important metrics used to determine CAP for fiscal year 2026 as further described in the Compensation
Discussion and Analysis on page 17.
| Most Important Performance Measures | | Consolidated net income | | Earnings per share (“EPS”) | | Absolute EPS growth | | Relative EPS growth |
|
|
|
|
|
| Total Shareholder Return Amount |
[3] |
$ 56.18
|
63.19
|
117.75
|
92.52
|
90.3
|
| Peer Group Total Shareholder Return Amount |
[3] |
99.88
|
109.27
|
102.3
|
95.2
|
119.43
|
| Net Income (Loss) |
|
$ (26,967,000)
|
$ (12,507,000)
|
$ 9,865,000
|
$ (4,312,000)
|
$ 11,718,000
|
| Company Selected Measure Amount |
|
(2.54)
|
(1.19)
|
0.91
|
(0.37)
|
0.97
|
| PEO Name |
|
Jeremy R. Hoff
|
Jeremy R. Hoff
|
Jeremy R. Hoff
|
Jeremy R. Hoff
|
Jeremy R. Hoff
|
| Measure:: 1 |
|
|
|
|
|
|
| Pay vs Performance Disclosure |
|
|
|
|
|
|
| Name |
|
Consolidated net income
|
|
|
|
|
| Measure:: 2 |
|
|
|
|
|
|
| Pay vs Performance Disclosure |
|
|
|
|
|
|
| Name |
|
Earnings per share (“EPS”)
|
|
|
|
|
| Measure:: 3 |
|
|
|
|
|
|
| Pay vs Performance Disclosure |
|
|
|
|
|
|
| Name |
|
Absolute EPS growth
|
|
|
|
|
| Measure:: 4 |
|
|
|
|
|
|
| Pay vs Performance Disclosure |
|
|
|
|
|
|
| Name |
|
Relative EPS growth
|
|
|
|
|
| PEO | Aggregate Pension Adjustments Service Cost |
|
|
|
|
|
|
| Pay vs Performance Disclosure |
|
|
|
|
|
|
| Adjustment to Compensation, Amount |
|
$ 0
|
|
|
|
|
| PEO | Pension Adjustments Service Cost |
|
|
|
|
|
|
| Pay vs Performance Disclosure |
|
|
|
|
|
|
| Adjustment to Compensation, Amount |
|
0
|
|
|
|
|
| PEO | Pension Adjustments Prior Service Cost |
|
|
|
|
|
|
| Pay vs Performance Disclosure |
|
|
|
|
|
|
| Adjustment to Compensation, Amount |
|
0
|
|
|
|
|
| PEO | Year-end Fair Value of Equity Awards Granted in Covered Year that are Outstanding and Unvested |
|
|
|
|
|
|
| Pay vs Performance Disclosure |
|
|
|
|
|
|
| Adjustment to Compensation, Amount |
|
1,222,525
|
|
|
|
|
| PEO | Vesting Date Fair Value of Equity Awards Granted and Vested in Covered Year |
|
|
|
|
|
|
| Pay vs Performance Disclosure |
|
|
|
|
|
|
| Adjustment to Compensation, Amount |
|
0
|
|
|
|
|
| PEO | Change in Fair Value as of Vesting Date of Prior Year Equity Awards Vested in Covered Year |
|
|
|
|
|
|
| Pay vs Performance Disclosure |
|
|
|
|
|
|
| Adjustment to Compensation, Amount |
|
(80,698)
|
|
|
|
|
| PEO | Prior Year End Fair Value of Equity Awards Granted in Any Prior Year that Fail to Meet Applicable Vesting Conditions During Covered Year |
|
|
|
|
|
|
| Pay vs Performance Disclosure |
|
|
|
|
|
|
| Adjustment to Compensation, Amount |
|
(269,138)
|
|
|
|
|
| PEO | Dividends or Other Earnings Paid on Equity Awards not Otherwise Reflected in Total Compensation for Covered Year |
|
|
|
|
|
|
| Pay vs Performance Disclosure |
|
|
|
|
|
|
| Adjustment to Compensation, Amount |
|
0
|
|
|
|
|
| PEO | Deduct Reported Change in Actuarial Present Value of Pension Benefits [Member] |
|
|
|
|
|
|
| Pay vs Performance Disclosure |
|
|
|
|
|
|
| Adjustment to Compensation, Amount |
|
0
|
|
|
|
|
| PEO | Add Pension Benefit Adjustments [Member] |
|
|
|
|
|
|
| Pay vs Performance Disclosure |
|
|
|
|
|
|
| Adjustment to Compensation, Amount |
[4] |
0
|
|
|
|
|
| PEO | Deduct Reported Value of Equity Awards [Member] |
|
|
|
|
|
|
| Pay vs Performance Disclosure |
|
|
|
|
|
|
| Adjustment to Compensation, Amount |
|
(1,162,088)
|
|
|
|
|
| PEO | Add Equity Award Adjustments [Member] |
|
|
|
|
|
|
| Pay vs Performance Disclosure |
|
|
|
|
|
|
| Adjustment to Compensation, Amount |
[5] |
928,410
|
|
|
|
|
| PEO | Year over year change in fair value of outstanding and unvested equity awards [Member] |
|
|
|
|
|
|
| Pay vs Performance Disclosure |
|
|
|
|
|
|
| Adjustment to Compensation, Amount |
|
55,721
|
|
|
|
|
| Non-PEO NEO | Aggregate Pension Adjustments Service Cost |
|
|
|
|
|
|
| Pay vs Performance Disclosure |
|
|
|
|
|
|
| Adjustment to Compensation, Amount |
|
25,507
|
|
|
|
|
| Non-PEO NEO | Pension Adjustments Service Cost |
|
|
|
|
|
|
| Pay vs Performance Disclosure |
|
|
|
|
|
|
| Adjustment to Compensation, Amount |
|
25,507
|
|
|
|
|
| Non-PEO NEO | Pension Adjustments Prior Service Cost |
|
|
|
|
|
|
| Pay vs Performance Disclosure |
|
|
|
|
|
|
| Adjustment to Compensation, Amount |
|
0
|
|
|
|
|
| Non-PEO NEO | Year-end Fair Value of Equity Awards Granted in Covered Year that are Outstanding and Unvested |
|
|
|
|
|
|
| Pay vs Performance Disclosure |
|
|
|
|
|
|
| Adjustment to Compensation, Amount |
|
173,978
|
|
|
|
|
| Non-PEO NEO | Vesting Date Fair Value of Equity Awards Granted and Vested in Covered Year |
|
|
|
|
|
|
| Pay vs Performance Disclosure |
|
|
|
|
|
|
| Adjustment to Compensation, Amount |
|
0
|
|
|
|
|
| Non-PEO NEO | Change in Fair Value as of Vesting Date of Prior Year Equity Awards Vested in Covered Year |
|
|
|
|
|
|
| Pay vs Performance Disclosure |
|
|
|
|
|
|
| Adjustment to Compensation, Amount |
|
(11,781)
|
|
|
|
|
| Non-PEO NEO | Prior Year End Fair Value of Equity Awards Granted in Any Prior Year that Fail to Meet Applicable Vesting Conditions During Covered Year |
|
|
|
|
|
|
| Pay vs Performance Disclosure |
|
|
|
|
|
|
| Adjustment to Compensation, Amount |
|
(103,975)
|
|
|
|
|
| Non-PEO NEO | Deduct Reported Change in Actuarial Present Value of Pension Benefits [Member] |
|
|
|
|
|
|
| Pay vs Performance Disclosure |
|
|
|
|
|
|
| Adjustment to Compensation, Amount |
|
(111,346)
|
|
|
|
|
| Non-PEO NEO | Add Pension Benefit Adjustments [Member] |
|
|
|
|
|
|
| Pay vs Performance Disclosure |
|
|
|
|
|
|
| Adjustment to Compensation, Amount |
[4] |
25,507
|
|
|
|
|
| Non-PEO NEO | Deduct Reported Value of Equity Awards [Member] |
|
|
|
|
|
|
| Pay vs Performance Disclosure |
|
|
|
|
|
|
| Adjustment to Compensation, Amount |
|
(289,420)
|
|
|
|
|
| Non-PEO NEO | Add Equity Award Adjustments [Member] |
|
|
|
|
|
|
| Pay vs Performance Disclosure |
|
|
|
|
|
|
| Adjustment to Compensation, Amount |
[5] |
59,609
|
|
|
|
|
| Non-PEO NEO | Year over year change in fair value of outstanding and unvested equity awards [Member] |
|
|
|
|
|
|
| Pay vs Performance Disclosure |
|
|
|
|
|
|
| Adjustment to Compensation, Amount |
|
$ 1,387
|
|
|
|
|
|
|