Pay vs Performance Disclosure - USD ($)
Dec. 31, 2025
Dec. 31, 2024
Dec. 31, 2023
Dec. 31, 2022
Dec. 31, 2021
| Pay Versus Performance Table | ||||||||||||||||||||||||||||||||
Summary Compensation Table Total for PEO(1) | Compensation Actually Paid to PEO | Average Summary Compensation Table Total for Non-PEO Named Executive Officers(1) | Average Compensation Actually Paid to Non-PEO Named Executive Officers(2)(3) | Value of initial fixed $100 investment based on: | Net Income (Loss) (In thousands) | Adjusted EBITDA (In thousands)(5) | ||||||||||||||||||||||||||
| Year | Total Shareholder Return | Peer Group Total Shareholder Return (ICLN)(4) | Peer Group Total Shareholder Return (VDE)(4) | Peer Group Total Shareholder Return (XLE)(4) | ||||||||||||||||||||||||||||
| (a) | (b) | (c) | (d) | (e) | (f) | (g) | (g) | (g) | (h) | (i) | ||||||||||||||||||||||
| 2025 | $ | 5,000,000 | $ | 5,000,000 | $ | 4,061,939 | $ | 3,436,241 | $ | 2.40 | $ | 62.36 | $ | 290.80 | $ | 284.68 | $ | (1,831,953) | $ | 219,717 | ||||||||||||
| 2024 | — | — | 8,518,509 | 16,716,406 | 31.86 | 42.41 | 271.59 | 263.89 | (244,537) | 939,278 | ||||||||||||||||||||||
| 2023 | — | — | 4,087,514 | 1,550,000 | 78.90 | 57.10 | 254.41 | 250.08 | 548,224 | 1,122,859 | ||||||||||||||||||||||
| 2022 | — | — | 2,260,943 | 3,402,381 | 80.88 | 71.72 | 254.40 | 251.70 | 184,786 | 1,071,309 | ||||||||||||||||||||||
| 2021 | — | — | 1,736,742 | 3,801,911 | 45.58 | 75.82 | 156.21 | 153.31 | 92,711 | 604,560 | ||||||||||||||||||||||
For all five years shown in the table, our principal executive officer (“PEO”) was Mr. Edens. For 2021-2023, our non-PEO named executive officers were Mr. Guinta and Ms. Shin. For 2024, our non-PEO named executive officers were Mr. Guinta, Ms. Shin and Mr. Dete. For 2025, our non-PEO named executive officers were Mr. Guinta, Mr. Lowe and Ms. Shin.
The amounts in the following table represent each of the average amounts deducted and added to the equity award values for our non-PEO named executive officers for 2025 for purposes of computing the average “compensation actually paid” for our non-PEO named executive officers for 2025:
| Year | Average Summary Compensation Table Total for Non-PEO Named Executive Officers | Minus Average Grant Date Fair Value of Equity Awards Granted During Applicable Year | Plus Average Year-End Fair Value of Equity Awards Granted During Applicable Year | Plus Average Change in Fair Value as of Year-End of Any Prior Year Awards that Remain Unvested as of Year-End | Plus Average Change in Fair Value as of the Vesting Date of Any Prior Year Awards that Vested During Applicable Year | Less Fair Value of Prior Year Awards Forfeited During the Applicable Year | Equals Average Compensation Actually Paid to Non-PEO Named Executive Officer | ||||||||||||||||
| 2025 | $ | 4,061,939 | $ | — | $ | — | $ | (243,285) | $ | 84,538 | $ | (466,951) | $ | 3,436,241 | |||||||||
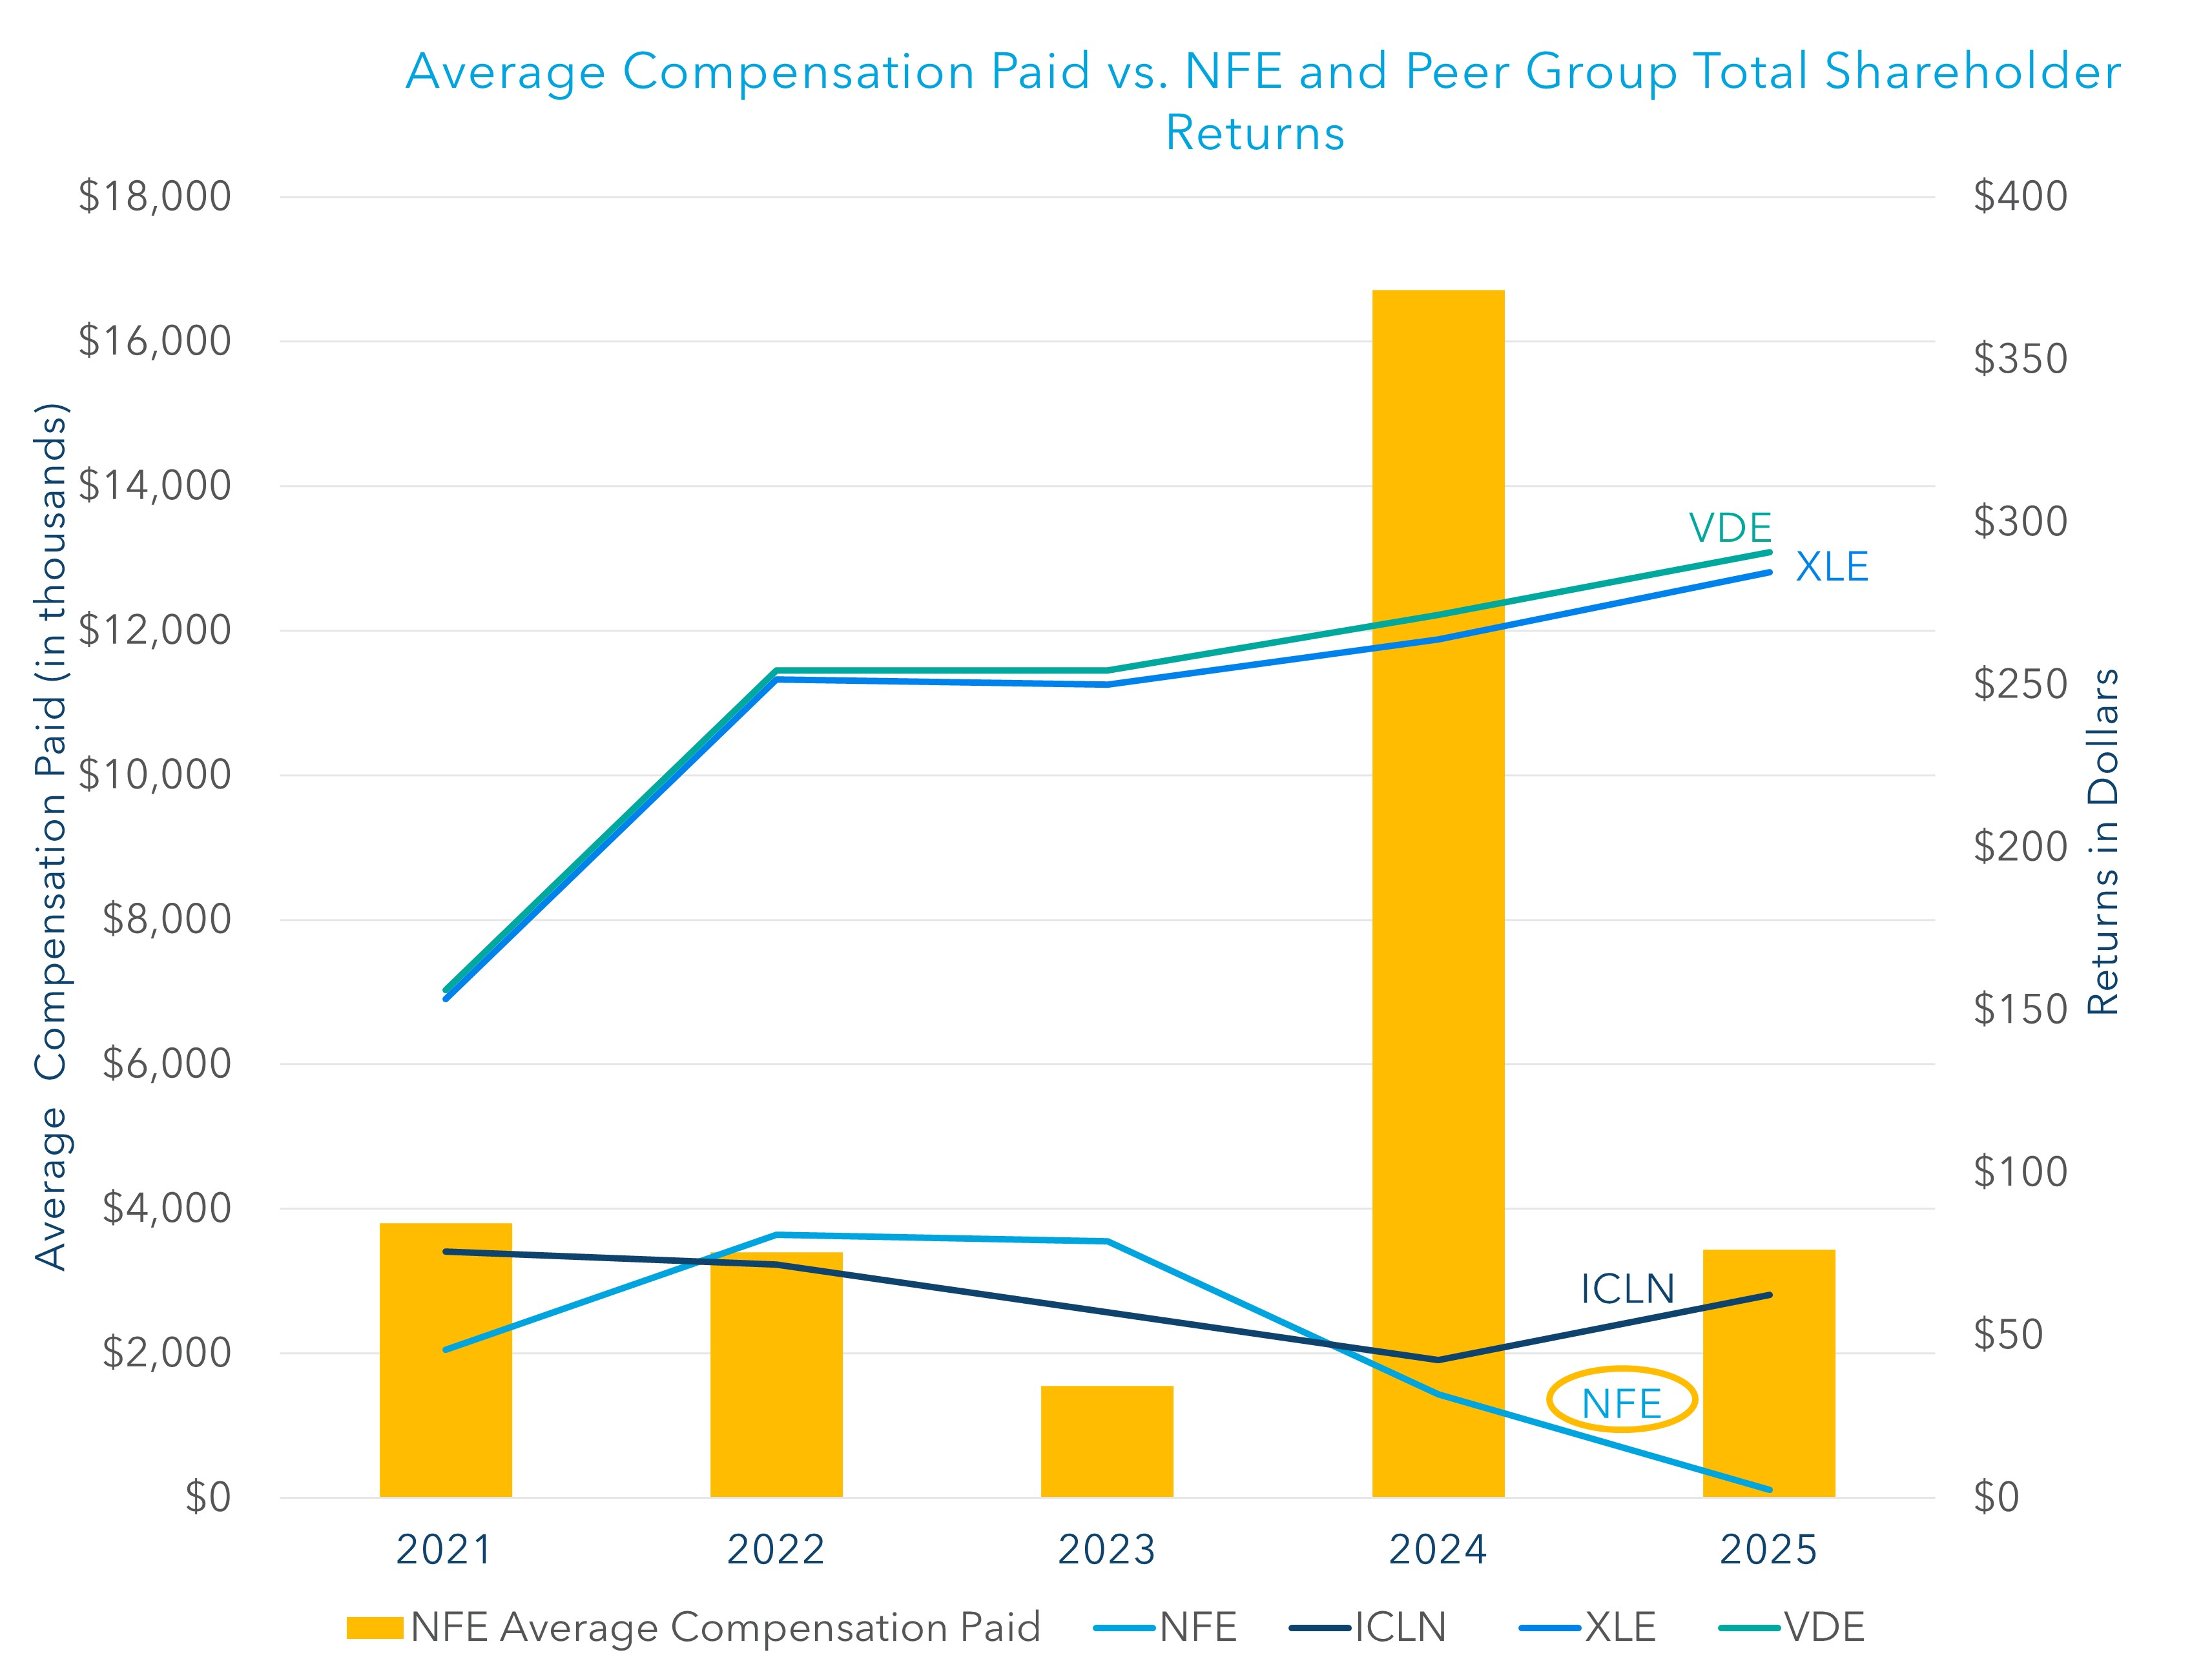
The graph below sets out the relationship between (x) the Company’s TSR and (y) the peer group TSR, calculated using each of iShared Global Clean Energy ETF Index ("ICLN"), Vanguard Energy ETF ("VDE") and Energy Select Sector (SPDR) Fund ("XLE"), as well as the relationship between (x) the average “Compensation Actually Paid” to our non-PEO named executive officers and (z) the Company’s TSR. The only year in which we had “Compensation Actually Paid” to our CEO was 2025, for a total of $5,000,000.
The graph below sets out the relationship between (x) the average “Compensation Actually Paid” to our non-PEO named executive officers and (y) the Company’s Adjusted EBITDA and net income (loss). The only year in which we had “Compensation Actually Paid” to our CEO was 2025, for a total of $5,000,000.
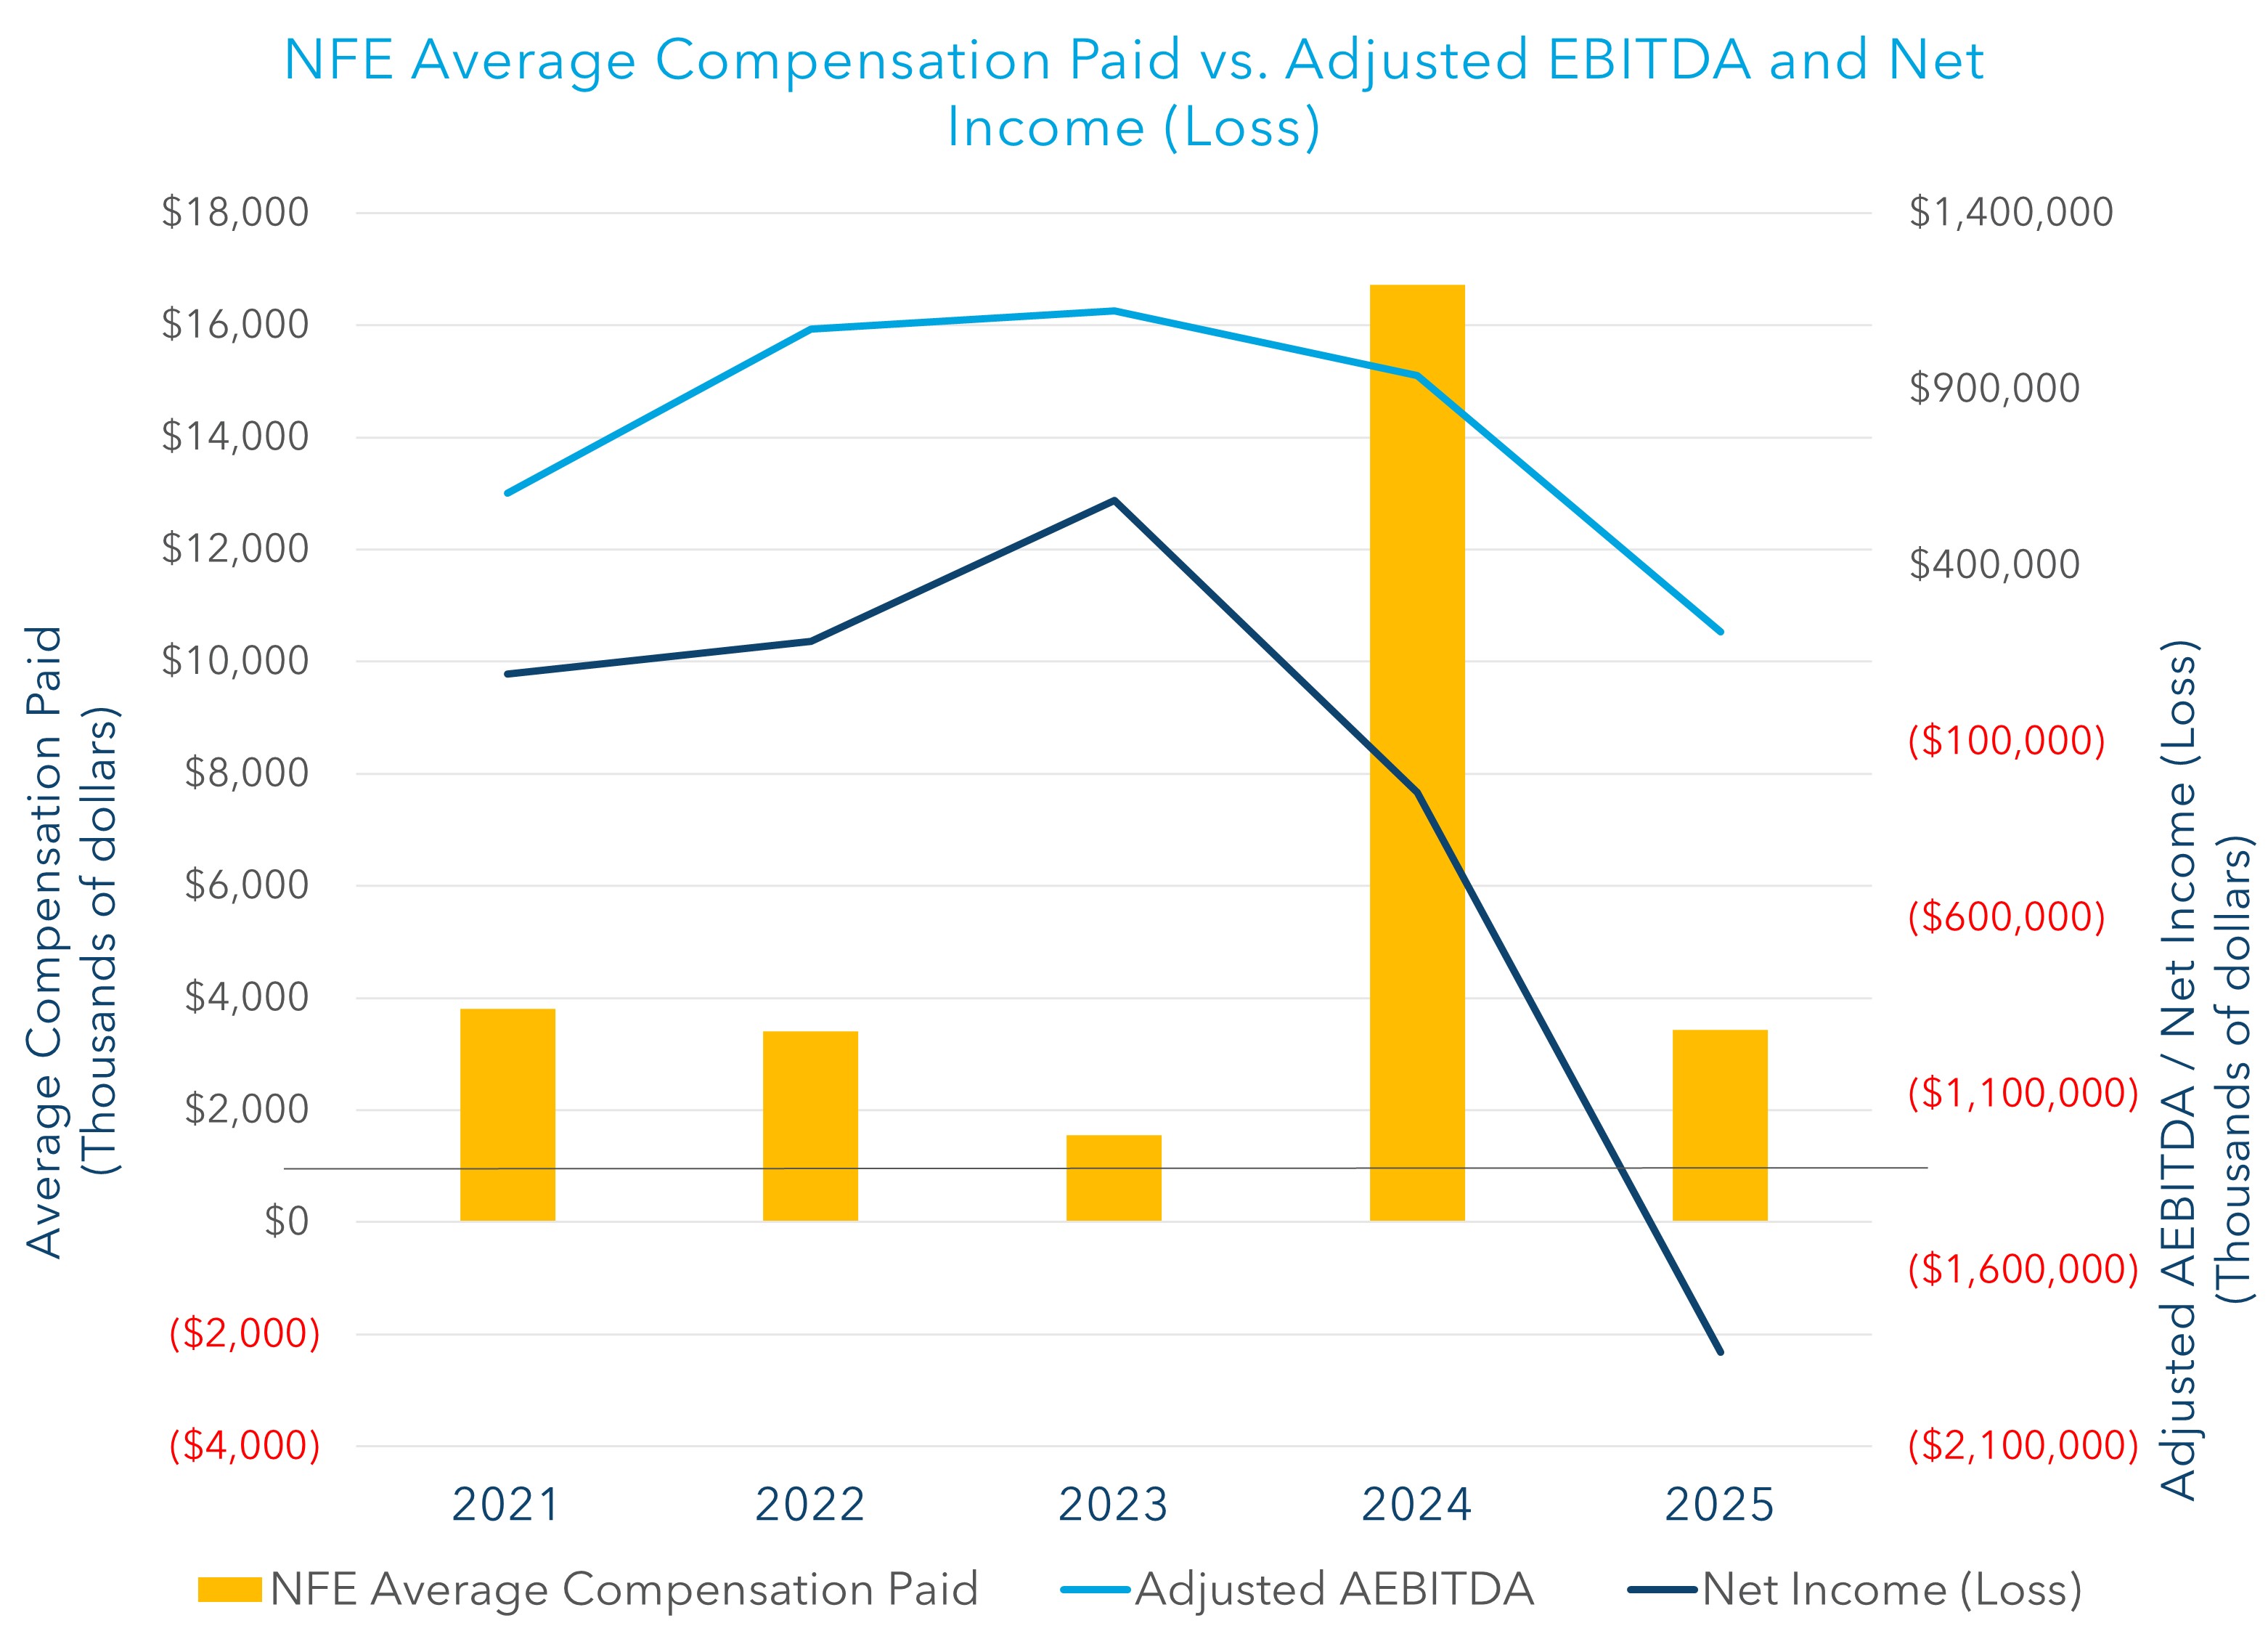
The graph below sets out the relationship between (x) the average “Compensation Actually Paid” to our non-PEO named executive officers and (y) the Company’s Adjusted EBITDA and net income (loss). The only year in which we had “Compensation Actually Paid” to our CEO was 2025, for a total of $5,000,000.
The graph below sets out the relationship between (x) the Company’s TSR and (y) the peer group TSR, calculated using each of iShared Global Clean Energy ETF Index ("ICLN"), Vanguard Energy ETF ("VDE") and Energy Select Sector (SPDR) Fund ("XLE"), as well as the relationship between (x) the average “Compensation Actually Paid” to our non-PEO named executive officers and (z) the Company’s TSR. The only year in which we had “Compensation Actually Paid” to our CEO was 2025, for a total of $5,000,000.
| Most Important Performance Measures | |||||
Adjusted EBITDA(1) | |||||
| Net Income | |||||
RSU grant date fair values are calculated using stock price as of the grant date, as adjusted for a post-vesting holding period. Adjustments have been made using the stock price as of year-end and as of each vesting date.
Net Income (Loss) for the years ended December 31, 2024 and 2023 was restated as reported in the Company's Annual Report in Form 10-K filed with the SEC on April 13, 2026, and accordingly Adjusted EBITDA for those years was recalculated based on the restated financial statements.
Adjusted EBITDA is calculated as net income, plus transaction and integration costs, contract termination charges and loss on mitigation sales, depreciation and amortization, asset impairment expense, loss on asset sales, interest expense, net, other (income) expense, net, loss on extinguishment of debt, changes in fair value of non-hedge derivative instruments and contingent consideration, tax expense, and adjusting for certain items from our selling, general and administrative expenses (“SG&A") not otherwise indicative of ongoing operating performance, including non-cash share-based compensation and severance expenses, non-capitalizable development expenses, cost to pursue new business opportunities, expenses associated with changes to our corporate structure and certain non-capitalizable contract acquisition costs, plus our pro rata share of Adjusted EBITDA from unconsolidated entities, less the impact of equity in earnings (losses) of unconsolidated entities and gains from sale of assets. Adjusted EBITDA is mathematically equivalent to our Total Segment Operating Margin, as reported in the segment disclosures within our financial statements, minus Core SG&A, including our pro rata share of such expenses of unconsolidated entities, minus deferred earnings for which a prepayment has been received. Core SG&A is defined as total SG&A adjusted for non-cash share-based compensation and severance expense, non-capitalizable development expenses, cost of exploring new business opportunities and expenses associated with changes to our corporate structure. Core SG&A excludes certain items from our SG&A not otherwise indicative of ongoing operating performance.
We calculate Adjusted EBITDA for the applicable year as net income, plus transaction and integration costs, contract termination charges and loss on mitigation sales, depreciation and amortization, asset impairment expense, loss on asset sales, interest expense, net, other (income) expense, net, loss on extinguishment of debt, changes in fair value of non-hedge derivative instruments and contingent consideration, tax expense, and adjusting for certain items from our SG&A not otherwise indicative of ongoing operating performance, including non-cash share-based compensation and severance expense, non-capitalizable development expenses, cost to pursue new business opportunities, expenses associated with changes to our corporate structure and certain non-capitalizable contract acquisition costs, plus our pro rata share of Adjusted EBITDA from unconsolidated entities, less the impact of equity in earnings (losses) of unconsolidated entities and gains from sales of assets.
Adjusted EBITDA is mathematically equivalent to our Total Segment Operating Margin, as reported in the segment disclosures within our financial statements, minus Core SG&A, including our pro rata share of such expenses of unconsolidated entities, minus deferred earnings for which a prepayment was received. Core SG&A is defined as total SG&A adjusted for non-cash share-based compensation and severance expenses, non-capitalizable development expenses, cost of exploring new business opportunities and expenses associated with changes to our corporate structure. Core SG&A excludes certain items from our SG&A not otherwise indicative of ongoing operating performance.