Shareholder Report
Feb. 28, 2026
USD ($)
$ / shares
WHAT WERE THE FUND COSTS FOR THE PAST YEAR? (based on a hypothetical $10,000 investment)
|
Fund Name
|
Costs of a $10,000 investment
|
Costs paid as a percentage of a $10,000 investment
|
|
U.S. Diversified Real Estate ETF
|
$53
|
0.53%
|
HOW DID THE FUND PERFORM LAST YEAR AND WHAT AFFECTED ITS PERFORMANCE?
The U.S. Diversified Real Estate ETF (the “Fund”) seeks to track the total return performance, before fees and expenses, of the USREX - U.S. Diversified Real Estate Index (the “Index”). The Index is a passive, rules-based strategy index of U.S. real estate equity that selects companies using proprietary factors that take into account property type, property values, leverage, and location data.
Performance during the fiscal period occurred in an environment characterized by interest rates that remained relatively high by historical standards and a reassessment by markets of the timing and magnitude of potential policy easing. These conditions affected real estate valuations and capital availability broadly and contributed to varied outcomes across property types. Within this context, certain healthcare oriented holdings, including Welltower, Inc. and several of the Fund’s strongest performers, benefited from comparatively stable demand characteristics and operating fundamentals, which contributed positively to results. Prologis, Inc.’s performance was influenced by continued utilization of logistics and distribution assets, while Digital Realty Trust, Inc.’s results reflected ongoing demand for data related infrastructure. Conversely, holdings with greater exposure to office and life science properties, such as Alexandria Real Estate Equities, Inc. and SL Green Realty Corporation, were influenced by capital markets sensitivity and evolving space use trends, which weighed on returns. Residential and specialized holdings, including AvalonBay Communities, Inc., Americold, and Easterly Government Properties, Inc., were also affected by financing conditions and property specific factors.
|
Top Contributors
|
|
|
↑
|
Welltower Inc.
|
|
↑
|
Prologis, Inc.
|
|
↑
|
Digital Realty Trust, Inc.
|
|
Top Detractors
|
|
|
↓
|
Alexandria Real Estate Equities, Inc.
|
|
↓
|
AvalonBay Communities, Inc.
|
|
↓
|
Easterly Government Properties, Inc.
|
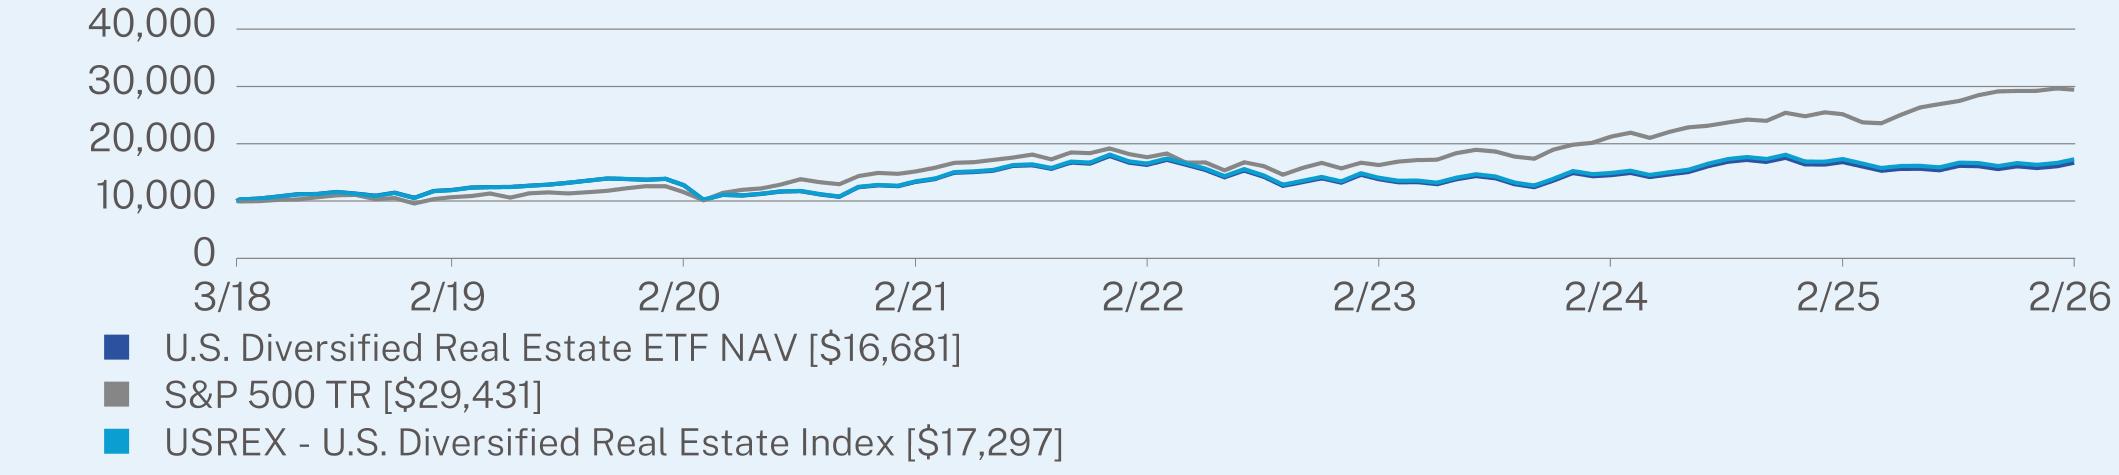
ANNUAL AVERAGE TOTAL RETURN (%)
|
|
1 Year
|
5 Year
|
Since Inception
(03/26/2018) |
|
U.S. Diversified Real Estate ETF NAV
|
-0.71
|
4.56
|
6.67
|
|
S&P 500 TR
|
16.99
|
14.19
|
14.58
|
|
USREX - U.S. Diversified Real Estate Index
|
-0.19
|
5.18
|
7.16
|
Visit https://videntam.com/etf/us-diversified-real-estate-etf/ for more recent performance information.
KEY FUND STATISTICS (as of February 28, 2026)
|
Net Assets
|
$25,479,951
|
|
Number of Holdings
|
88
|
|
Net Advisory Fee
|
$196,583
|
|
Portfolio Turnover
|
13%
|
|
30-Day SEC Yield
|
3.61%
|
|
30-Day SEC Yield Unsubsidized
|
3.61%
|
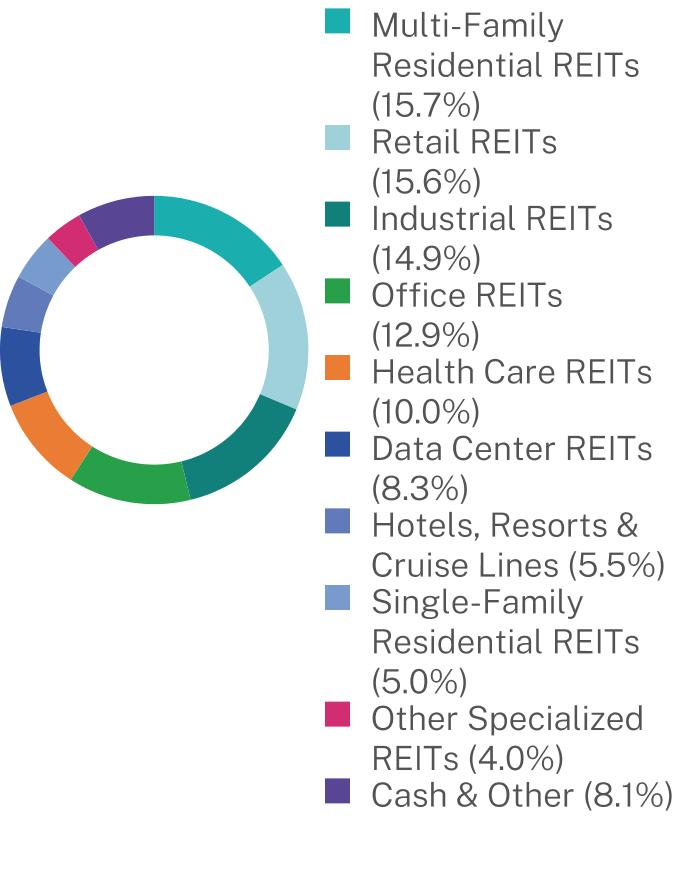
WHAT DID THE FUND INVEST IN? (as of February 28, 2026)
|
Top 10 Issuers
|
(% of Net Assets)
|
|
Equinix, Inc.
|
4.6%
|
|
Prologis, Inc.
|
4.2%
|
|
Four Corners Property Trust, Inc.
|
4.0%
|
|
Digital Realty Trust, Inc.
|
3.6%
|
|
AvalonBay Communities, Inc.
|
3.6%
|
|
Welltower, Inc.
|
3.0%
|
|
Equity Residential
|
2.9%
|
|
Simon Property Group, Inc.
|
2.8%
|
|
Terreno Realty Corp.
|
2.7%
|
|
Kilroy Realty Corp.
|
2.5%
|
Industry Breakdown (% of Net Assets)