Exhibit (e)

Combined Management Report
Exhibit (e)
Combined Management Report
Financial Report > Combined Management Report
The figures in tables were calculated exactly and added up.
Figures presented may not add to totals because of independent rounding.
Actual zero amounts and amounts rounded to zero are presented as EUR 0 million.
2
KfW Financial Report 2025
Financial Report > Combined Management Report > Basic information on KfW Group
Basic information on KfW Group
The KfW management report is combined with the group’s management report in accordance with Section 315 (5) in conjunction with Section 298 (2) of the German Commercial Code (Handelsgesetzbuch – “HGB”). The combined management report is included in the KfW Group financial report and is submitted to the German Company Register for publication.
The KfW annual financial statements prepared in accordance with HGB and the group financial report are also available online at www.kfw.de.
Information on KfW as the parent company can be found under a separate section, “Notes to the KfW annual financial statements prepared in accordance with the German Commercial Code”.
The KfW consolidated financial statements were prepared in accordance with the provisions of Section 315e HGB in conjunction with the International Financial Reporting Standards (IFRS) as applicable within the European Union. With the exception of the HGB information in the section “Notes to the KfW annual financial statements prepared in accordance with HGB”, all financial figures in this combined management report, including the comparative figures for the previous year, are reported in accordance with IFRS.
KfW is a promotional bank of the Federal Republic of Germany in the legal form of a public law institution. The Federal Government owns 80% of KfW’s share capital, 33% of which are attributable to the ERP Special Fund (ERP-Sondervermögen). The German federal states own the remaining 20%. KfW is subject to the Law Concerning KfW (KfW-Gesetz – “KfW Law”), which defines its functions and sets out the requirements for KfW’s operating activities. This set of functions is defined in Article 2 of the KfW Law and represents the implementation of Understanding II, which was reached with the European Commission. KfW’s functions include the carrying out of promotional business, related transactions and mandated transactions. Because of its special business model, comparing KfW with commercial banks is possible only to a very limited extent.
KfW’s primary and core statutory objective is its promotional business, in accordance with Article 2 (1) of the KfW Law. It consists of promotional measures, particularly in the form of financing for SMEs, the professions and business start-ups, venture capital, housing, environmental protection, infrastructure, technical progress and innovation, internationally agreed promotional programmes and development cooperation (Article 2 (1) no. 1 of the KfW Law). The promotional business also involves financing regional and local authorities and special-purpose associations under public law (öffentlich-rechtliche Zweckverbände), measures with purely social objectives and for the promotion of education. Moreover, project financing is part of KfW’s promotional business, insofar as it is co-financed by European financing institutions in the interest of the European community, as is export financing outside the European Union (“EU”)/European Economic Area (“EEA”) or in countries with official status as candidates for EU accession, provided that such funding is carried out on a syndicated basis or that there is insufficient financing available in the relevant countries (Article 2 (1) nos. 2 to 4 of the KfW Law). KfW’s promotional business is conducted pursuant to a state mandate in accordance with Article 2 (1) no. 1 of the KfW Law. KfW is entitled to conduct other business pursuant to Article 2 (1) nos. 2 to 4, and in particular Article 2 (3) of the KfW Law also under its own responsibility.
A significant portion of promotion, particularly in the areas of SMEs, start-ups, venture capital, technical progress and innovation, is covered by European Recovery Program (“ERP”) promotion carried out by KfW. The ERP Special Fund contributed funds to KfW’s equity, which was recognised under the Capital reserve as ERP promotional reserves. ERP promotion is executed based on the approaches in the annual ERP Economic Planning Acts (ERP-Wirtschaftsplangesetz). The ERP Special Fund is the largest shareholder based on KfW’s total capital ratio, due to the contribution of ERP promotional reserves.
3
KfW Financial Report 2025
Financial Report > Combined Management Report > Basic information on KfW Group
Where these operations are directly related to the fulfilment of its promotional tasks, KfW may also conduct additional transactions in accordance with Article 2 (3) of the KfW Law (related transactions). These include strategic equity investments at KfW’s own risk, KfW’s refinancing and treasury management measures as well as refinancing of KfW IPEX-Bank GmbH (“KfW IPEX-Bank”) in line with market conditions. KfW may engage in other transactions only to the extent that these are expressly mandated by the German Federal Government on a case-by-case basis if there is a public interest in accordance with Article 2 (4) of the KfW Law (mandated transactions). Pursuant to Article 2 (3) sentence 3 of the KfW Law, KfW is expressly prohibited from engaging in financial commission business and deposit business with the general public. It therefore refinances its lending business via the capital markets, primarily by issuing bonds.
In structuring its business activities, KfW follows the principle of subsidiarity and functions as a countercyclical bank offering structure and stability. It is therefore primarily active in the areas where market mechanisms alone would lead to socially or economically disadvantageous results. KfW’s offering is designed to avoid distorting the market. Generating profit is merely a secondary objective. KfW’s business model as a promotional bank without a primary profit-making objective and without a trading book is a key factor in its fundamentally conservative risk culture.
In accordance with the retention requirement (Article10 (1) of the KfW Law), there is no distribution of net profit to KfW shareholders. The annual net profit resulting after depreciation, amortisation and provisions is allocated to a statutory reserve. These funds are available to strengthen the binding regulatory capital ratios and can be re-deployed for promotional purposes subject to these ratios being met. The funds, therefore, remain in the promotional cycle.
In carrying out its transactions, KfW is subject to the requirement of competitive neutrality in cooperating with commercial banks. The remit as defined in the KfW Law in implementation of Understanding II reached with the European Commission ensures that KfW does not enter into significant competition with commercial banks. An on-lending principle is generally applied in the core domestic promotional business areas (Article 3 (1) of the KfW Law). Derogations therefrom may be made with approval of the Board of Supervisory Directors. The on-lending principle means that credit institutions or other financing institutions are involved in granting financing, enabling final borrowers to receive KfW loans in the legal form of loans from their own primary bank, which in turn refinances such operations via KfW. Therefore, KfW does not need to operate a branch network to sell its products. The on-lending principle applies exclusively in the promotional areas pursuant to Article 2 (1) no. 1 a) to f) of the KfW Law, with the particular exception of financing for municipalities, for purely social purposes and for education.
Funding on the money and capital markets has a material impact on the group’s business activities. KfW’s creditworthiness, which is assessed by rating agencies, is key to its funding conditions. Based on what is referred to as institutional liability (Anstaltslast), the Federal Republic of Germany is obligated to safeguard or maintain KfW’s economic basis, thereby ensuring KfW’s ability to function. In addition to institutional liability, it is necessary to mention the comprehensive liability of the German Federal Government under Article 1a of the KfW Law, which extends to loans taken out and bonds issued by KfW, forward transactions structured as fixed transactions, the rights conferred by options and other loans to KfW, and loans to third parties insofar as they are expressly guaranteed by KfW.
The guarantee of the Federal Republic pursuant to Article 1a of the KfW Law along with the ownership structure result in KfW’s classification as a “public sector entity” in accordance with Article 4 (1) no. 8 CRR. This makes it possible to use the exemption under Article 116 (4) CRR, by which creditors of exposures to KfW can apply a risk weight of 0% to an instrument covered by the federal guarantee.
KfW is subject to legal supervision by the Federal Government exercised by the Federal Ministry of Finance in consultation with the Federal Ministry for Economic Affairs and Energy. As a public-law institution, KfW is subject to regular audits by the Federal Audit Office. With regard to compliance with the applicable provisions of banking supervisory law applicable in accordance with the KfW Regulation, KfW is subject to supervision by the
4
KfW Financial Report 2025
Financial Report > Combined Management Report > Basic information on KfW Group
German Federal Financial Supervisory Authority (Bundesanstalt für Finanzdienstleistungsaufsicht – “BaFin”) and the Bundesbank. However, KfW is neither a credit institution nor a financial services institution within the meaning of the German Banking Act (Kreditwesengesetz, “KWG”) nor a credit institution within the meaning of CRD V.
The responsible bodies at KfW (the Board of Supervisory Directors and the Presidial and Nomination Committee) deal with the strategy documents, particularly the business strategy including strategic objectives, as well as the strategic guidelines and the group business sector planning, based on the KfW Law and KfW Bylaws. The legal supervisor is also regularly involved in dealing with the strategy documents and other important matters.
As the promotional bank of the Federal Republic of Germany and the federal states, KfW bears particular responsibility for the sustainable impacts of its financing activities. KfW’s business strategy and sustainability strategy are therefore closely aligned with one another. KfW plays a leading role with a particular view to the forward-looking transformation of the economy and the financial market towards greenhouse gas neutrality. KfW works in accordance with its broad statutory remit, with a primary focus on “climate and environment” and “digitalisation and innovation” in line with the guiding principle: “Boost competitiveness and resilience”. To ensure a sustainable impact, KfW endeavours to combine the economic, environmental and social dimensions of sustainability in all promotional areas.
As the promotional bank of the Federal Republic of Germany, KfW supports private individuals, businesses, municipalities, and developing countries and emerging economies with low-interest loans, grants and advisory services. In addition to promotional lending business, equity financing constitutes another key component of KfW’s promotional business. KfW primarily refinances its promotional activities through two sources, the most important being funds raised on the money and capital markets. In this context, KfW benefits from its triple A credit rating and the very favourable terms associated with it (market funds). Moreover, the Federal Government makes federal budget funds available to KfW, for instance in the context of promotion in development cooperation, which KfW passes on to the relevant customers. The business refinanced using budget funds is generally recognised as trust activities as it is conducted on behalf of the Federal Government. KfW also received funds from the government-owned Economic Stabilisation Fund (WSF) in addition to refinancing via market and budget funds for selected mandated transactions pursuant to Article 2 (4) of the KfW Law and following consultation with the Federal Government. There is the option of follow-on financing via the WSF.
KfW passes on its refinancing advantage to borrowers as part of the promotional lending business carried out under its statutory promotional mandate in accordance with Article 2 (1) No. 1 of the KfW Law. In the domestic business sectors, KfW also grants additional subsidies in the form of interest rate reductions affecting its own earnings position in certain programmes. These, along with other promotional contributions, such as incentives to on-lending banks to process microloans, constitute promotional expense. Moreover, KfW grants loans on behalf of the Federal Government, in domestic promotion in particular, in which the government makes budget funds available as earmarked promotional contributions in the form of interest rate reductions, repayment bonuses and/or assumption of risks for targeted promotion of political objectives. In addition, KfW awards grants on behalf of the Federal Government and using federal budget funds, primarily in domestic promotion and development cooperation. The specific structure of the promotional programmes is set out in special federal laws, policies and budgetary decisions. Transactions in which the Federal Republic of Germany has an interest can be carried out as mandated transactions in accordance with Article 2 (4) of the KfW Law.
KfW has equity, comprising share capital, the reserve from the ERP Special Fund, capital reserves and retained earnings. This equity is primarily for KfW’s promotional capacity, as it serves to hedge the risks generally associated with promotional activities and the banking business. Any profits generated are channelled into KfW’s reserves and thus also indirectly boost its promotional business.
5
KfW Financial Report 2025
Financial Report > Combined Management Report > Basic information on KfW Group
In line with its products and services, KfW Group is divided into the following business sectors: Mittelstandsbank & Private Kunden (SME Bank & Private Clients), Individualfinanzierung & Öffentliche Kunden (Customised Finance & Public Clients), KfW Capital, KfW Development Bank, DEG, Export and project finance, Financial markets and Head office, to which the main products and services are attributed as follows:
| Business sectors | Products/services | |||
| – Start-up financing | ||||
| – Financing of general corporate investments and investments | ||||
| Mittelstandsbank & Private Kunden | in innovation, energy and environmental protection | |||
| (SME Bank & Private Clients) | – Education financing | |||
| – Financing for housing construction, conversion and refurbishment | ||||
| – Financing of municipal and social infrastructure | ||||
| Individualfinanzierung & Öffentliche | – Customised corporate financing with equity and debt capital | |||
| Kunden | – Customised financing of banks and promotional institutions of the federal | |||
| (Customised Finance & Public Clients) | states | |||
| – Mandated transactions for energy suppliers (debt capital) | ||||
| KfW Capital | – Investments in German and European venture capital and venture debt funds | |||
| – Co-investments in start-ups (via special purpose vehicles) | ||||
| Export and project finance | – Financing of German and European export activities | |||
| – Financing of projects and investments which are of special interest | ||||
| for Germany and Europe | ||||
| KfW Development Bank | – Promotion of developing countries and emerging economies with | |||
| standard loans/grants refinanced through federal budget funds and | ||||
| promotional/development loans from market funds raised by KfW | ||||
|
DEG |
– Private enterprise financing in developing countries and emerging economies | |||
| Financial markets | – Securities and money market investments | |||
| – Holding arrangements for the Federal Republic of Germany | ||||
| – Transactions mandated by the Federal Government, loan granted to Greece | ||||
| – Funding | ||||
| Head office | – Central interest rate and currency management | |||
| – Strategic equity investments | ||||
In addition to KfW (that is, the business sectors Mittelstandsbank & Private Kunden (SME Bank & Private Clients), Individualfinanzierung & Öffentliche Kunden (Customised Finance & Public Clients), KfW Development Bank, Financial markets and Head office), the group includes six consolidated subsidiaries. The main operational subsidiaries are KfW IPEX-Bank (responsible for the business sector Export and project finance), DEG – Deutsche Investitions- und Entwicklungsgesellschaft mbH (DEG) and KfW Capital GmbH & Co. KG (KfW Capital).
KfW IPEX-Bank addresses the global lending business in Export and project finance that is not part of KfW’s promotional activities and that is subject to competition in the financial services sector. In addition to its own market business, KfW IPEX-Bank manages the fiduciary business conducted on behalf of and for the account of KfW under an agency agreement. KfW IPEX-Bank is subject to the KWG and banking supervisory regulations. As a consequence of its total assets exceeding EUR 30 billion and its classification as a significant entity, its supervisory authority changed from BaFin and the Bundesbank to the European Central Bank in 2025.
DEG is one of the largest European development finance institutions for long-term financing in the private sectors of developing countries and emerging economies. DEG’s objective is to achieve a developmental impact within the meaning of the Sustainable Development Goals (SDGs) of the United Nations’ 2030 Agenda through reliable, long-term financing and advisory services for private-sector entities.
KfW Capital, represented by KfW Capital Verwaltungs GmbH, is responsible for equity financing as part of the domestic promotional business. KfW Capital is an institutional investor that invests in venture capital and venture debt funds related to Germany at all stages and across all sectors. In addition to its own market business conducted at its own risk, KfW Capital manages Federal Government funds on a fiduciary basis. KfW Capital also functions as KfW’s agent for KfW’s equity investments in funds, which it enters into on a fiduciary basis for the Federal Government in the context of the Future Fund (Zukunftsfonds).
6
KfW Financial Report 2025
Financial Report > Combined Management Report > Basic information on KfW Group
Composition of KfW Group Total assets (IFRS, before consolidation)
|
|
Total assets as of 31 Dec. 2025 |
Total assets as of 31 Dec. 2024 |
||||||||
|
|
EUR in millions | EUR in millions | ||||||||
| KfW, Frankfurt am Main, Germany |
535,339 | 540,309 | ||||||||
| Subsidiaries |
|
|
|
|
||||||
| KfW IPEX-Bank GmbH, Frankfurt am Main, Germany |
40,504 | 38,337 | ||||||||
| DEG – Deutsche Investitions- und Entwicklungsgesellschaft mbH, Cologne, Germany |
8,889 | 9,156 | ||||||||
| KfW Beteiligungsholding GmbH, Frankfurt am Main, Germany |
4,116 | 3,521 | ||||||||
| KfW Capital GmbH & Co. KG, Frankfurt am Main, Germany |
1,809 | 1,287 | ||||||||
| Interkonnektor GmbH, Frankfurt am Main, Germany |
236 | 249 | ||||||||
| KfW IPEX-Bank Asia Ltd., Singapore (IPEX Asia) |
16 | 16 | ||||||||
| Investments accounted for using the equity method |
Total assets as of 30 Sep. 2025 |
Total assets as of 30 Sep. 2024 |
||||||||
| Green for Growth Fund, Southeast Europe S.A., Luxembourg (11.2%), Luxembourg |
1,091 | 1,093 | ||||||||
| coparion GmbH & Co. KG, Cologne (16.4%), Germany |
251 | 345 | ||||||||
|
|
31 Dec. 2025 | 31 Dec. 2024 | ||||||||
| DC Nordseekabel GmbH & Co. KG, Bayreuth (50.0%), Germany | 755 | 802 | ||||||||
KfWplus is the strategic agenda that serves as the basis on which KfW seeks to realise its vision of the digital transformation and promotional bank. It defines the priorities that KfW will set for its products and services in the coming years and how its organisation will reflect these priorities. KfW positions its strategic agenda KfWplus in line with the “Boost competitiveness and resilience” concept, with a focus on the “climate and environment” and “digitalisation and innovation” action areas. The aim is to make the promotional impact measurable and a focal point in order to successfully pursue the dual transformation. Private capital is also specified as a lever to drive sustainable transformation. KfW’s strength forms the foundation. Customers who use KfW’s financing and/or promotional offers are at the heart of KfWplus, along with investors in KfW. The strategic objectives implement the control components of KfWplus, to enable comprehensive control and the achievement of the group’s strategic targets. This system of objectives provides the group with a clear roadmap, indicating the direction in which KfW would like to take over the next five years. It defines KfW Group’s targeted medium-term positioning and sets top-level objectives for the bank as a whole. It is subject to an annual review along with the defined targets and key performance indicators (“KPIs”) in close consultation with the departments. The objectives of the previous year are reviewed for relevance, completeness and level of aspiration and adjusted based on changed parameters or newly determined priorities. Efforts are made, however, to maintain a high degree of consistency to ensure that there are no fundamental changes made to the strategic road map in the course of the annual review. The Board of Supervisory Directors addresses the strategic objectives as part of group business sector planning.
The overarching aim of the strategic objectives 2030 is to boost competitiveness and resilience for sustainable improvement of living conditions. The purpose was aligned with the updated KfWplus to ensure consistency throughout KfW’s strategic approach. KfW strives to boost the competitiveness and resilience of the German economy and society through targeted measures and initiatives. Its vision remains to position itself as the digital transformation and promotional bank that uses innovative approaches and technologies to make a significant contribution to sustainable development. KfW focuses on close cooperation with its partners and customers to develop future-viable solutions together. The strategic objective system was reviewed as a whole in 2025 and a new structure was developed based on the strategic focus areas. The strategic focus areas are the key to translating KfW’s vision into tangible actions and priorities. They are directed at the central departments, which help to prioritise resources, make decisions and control the direction of the corporate strategy. They also act as a framework with which the specific targets and KPIs are aligned. KfW
7
KfW Financial Report 2025
Financial Report > Combined Management Report > Basic information on KfW Group
uses the following six strategic focus areas: “promotional mandate, impact and impetus”, “culture and employee potential”, “digitalisation and AI”, “modernisation of banking systems”, “risk and regulatory governance”, and “profitable business model”. The alignment of the strategic objectives with the strategic focus areas ensures that KfW’s entire strategic approach is consistent and that the individual strategic elements are interconnected. The management-relevant group targets provide the basis for the 2026 group business sector planning, and primarily comprise: under “promotional mandate, impact and impetus”, the quotas for climate and environment (>38%), digitalisation and innovation (>10%), SMEs (>40%) and promotional quality (75–80%); under “risk and regulatory governance”, the total capital ratio (≥ regulatory requirements plus a combined buffer) and the economic coverage ratio (≥140%); and under “profitable business model”, consolidated profit (>EUR 1 billion) and limiting the increase in administrative expense (~3% p.a.). Moreover, KfW aims to achieve 1.5°C alignment of KfW financing and climate neutrality by the middle of the century in line with the targets of the Federal Republic of Germany (sustainability in the strategic focus area of “promotional mandate, impact and impetus”).
KfW Group has an integrated strategy and planning process. Conceived as a group-wide strategy process, group business sector planning is KfW Group’s central planning and management tool. Group business sector planning consists of three consecutive sub-processes performed every year: defining objectives, implementation and quality assurance, and finalisation. The overall strategy and planning process includes the collaboration of staff responsible for planning in all areas.
Objectives: The KfWplus transformation agenda and the strategic objectives form the basis for strategic planning. Within this strategic framework and based on assumptions regarding future development of relevant factors, the business sectors derive strategic proposals for medium-term development of their business activities in a base case scenario. These take into account both opportunities and risks relating to external factors (including market development, regulatory requirements, climate policy, the competitive situation and customer behaviour) and internal factors and resources (including human and technical and organisational resources, promotional expense, primary cost planning and tied-up capital) as well as targeted earnings levels. It involves regular evaluation of the key business and revenue drivers for the business sectors and the group. The business sectors are also called upon to address the environmental, social and governance (“ESG”) risks resulting from their business activity. As risk drivers, these can have a considerable impact on the likelihood of occurrence or the extent of typical banking risks. Although ESG risks primarily affect the lending and equity finance business of KfW Group, they can also potentially give rise to consequential risks, such as reputational risk. The initial regular capital budget in the base case and two adverse cases is prepared with a multi-year horizon on this basis. This makes early identification of any capital bottlenecks arising from strategic considerations or changed parameters possible; in response, measures can be agreed on and implemented to mitigate such capital shortages. In addition to the business sectors, the departments also make a major contribution to achievement of strategic targets. By involving these departments, their own strategies are aligned with the strategic objectives. The business sectors and departments can include major new projects relevant throughout the bank that contribute towards the strategic focus areas and targets of the strategic objectives (bank backlog projects) in the planning and management processes on a rolling basis. Promised benefits (such as project efficiencies) are also considered in business sector and departmental planning. Based on the strategic focus areas, the Executive Board prioritises all new and ongoing bank backlog projects across the group on a quarterly basis. The Executive Board defines top-down objectives for each business sector (promotion, risk, finances, full-time equivalents [FTEs] and costs) and department (FTEs and costs) for the entire planning period based on the assessment of the strategic development of business activities from a group perspective in the dimensions promotion, finances and risk and the group-wide bank backlog.
Implementation and quality assurance: The business sectors plan their new business, risks and earnings, and the budgets and staffing in the form of FTEs for all departments and business sectors, based on the top-down objectives defined by the Executive Board, taking into account any changes in external or internal factors and in close collaboration with Finance and Risk Controlling. These are reviewed for consistency with the group’s and business sectors’ strategic planning. The interest rate forecast plays a key role in shaping KfW’s earnings position. Scenarios with vastly different interest rates (+200/–200 basis points) are therefore considered in addition to the expected base case scenario. The plans are also assessed for future risk-bearing capacity in a second round of regular capital budgeting in a base case and two adverse cases over a multi-year horizon.
8
KfW Financial Report 2025
Financial Report > Combined Management Report > Basic information on KfW Group
Finalisation: The Executive Board approves the resulting budget or has plans fine-tuned in a revision round if necessary. In the event of changes, there is consultation with the Risk Controlling department to ensure consistency between the business and risk strategies. The key conclusions from the planning process are incorporated into the business and risk strategies. The Executive Board has overall responsibility for formulating and adopting both strategies. The business strategy comprises the group’s strategic objectives for its main business activities as well as important internal and external factors, which are included in the strategy and planning process. It also contains the business sectors’ contribution to the strategic objectives and the measures for achieving each objective. Moreover, the business strategy combines the budget at the group and business sector levels. The Executive Board sets out KfW Group’s risk policies in its risk strategy, which is consistent with the business strategy. The risk strategy is based on the overarching aim of ensuring risk-bearing capacity and liquidity for the long term. Group business sector planning is used to review and redetermine risk appetite. The main risk management approaches are also incorporated into the risk strategy as a basis for operational risk management. The group business sector planning process ends when the Executive Board adopts a final budget for the entire planning period, including future capital requirements and business and risk strategies. The budget is then presented to the supervisory body (Board of Supervisory Directors) for approval at the last meeting of the Board of Supervisory Directors of the year, along with the business and risk strategies for discussion. The Board of Supervisory Directors also addresses the strategic objectives within the context of the business strategy. After the Board of Supervisory Directors has decided on the business and risk strategy, it is communicated to the staff in an appropriate manner. On the other hand, the result from the valuation of derivatives, which KfW carries out purely for hedging purposes, is not included in the planning, as it cannot be controlled or planned due to the complex interdependencies affecting the measurement at fair value of derivatives in the context of KfW’s refinancing activities. The temporary effects on results from the measurement of such hedging relationships included in the actual figures are recognised separately in internal reporting and the management report as alternative key financial figures.
The adoption of the business sector planning serves as a foundation for the group’s qualitative and quantitative objectives. The Executive Board reviews achievement of the objectives both on a regular and an ad hoc basis during the current financial year. The assumptions concerning external and internal factors made when determining the business strategy are also subject to regular checks. Strategic management involves analysing the development of the management-relevant group targets set out above under “KfWplus and strategic objectives 2030” in the strategic focus areas “promotional mandate, impact and impetus” and “profitable business model”, achievement of the targets and the reasons for any shortfalls. Strategic assumptions are reviewed and a systematic variance analysis of early objectives and forecasts is performed at the beginning of every year. Ad hoc issues of strategic relevance are also addressed in consultation with the group’s departments, and, if necessary, recommendations for action concerning potential strategy adjustments or optimisation of the use of resources are made to the Executive Board by means of the strategic performance report. The results of the analysis are included in further strategy discussions and strategic planning processes. The integrated forecasting process serves at mid-year as a comprehensive basis for interim quantitative management input on group variables of strategic importance (new business, risks and earnings in respect of funding opportunities), while providing a well-founded guide to achieving planned objectives. The achievement of objectives is regularly monitored by the Board of Supervisory Directors based on reports submitted under the KfW Bylaws. The commentary in these reports outlines analyses of causes and any potential plans for action. Comprehensive and detailed reports are prepared on a monthly or quarterly basis as part of financial controlling. These comprehensive, detailed analyses at group and business sector level comprise earnings and cost developments and are reported to specific business sectors and departments. Additionally, complete analyses of significant relevance to overall group performance are presented directly to the Executive Board. The risk controlling function is implemented alongside strategic and financial controlling. Early warning systems have been established and mitigation measures defined for the business sectors, all material risk types and risk-bearing capacity in general in line with the risk management requirements set out in the risk strategy. All controlling and monitoring approaches are integrated into regular risk reporting to the Executive Board. The Board of Supervisory Directors receives a risk report on a quarterly basis.
9
KfW Financial Report 2025
Financial Report > Combined Management Report > Basic information on KfW Group
Alternative key financial figures used
The combined management report contains financial figures that are defined neither in the HGB nor the IFRS accounting standards. In its strategic objectives, KfW uses key indicators prescribed by accounting standards and supervisory regulations as well as key figures that are geared towards promotion as the core business activity. It also uses key figures in which the temporary effects on results determined and reported in the consolidated financial statements in accordance with IFRS, and which KfW does not consider representative, are adjusted.
KfW has defined the following alternative key financial figures:
Promotional business volume
Promotional business volume refers to the commitments of each business sector during the reporting period. In addition to the lending commitments shown in the statement of financial position, promotional business volume comprises loans from Federal Government funds for promotion of developing countries and emerging economies – which are accounted for as trust activities – financial guarantees, equity financing and securities purchases (in the green bond asset class). Promotional business volume also includes grants committed as part of development aid and in domestic promotional programmes. Allocation to the promotional business volume for the current financial year is generally based on the commitment date of each loan, financial guarantee and grant, and the transaction date of the equity finance and securities transactions. On the other hand, allocation of general funding and global loans to the promotional institutions of the federal states (Landesförderinstitute – “LFI”) and to student loans provided by the government under the Federal Education Assistance Act (Bundesausbildungsförderungsgesetz – “BAföG”) is based on the individual drawdown volume and date, instead of the total volume of the contract at the time of commitment. In the lending business, financing amounts denominated in foreign currency are converted into euros at the exchange rate on the commitment date, whereas in the securities and equity finance business, the conversion generally occurs at the rate on the transaction date.
See the economic report “Development of KfW Group” or segment reports for a breakdown of promotional business volume by individual segment.
Promotional expense
Promotional expense is understood to mean certain expenses arising in the two business sectors Mittelstandsbank & Privatkunden (SME Bank & Private Clients) and Individualfinanzierung & Öffentliche Kunden (Customised Finance & Public Clients) to achieve KfW’s promotional objectives.
KfW’s overall promotional expenses primarily comprise interest rate reductions accounted for at present value. KfW grants these reductions during the first fixed interest rate period for certain domestic promotional loans in new business in addition to passing on favourable funding conditions based on its rating (triple A). The difference between the fair value of these promotional loans and the transaction value during the first fixed interest rate period, due to the interest rate being below the market rate, is recognised in profit or loss as an interest expense and accounted for as an adjustment to the carrying amount under the item Financial assets at amortised cost. In addition, the accumulated interest rate reductions over the fixed interest rate period are recognised through profit or loss in Net interest income (see the relevant notes on KfW’s promotional lending business, financial assets at amortised cost, and provisions).
An additional promotional component (in commission expense) comprises the expense paid in the form of upfront fees to sales partners for processing microloans. Promotional expense also contains disposable and product-related marketing and sales expenses (administrative expense), expenses for innovative digital promotional approaches (commission and administrative expense), and promotional grants awarded by KfW from 2023 in the context of European Recovery Program promotion (other operating expense).
Promotional expense included in Interest, Commission and Administrative expense and Other operating expense is reported separately in the internal presentation of the earnings position due to its special relevance as a management variable.
10
KfW Financial Report 2025
Financial Report > Combined Management Report > Basic information on KfW Group
Cost/income ratio (before promotional expense)
The cost/income ratio (before promotional expense) is calculated as administrative expense (excluding promotional expense) in relation to net interest and commission income before promotional expense.
The cost/income ratio (“CIR”) reflects costs in relation to income and is thus a measure of efficiency. To enable a comparison of the CIR with other (non-promotional) institutions, an adjustment for the components of KfW’s promotional business results is made to the numerator (administrative expense) and denominator (net interest and commission income).
In addition to the CIR, KfW also reports an adjusted CIR, which takes into account KfW’s specific business model. Under domestic promotional programmes with expense-based remuneration, as well as for implementation of Financial Cooperation KfW receives compensation in the amount of the costs incurred, which means that for these products, the CIR is almost 100%. In order to ensure comparability of KfW’s CIR with that of other financial institutions, the adjusted CIR does not take into account income and expenses related to these products.
Consolidated profit before IFRS effects
Consolidated profit before IFRS effects from hedging is another key financial figure based on Consolidated profit in accordance with IFRS. Derivative financial instruments are entered into for hedging purposes. Under IFRS, the requirements for the recognition and valuation of derivatives and hedges give rise to temporary net gains or losses that are offset over the entire term of the transactions. In KfW’s opinion, such temporary effects on results are not representative due to the economically effective hedging relationships.
Consequently, the following reconciliations are performed by eliminating temporary contributions to profit and loss as follows:
| – | Valuation results from micro and macro hedge accounting. |
| – | Net gains or losses from the use of the fair value option to avoid an accounting mismatch in the case of funding including related hedging derivatives. |
| – | Net gains or losses from the fair value accounting of hedges with high economic effectiveness but not qualifying for hedge accounting. |
| – | Net gains or losses from foreign currency translation of foreign currency positions, in accordance with recognition and valuation requirements for derivatives and hedging relationships. |
These temporary contributions to profit and loss make up the IFRS effects from hedging relationships.
Economic result
The alternative key financial figures were expanded in financial year 2025 to include the economic result.
The economic result comprises the operating earnings components net interest and commission income and administrative expense (each before promotional expense), along with the valuation result before IFRS effects from hedging relationships. The valuation result, which primarily comprises risk provisions in the lending business, net gains/losses from hedge accounting and fair value valuation of equity investments, is adjusted for temporary IFRS effects from hedging relationships, which KfW does not consider economically representative.
KfW Group’s contribution to society and the economy in the form of promotional and tax expense is presented separately and is not included in the economic result.
11
KfW Financial Report 2025
Financial Report > Combined Management Report > Economic report
Global real domestic product (“GDP”) increased by 3.3% in 2025 compared with 2024, according to estimates by the International Monetary Fund (“IMF”). This means that real GDP growth for the global economy in 2025 was as high as in 2024: lower for industrialised countries and higher for developing countries and emerging economies. The global environment was characterised in part by increased economic and trade policy uncertainty. The global Trade Policy Uncertainty (TPU) index averaged 538 points in 2025, up from an average of 132 points in 2024, while the global Economic Policy Uncertainty (EPU) index averaged 395 points in the period up to and including October, from an average of 223 points in 2024. Another factor was the increase in the effective US import tariff rate from 2.7% in 2024 to 18.8% in September 2025, according to the IMF, based on the weighted average of published statutory tariffs. Despite trade conflicts, global trade volume grew by 4.1% in 2025, outpacing real global GDP growth, after increasing by 3.6% year on year in 2024 according to IMF data. According to IMF calculations, the annual average rate of global consumer price inflation declined to 4.1% in 2025 from 5.8% in the previous year.
Gross domestic product at constant prices
|
|
2025 estimate |
2024 |
2015–2024 average |
|||||||||||
|
Year-on-year change in % |
|
|
|
|
||||||||||
| Global economy1) |
3.3 | 3.3 | 3.1 | |||||||||||
| Industrialised countries1) |
1.7 | 1.8 | 1.9 | |||||||||||
| Developing countries and emerging economies1) | 4.4 | 4.3 | 4.0 | |||||||||||
| 1) | The IMF aggregates the annual growth rates of GDP at constant prices for each country on the basis of the shares of country-specific GDP at purchasing power parity in the corresponding global aggregate to the growth rate of global real GDP, for industrialised countries as well as developing countries and emerging economies. The average is calculated as the geometric mean of annual growth rates. |
Euro area economic growth proved surprisingly robust in the face of heightened US trade barriers in the spring of 2025. Price-adjusted GDP rose by 1.5% in 2025 after growing by just 0.9% in 2024 (see table below on gross domestic product at constant prices, year-on-year change). Harmonised consumer price inflation averaged 2.1% for the year, slightly lower than in the previous year (2.4%). While deliveries that had been brought forward due to the US tariffs contributed to an increase in exports at the beginning of the year, exports weakened as the year progressed. This weakening was also a consequence of the price competitiveness of euro area companies in global trade deteriorating as a result of the appreciation of the euro. Overall, the stronger increase in imports relative to exports slowed GDP growth. Private consumption made the biggest contribution to economic output, with rising disposable incomes and falling inflation fuelling this development. The rise in the household savings rate in the first half of the year, however, put a slight damper on the recovery in consumption. Gross fixed capital formation recovered significantly compared with the previous year, supported by government spending. Economic development was hampered by high geoeconomic uncertainty caused by US tariff policy and the geopolitical conflicts in Ukraine and the Middle East. The monetary easing policy of the European Central Bank (“ECB”), which had begun in the previous year, led to better financing conditions overall. It ended in June after four interest rate cuts. Fiscal policy did not provide any significant economic stimulus in the euro area. Lower current expenditure by member states was offset by higher government investment spending, including on defence.
12
KfW Financial Report 2025
Financial Report > Combined Management Report > Economic report
Gross domestic product at constant prices, year-on-year change
|
|
2025 |
2024 |
2015–2024 average |
1999–2024 maximum |
||||||||||||||
|
|
in % | in % | in % | in % | ||||||||||||||
| Euro area |
1.5 | 0.9 | 1.5 | 6.41) | ||||||||||||||
| Germany | 0.2 | –0.5 | 0.9 | 4.12) | ||||||||||||||
| 1) | 2021 2) 2010 |
GDP in Germany increased by 0.2% year on year in 2025. This increase was the result of the global economic developments described above, of lower interest rates and rising purchasing power among private households, and of a consumer price index (“CPI”) inflation rate that averaged 2.2% in 2025, unchanged from 2024 (+2.2%). In 2024, German GDP had contracted by 0.5%, after having grown by an average of 0.9% p.a. for the previous ten years from 2015 to 2024 inclusive (see the table entitled Gross domestic product at constant prices, year-on-year change). Positive impetus for the GDP growth in 2025 came from both private and government consumption expenditure (+1.4% and +1.5%, respectively). Gross capital formation in other assets also increased (+3.8%). By contrast, gross capital formation in machinery and equipment (–2.3%) and in new buildings (–0.9%) slowed GDP growth once again. This means that, overall, domestic use rose by 1.7% in 2025. On the other hand, net exports reduced GDP growth by 1.5 percentage points, partly due to the introduction of new US import tariffs on EU products, with exports declining (–0.3%) and imports rising (+3.6%). From a production perspective, gross value added in the economic sectors provided both positive and negative impetus for the rate of change in GDP in 2025, with the effects virtually cancelling each other out overall. The biggest decline in gross value added was seen among financial and insurance service providers (–3.9%), while the public services, education and health sector saw the biggest increase (+1.4%). Gross value added in the manufacturing industry, excluding construction, fell by 1.0%, while it rose by 1.2% in the retail, transport and hospitality sector. The number of persons in employment located in Germany was virtually unchanged (0.0%) year on year in 2025, at 46.0 million.
The average annual rise in headline inflation in the euro area moved closer to the ECB’s 2% target in 2025. This development was mainly due to the decline in service inflation, which nevertheless remained above average at the end of 2025. By contrast, inflation in the United States, as measured by the Personal Consumption Expenditures Price Index, remained virtually unchanged. Against the backdrop of increased US import tariffs, declining inflation for services was offset by rising inflation rates for consumer goods and commodities. At the end of 2025, the annual inflation rate in the euro area (rate of change in the Harmonised Index of Consumer Prices, December) was 2.0%; the annual inflation rate in the United States (rate of change in the Personal Consumption Expenditures Price Index, November) in the same period was 2.8%.
Due to the sustained downward trend in inflation, the ECB initially continued the monetary easing measures it had introduced in June 2024. In the first half of 2025, the ECB reduced its most important key rate, the deposit rate, by a total of 100 basis points (bp) to 2% in four steps. The ECB maintained this key interest rate level for the rest of the year, citing the stable inflation outlook and sustained growth in a difficult global environment. The ECB discontinued its asset purchase programmes, the pandemic emergency purchase programme (“PEPP”) and the regular asset purchase programme (“APP”) in 2022, and started decreasing portfolios again in 2023. Principal payments due under the APP and PEPP were no longer reinvested in 2025. This resulted in a reduction in total securities held for monetary policy purposes by approximately 13% compared to the end of 2024, to EUR 3,752 billion.
The US Federal Reserve began lowering the federal funds target rate range in September 2024 and reduced it by a total of 100 bp to 4.25%–4.5% by the end of 2024. After that, the considerable uncertainty regarding the impact of US economic policy prompted the Fed to pause its interest rate cuts. It was not until September 2025 that the US Federal Reserve resumed its monetary easing policy in response to weaker labour market data, with the target range for the Fed Funds Rate still standing at 3.5%–3.75% at the end of the year. It initially continued to shrink its balance sheet by trimming assets, a process it began in 2022. This process continued, albeit at a slower pace, through most of 2025, and concluded as of 1 December 2025.
13
KfW Financial Report 2025
Financial Report > Combined Management Report > Economic report
The development in interest rates in the euro area and the USA was characterised in part by a reduction in key rates in 2025. As a result, money market rates continued the downward trend that had begun in the previous year. The three-month EURIBOR, for instance, averaged 2.18% in 2025, down from 3.57% in 2024, while in the US, the three-month SOFR reference rate (CME) stood at 4.15%, down from 5.06% in the previous year. In addition, risk premiums widened due to mounting uncertainty about future interest rates and growing government debt, which affected longer-term swap rates and government bond yields in particular. In annual average terms, this meant that some key market interest rates were higher than in the previous year despite monetary policy easing. For instance, the 5-year EUR swap rate for 2025 fell to an annual average of 2.34% from 2.58%, while the yield on 10-year German government bonds rose from 2.34% to 2.64%. The 5-year USD swap rate averaged 3.58% (2024: 3.85%), and the yield on 10-year US Treasuries was 4.29% (2024: 4.20%). Yield curves, measured by the difference between 10-year and 2-year swap rates, normalised in 2025 and returned to an upward slope. In 2025, the average EUR swap curve slope was 49 bp (2024: –26 bp), while the US swap curve slope was 20 bp (2024: –45 bp).
Both the protectionist reorientation of US trade policy and attempts to exert greater political influence over the US Federal Reserve hit market participants’ confidence in the predictability of US economic policy. This had a particular impact on the currency markets. While the US dollar came under pressure, the euro made significant gains. Compared with the end of 2024, the euro appreciated by 13.4% against the dollar and by 6.8% against the currency basket comprising the region’s 41 most important trading partners in 2025.
The group enjoyed another strong promotional year in 2025, with the promotional business volume from its core promotional business increasing significantly to EUR 96.9 billion compared with the previous year (EUR 79.6 billion). Taking into account the significant decline in transactions directly mandated by the Federal Government, the total volume of promotional business was down significantly on the previous year’s level of EUR 112.8 billion at EUR 98.0 billion.
KfW Group’s earnings position was highly satisfactory in 2025 despite the persistent challenging geopolitical and macroeconomic environment. Consolidated profit was EUR 1.0 billion, in line with expectations. The year-on-year decline (EUR 1.4 billion) is mainly attributable to negative IFRS effects from hedging amounting to just under EUR 0.4 billion; these are temporary fluctuations in earnings. Consolidated profit before IFRS effects from hedging of around EUR 1.4 billion was on a par with the prior-year level. The operating result remained strong at EUR 1.9 billion. Despite a decline, the valuation result remained positive at EUR 0.1 billion (2024: EUR 0.2 billion). The economic result fell slightly to EUR 2.0 billion (2024: EUR 2.1 billion) due to the lower valuation result. On this basis, KfW kept its promotional expense for 2025 stable at the 2024 level of EUR 0.5 billion. Tax expense was unchanged year on year at EUR 0.2 billion.
Consolidated total assets decreased by EUR 4.6 billion to EUR 540.7 billion in financial year 2025. This was primarily attributable to the decline in Net loans and advances by EUR 10.0 billion, in particular due to repayments under the coronavirus special programme 2020, as well as impairment losses, triggered by interest rates, on derivatives with positive fair values amounting to EUR 5.9 billion. Liquidity held, on the other hand, rose by EUR 11.8 billion. The volume of own issues under Certificated liabilities increased slightly to EUR 460.6 billion (31 Dec. 2024: EUR 455.5 billion). Equity rose by EUR 1.1 billion to EUR 40.6 billion, mainly due to the consolidated profit.
Business performance in 2025 was largely characterised by the following developments:
A. Demand for KfW products slightly higher than in previous year
The group recorded another very strong promotional year in its core business in 2025 with new commitments totalling EUR 96.9 billion (2024: EUR 79.6 billion). Of this amount, EUR 10.1 billion was attributable to ERP promotional business. At the same time, the normalisation of promotional business, due to the discontinuation of substantial commitments under special programmes directly mandated by the Federal Government, led to a significant decline in the total promotional volume from EUR 112.8 billion to EUR 98.0 billion. In the previous year, mandated transactions totalling EUR 33.2 billion, such as to secure energy supplies or for investments in energy infrastructure, had significantly boosted the volume of new domestic business. Non-recurring effects from mandated transactions were only of minor significance in 2025, amounting to EUR 1.1 billion.
14
KfW Financial Report 2025
Financial Report > Combined Management Report > Economic report
This effect was also reflected in the promotional business volume for total new domestic promotional business, which saw a decline in new commitments from EUR 79.0 billion to EUR 62.0 billion. This largely affected the business sector Individualfinanzierung & Öffentliche Kunden (Customised Finance & Public Clients), with a drop from EUR 41.6 billion to EUR 12.2 billion. By contrast, the primary promotional business of domestic promotion involving loans and grants increased significantly by at least one third compared with the previous year, to EUR 61.0 billion (2024: EUR 45.8 billion). The business sector Mittelstandsbank & Privatkunden (SME Bank & Private Clients) showed particularly positive development, with the promotional business volume increasing significantly from EUR 35.8 billion to EUR 49.1 billion. This encouraging development affected Mittelstandsbank in particular, where, following the negative impact of state aid requirements in 2024, there was considerable pent-up demand in 2025. This related in particular to the KfW Renewable Energy programme, with commitments amounting to EUR 9.2 billion. Positive performance was also recorded in business with private clients, rising from EUR 22.4 billion to EUR 25.5 billion, particularly in the key promotional area energy efficiency and renewable energy. The original promotional business in the business sector Individualfinanzierung & Öffentliche Kunden (Customised Finance & Public Clients) rose from EUR 8.4 billion to EUR 11.2 billion. The subsidiary KfW Capital recorded new business volume totalling EUR 0.7 billion in 2025 (2024: EUR 1.6 billion). The year-on-year decline was mainly due to one-off commitments for two facilities made in 2024 on a fiduciary basis for the Federal Government as part of the Future Fund.
International business commitments improved in financial year 2025, despite the sustained difficult market environment, with a promotional business volume of EUR 36.5 billion (2024: EUR 34.2 billion). The business sector Export and project finance recorded new commitments of EUR 24.2 billion (2024: EUR 23.9 billion). In the business sector KfW Development Bank, commitments rose significantly from EUR 7.8 billion to EUR 10.0 billion, around two thirds of which related to loans refinanced by KfW on the capital market. Despite persistent globally challenging conditions, DEG recorded commitments totalling EUR 2.4 billion, almost matching the strong performance of the previous year (EUR 2.5 billion).
The development of new business volume in 2025 affected the most important non-financial performance indicators relevant to management, i.e., the SME and environmental shares of financing. At 43%, the group-level SME share of financing was above the target of the strategic objectives (>40%) and above the prior-year figure of 35%. At the same time, the environmental share of 51% in 2025 exceeded the target of the strategic objectives (>38%) and the prior-year level (44%). At 86%, the promotional quality target set out in the strategic objectives (75%–80%) was exceeded. At 6%, the digitalisation share remains below the target level (>10%).
KfW raised a volume of EUR 71.0 billion in the capital markets to fund its business activities in 2025 (2024: EUR 78.1 billion).
Promotional business volume of KfW Group
|
|
2025 |
2024 | ||||||||
|
|
EUR in billions | EUR in billions | ||||||||
| Domestic business |
62.0 | 79.0 | ||||||||
| Mittelstandsbank & Private Kunden (SME Bank & Private Clients) |
49.1 | 35.8 | ||||||||
| Individualfinanzierung & Öffentliche Kunden (Customised Finance & Public Clients) |
12.2 | 41.6 | ||||||||
| KfW Capital |
0.7 | 1.6 | ||||||||
| Financial markets |
0.0 | 0.0 | ||||||||
| International business |
36.5 | 34.2 | ||||||||
| Export and project finance |
24.2 | 23.9 | ||||||||
| KfW Development Bank |
10.0 | 7.8 | ||||||||
| DEG | 2.4 | 2.5 | ||||||||
|
|
||||||||||
| Volume of new commitments1) | 98.0 | 112.8 | ||||||||
| 1) | Adjusted for export and project financing refinanced through KfW programme loans |
15
KfW Financial Report 2025
Financial Report > Combined Management Report > Economic report
B. Operating result on a par with strong previous year
At EUR 1,903 million, the operating result before valuation and before promotional expense remained at the strong prior-year level (EUR 1,917 million) despite a one-off provision set up for personnel, exceeding the target (EUR 1,732 million) by 10%. This positive development was primarily due to net interest income (before promotional expense), which at EUR 2,957 million exceeded the target (EUR 2,791 million) by 6%, and once again represented the group’s main source of income. Net interest income benefited from higher borrowings and a higher return on equity, as well as higher interest margins. At EUR 685 million, net commission income (before promotional expense) was similar to the prior-year level (EUR 675 million) and exceeded the target (EUR 664 million) by 3%. By contrast, administrative expense before promotional expense rose by EUR 81 million to EUR 1,739 million, exceeding the planned ceiling by EUR 16 million. This increase was due primarily to the introduction of new promotional programmes and one-off provisions for personnel. Overall, the cost-income ratio before promotional expense rose from 46.4% to 47.7%.
C. Risk provisions reflect macroeconomic uncertainties
In financial year 2025, risk provisions in the lending business resulted in net expense of EUR 155 million, whereas in the previous year, net income of EUR 39 million was generated. The result is also significantly better than the projected standard risk costs (EUR 457 million). Geopolitical and macroeconomic uncertainties primarily affected the provisions for latent risks for stage 1 and 2 loans, resulting in net additions totalling EUR 79 million (2024: net reversals of EUR 51 million). Net expenses for non-performing loans (stage 3) rose to EUR 119 million (2024: EUR 50 million). This was offset by income from recoveries of loans previously written off of EUR 42 million, which was similar to the previous year (EUR 43 million).
D. Positive valuation result from equity investment portfolio
The group generated income from the measurement of its equity investment portfolio amounting to EUR 102 million in 2025, compared with EUR 149 million in the previous year. Almost all business sectors contributed to this result with net income from securities. KfW Capital’s equity investment portfolio made the strongest contribution to earnings of EUR 184 million, following income of EUR 31 million in the previous year. DEG’s equity investments generated net income from securities of EUR 102 million, although this was more than offset by a negative foreign currency result of EUR 289 million. This brought DEG’s total valuation result to EUR –187 million (2024: EUR +81 million). Positive contributions also came from business sectors KfW Development Bank (EUR 53 million, 2024: EUR 20 million), Individualfinanzierung & Öffentliche Kunden (Customised Finance & Public Clients) (EUR 29 million, 2024: EUR –2 million) and Head office (EUR 27 million, 2024: EUR –3 million). The business sector Export and project finance closed the year with a negative valuation result of EUR –5 million (2024: EUR +22 million).
E. Promotional expense slightly below high prior-year level
KfW’s domestic promotional expense, which has a negative impact on its earnings position, almost matched the prior-year level at EUR 468 million (2024: EUR 504 million). The target ceiling of EUR 457 million was slightly surpassed. The drop in promotional expense is due to the fact that no new commitments to grant subsidies under the ERP promotional programmes were entered into in financial year 2025, with the aim of first utilising the provisions recognised for the commitments in previous years. In the previous year, provisioning resulted in an expense of EUR 70 million. By contrast, interest rate reductions showed positive development, rising by EUR 15 million to EUR 421 million due to a significant increase in the promotional business volume subject to reduced interest rates, combined with lower reduction margins.
16
KfW Financial Report 2025
Financial Report > Combined Management Report > Economic report
The following key figures provide an overview of the development of key financial figures in financial year 2025:
Key financial figures of KfW Group
|
|
2025 | 2024 | ||||||||
| Key figures of the income statement |
EUR in millions | EUR in millions | ||||||||
| Operating result before valuation (before promotional expense) |
1,903 | 1,917 | ||||||||
| Economic result |
2,016 | 2,097 | ||||||||
| Promotional expense |
468 | 504 | ||||||||
| Consolidated profit before IFRS effects |
1,359 | 1,354 | ||||||||
| Consolidated profit |
1,002 | 1,402 | ||||||||
| Cost-income ratio (before promotional expense) |
47.7% | 46.4% | ||||||||
|
|
31 Dec. 2025 | 31 Dec. 2024 | ||||||||
| Key figures of the statement of financial position |
EUR in billions | EUR in billions | ||||||||
| Total assets |
540.7 | 545.4 | ||||||||
| Volume of lending |
580.5 | 593.5 | ||||||||
| Volume of business |
706.4 | 713.3 | ||||||||
| Equity |
40.6 | 39.6 | ||||||||
| Equity ratio | 7.5% | 7.3% | ||||||||
Comparison with the previous year’s forecast
|
|
2024 forecast for 2025 | 2025 actual | ||||||||||
| New business |
|
|
|
|
||||||||
| Promotional business volume |
EUR 84.4 billion | EUR 98.0 billion | ||||||||||
| Funding |
EUR 65–70 billion | EUR 71.0 billion | ||||||||||
| Result |
|
|
|
|
||||||||
| Consolidated profit |
EUR 1.0 billion | EUR 1.0 billion | ||||||||||
| Net interest income (before promotional expense) |
EUR 2.8 billion | EUR 3.0 billion | ||||||||||
| Net commission income (before promotional expense) |
EUR 0.7 billion | EUR 0.7 billion | ||||||||||
| Administrative expense (before promotional expense) |
EUR 1.7 billion | EUR 1.7 billion | ||||||||||
| Risk provisions for lending business |
EUR –0.5 billion | EUR –0.2 billion | ||||||||||
| Valuation result |
EUR 0.2 billion | EUR 0.1 billion | ||||||||||
| Promotional expense | EUR 0.5 billion | EUR 0.5 billion | ||||||||||
The main differences between the forecasts from the Financial Report 2024 and the actual business development in 2025 are presented in the Economic report.
17
KfW Financial Report 2025
Financial Report > Combined Management Report > Economic report
Development of the KfW Group earnings position
The internal earnings position was expanded in financial year 2025 to include an alternative financial indicator, the economic result. The economic result comprises the operating earnings components net interest and commission income and administrative expense (each before promotional expense), along with the valuation result before IFRS effects from hedging relationships. The valuation result, which primarily comprises risk provisions in the lending business, net gains/losses from hedge accounting and fair value valuation of equity investments, is adjusted for temporary IFRS effects from hedging relationships, which KfW does not consider economically representative. The previous year’s figures have been adjusted accordingly.
The earnings position in financial year 2025 was characterised by a sustained strong operating result, a positive, albeit declining, valuation result and promotional expense that was just below the high level of the previous year. Consolidated profit amounted to EUR 1.0 billion, which was below the previous year’s figure (EUR 1.4 billion) but in line with the target.
Reconciliation of internal earnings position (before promotional expense) with external earnings position (after promotional expense) for financial year 2025
|
|
|
Reconciliation |
|
| ||||
|
|
EUR in millions |
EUR in millions |
EUR in millions |
| ||||
| Net interest income (before promotional expense) |
2,957 |
–425 |
2,532 |
Net interest income | ||||
| Net commission income (before promotional expense) |
685 |
–13 |
672 |
Net commission income | ||||
| Administrative expense (before promotional expense) |
1,739 |
11 |
1,751 |
Administrative expense | ||||
| Operating result before valuation (before promotional expense) |
1,903 |
–450 |
1,453 |
Operating result before valuation | ||||
| Risk provisions for lending business |
–155 |
–4 |
–158 |
Net gains/losses from risk provisions | ||||
| Net gains/losses from hedge accounting before IFRS effects |
0 |
–128 |
–128 |
Net gains/losses from hedge accounting | ||||
| Other financial instruments at fair value through profit or loss before IFRS effects |
258 |
–229 |
30 |
Net gains/losses from other financial instruments at fair value through profit or loss | ||||
| Securities and investments |
–4 |
4 |
0 |
Net gains/losses from disposal of financial assets at amortised cost | ||||
| Net gains/losses from investments accounted for using the equity method |
–6 |
0 |
–6 |
Net gains/losses from investments accounted for using the equity method | ||||
| Operating result after valuation (before promotional expense and IFRS effects) |
1,998 |
–806 |
1,191 |
Operating result after valuation | ||||
| Net other operating income (before promotional expense) |
18 |
–18 |
0 |
Net other operating income or loss | ||||
| Economic result |
2,016 |
–824 |
1,192 |
Profit/loss from operating activities | ||||
| Promotional expense |
468 |
–468 |
0 |
– | ||||
| Taxes on income |
189 |
0 |
189 |
Taxes on income | ||||
| Consolidated profit before IFRS effects |
1,359 |
|
|
– | ||||
| IFRS effects from hedging | –356 | 356 | 0 | – | ||||
| Consolidated profit | 1,002 | 0 | 1,002 | Consolidated profit | ||||
18
KfW Financial Report 2025
Financial Report > Combined Management Report > Economic report
Reconciliation of internal earnings position (before promotional expense) with external earnings position (after promotional expense) for financial year 2024
|
|
|
Reconciliation |
|
| ||||
|
|
EUR in millions |
EUR in millions |
EUR in millions |
| ||||
| Net interest income (before promotional expense) |
2,900 |
–408 |
2,493 |
Net interest income | ||||
| Net commission income (before promotional expense) |
675 |
–12 |
664 |
Net commission income | ||||
| Administrative expense (before promotional expense) |
1,658 |
14 |
1,672 |
Administrative expense | ||||
| Operating result before valuation (before promotional expense) |
1,917 |
–433 |
1,484 |
Operating result before valuation | ||||
| Risk provisions for lending business |
39 |
–1 |
39 |
Net gains/losses from risk provisions | ||||
| Net gains/losses from hedge accounting before IFRS effects |
0 |
107 |
107 |
Net gains/losses from hedge accounting | ||||
| Other financial instruments at fair value through profit or loss before IFRS effects |
102 |
–58 |
44 |
Net gains/losses from other financial instruments at fair value through profit or loss | ||||
| Securities and investments |
0 |
1 |
0 |
Net gains/losses from disposal of financial assets at amortised cost | ||||
| Net gains/losses from investments accounted for using the equity method |
20 |
0 |
20 |
Net gains/losses from investments accounted for using the equity method | ||||
| Operating result after valuation (before promotional expense and IFRS effects) |
2,078 |
–385 |
1,693 |
Operating result after valuation | ||||
| Net other operating income (before promotional expense) |
18 |
–70 |
–52 |
Net other operating income or loss | ||||
| Economic result |
2,097 |
–455 |
1,641 |
Profit/loss from operating activities | ||||
| Promotional expense |
504 |
–504 |
0 |
– | ||||
| Taxes on income |
239 |
0 |
239 |
Taxes on income | ||||
| Consolidated profit before IFRS effects |
1,354 |
|
|
– | ||||
| IFRS effects from hedging | 48 | –48 | 0 | – | ||||
| Consolidated profit | 1,402 | 0 | 1,402 | Consolidated profit | ||||
At EUR 1,903 million, the Operating result before valuation (before promotional expense) reached the strong prior-year level (EUR 1,917 million) and was also well above the target (EUR 1,732 million).
At EUR 2,957 million, Net interest income (before promotional expense) exceeded the prior-year level (EUR 2,900 million) by 2% and the target (EUR 2,791 million) by 6%. One key factor driving the year-on-year increase was the renewed increase in income from borrowings, which was considerably above both the previous year’s figure and the target. KfW benefited from favourable funding conditions on the capital and money markets, which can be attributed to its excellent credit rating. Income from investment of own funds also increased significantly due to slightly higher interest rates and higher investment volumes compared to the previous year. Furthermore, there was a slight increase in interest margin income including commitment fees, which significantly exceeded expectations.
Net commission income (before promotional expense) amounted to EUR 685 million, which was slightly above the 2024 figure (EUR 675 million) and exceeded the target (EUR 664 million). The decisive factor here was commission income in the business sector Export and project finance, which rose by EUR 21 million to EUR 47 million, due in particular to loan fees, which were also below budget as a result. By contrast, there was a decline in income from cost-based remuneration that KfW received from the Federal Government for implementation of domestic promotional programmes and administration of Financial Cooperation. KfW generated income of EUR 346 million from the implementation of its domestic promotional programmes, compared to EUR 363 million in the previous year and a target of EUR 342 million. The year-on-year decrease in this income was primarily due to the decline in remuneration in the promotional priority area of energy efficiency and renewable energy, as well as education financing. KfW received income of EUR 258 million from the administration of Financial Cooperation within KfW Development Bank (2024: EUR 255 million). The remuneration from the Federal Government was offset in part by related administrative expenses.
19
KfW Financial Report 2025
Financial Report > Combined Management Report > Economic report
Administrative expense (before promotional expense) increased by 5% from EUR 1,658 million to EUR 1,739 million in financial year 2025. This trend is partly due to a one-off provision related to personnel, which meant that administrative expense slightly exceeded the planning assumptions (EUR 1,724 million). Personnel expense increased by 13% overall to EUR 1,088 million, compared to EUR 961 million in the previous year. The drop in non-personnel expense (before promotional expense) from EUR 697 million to EUR 652 million was due primarily to a decrease in the use of external service providers.
The development of the operating earnings components resulted in an overall cost-income ratio (before promotional expense) of 47.7%, which was higher than in the previous year (46.4%). Adjusted for income and expenses from products for which cost-based remuneration has been agreed with the Federal Government, the cost-income ratio for 2025 amounted to 36.3% (2024: 33.7%).
Due to persistent uncertainty in the geopolitical and macroeconomic environment, the result from risk provisions for lending business was a total expense of EUR 155 million overall (2024: net income of EUR 39 million). This result was nevertheless significantly better than the projected standard risk costs (EUR –457 million).
The negative development in provisions for individual risks that cannot be allocated is essentially due to two opposing effects. The negative effects from updating the segment monitor and from the adjustment of the second, more conservative macroeconomic scenario, which takes into account the increased economic and trade policy uncertainty, were partly offset by positive effects from various methodological refinements in the risk models. Risk provisions for performing loans (stages 1 and 2) were increased overall. This resulted in net expense of EUR 79 million (2024: net income of EUR 51 million).
Net additions of EUR 119 million (2024: EUR 50 million) were recorded in risk provisions for non-performing loans (stage 3), including direct write-offs, in 2025. Net additions of EUR 82 million (2024: EUR 98 million) were largely recorded by the business sector Mittelstandsbank & Private Kunden (SME Bank & Private Clients). Of this amount, EUR 79 million was attributable to education financing (2024: EUR 76 million). The business sector Export and project finance also recorded net additions of EUR 26 million (2024: net reversals of EUR 50 million).
Income from recoveries of loans previously written off totalled EUR 42 million and was therefore on a par with the previous year (EUR 43 million). This income related primarily to the Mittelstandsbank & Private
Kunden (SME Bank & Private Clients) business sector.
Risk provisions for lending business increased slightly in financial year 2025 to EUR 2.0 billion (31 Dec. 2024: EUR 1.9 billion). This development reflected both a slightly higher provision for acute risks in stage 3 of EUR 1.4 billion and a slightly higher overall provision for individual risks that cannot be allocated, with provisions in stages 1 and 2 amounting to EUR 0.5 billion in total.
Net gains/losses from other financial instruments at fair value before IFRS effects amounted to EUR 258 million (2024: EUR 102 million). This result was affected by positive valuation effects from the equity investment portfolio and a positive foreign currency result.
The equity investment portfolios recognised at fair value through profit or loss generated total income of EUR 107 million in financial year 2025 (2024: EUR 129 million). KfW Capital made the biggest contribution to earnings at EUR 210 million, compared with EUR 33 million in the previous year. KfW Development Bank, the business sector Individualfinanzierung & Öffentliche Kunden (Customised Finance & Public Clients) and Head office also performed positively, with EUR 47 million (2024: EUR 13 million), EUR 29 million (2024: expense of EUR 2 million) and EUR 13 million (2024: expense of EUR 3 million), respectively. By contrast, DEG reported a negative valuation result of EUR 187 million (2024: income of EUR 81 million), with the net gain from securities of EUR 102 million (2024: expense of EUR 53 million) being offset by a wide margin by negative exchange rate effects of EUR 289 million, particularly associated with the weaker US dollar. The business sector Export and project finance reported an expense of EUR 5 million from valuations of equity investments, as against income of EUR 8 million in the previous year.
20
KfW Financial Report 2025
Financial Report > Combined Management Report > Economic report
KfW Group achieved a positive result of EUR 133 million from the valuation of foreign currency positions in financial year 2025, EUR 178 million of which related to the valuation of hedging instruments for DEG’s investments held in foreign currencies.
The measurement of securities at fair value through profit or loss yielded an almost balanced result, as in the previous year, of EUR 0 million.
Net losses totalling EUR 9 million were recorded from securities and investments and from investments accounted for using the equity method (2024: gains of EUR 19 million). EUR 6 million of these losses are attributable to investments accounted for using the equity method. Performance at KfW Capital was particularly responsible for this, with a loss of EUR 26 million. Head office and KfW Development Bank reported gains (EUR 14 million and EUR 6 million, respectively). In addition, an expense of EUR 4 million arose from general valuation allowances recognised on securities not measured at fair value.
In the case of securities not carried at fair value, developments in the financial markets resulted in a net difference of EUR 54 million between the carrying amount and the fair value (2024: EUR –167 million). This development is partly attributable to increases in the value of covered bonds.
Net other operating income (before promotional expense) was EUR 18 million, similar to the previous year’s figure.
Developments in the operating result and the result from valuations, including other operating income (EUR 113 million, 2024: EUR 179 million), led to an economic result of EUR 2,016 million (2024: EUR 2,097 million). The slight decline in the economic result is mainly attributable to the EUR 67 million decrease in the valuation result.
At EUR 468 million in 2025, KfW’s domestic promotional expense, which has a negative impact on KfW Group’s earnings position, was down slightly on the prior-year level (EUR 504 million) but nevertheless marginally exceeded projections (EUR 457 million). The ERP promotional business proportion of promotional expense amounted to EUR 298 million.
Interest rate reductions are the key component of KfW’s promotional expense. KfW grants these reductions for certain domestic promotional loans during the first fixed-interest-rate period, which has a negative effect on its earnings position. In addition, KfW passes on its favourable funding conditions, which benefit from its triple-A rating. At EUR 421 million, the volume of interest rate reductions increased once again in financial year 2025 (2024: EUR 406 million) and was in line with the projected figure (EUR 420 million). Of this amount, EUR 280 million (2024: EUR 276 million) was attributable to ERP promotional business. The main reason behind the increase in interest rate reductions was the rise in demand for promotional loans at reduced rates, coupled with lower reduction margins. Interest rate reductions from new business focused on the priority areas start-ups and corporate investment, innovation, and energy efficiency and renewable energy. The increase in interest rate reductions contributed to the growth of promotional business volume in the core promotional business to EUR 96.9 billion (2024: EUR 79.6 billion).
Net other operating income in financial year 2025 included promotional expense of EUR 18 million from KfW’s commitment to future digital education projects in the context of TUMO learning centres. No promotional expense was reported in 2025 for promotional grants provided in addition to the lending business (2024: EUR 70 million). This is because, unlike in previous years, KfW did not enter into any commitments to award grants under the ERP promotional programmes in the reporting year. The interest accrued on provisions recognised for commitments entered into in previous years resulted in promotional expense of EUR 5 million.
Moreover, promotional expenses reported in net commission income and administrative expense amounted to EUR 25 million (2024: EUR 26 million). Among other things, this spending was aimed at the sale of KfW’s promotional products.
21
KfW Financial Report 2025
Financial Report > Combined Management Report > Economic report
The group recognised a tax expense of EUR 189 million for financial year 2025 (2024: EUR 239 million). This consisted of current taxes on income of EUR 149 million (2024: EUR 167 million) and deferred tax expense of EUR 41 million (2024: EUR 72 million). The retroactive tax exemption of DEG as of 1 January 2024 reduced both current and deferred tax expenses. Current taxes in 2025 were attributable primarily to the results of KfW IPEX-Bank.
The development of the earnings position led to consolidated profit before IFRS effects of EUR 1,359 million, which is on par with the previous year (EUR 1,354 million) and significantly above the long-term earnings potential of EUR 1 billion. This development can be explained primarily by the strong operating result before valuation and the positive, albeit declining, valuation result from the loan and equity investment portfolio. The slightly lower promotional expense and reduced tax expense contributed to the increase in earnings.
Consolidated profit before IFRS effects from hedging excludes effects from derivative financial instruments that the group uses exclusively for hedging purposes. Under IFRS, the requirements for the recognition and valuation of derivatives and hedges give rise, despite the economically hedged positions, to temporary net gains or losses that are offset over the entire term of the transactions. Against this backdrop, IFRS effects from hedging relationships amounting to EUR –356 million (2024: EUR 48 million) were eliminated from the earnings figure relevant for management purposes. These effects include the results from hedge accounting and from the measurement of borrowings recognised at fair value, including hedging derivatives entered into for this purpose. The negative IFRS effects in 2025 resulted from the reversal of the positive valuation effects from previous years (amortisation/pull-to-par). In addition, negative valuation effects due to interest rate developments, that cannot be fully reflected in hedge accounting in the statement of financial position, are reflected in the IFRS effects.
Overall, the group generated a consolidated profit of EUR 1,002 million, which is below the previous year (EUR 1,402 million) but in line with expectations (EUR 1,008 million).
Development of net assets of KfW Group
Lending to banks and customers accounted for 80% of the group’s assets as of 31 December 2025, unchanged from the previous year.
Assets of KfW Group
31 December 2025 (31 Dec. 2024)
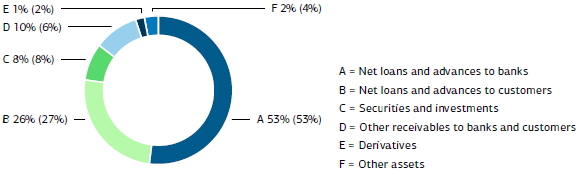
|
Compared to the previous year, the volume of lending decreased by EUR 13.0 billion to EUR 580.5 billion (31 Dec. 2024: EUR 593.5 billion).
22
KfW Financial Report 2025
Financial Report > Combined Management Report > Economic report
Volume of lending of KfW Group
|
|
31 Dec. 2025 |
31 Dec. 2024 | ||||||||
|
|
EUR in millions | EUR in millions | ||||||||
| Loans and advances |
431,948 | 441,915 | ||||||||
| Risk provisions for lending business |
–1,887 | –1,818 | ||||||||
| Net loans and advances |
430,061 | 440,097 | ||||||||
| Contingent liabilities from financial guarantees |
3,276 | 3,462 | ||||||||
| Irrevocable loan commitments |
136,298 | 138,628 | ||||||||
| Loans and advances held in trust | 10,887 | 11,287 | ||||||||
|
|
||||||||||
| Total | 580,522 | 593,475 | ||||||||
Net loans and advances decreased by EUR 10.0 billion in 2025, mainly due to the decline of EUR 5.9 billion in the coronavirus special programme 2020, particularly in the KfW Entrepreneur Loan, KfW Entrepreneur Loan – SMEs and KfW Instant Loan 2020 programmes, and in the Energy-efficient Construction and Refurbishment loan programmes in the amount of EUR 5.4 billion. Overall, unscheduled repayments (EUR 12.2 billion; 31 Dec. 2024: EUR 11.1 billion) and scheduled repayments more than compensated for disbursements in new lending business. At EUR 430.1 billion, Net loans and advances accounted for 74% of lending volume.
Contingent liabilities from financial guarantees remained at the previous year’s level, at EUR 3.3 billion. The decline in irrevocable loan commitments of EUR 2.3 billion to EUR 136.3 billion was mainly due to irrevocable commitments for liquidity support to energy suppliers in the amount of EUR –8.7 billion. On the other hand, there was an increase in irrevocable loan commitments as part of the Renewable Energy – Standard programme in the amount of EUR 6.1 billion. Within assets held in trust, the volume of Loans and advances held in trust, which primarily comprise loans to promote developing countries and emerging economies financed by budget funds provided by the Federal Republic of Germany, was down slightly to EUR 10.9 billion (31 Dec. 2024: EUR 11.3 billion).
Other loans and advances to banks and customers posted an increase of EUR 19.2 billion to EUR 52.1 billion. A total of EUR 13.7 billion of the increase resulted from reverse repo transactions, in which KfW acts in the capacity of lender, and from higher cash collateral provided from the derivatives business of EUR 4.2 billion.
At EUR 43.3 billion, the total amount of securities and investments was at the previous year’s level.
Securities and investments of KfW Group
|
|
31 Dec. 2025 |
31 Dec. 2024 | ||||||||
|
|
EUR in millions | EUR in millions | ||||||||
| Bonds and other fixed-income securities |
37,734 | 37,982 | ||||||||
| Shares and other non-fixed income securities |
0 | 0 | ||||||||
| Equity investments |
5,503 | 5,031 | ||||||||
| Shares in non-consolidated subsidiaries | 96 | 92 | ||||||||
|
|
||||||||||
| Total | 43,332 | 43,106 | ||||||||
The securities portfolio decreased by EUR 0.2 billion to EUR 37.7 billion in financial year 2025 (31 Dec. 2024: EUR 38.0 billion). The portfolio of Equity investments, including both direct and fund investments, and Shares in non-consolidated subsidiaries increased by EUR 0.5 billion to EUR 5.6 billion in 2025. This was mainly due to portfolio growth at KfW Capital.
23
KfW Financial Report 2025
Financial Report > Combined Management Report > Economic report
Value adjustments from macro hedge accounting rose by EUR 1.1 billion, largely due to interest rates, from EUR –9.4 billion to EUR –10.4 billion. Derivatives with positive fair values, which are primarily used to hedge refinancing transactions, fell from EUR 9.7 billion in the previous year to EUR 3.8 billion. This was primarily due to value adjustments of derivatives used in micro hedge accounting, which decreased from EUR 6.6 billion to EUR 1.3 billion.
KfW reduced its balances with central banks by EUR 7.0 billion to EUR 19.5 billion and made greater use of other investments, such as reverse repos and term deposits. Furthermore, the increase in credit support annex collateral furnished and the reduction in capital market liquidity were only partially offset by higher money market refinancing via commercial paper. The liquidity held continues to ensure KfW’s ability to react to market events at short notice. There were only minor changes in the other asset line items in the statement of financial position.
Development of the KfW Group financial position
KfW Group’s funding strategy is based on four main product categories: “benchmark programmes in euros and US dollars”, “Green Bonds – Made by KfW”, “other public bonds” and “private placements”. In 2025, KfW achieved a funding volume of EUR 71.0 billion on the international capital markets. This slightly exceeded the funding target of EUR 65–70 billion planned for 2025.
Financial position of KfW Group
31 December 2025 (31 Dec. 2024)
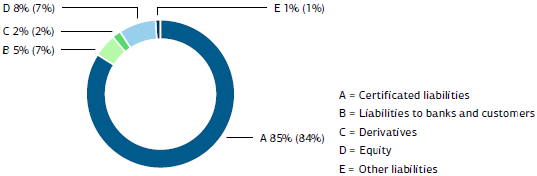
Borrowings decreased by EUR 6.9 billion to EUR 486.1 billion.
Borrowings of KfW Group
|
|
31 Dec. 2025 |
31 Dec. 2024 | ||||||||
|
|
EUR in millions | EUR in millions | ||||||||
| Short-term funds |
54,995 | 33,947 | ||||||||
| Bonds and notes |
406,707 | 422,994 | ||||||||
| Other funding | 24,351 | 36,042 | ||||||||
|
|
||||||||||
| Total | 486,054 | 492,983 | ||||||||
24
KfW Financial Report 2025
Financial Report > Combined Management Report > Economic report
Funds raised in the form of certificated liabilities rose by EUR 5.1 billion to EUR 460.6 billion. The increase of EUR 21.4 billion was attributable to short-term issues of commercial paper, which amounted to EUR 53.9 billion (31 Dec. 2024: EUR 32.5 billion). Medium and long-term bonds and notes, which remain the group’s principal source of funding, fell by EUR 16.3 billion. At year-end 2025, such funds amounted to EUR 406.7 billion (31 Dec. 2024: EUR 423.0 billion) and accounted for 84% of borrowings. Total short-term funds, including demand deposits and term deposits, amounted to EUR 55.0 billion, compared with EUR 33.9 billion in the previous year. The funding requirements for these programmes decreased due to loan repayments as part of the liquidity support to energy suppliers and the coronavirus special programme 2020. This largely resulted in a decline in Other funding by EUR 11.7 billion to EUR 24.4 billion (31 Dec. 2024: EUR 36.0 billion). This item mainly comprises promissory note loans by customers, which decreased by EUR 8.4 billion to EUR 16.3 billion, primarily due to funding via the Economic Stabilisation Fund (“WSF”). The cash collateral received, which primarily serves to reduce counterparty risk from the derivatives business, fell from EUR 4.5 billion in the previous year to EUR 1.2 billion.
The carrying amounts of derivatives with negative fair values, which were primarily used to hedge own issues, increased by EUR 1.3 billion, from EUR 9.3 billion as of 31 December 2024, largely due to changes in market parameters, and amounted to EUR 10.6 billion at year-end 2025.
There were only minor changes in the other liability line items of the statement of financial position.
At EUR 40.6 billion as of 31 December 2025, equity was EUR 1.1 billion above the level of EUR 39.6 billion as of 31 December 2024. The increase resulted in particular from consolidated profit (EUR 1.0 billion), which in turn increased retained earnings. Furthermore, the increase in the discount rate for pension obligations from 3.49% to 4.08% generated an increase of EUR 0.1 billion in revaluation reserves. The equity ratio increased year on year from 7.3% to 7.5% as of 31 December 2025, primarily due to the increase in equity.
Equity of KfW Group
|
|
31 Dec. 2025 |
31 Dec. 2024 | ||||||||
|
|
EUR in millions | EUR in millions | ||||||||
| Paid-in subscribed capital |
3,300 | 3,300 | ||||||||
| Capital reserve |
8,447 | 8,447 | ||||||||
| Reserve from the ERP Special Fund |
1,191 | 1,191 | ||||||||
| Retained earnings |
27,555 | 26,552 | ||||||||
| Revaluation reserves | 131 | 83 | ||||||||
|
|
||||||||||
| Total | 40,623 | 39,573 | ||||||||
25
KfW Financial Report 2025
Financial Report > Combined Management Report > Risk report
Risks are reported at group level in accordance with KfW Group’s internal risk management. The key risk indicators are presented below:
Regulatory capital ratios
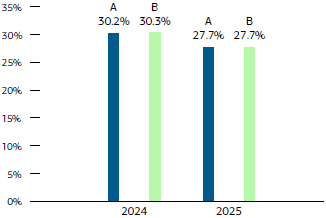
|
The marked decline in the total capital ratio by around 2.5 percentage points year on year is attributable to the significant increase of EUR 14.1 billion in the total risk exposure amount (“RWA”). This decrease resulted primarily from new business as well as the implementation of CRR III in Q1 2025 (in particular the change of measurement approach from A-IRB to F-IRB for banks and large corporates and adjusted risk weighting for equity investments. | |
| A = Tier 1 capital ratio B = Total capital ratio |
Economic risk-bearing capacity
EUR in billions
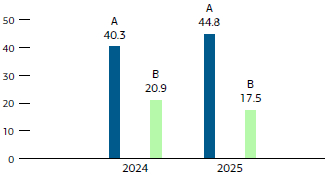
|
Economic risk-bearing capacity was maintained at a confidence level of 99.9% at all times during the reporting year. The increase in available financial resources (“AFR”) was primarily due to the positive annual result and refinements in methodology. The total capital requirement decreased, largely as a result of the lower capital requirement for credit risks following those refinements in methodology. | |
| A = Available financial resources B = Total economic capital requirement |
26
KfW Financial Report 2025
Financial Report > Combined Management Report > Risk report
Credit risk
2025 (2024), Net exposure breakdown
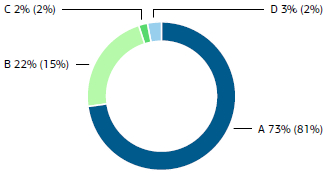
|
The revision of the risk model for collateralised on-lending business (see “Current developments”) resulted in a significant decline in net exposure of the on-lending banks with an investment grade rating, and thus also in total net exposure. This decline caused an increase in the relative share of the other rating classes in the credit rating distribution even though no substantive developments could be identified.
| |
| A = Investment grade B = Non-Investment grade C = Watch list D = Default |
Market price risk
2025 (2024), ECAP (EUR in billions)
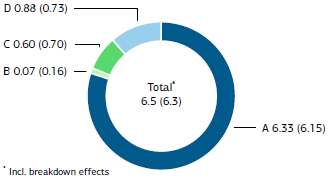
|
The total capital requirement for market price risks increased year on year. This was primarily attributable to the higher economic capital requirement (“ECAP”) requirement for interest and credit spread risk. The increase in interest risk, in turn, was due largely to the expansion of strategic interest risk positions. As regards credit spread risk, the higher market volatility and the exclusion of credit spreads in the measurement of pension provisions resulted in increased risk.
| |||
| A = Interest risk | B = Interest volatility risk | |||
| C = Currency risk | D = Credit spread risk | |||
Liquidity risk
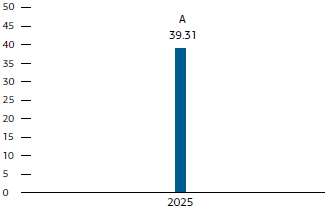
|
The liquidity risk indicator remained considerably below the internal limit throughout the year. Liquidity risk was measured based on a refined liquidity risk model as of year-end. The minimum excess coverage in the relevant stress scenario showed excess coverage of approximately EUR 39.31 billion as of 31 December 2025. | |
| (Prior-year figures not provided due to refinement of liquidity risk model / transition to excess coverage) | A = Liquidity risk indicator (worst case) | |
27
KfW Financial Report 2025
Financial Report > Combined Management Report > Risk report
Operational risk
ECAP (EUR in millions)
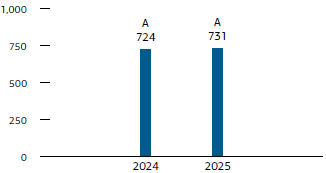
|
The ECAP for operational risks was virtually unchanged year on year. | |
|
A = ECAP |
In financial year 2025, as in previous years, KfW Group refined the processes and instruments of its risk management and controlling, taking into account current banking supervisory requirements. The multi-stage refinement of the economic risk-bearing capacity calculation using the present value approach is now complete, following, in particular, the transition of discounting to risk-free curves as regards available financial resources and credit risk measurement. The adjusted provisions of CRR III were applied with respect to credit and equity investment risk. As with the calculation of available financial resources, there was also a transition to risk-free curves for present-value measurement of market price risk. The liquidity risk measurement method was also refined in 2025. This refinement involved both a revision of scenarios and the introduction of a new metric for liquidity risk indicators. While excess coverage and shortfalls had previously been reported as relative values, they will be stated in absolute EUR amounts going forward.
The Non-Financial Risk (NR) department was established as of 1 April 2025 with the aim of bundling and reinforcing the management of non-financial risks. Non-financial risks, in particular cybersecurity, data protection and operational and reputational risks, are gaining in importance in light of increasing digitalisation and new regulatory requirements such as the EU Digital Operational Resilience Act (“DORA”). The NR department combines relevant functions such as operational risk, ICT risk, third-party management, data protection, information security and business continuity management. This serves to further optimise risk management and sustainably improve resilience in the face of growing challenges.
Management of environmental, social and governance risks (“ESG risks”) was further developed in the line units of KfW Group following completion of the group’s tranSForm project at the end of 2024, to address the comprehensive new regulatory requirements on ESG risks. The integration of ESG risk drivers into existing risk management cycle instruments remains a focal point. A comprehensive ESG materiality assessment involved examining ESG risk drivers in credit and equity investment risk in three periods (short, medium and long term) for the first time. In addition, thresholds for defined ESG credit risk indicators (“ESG CRIs”) have been monitored since 2025. The counterparty-related ESG risk profile used to identify and measure ESG risk drivers in credit risk was expanded in 2025 to include assessment of location-based physical climate and environmental risks for corporates. A particular focus was placed on biodiversity, including biodiversity-related risks, as part of the bioSFer project initiated in 2025.
The risk model for the on-lending business was simplified in the reporting year. Going forward, a reduced fixed loss given default compared with the previous measurement will be applied to loans and advances secured by assignment of end borrower loans. This simplification is based on the resolution regime of the Bank Recovery and Resolution Directive (“BRRD”). Under the BRRD, secured liabilities of institutions under resolution are not included in the bail-in cascade. As a result, KfW is protected from loss.
Compliance with the Basel Committee on Banking Supervision’s standard number 239 (commonly referred to as BCBS 239), including the specifications of the Risk Data Aggregation and Risk Reporting (“RDARR”) Guide, has been improved under KfW’s RDARR project, which was initiated throughout the group in 2025. This in turn optimises KfW Group’s data quality and reporting.
28
KfW Financial Report 2025
Financial Report > Combined Management Report > Risk report
Basic principles and objectives of risk management
KfW Group has a statutory promotional mandate. Sustainable promotion is KfW Group’s overarching purpose. The aim of risk management is for the group to take risks only to the extent that they appear manageable in the context of its current and anticipated earnings position and capital resources. KfW Group’s risk/return management takes into account the business model of a promotional bank without the primary intention of generating a profit and without a trading book, with appropriate implementation of supervisory requirements constituting a fundamental prerequisite for the group’s business activities.
The promotional bank business model determines the group’s risk culture with its four regulatory-based elements: leadership culture, responsibilities, communication and incentives. Incentive structures for employees and their responsibilities are designed accordingly. Senior management specifies the desired code of conduct, with the desired dialogue established by means of communication with and through the relevant bodies.
Organisation of risk management and monitoring
Risk management bodies and responsibilities
KfW’s Executive Board sets the group’s risk guidelines as part of its overall responsibility. The Board of Supervisory Directors is informed at least quarterly of KfW Group’s risk situation. The Risk and Credit Committee set up by the Board of Supervisory Directors is primarily responsible for advising the Board of Supervisory Directors about the group’s current and future overall risk tolerance and strategy and supports it in monitoring the implementation of the latter. The Committee decides on loan approvals (including loans to members of management), operational level equity investments, funding and swap transactions, where committee authorisation is required by the KfW Bylaws. The Audit Committee monitors, above all, the accounting process and the effectiveness of the risk management system and internal control and offers recommendations to the Board of Supervisory Directors concerning its approval of KfW’s annual and consolidated financial statements.
Additionally, the subsidiaries and organisational entities of KfW Group exercise their own control functions within the group-wide risk management system. Group-wide regulations, projects and working groups are in place to implement a consistent approach, such as in the rollout of rating instruments to subsidiaries or in the management and valuation of collateral. Responsibility for developing and structuring risk management and risk control activities is located outside the front-office departments and lies in particular with the Risk Controlling, Non-Financial Risk and Credit Risk Management areas.
Risk management within the group is carried out by various interconnected decision-making bodies. At the top of the system is the Executive Board, which takes key decisions on risk policy. There are three risk committees below Executive Board level (Credit Risk Committee, Market Price Risk Committee and Non-Financial Risk Committee) that prepare decisions for the Executive Board, take their own decisions within their remits, and also involve representatives from KfW subsidiaries in decision-making processes.1) Internal Auditing has a fundamental right to attend risk management committee meetings. Working groups such as the Credit and Equity Investment Risk Working Group, Country Rating Working Group, Corporate Sector Risk Working Group, Market Price Risk Working Group and Hedge Committee support the committees. Committee resolutions are adopted by simple majority, whereby the rules on voting eligibility take appropriate account of the requirements of the respective roles and the independence of the Risk Controlling and front and back office departments in particular. Escalation to Executive Board level is possible in all committees.
| 1) | Because ESG risks factor into a variety of different risk types, there is no separate ESG risk committee. |
| ESG risks are managed as needed through the committees responsible for specific risk types. |
29
KfW Financial Report 2025
Financial Report > Combined Management Report > Risk report
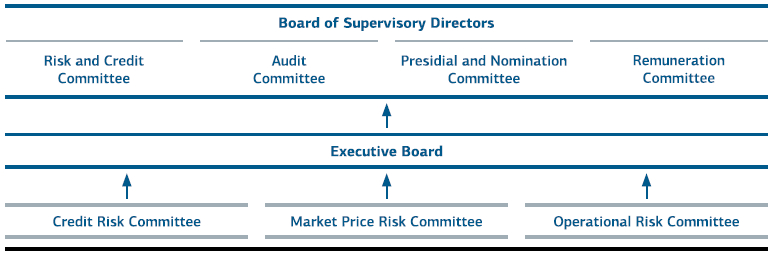
The Credit Risk Committee is a decision-making and discussion body for lending decisions as well as for overarching loan portfolio and credit risk issues. The Credit Risk Committee is chaired by the Chief Risk Officer.
The weekly meetings of the Credit Risk Committee involve making lending decisions and preparing for decisions to be made by the plenary Executive Board in line with the credit approval policy, with KfW subsidiary exposures also being presented. Voting members of the committee are, in addition to KfW Group’s Chief Risk Officer (“CRO”), the Head of Credit Risk Management, members of the Executive Board with front-office responsibilities and KfW IPEX-Bank’s Chief Risk Officer. DEG’s CRO is a member without voting rights. In addition, current developments in and management tools for the loan portfolio as well as fundamental issues concerning credit risk management are analysed on an ad hoc basis. This includes reports and submissions from the Country Rating Working Group and the Corporate Sector Risk Working Group. DEG’s CRO, the managing director of KfW Capital responsible for risk issues and the Head of Risk Controlling are also entitled to vote on matters relating to the loan portfolio and general credit risk management issues.
Moreover, once a month, the Credit Risk Committee discusses overarching credit risk issues of risk controlling and makes decisions on significant adjustments in accordance with the competency matrix. These essentially include reports and draft resolutions on the risk situation and risk management – in particular on stress tests for credit and equity investment risks – as well as on credit risk methods and policies, and the submissions addressed in the Credit and Equity Investment Risk Working Group. Reports are also made on the development of regulatory requirements, their impact and the progress of implementation projects in KfW Group. Only the CRO and the Head of Risk Controlling are entitled to vote on these issues relating to the risk controlling function.
The Credit Risk Committee is supported by various working groups. The Country Rating Working Group serves as the central unit for assessing country risk. The Credit and Equity Investment Risk Working Group supports the committee in connection with methodological and procedural issues and decisions relating to credit and equity investment risk measurement instruments and rating systems, and collateral acceptance and valuation, in particular the (further) development of methods used, implementation of regulatory requirements, acknowledgement of validation results and adjustments to the relevant processes. The Corporate Sector Risk Working Group is a group-wide expert panel which analyses sector and product-related credit risks in the corporate segment. The decisions made, reports submitted, and other key topics addressed in the working groups are communicated to the Credit Risk Committee through the working group minutes.
30
KfW Financial Report 2025
Financial Report > Combined Management Report > Risk report
The Market Price Risk Committee meets monthly or on an ad hoc basis, as required, and is chaired by the Chief Risk Officer. In addition to the Chief Risk Officer, the members of the Executive Board responsible for capital markets business and finance are also represented. The members of the committee also include the heads of Risk Controlling, Financial Markets, Finance, Transaction Management and the CROs of KfW IPEX-Bank and DEG. The Market Price Risk Committee discusses KfW Group’s market price and liquidity risk position and assesses the market price risk strategy on a monthly basis. The committee also decides on questions relating to the principles and methods applied for the management of market price and liquidity risks, on funding, transfer pricing and on valuation for commercial transactions. The Market Price Risk Committee is supported by the Hedge Committee and the Market Price Risk Working Group. The Hedge Committee deals primarily with the earnings effects of IFRS hedge accounting and the further development thereof. The Market Price Risk Working Group deals with methodology issues relating to market price and liquidity risks as well as measurement issues. These include matters relating to model development, validation and financial reporting measurement, in particular, taking note of validation reports and recommendations resulting from validation. A distinction is made between voting rights relating to different subject areas, with decisions on risk controlling issues made without the votes of the front and back offices.
The Non-Financial Risk Committee, which meets quarterly, supports the Executive Board in the cross-functional management and the necessary decisions and acknowledgements with respect to operational and reputational risk. The Chief Risk Officer chairs the meetings of the Non-Financial Risk Committee. In principle, all areas of the bank are represented in the committee – in selected cases based on a representation concept. Moreover, the managing director level of KfW IPEX-Bank, DEG and KfW Capital is represented on the committee. The committee discusses the risk status on the basis of findings obtained through different methods and instruments and evaluates any group-wide need for action, with the aim of adequate risk management. This includes addressing risks associated with the use of information and communication technologies (“ICT”) risks pursuant to DORA. The results of the validation of the operational risk (OpRisk) model are acknowledged. The committee meeting documents, together with the minutes and the resolutions and recommendations contained therein, are submitted to the Executive Board. A distinction is made between voting rights relating to different subject areas, with decisions on risk controlling issues made without the votes of the front and back offices. The committee formed the Group Security Board (“GSB”) to take up matters related to group security and business continuity management (“BCM”).
31
KfW Financial Report 2025
Financial Report > Combined Management Report > Risk report
Risk management approach of KfW Group (overview)
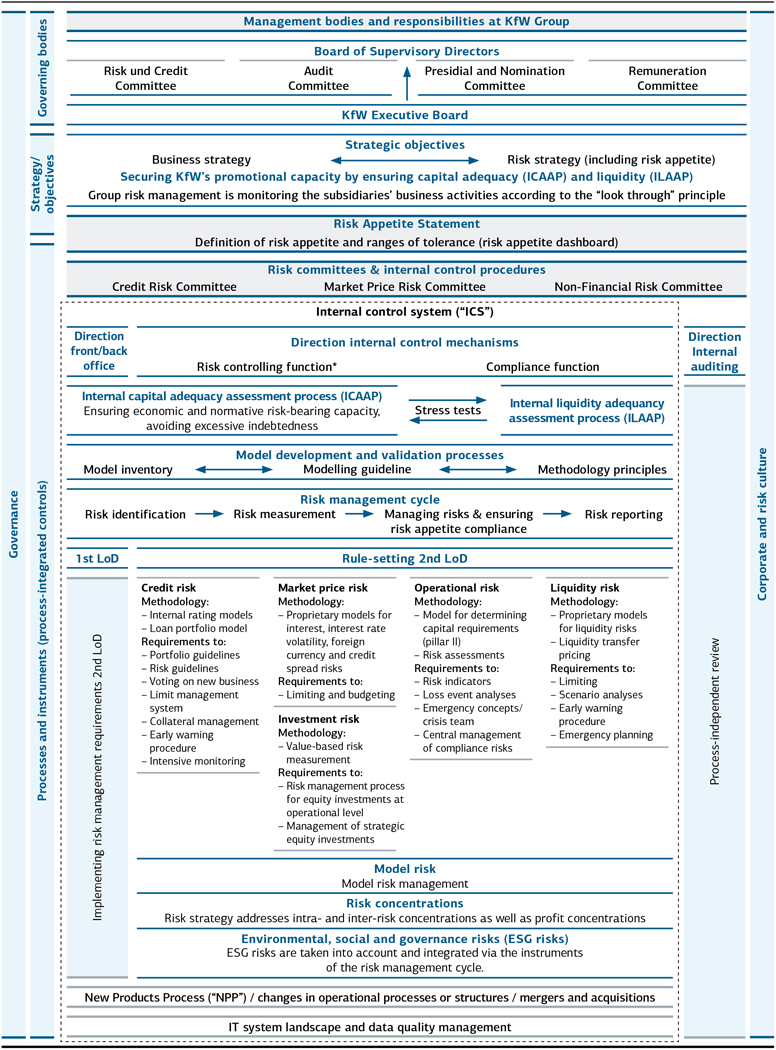
* The risk controlling function is performed by the Risk Controlling and the Non-Financial Risk Departments.
Management bodies and responsibilities at KfW Group Board of Supervisory Directors Risk und Credit Audit Presidial and Nomination Remuneration Committee Committee Committee Committee KfW Executive Board Strategic objectives Business strategy Risk strategy (including risk appetite) Securing KfW’s promotional capacity by ensuring capital adequacy (ICAAP) and liquidity (ILAAP) Group risk management is monitoring the subsidiaries’ business activities according to the “look through” principle Risk Appetite Statement Definition of risk appetite and ranges of tolerance (risk appetite dashboard) Risk committees & internal control procedures Credit Risk Committee Market Price Risk Committee Non-Financial Risk Committee Internal control system (“ICS”) Direction Direction Direction internal control mechanisms front/back Internal office Risk controlling function* Compliance function auditing Internal capital adequacy assessment process (ICAAP) Internal liquidity adequancy Ensuring economic and normative risk-bearing capacity, Stress tests assessment process (ILAAP) avoiding excessive indebtedness Model development and validation processes Model inventory Modelling guideline Methodology principles culture Risk management cycle risk Risk identification Risk measurement Managing risks & ensuring Risk reporting risk appetite compliance and 1st LoD Rule-setting 2nd LoD Credit risk Market price risk Operational risk Liquidity risk Corporate Methodology: Methodology: Methodology: Methodology: – Internal rating models – Proprietary models for – Model for determining – Proprietary models – Loan portfolio model interest, interest rate capital requirements for liquidity risks LoD Requirements to: volatility, foreign (pillar II) – Liquidity transfer – Portfolio guidelines currency and credit – Risk assessments pricing 2nd – Risk guidelines spread risks Requirements to: Requirements to:review – Voting on new business Requirements to: – Risk indicators – Limiting – Limit management – Limiting and budgeting – Loss event analyses – Scenario analyses system Investment risk – Emergency concepts/ – Early warning – Collateral management Methodology: crisis team procedure – Early warning – Central management – Emergency planning independent requirements procedure – Value-based risk of compliance risks - – Intensive monitoring measurement Requirements to: Process – Risk management process for equity investments at management operational level – Management of strategic risk equity investments Model risk Model risk management Implementing Risk concentrations Risk strategy addresses intra- and inter-risk concentrations as well as profit concentrations Environmental, social and governance risks (ESG risks) ESG risks are taken into account and integrated via the instruments of the risk management cycle. New Products Process (“NPP”) / changes in operational processes or structures / mergers and acquisitions IT system landscape and data quality management
32
KfW Financial Report 2025
Financial Report > Combined Management Report > Risk report
To ensure capital and liquidity adequacy in line with the defined risk appetite, Risk Controlling supports the Executive Board in developing and implementing the group’s risk strategy together with the relevant subsidiaries, KfW IPEX-Bank, DEG and KfW Capital.
The risk strategy translates the group’s long-term and strategic risk objectives into operational risk management requirements. This involves defining risk management objectives for core business activities and measures for achieving targets, as well as determining KfW Group’s appetite for material risks.
In order to determine its material risks, KfW Group conducts a risk inventory at least once a year. The risk inventory identifies and defines types of risks relevant to the group and then subjects them to a materiality evaluation. The materiality of a risk type depends on the potential material danger for KfW Group’s net assets, earnings and liquidity. The key outcome of the risk inventory is an overall risk profile, which provides an overview of KfW Group’s material and immaterial risk types. The 2025 inventory determined that KfW Group continues to face the following material risks: credit, market price, operational, equity investment, model and liquidity risks. In addition, the risk inventory process involves looking at the impact of ESG risks on the overall risk profile.
The Executive Board is informed about KfW Group’s risk situation on a monthly basis. In addition, there is weekly reporting on market price and liquidity risks to the responsible Executive Board members. A risk report is issued quarterly to KfW Group’s supervisory bodies. The respective bodies are informed on an ad hoc basis as required.
The models used for group-wide risk measurement and management, as well as for financial reporting measurement, are regularly validated and refined where necessary. These primarily include the models for measuring and managing credit, equity investment, market price, liquidity and operational risks, as well as the models for financial reporting measurement.
The risk management approach is set out in the group’s procedural rules. The procedural rules stipulate the framework for the application of uniform policies and procedures to identify, measure, control and monitor risk. The rules and regulations laid out in the procedural rules are binding for the entire group and are accessible to employees through their publication on the intranet. KfW group-wide regulations are supplemented by rules specific to each business sector. See the following sections for details on other elements of KfW Group’s risk management approach.
Internal capital adequacy assessment process
The objective of the internal capital adequacy assessment process (“ICAAP”) is to maintain sufficient capital at all times to cover the risks assumed. Capital adequacy is assessed from both a normative and an economic perspective. The two perspectives are closely interwoven and ultimately flow into a holistic and consistent risk management system that ensures achievement of the common objective of continued business operations through the bidirectional flow of information. The overarching ICAAP architecture also includes the performance of stress tests to assess the group’s risk-bearing capacity under adverse conditions. The aforementioned ICAAP components are presented in the following sections.
In particular, the normative perspective of ICAAP is intended to ensure continuous compliance with the regulatory capital requirements of Pillar I in accordance with the Capital Requirements Regulation (“CRR”) and the German Banking Act (Kreditwesengesetz – “KWG”) both on an ongoing basis and in a longer-term view (normative capital planning). In addition to a base scenario, adverse scenarios (downturn and stress scenarios) are considered. In these adverse scenarios, deviations from the base scenario are determined and projected for the planning period. This procedure also takes into account the simultaneous materialisation of losses from the material risk types identified as part of the risk inventory, which may result in lower regulatory capital. This includes, in particular, risks that do not have to be explicitly backed with capital under Pillar I, such as interest risk. Furthermore, an increase in RWA is assumed along with adverse scenarios.
33
KfW Financial Report 2025
Financial Report > Combined Management Report > Risk report
The multi-year capital planning process is based on the strategic objectives defined as part of group business sector planning and is updated quarterly and ad hoc, as necessary, in terms of assumptions and market parameters. The development of the large exposure limit and the leverage ratio are monitored as further structural capital requirements. This is intended to enable early identification of any capital bottlenecks.
The economic perspective of the ICAAP serves to safeguard the economic assets of the institution in order to protect creditors from economic loss, thereby implementing Pillar 2 of the CRR. This is performed by comparing AFR as of a key date with the risk assumed as of the same date (ECAP for all material risks to capital) and monitored by the control variables of the economic coverage ratio, i.e., the quotient of AFR and ECAP. Both AFR and risk figures are stated at present value and are static (determined at a specific point in time, i.e., they do not take into account new business or periodicity). The risk figures cover all material risks to capital in accordance with the risk inventory (overall risk profile), to the extent that these can be reasonably covered by capital. The amount of economic capital required, and thus the security level of the risk-bearing capacity, is largely determined by the solvency level (99.90%) selected for risk measurement. There is no regular forecast of economic risk-bearing capacity, although an indicative forecast of economic risk-bearing capacity may be produced if necessary, if future developments which may have a material impact on risk-bearing capacity are identified through a list of questions.
Similar to the normative perspective, the economic perspective of the ICAAP also includes regularly performed stress tests in the form of simulations of adverse economic conditions (downturn and stress scenario).
A traffic light system set up in the context of the key date or base scenario and the adverse scenarios with thresholds for the key indicators relating to normative and economic risk-bearing capacity indicates a need for action as part of operational and strategic management in the event of critical developments.
The ICAAP is subject to an annual review of its adequacy. The results of this review are taken into account in the assessment of risk-bearing capacity.
As of 31 December 2025, risk-bearing capacity is stated in terms of both the normative and the economic perspective:
Normative risk-bearing capacity
Key regulatory figures
|
|
31 Dec. 2025 |
31 Dec. 2024 | ||||||||
|
|
EUR in millions | EUR in millions | ||||||||
| Total risk exposure in accordance with Art. 92 CRR |
140,269 | 126,183 | ||||||||
| – Credit and equity investment risk |
129,225 | 118,402 | ||||||||
| – Market price risk |
2,448 | 1,848 | ||||||||
| – Operational risk |
8,597 | 5,933 | ||||||||
| Regulatory capital |
38,888 | 38,189 | ||||||||
| – (Common equity) tier 1 capital |
38,888 | 38,104 | ||||||||
| – Additional tier 1 capital |
0 | 0 | ||||||||
| – Tier 2 capital |
0 | 86 | ||||||||
| CET1 ratio |
27.7% | 30.2% | ||||||||
| Tier 1 capital ratio |
27.7% | 30.2% | ||||||||
| Total capital ratio | 27.7% | 30.3% | ||||||||
Within credit risk, capital requirements for counterparty default risks are calculated primarily using the internal ratings-based approach (“IRBA”). Following the transition to CRR III in Q1 2025, KfW calculates significant parts of its total risk exposure based on an advanced IRBA (F-IRBA).
34
KfW Financial Report 2025
Financial Report > Combined Management Report > Risk report
The sharp decline of around 2.5 percentage points in the total capital ratio to 27.7% is attributable to the year-on-year increase in the total risk exposure amount. However, at 27.7%, the total capital ratio at year-end 2025 remained above the overall capital requirement (“OCR”).
Minimum requirements for total capital ratios
|
|
31 Dec. 2025 |
31 Dec. 2024 | ||||||||
| Total SREP capital requirements (TSCR) |
10.50% | 11.50% | ||||||||
| Capital conservation buffer |
2.50% | 2.50% | ||||||||
| Countercyclical capital buffer |
0.65% | 0.61% | ||||||||
| Other systemic buffer |
1.00% | 1.00% | ||||||||
| Systemic risk buffer |
0.02% | 0.02% | ||||||||
| Overall capital requirement (OCR) | 14.67% | 15.64% | ||||||||
The reduction in the total SREP capital requirements (“TSCR”) by 1.0 percentage points is due to the supervisory decision update on the SREP surcharge.
Economic risk-bearing capacity
To assess its economic risk-bearing capacity, KfW Group compares its ECAP for potential losses from material quantifiable risks to capital with its available financial resources calculated at present value. The basis of AFR is KfW Group’s equity adjusted for present value differences, the risk provisions for non-value-adjusted business, future cash flows from margins and costs for administration and expected portfolio business defaults, as well as some capital deduction items for a prudent economic valuation. The determination of the present value required for this purpose is generally based on risk-free yield curves for both sides of the statement of financial position; expected liquidity costs not yet covered by funding operations are taken into account by means of an additional deductible item. KfW Group bases its calculation of the ECAP on a one-year time frame.
Credit risk is the risk of a negative impact on net assets, earnings position or liquidity if business partners or borrowers fail to meet their payment obligations to KfW Group at all, in due time or in full (default) or if their credit ratings deteriorate (migration), causing the expected defaults to increase. Counterparty risk including credit valuation adjustment risk (“CVA”) risk in relation to derivative exposures is included under Credit risk. CVA risk is reported as part of the combined “counterparty risk (including CVA risk)” sub-risk type. The ECAP for credit risk is quantified by the Risk Controlling department, largely with the help of statistical models. A value-based measurement of credit risks is carried out using a loan portfolio model and credit value-at-risk (“VaR”) as a risk measure. The ECAP for CVA risk is based on the CVA charge of Pillar I, which is adjusted for economically relevant aspects (including consideration of other risk-relevant items and the use of internal ratings).
Like credit risk, equity investment risk is also subject to value-based measurement using a loan portfolio model and credit value-at-risk as a risk measure.
The ECAP for market price risk is calculated on the basis of the VaR concept. Pillar II’s economic analysis takes account of interest risk of the banking book (consisting of the jointly analysed sub-risk types: interest risk, as well as tenor and cross-currency basis spread risks), foreign currency risk, credit spread risk for securities and interest rate volatility risk. The possible loss of present value or price is determined for each type of market price risk using VaR based on historical simulation. Ultimately, the ECAP is determined by total VaR, which takes into account breakdown effects2) between the various subtypes of market price risk.
| 2) | The breakdown effect essentially contains the diversification between the ECAP requirements of the risk subtypes and the total ECAP requirement. |
35
KfW Financial Report 2025
Financial Report > Combined Management Report > Risk report
The ECAP for operational risk is calculated using an internal statistical model, which was derived from regulatory requirements for advanced measurement approaches. It takes a risk-sensitive approach to internal and external event data and risk scenarios. The capital requirement is calculated at group level, taking into account diversification effects, and then allocated to the business sectors and risk subtypes. Moreover, the measurement of the quality of operational risk management within the group can generate premiums that are then applied to the capital requirement.
In addition, a model risk buffer is applied to cover model weaknesses and foreseeable methodological changes in economic risk-bearing capacity, reviewed and adjusted quarterly and as necessary.
Using this method, the economic risk-bearing capacity as of 31 December 2025 satisfied a confidence level of 99.90%. The excess coverage of the available financial resources beyond the total capital requirement as of 31 December 2025 (EUR 27,247 million) increased compared to the previous year’s figure (EUR 19,388 million). This is due in part to the reduction in ECAP, which is primarily attributable to a lower credit risk as a result of refinements in methodology. The increase in available financial resources due to the profit for the year and refinements in methodology is an additional factor.
Economic risk-bearing capacity as of 31 December 2025
EUR in millions
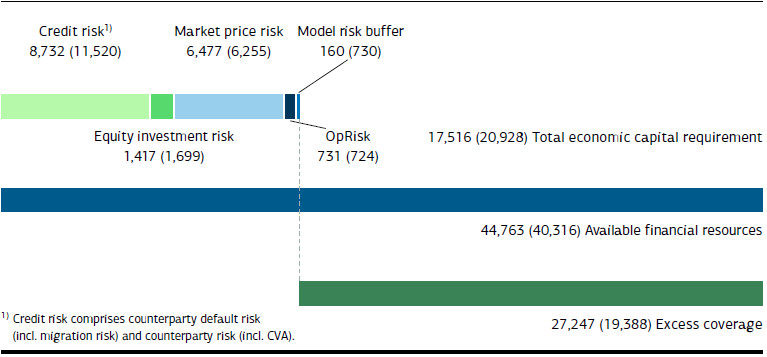
In brackets: figures as of 31 December 2024
Each risk identification model represents a simplification of a complex reality and builds on the assumption that risk parameters observed in the past can be considered representative of the future. Not all possible inputs and their complex interactions can be identified and modelled for the risk development of a portfolio. This factor is addressed by including safety margins in the design of the model, and a supplementary model risk buffer in the calculation of economic risk-bearing capacity. This is one reason why KfW Group carries out stress tests with both credit risk models and market price risk models. The group continuously develops its risk models and processes in line with current banking regulations.
Stress and scenario calculations
To ensure the early indicator function and proactive focus of the ICAAP, the group monitors different adverse economic scenarios and their effects on economic and normative risk-bearing capacity on a quarterly basis. The results of these scenarios demonstrate the group’s resilience and ability to act should one of them occur.
The baseline scenario for normative risk-bearing capacity includes projected business performance, expected consolidated comprehensive income, and other effects influencing risk-bearing capacity, such as foreseeable changes in the capital structure and methodological developments in risk measurement. It also takes into account the impact of expected economic developments on the earnings position and risk situation.
36
KfW Financial Report 2025
Financial Report > Combined Management Report > Risk report
The downturn and stress scenarios for normative and economic risk-bearing capacity simulate adverse effects on earnings or AFR and changes in capital requirements of varying severity extending beyond the developments already expected as of the key date or in the baseline scenario. While the downturn scenario assumes a slight deterioration in economic conditions, the stress scenario simulates a prolonged, severe global recession. In both scenarios, KfW assumes an increase in credit and equity investment risks and losses. In these scenarios, the EUR and USD interest rates as well as the EUR-USD exchange rate are forecast to develop adversely in line with the economic situation. At the same time, it is assumed that increasing market uncertainties will lead to greater volatility in interest rates, currencies and credit spreads, which in terms of economic risk-bearing capacity may result in a rise in the ECAP for the corresponding types of risk. Losses from operational risk further reduce available capital.
The scenarios are based on standardised global economic forecasts updated on a quarterly basis. In 2025, the effects of intensified trade disputes and geopolitical tension and of weak economic growth in Germany were taken into account in KfW’s regular stress calculations as key factors for the group’s economic environment. The scenarios result in particular in deteriorations in credit quality for KfW’s debtors and thus to increasing risk provisions and high capital requirements for the affected portfolio segments.
In addition to the regularly performed adverse scenarios, selected scenario stress tests were carried out in 2025 in light of the current geopolitical, climate policy and macroeconomic situation. The Executive Board selected the effects of a crisis of confidence in the banking sector, trade barriers due to protectionism and geopolitical fragmentation, and a debt crisis in developing countries and emerging economies, for the quarterly scenario stress tests on structural risks to KfW Group. The ad hoc scenario stress tests in 2025 focused on a possible sovereign debt crisis in western Europe and a geopolitical crisis in the Baltic region.
The stress testing methods for ESG risks were also further expanded in 2025. This expansion involved calculating a scenario on potential financial losses due to wildfire events to measure physical and transition climate risks in the portfolio, and preparing a scenario on the impact of rising carbon and energy prices (to be performed in the first quarter of 2026). In addition, a quarterly credit risk stress test is performed for the simultaneous assessment of physical and transition climate and environmental risks in the portfolio.
Besides the regularly simulated adverse scenarios and the different scenario stress tests, further stress tests, in particular risk type-specific stress tests and various sensitivity analyses, are also regularly carried out, taking concentration risks into account, to analyse the resilience of KfW’s economic and normative risk-bearing capacity. In addition, the concentration and inverse stress tests are intended to determine the limits of KfW’s risk-bearing capacity.
The results of the various stress and scenario calculations were presented to decision makers at KfW in a separate digital stress test report.
The group met the economic risk-bearing capacity requirements, including the confidence level of 99.90% in the scenarios analysed, as of all quarterly calculation dates in 2025. The regulatory capital ratios and the leverage ratio exceeded the threshold values defined for risk appetite at all times.
KfW’s stress testing programme is subject to an annual adequacy assessment, the aim being to further enhance the stress tests and scenario calculations as a component of overall bank management in order to meet internal and regulatory requirements.
37
KfW Financial Report 2025
Financial Report > Combined Management Report > Risk report
KfW Group is subject to credit risk in the context of its promotional mandate. Credit risk includes, in particular, counterparty default risk (including migration risk), as well as counterparty risk, including CVA risk.
The majority of final borrower default risks are borne by the on-lending institutions in the domestic promotional lending business. Due to the business model, this results in a large proportion of bank risks in the portfolio. Other main risks result from promotional activities in the area of start-up finance for small and medium-sized enterprises (SMEs). Particularly in these segments of domestic promotion, KfW Group bears the risk stemming from final borrowers. In addition, KfW Group faces risks in the business sectors Export and project finance as well as Promotion of developing countries and emerging economies.
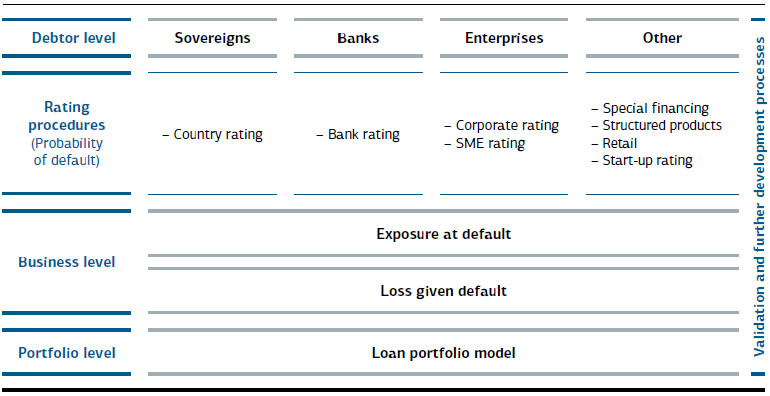
Counterparty default risk3) is measured by estimating the probability of default (“PD”), the exposure at default (“EAD”) and the loss given default (“LGD”). The product of these three variables is the loss that can be expected, statistically, on average over many years.
KfW Group uses internal rating procedures to determine the probability of default for banks, countries, corporates, SMEs and start-ups. These procedures are based on scorecards4) and generally follow a uniform model architecture consisting of a machine rating, a checklist, a group logic and a manual override. Simulation and cash flow-based rating procedures are used for significant parts of special financing and structured products, some of which were licensed from an external provider. For structured products, tranche ratings are determined on the basis of the default pattern of the asset pool and the waterfall structure of the transactions. The existing small-ticket retail positions (e.g., in the area of education financing) are valued using an automated procedure set up specifically for this purpose. The rating procedures aim to predict the probability of default on a one-year basis. As a rule, the middle and back-office departments are responsible for preparing ratings for risk-bearing business. Ratings for these exposures are updated regularly, at least once per year. There are exceptions for loans below a threshold of EUR 10 million from the KfW special programmes in the context of the pandemic and the Russian war on Ukraine.
| 3) | Also includes counterparty risk |
| 4) | A scorecard is a mathematical and statistical model and/or an expert knowledge-based model. The individual risk factors considered relevant for credit rating are converted into a score depending on their prevalence or value and weighted for aggregation. |
38
KfW Financial Report 2025
Financial Report > Combined Management Report > Risk report
Mapping the probability of default on a uniform master scale for the entire KfW Group facilitates a comparison of ratings from different rating procedures and business sectors. The master scale generally consists of 20 distinct classes which are divided into four groups: investment grade, non-investment grade, watch list and default. The range of default probabilities and the average default probability are defined for each class of the master scale. There are operating procedures specifying the responsibilities, competencies and control mechanisms associated with each rating procedure. External ratings are mapped to KfW Group’s master scale to ensure the comparability of internal ratings with ratings of external rating agencies. The rating procedures are validated and further developed at regular intervals.
EAD and valuation of collateral influence the severity of loss. Collateral has a risk-mitigating effect in calculating LGD. In valuing acceptable collateral, the expected net revenue from collateral realisation in the case of loss is determined. Assignments made serve to reduce risk in the valuation of financing partners in the on-lending business. This takes into account the BRRD resolution mechanism, in accordance with which the secured liabilities of institutions under resolution are not to be included in the bail-in cascade. For tangible collateral, further haircuts are applied for expected changes in value, as well as devaluation resulting from depreciation. Depending on the availability of data, the various valuation procedures for individual types of collateral are based on internal and external historical data and on expert estimates. In the case of personal collateral, the collateralised portion is treated as a direct transaction with the collateral provider, i.e., the probability of default and the extent of the collateral provider’s uncollateralised loss are applied. A risk principle for loan collateral regulates uniform management, valuation and recognition of collateral across KfW Group. In addition to net revenue from collateral realisation, the recovery rate for uncollateralised exposure amounts is also an important component in determining LGD. The collateral valuation procedure and the procedure for estimating the EAD and LGD are also subject to validation and further developed as needed, with new regulatory requirements also addressed.
Counterparty risks (including CVA risk)5) arise for KfW in connection with derivative transactions when hedging interest and currency risks. Derivative transactions involve the risk of changes in value (counterparty risks including CVA risk), which can be caused by a change in the credit quality of the counterparty (credit risk including default risk), a change in the absolute price of the derivative (market price risk) or a combination of the two.
KfW Group has limit management systems, risk guidelines and various portfolio guidelines to limit risks from new business. This suite of risk management instruments forms the basis for the second vote on lending transactions, serves as an orientation guide for loan approvals and has the function of ensuring the appropriate quality and risk structure of KfW Group’s portfolio while taking into account the special nature of KfW Group’s promotional business. At KfW, Group Risk Management casts the second vote at single exposure level. KfW IPEX-Bank, KfW Capital and DEG each issue their own second vote independent of the front office. The relevant lending decision-making processes are structured with a view to risk. Lending transactions require a second vote depending on the type, scope of the risk content and complexity of the transaction. The qualification levels for approval of new business depend on rating, collateralisation or net exposure and total commitments to the group of connected customers. Approval of the responsible supervisory body is also required for individual transactions from pre-defined thresholds.
The portfolio guidelines distinguish between different types of counterparties and product variants and define the conditions under which business transactions may be conducted. In addition, risk guidelines for countries, sectors and products are defined in order to react to existing or potential negative developments with specific requirements for lending. The limit management systems ultimately track both credit rating-dependent individual counterparty risk (counterparty limits) and risk concentrations (concentration limits). Counterparty limits serve to fine-tune the counterparty-specific management of credit default risk. Concentration limits serve to restrict risk concentrations in the loan portfolio and thus to prevent major individual losses. Due to KfW’s business model, there is a significant concentration in credit risks, as well as in the financial sector.
| 5) | See section on “Economic risk-bearing capacity” for measurement of the ECAP for credit risks. |
39
KfW Financial Report 2025
Financial Report > Combined Management Report > Risk report
Existing higher-risk exposures are divided into a watch list and a list for non-performing loans. The watch list serves to identify potential problem loans early. This watch-list process involves regularly reviewing and documenting the economic situation, the particular borrower’s market environment and the collateral provided, and formulating and deciding proposals for remedial action as needed – particularly proposals for risk-limiting measures. Operational responsibility for non-performing loans, and also to a large extent for watch-list exposures6), lies with restructuring units, to ensure involvement of specialists, intensive support and professional management of problematic loans. The objective of this system is to achieve recovery of a loan through restructuring, reorganisation and workout arrangements. If the business partner is deemed incapable of or unsuitable for restructuring, the priority becomes optimum realisation of the asset and the related collateral. The Restructuring division is responsible for non-performing loans in the KfW portfolio and for providing intensive support to banks and higher volume loans with a risk amount greater than EUR 1 million. The Operations department is responsible for supporting retail business. Rules with differing details apply for the special programmes for coronavirus aid, which are fully backed by a federal guarantee. KfW IPEX-Bank’s non-performing loans and exposures under intensive support, including KfW and DEG’s trust activities, are managed directly by each subsidiary. Internal interface regulations are in place in the relevant business sectors to ensure control of responsibilities and allocation. Restructuring also cooperates with the front-office departments and the central Legal Affairs department.
In the event of a crisis in the banking sector, KfW must be able to act without delay both in-house and externally. A crisis plan for banks is in place for this purpose. It primarily provides for the establishment of a dedicated working group under the direction of the Credit Risk Management department and immediate loss analysis so that the necessary next steps can be implemented quickly.
Information on default risk and default risk concentrations (gross carrying amounts)
as of 31 December 2025 – amortised cost
|
|
|
Loans and advances to banks |
Loans and advances to customers | |||||||||||||||||||||||
|
|
|
Stage 1 | Stage 2 | Stage 3 | Stage 1 | Stage 2 | Stage 3 | |||||||||||||||||||
|
|
|
EUR in millions |
EUR in millions |
EUR in millions |
EUR in millions |
EUR in millions |
EUR in | |||||||||||||||||||
| Investment grade | M1–M4 rating |
266,391 | 0 | 0 | 48,856 | 46 | 0 | |||||||||||||||||||
|
|
M5–M8 rating |
55,060 | 0 | 0 | 44,324 | 100 | 0 | |||||||||||||||||||
| Non-investment grade |
M9–M15 rating |
11,158 | 17 | 0 | 36,735 | 1,405 | 0 | |||||||||||||||||||
| Watch list |
M16–M18 rating |
1,018 | 1,029 | 0 | 1,587 | 3,106 | 0 | |||||||||||||||||||
| Default | M19–M20 rating | 0 | 0 | 1,067 | 0 | 0 | 3,964 | |||||||||||||||||||
| Total | 333,627 | 1,047 | 1,067 | 131,502 | 4,657 | 3,964 | ||||||||||||||||||||
|
|
|
Securities and investments | Off-balance sheet transactions | |||||||||||||||||||||||
|
|
|
Stage 1 | Stage 2 | Stage 3 | Stage 1 | Stage 2 | Stage 3 | |||||||||||||||||||
|
|
|
EUR in millions |
EUR in millions |
EUR in millions |
EUR in millions |
EUR in millions |
EUR in | |||||||||||||||||||
| Investment grade | M1–M4 rating |
30,811 | 0 | 0 | 89,299 | 0 | 0 | |||||||||||||||||||
|
|
M5–M8 rating |
6,508 | 0 | 0 | 29,350 | 26 | 0 | |||||||||||||||||||
| Non-investment grade |
M9–M15 rating |
405 | 0 | 0 | 18,670 | 520 | 0 | |||||||||||||||||||
| Watch list |
M16–M18 rating |
0 | 22 | 0 | 531 | 1,158 | 0 | |||||||||||||||||||
| Default | M19–M20 rating | 0 | 0 | 0 | 0 | 0 | 382 | |||||||||||||||||||
| Total | 37,724 | 22 | 0 | 137,850 | 1,704 | 382 | ||||||||||||||||||||
| 6) | The assumption of responsibility for watch-list cases at KfW IPEX-Bank is decided on a case-by-case basis by Risk Management in consultation with the unit responsible for restructuring. |
40
KfW Financial Report 2025
Financial Report > Combined Management Report > Risk report
Information on default risk and default risk concentrations (gross carrying amounts)
as of 31 December 2024 – amortised cost
|
|
|
Loans and advances to banks |
Loans and advances to customers | |||||||||||||||||||||||
|
|
|
Stage 1 | Stage 2 | Stage 3 | Stage 1 | Stage 2 | Stage 3 | |||||||||||||||||||
|
|
|
EUR in millions |
EUR in millions |
EUR in millions |
EUR in millions |
EUR in millions |
EUR in | |||||||||||||||||||
| Investment grade | M1–M4 rating |
245,839 | 0 | 0 | 48,896 | 80 | 0 | |||||||||||||||||||
|
|
M5–M8 rating |
55,777 | 0 | 0 | 45,627 | 0 | 0 | |||||||||||||||||||
| Non-investment grade |
M9–M15 rating |
13,968 | 11 | 0 | 40,194 | 1,009 | 0 | |||||||||||||||||||
| Watch list |
M16–M18 rating |
2,524 | 1,212 | 0 | 3,349 | 2,626 | 0 | |||||||||||||||||||
| Default | M19–M20 rating | 0 | 0 | 1,196 | 0 | 0 | 4,193 | |||||||||||||||||||
| Total | 318,108 | 1,223 | 1,196 | 138,066 | 3,714 | 4,193 | ||||||||||||||||||||
|
|
|
Securities and investments | Off-balance sheet transactions | |||||||||||||||||||||||
|
|
|
Stage 1 | Stage 2 | Stage 3 | Stage 1 | Stage 2 | Stage 3 | |||||||||||||||||||
|
|
|
EUR in millions |
EUR in millions |
EUR in millions |
EUR in millions |
EUR in millions |
EUR in | |||||||||||||||||||
| Investment grade | M1–M4 rating |
31,195 | 83 | 0 | 83,260 | 59 | 0 | |||||||||||||||||||
|
|
M5–M8 rating |
6,341 | 0 | 0 | 36,776 | 0 | 0 | |||||||||||||||||||
| Non-investment grade |
M9–M15 rating |
347 | 0 | 0 | 19,777 | 260 | 0 | |||||||||||||||||||
| Watch list |
M16–M18 rating |
24 | 0 | 0 | 663 | 1,003 | 0 | |||||||||||||||||||
| Default | M19–M20 rating | 0 | 0 | 0 | 0 | 0 | 283 | |||||||||||||||||||
| Total | 37,907 | 83 | 0 | 140,475 | 1,322 | 283 | ||||||||||||||||||||
41
KfW Financial Report 2025
Financial Report > Combined Management Report > Risk report
Credit risks and related credit protection of financial instruments
measured at amortised cost as of 31 December 2025
| Maximum risk | Maximum risk | Risk mitigation | ||||||||||||||
| of default1) | of default | from collateral | ||||||||||||||
|
|
|
stage 3 | stage 3 | |||||||||||||
|
|
|
|
tangible | personal | ||||||||||||
|
|
EUR in millions | EUR in millions | EUR in millions | EUR in millions | ||||||||||||
| Loans and advances to banks |
335,625 | 1,013 | 0 | 949 | ||||||||||||
| Loans and advances to customers |
138,351 | 2,629 | 45 | 1,809 | ||||||||||||
| Securities and investments |
37,734 | 0 | 0 | 0 | ||||||||||||
| Off-balance sheet transactions | 139,858 | 346 | 0 | 25 | ||||||||||||
| Total | 651,568 | 3,988 | 45 | 2,783 | ||||||||||||
| 1) | Net carrying amount, excluding collateral and other credit enhancements |
Credit risks and related credit protection of financial instruments
measured at amortised cost as of 31 December 2024
| Maximum risk | Maximum risk | Risk mitigation | ||||||||||||||
| of default1) | of default | from collateral | ||||||||||||||
|
|
|
stage 3 | stage 3 | |||||||||||||
|
|
|
|
tangible | personal | ||||||||||||
|
|
EUR in millions | EUR in millions | EUR in millions | EUR in millions | ||||||||||||
| Loans and advances to banks |
320,406 | 1,144 | 9 | 1,106 | ||||||||||||
| Loans and advances to customers |
144,278 | 2,917 | 54 | 2,297 | ||||||||||||
| Securities and investments |
37,982 | 0 | 0 | 0 | ||||||||||||
| Off-balance sheet transactions | 142,006 | 235 | 0 | 26 | ||||||||||||
| Total | 644,672 | 4,297 | 62 | 3,428 | ||||||||||||
| 1) | Net carrying amount, excluding collateral and other credit enhancements |
A large part of the personal collateral of the financial instruments classified as stage 3 comprises federal guarantees and credit insurance. Tangible collateral for financial instruments classified as stage 3 primarily consists of aircraft mortgages.
As a rule, the collateral for financial instruments measured at fair value relates almost entirely to the collateral for financial derivatives.
There were no significant changes to the quality/collateralisation policy and no financial instruments for which no impairments were recognised at all due to tangible collateral.
KfW Group did not take possession of any assets held as collateral nor had any assets held as collateral been taken possession of in 2025.
42
KfW Financial Report 2025
Financial Report > Combined Management Report > Risk report
The interaction of the risks associated with the individual exposures in KfW Group’s loan portfolio7) is assessed based on an internal portfolio model. Concentrations of individual borrowers or groups of borrowers give rise to a risk of major losses that could jeopardise KfW Group’s existence. On the basis of the economic capital concept, the Risk Controlling department measures risk concentrations by individual borrower, sector and country. Risk concentrations are primarily reflected in the ECAP. The results of these measurements form the main basis for managing the loan portfolio.
ECAP by region
31 December 2025 (31 Dec. 2024)
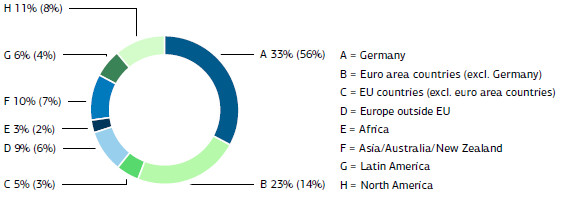
Regions
As of 31 December 2025, 56% of KfW Group’s loan portfolio in terms of ECAP was attributable to the euro area, including Germany (31 Dec. 2024: 70%). The revision of the risk model for collateralised on-lending business described in the “Current developments” section resulted in a significant decline in the ECAP in Germany and thus in the overall portfolio. This in turn caused the relative share of other regions in the portfolio to rise. This effect was exacerbated in the euro area (excluding Germany) by the expansion of the liquidity portfolio.
ECAP by sector
31 December 2025 (31 Dec. 2024)
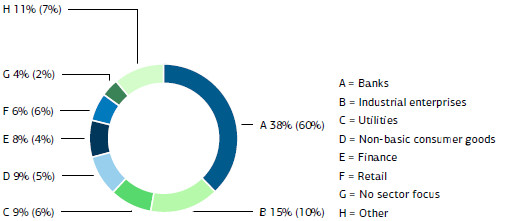
Sectors
The significant share of the total capital requirement for credit risk attributable to banks is due to KfW Group’s promotional mandate. By far the greatest portion of KfW Group’s domestic promotional business consists of loans on-lent through commercial banks. This concentration was significantly reduced through the aforementioned revision of the risk model. As a result, the banks’ share of ECAP declined to 38% overall (31 Dec. 2024: 60%).
Note: Prior year figures for utilities (5% to 6%) and non-essential consumer goods (6% to 5%) have been corrected.
| 7) | The loan portfolio includes loans as well as securities and investments in performing business. The non-performing portfolio is only included in the presentation of credit quality. |
43
KfW Financial Report 2025
Financial Report > Combined Management Report > Risk report
Credit quality by net exposure
31 December 2025 (31 Dec. 2024)
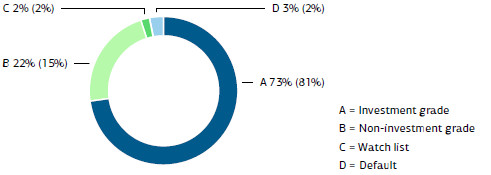
Credit quality
As credit quality is a major factor influencing ECAP, analysing credit quality structure involves examining the distribution of net exposure8) by credit quality category. The aforementioned revision of the risk model resulted in a significant reduction in investment grade net exposure, and thus in total net exposure. This caused an increase in the share of the other rating classes in the credit rating distribution even though no substantive developments could be identified.
Overview of ESG credit risks
The ESG risk assessment of the group’s loan portfolio is very stable year on year and shows that the majority of the KfW portfolio has low or moderate E, S and G risks. Financial institutions with a low risk rating for environmental and governance account for a large proportion of the volume assessed. In the social risk ratings, the financial institutions achieved a moderate risk rating overall based on assessments corresponding to data security and protection of customer privacy.
Average E, S and G scores with scale values
Share of assessed net exposure as of 31 December 2025
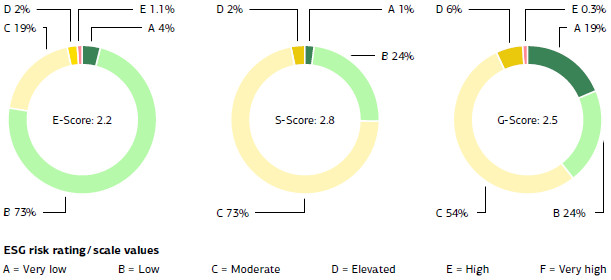
| 8) | Net exposure is the economic loss that could potentially occur in the event of an economic or political default event. |
44
KfW Financial Report 2025
Financial Report > Combined Management Report > Risk report
Average E, S and G scores with scale values
Share of assessed net exposure as of 31 December 2024
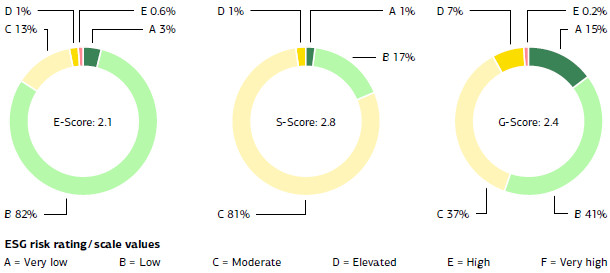
Net exposure weighted score distribution based on the KfW Group portfolio use of the ESG risk profile resulted in a very high coverage rate overall with few justified exceptions (primarily private households).
Securities-based securitisations in KfW Group’s portfolio
Securitisations had a par value of around EUR 7.3 billion as of 31 December 2025. Accounting for the mark-to-market valuation of the securities reported at fair value and impairments, the portfolio had a book value (including pro rata interest) of around EUR 7.3 billion. The following tables present the composition of the securitisation portfolio by asset class, rating grade and geographical distribution.
Geographical breakdown of the underlying asset pool (based on par value)
|
|
31 Dec. 2025 |
31 Dec. 2024 | ||||||||
|
|
% | % | ||||||||
| Germany |
56.5 | 55.9 | ||||||||
| Western/Central Europe |
33.0 | 42.5 | ||||||||
| Southern Europe |
7.8 | 0.3 | ||||||||
| Northern Europe | 2.7 | 1.3 | ||||||||
Exposure based on par values
| ABCP | Auto-ABS1) | RMBS | Other |
Total as of |
Total as of | |||||||||||||||||||
| securitisa- | 31 Dec. | 31 Dec. | ||||||||||||||||||||||
|
|
|
|
|
tions | 2025 | 2024 | ||||||||||||||||||
| EUR in | EUR in | EUR in | EUR in | EUR in | EUR in | |||||||||||||||||||
|
|
millions | millions | millions | millions | millions | millions | ||||||||||||||||||
| Investment grade |
3,595 | 2,991 | 391 | 342 | 7,319 | 6,790 | ||||||||||||||||||
| Non-investment grade |
0 | 0 | 0 | 0 | 0 | 0 | ||||||||||||||||||
| Watch list |
0 | 0 | 0 | 0 | 0 | 0 | ||||||||||||||||||
| Default | 0 | 0 | 0 | 7 | 7 | 7 | ||||||||||||||||||
| 3,595 | 2,991 | 391 | 349 | 7,326 | 6,797 | |||||||||||||||||||
| 1) | Auto ABS are based on receivables from automotive financing agreements. |
45
KfW Financial Report 2025
Financial Report > Combined Management Report > Risk report
The portfolio volume increased compared to the volume of 31 December 2024 (by a nominal value around EUR 0.5 billion). This increase related solely to the investment grade portfolio. In terms of the geographical breakdown of the underlying asset pool, the entire portfolio remains fully attributable to Europe, with Germany accounting for the lion’s share.
In managing group equity investment risks, the group differentiates between risks from equity investments at operational level and strategic equity investments:
Equity investments (operational level)
Undertaking equity investments at an operational level is part of the group’s promotional mandate. Accordingly, equity investments are made in connection with domestic and European investment financing and in the business sectors KfW Development Bank, DEG and Export and project finance, and KfW Capital. KfW’s group-wide basic rules for equity investments at an operational level are set out in general guidelines. Specific rules tailored to certain segments of equity investments are also set out in portfolio guidelines or working instructions. Risks are measured at individual loan commitment level for operational equity investments using rating procedures specified for this purpose, which are allocated to the respective rating objects in accordance with the procedural rules. Equity investment portfolio risks are monitored monthly in the group risk report.
Strategic equity investments
Strategic equity investments support KfW’s mandate of providing an efficient and sustainable promotional offering. In addition to reinforcing and expanding core competencies, the focus of this investment type is on complementing KfW’s business sector (Article 2 (3) of the KfW Law [related transactions]). Strategic equity investments normally have a long-term holding period. KfW also makes strategic equity investments in accordance with Article 2 (4) of the KfW Law (mandated transactions). The Federal Government mandates such equity investments to KfW on a case by case basis because the Federal Republic of Germany has a state interest in them.
Dedicated organisational units are responsible for strategic equity investments based on an equity investment manual that describes legal bases, strategies, principles, procedures and responsibilities of equity investment management. Acquisitions and disposals of, and changes to, strategic equity investments are subject to defined processes as well as authorisation by the Executive Board and, in the cases covered under the KfW Bylaws, authorisation by the Board of Supervisory Directors. Moreover, KfW’s acquisition of a strategic equity investment in excess of 25%, creating or increasing such an equity investment or fully disposing of it requires authorisation by the Federal Ministry of Finance in accordance with Section 65 (3) of the Federal Budget Code (Bundeshaushaltsordnung). The strategic equity investments and their individual risks are monitored. Reports on the strategic equity investments are prepared on a quarterly basis and, if necessary, on an ad hoc basis and are addressed to the Executive Board by the General Secretariat. The equity investment strategies to be tailored individually and in line with the business strategy address, among other things, the grounds for each investment in accordance with promotional policy; the commercial impact; the holding period and exit strategies. Equity investment strategies are updated on an annual basis. Moreover, the group is normally represented in the supervisory bodies of its strategic equity investments. Mandated transactions, that is, those executed in the interest of, on the instruction of and at the risk of the Federal Government may deviate from these provisions. Information is provided on the group’s strategic equity investments at least once a quarter in the risk report.
As of 31 December 2025, the group’s equity investment portfolio consisted of fund investments of KfW Capital with an ECAP of EUR 282 million (31 Dec. 2024: EUR 344 million), equity investments of DEG including promotional business with an ECAP of EUR 652 million (31 Dec. 2024: EUR 802 million), and other promotional business (ECAP: EUR 483 million; 31 Dec. 2024: EUR 553 million).
The EUR 283 million decrease in the capital requirement compared to the previous year is due primarily to an adjusted valuation method.
46
KfW Financial Report 2025
Financial Report > Combined Management Report > Risk report
KfW Group primarily measures and manages market price risk on a present-value basis. The drivers of market price risk are interest risk (consisting of the jointly analysed risk subtypes interest risk, tenor and cross-currency basis spread risk), interest rate volatility risk, foreign currency risk and sector-specific spreads for positions with credit spread risk.
Market price risk within the group required a total of EUR 6.48 billion in economic capital as of 31 December 2025. This is EUR 0.22 billion more than the previous year. The expansion of the strategic interest rate risk position along with volatile markets (particularly in credit spread risk) have increased market price risk overall. Credit spread risk also rose due to an adjusted valuation method (exclusion of credit spreads in the measurement of pension provisions). The change in reference curve from the 6M EURIBOR to the ESTR swap curve caused a year-on-year increase in tenor basis spread risk in interest risk.
Economic capital requirement for market price risk
|
|
31 Dec. 2025 | 31 Dec. 2024 | ||||||||
|
|
EUR in millions | EUR in millions | ||||||||
| Interest risk |
6,328 | 6,147 | ||||||||
| Interest risk |
6,495 | 6,078 | ||||||||
| Tenor basis spread risk |
961 | 403 | ||||||||
| Cross-currency basis spread risk |
397 | 520 | ||||||||
| Breakdown effect |
–1,525 | –855 | ||||||||
| Interest rate volatility risk |
65 | 162 | ||||||||
| Foreign currency risk |
596 | 703 | ||||||||
| Credit spread risk |
876 | 731 | ||||||||
| Breakdown effect | –1,387 | –1,488 | ||||||||
|
|
||||||||||
| Market price risk | 6,477 | 6,255 | ||||||||
Value-at-risk approach
The ECAP for the market price risk is calculated based on the VaR model of the historical simulation. The risk is calculated taking account of diversification effects between the risk subtypes. The possible loss of present value is determined based on the historical simulation. The model consists of two components – a reactive short-term and a conservative long-term component. The reactive component is based on a historical simulation over a one-year market data history (250 scenarios) and thus in particular reflects current market events. The conservative component is based on a historical simulation over a five-year period selected from a long-term history, which includes stress periods and thus incorporates a long-term perspective.
The ECAP for market price risk and risk subtypes is calculated from the maximum of the two components, based on a holding period of one year and a confidence level of 99.9%.
VaR indicators are determined for each of the following subtypes of market price risk: interest risk (further broken down into the risk of changes in the interest rate, tenor and cross-currency basis spread risks), foreign currency risk, interest rate volatility risk and credit spread risk. The total VaR is also calculated, taking account of breakdown effects between the aforementioned risk subtypes. The total VaR, interest risk, interest rate volatility risk, credit spread risk and foreign currency risk are limited.
Interest risk
Yield curve grid points serve as the basis for historical simulation to quantify interest risks. These implicitly include interest risk as well as tenor and cross-currency basis spread risks. By contrast, interest rate volatility and credit spread risks are not included in interest risk, but are modelled separately and reported using their own key VaR indicators. The capital requirement for interest risk increased by EUR 181 million to EUR 6,328 million as of 31 December 2025.
47
KfW Financial Report 2025
Financial Report > Combined Management Report > Risk report
Interest rate volatility risk
Implied volatilities are used as risk factors to determine the interest rate volatility risk. These are applied in modelling interest rate options (e.g., floors in the variable-rate lending business). The ECAP for these risks is calculated in the same way as for other sub-types of risk, using historical simulation; see above, “Value-at-risk approach”. The ECAP requirement for interest rate volatility risk is not permitted to exceed the present value of the corresponding interest rate options held by KfW. The capital requirement for interest rate volatility risk was EUR 65 million as of 31 December 2025.
Foreign currency risk
The ECAP for foreign currency positions is also calculated using historical simulation. The capital requirement for foreign currency risk stood at EUR 596 million as of 31 December 2025.
Credit spread risk
This risk is mainly determined by the securities portfolio. The ECAP requirement for this risk type is calculated in the same way as for other risk types, using historical simulation. The ECAP requirement for credit spread risk as of 31 December 2025 was EUR 876 million. Credit spread risk rose by EUR 145 million year on year due to the exclusion of credit spreads in the present value measurement of pension provisions.
Stress testing
In addition to the calculation of the ECAP requirement based on the VaR model of historical simulation, the effects of extreme market situations on the present value and VaR target variables are determined by means of stress tests.
Market price risks IRRBB and CSRBB with regard to earnings
In addition to present-value measurement of market price risk, interest rate-induced risks are measured with regard to the bank’s periodic earnings. The earnings-oriented interest risk (IRRBB) comprises market interest rate-induced fluctuations in net interest income, referred to as delta net interest income (“delta NII”). The delta NII is influenced by the strategic interest rate risk position and effects in the variable banking book (interest book). Measurement and monitoring is based on a dynamic simulation model with the change between the planned base case and the scenarios specified by the European Banking Authority calculated as the delta NII. The interest risk also manifests itself in market interest rate-induced fluctuations in the measurement of pension provisions, referred to as delta other comprehensive income (“delta OCI”), which is recognised directly in equity. As of 31 December 2025, the worst-case scenario was EUR –243 million in delta NII and EUR –617 million in delta OCI.
The earnings-oriented credit spread risk (CSRBB) monitors existing or future risk to earnings arising from unfavourable credit spread movements in two components: the funding cost risk from changes in KfW’s own credit spread as delta NII, and the credit spread risk from the remeasurement of pension provisions as delta OCI, which is not recognised in the income statement. As of 31 December 2025, the worst-case scenario was EUR –420 million in delta NII and EUR –271 million in delta OCI.
Liquidity risk in the narrower sense (synonymous with insolvency risk) is the risk of a lack of liquidity on the part of an institution or market. The liquidity gap creates the risk that payment obligations cannot be met, cannot be met on time or cannot be met in full.
The primary objective of liquidity management is to ensure that KfW Group is capable of meeting its payment obligations at all times. KfW is available as a contractual partner for all commercial transactions of its subsidiaries, particularly for their funding. For this reason, the liquidity requirements of the subsidiaries are included both in KfW Group’s funding plans and in the liquidity maintenance strategy.
Liquidity risk is measured on the basis of economic scenario analyses. Moreover, maximum liquidity gap limits (outflows on a monthly and yearly basis) and the difference between the average residual maturity of inflows and outflows (maturity gap) are monitored. On the basis of the KfW Law, KfW’s liquidity risks are limited by the utilisation threshold in accordance with Article 4 of the KfW Law. The utilisation threshold compares current and non-current liabilities and must not exceed 10%. Internal indicators relating to the liquidity situation are based on excess EUR coverage in stress scenarios of differing severity. No capital is currently allocated as part of calculating risk-bearing capacity.
48
KfW Financial Report 2025
Financial Report > Combined Management Report > Risk report
Internal liquidity adequacy assessment process
The internal liquidity adequacy assessment process (“ILAAP”) principle describes the management and monitoring of KfW Group’s liquidity risk position. The procedure established by the institution serves to identify, measure, manage and monitor liquidity. The aim of the ILAAP is to ensure liquidity and avoid liquidity bottlenecks. It also assesses internal governance and institution-wide controls.
Insolvency risks are mainly limited through economic liquidity risk ratios and limits for liquidity gaps. The aim of the liquidity risk strategy is to preserve the ability to meet payment obligations at all times and when due, even in stress scenarios.
The approach to measuring liquidity risk has been refined. On this basis, there was a transition in 2025 from a ratio as liquidity risk indicator to minimum excess coverage measured in euros. The indicator is determined using stress scenario narratives that show market-wide and/or institution-specific crises using stressed risk factors. Minimum excess coverage is based on the worst-case scenario for liquidity, “Combined stress”, and is defined as the lowest net liquidity in an observation period of three months. Internal liquidity risk measurement is based on the scenario calculations described. This approach first analyses the expected inflow and total outflow of payments for the next 12 months based on business already concluded. This baseline cash flow is then supplemented by planned and estimated payments (e.g., borrowings from the capital market, expected liquidity-related loan defaults or planned new business). The result provides an overview of the liquidity required by KfW Group over the next twelve months. The liquidity required is calculated for different scenarios. In this respect, market-wide and institution-specific risk factors are stressed, and an evaluation is made of the impact on KfW Group’s liquidity. Parallel to the above approach, KfW Group also determines the available liquidity potential, which largely comprises KfW’s account with the Bundesbank, repurchase agreement assets and the liquidity portfolio. The funding matrix based on the cumulative liquidity requirement and the available liquidity potential is measured as an EUR value for every scenario. The resulting excess coverage or shortfall indicates directly whether there are enough funds available to cover funding requirements, and must not be below zero.
The indicators are calculated and reported to the Market Price Risk Committee on a monthly basis9). The following table presents the risk indicators for the scenarios as of 31 December 2025:
KfW liquidity risk indicators
|
|
31 Dec. 2025 | |||||
|
|
Minimum excess coverage (EUR in billions)
|
|||||
| Market-wide stress |
65.61 | |||||
| Institution-specific stress |
|
47.98 |
| |||
| Combined stress
|
|
39.31
|
| |||
(Prior-year figures not provided due to refinement of liquidity risk model / transition to excess coverage)
KfW continued to support the energy sector through the extension of loans on behalf of the Federal Government in 2025. This funding requirement was addressed through a refinancing facility via the Economic Stabilisation Fund (Wirtschaftsstabilisierungsfonds) and liquidity coverage potential provided by the German Finance Agency in the form of ECB-eligible German government securities.
| 9) | The minimum excess coverage with a short-term observation horizon of one month is also reported on a weekly basis to the CRO and other selected recipients. |
49
KfW Financial Report 2025
Financial Report > Combined Management Report > Risk report
Current funding environment
In a capital market environment once again characterised by many political uncertainties, KfW generated a total issue volume (net proceeds) of EUR 71.0 billion on the international capital markets in financial year 2025 (2024: EUR 78.1 billion). There were 164 individual transactions (2024: 145). KfW issued bonds in ten different currencies, with around 82% of long-term borrowing taking place in the two main funding currencies – euros (around 58%; 2024: 62%) and US dollars (around 24%; 2024: 25%).
KfW issues commercial paper (CP) with maturities of up to one year on the money market through two CP programmes. The outstanding volume of the Multi-Currency Commercial Paper programme designed for global investors amounted to EUR 41.1 billion as of the 31 December 2025 reporting date (31 Dec. 2024: EUR 23.1 billion). At 127 days, the average term of the issues under the Multi-Currency Commercial Paper programme was longer in 2025 than in the previous year (113 days). The outstanding volume of the US Commercial Paper (USCP) programme was USD 15.6 billion as of the 31 December 2025 reporting date (31 Dec. 2024: USD 9.3 billion). At 78 days, the average term of the issues under the USCP programme was also longer in 2025 than in the previous year (53 days).
Model risk
KfW employs models as an essential component for risk measurement and capital management, for calculating the effects of stress tests, and more generally for model-based business management overall. Using models means there are model risks, which can affect other types of risk such as credit or market price risk. Model risk was therefore once again identified as a material overarching risk in the 2025 risk inventory, since direct and considerable impacts on net assets, earnings position or liquidity can arise from weaknesses or errors at both model and model interaction level. Identifying and managing model risks is aimed at ensuring adequate control of model risks and timely and risk-oriented elimination or compensation of (systematic) model weaknesses that have been identified, particularly through independent validation, and at promoting an appropriate risk culture for dealing with models. Model risk is compensated by capital buffers in the economic risk-bearing capacity and individual adjustments at the model level, such as valuation reserves and manual adjustments, or by taking margin of conservatism premiums into account in model parameterisation. The annual model risk report gives the KfW Executive Board an overview of the entire model landscape with further details of the models in focus, as well as a general assessment of model risks at KfW. The ongoing management of model risks is carried out both through active performance of the individual model roles and through discussions and decisions in the risk committee meetings that regularly take place.
In accordance with Article 4 (1) no. 52 of the CRR, the group defines operational risk as the negative impact on net assets (including capital adequacy), earnings position or liquidity that can result from inadequate or failed internal processes, people and systems or from external events. Operational risks are monitored by a central Risk Controlling unit. The methodology behind the models and procedures used for measurement and monitoring is adjusted on a regular basis. This definition also includes legal risks, but excludes project risks and reputational risks. In addition, the operational risk subtypes are monitored by specialised second line of defence units.
According to the 2025 risk inventory, the “compliance risk” and “information security risk” subtypes are classed as material.
The aim of management and control of operational risk is the proactive identification and averting of potential losses for the group, i.e., to make emergencies and crises manageable and to secure the group’s structural ability to remain operational even in the event of loss of key resources.
Management of risks is decentralised and performed within the business sectors and subsidiaries by the respective directors or members of management, who are supported by the respective sector coordinators for OpRisk and BCM. Risks are monitored and communicated group-wide by the Non-Financial Risk department; individual institution level management is performed in the respective units of each subsidiary. These staff develop the relevant methods and instruments for identifying and assessing risks and monitor their group-wide uniform application. The model for calculating the economic risk resulting from operational risks is also validated by the Risk Controlling department.
50
KfW Financial Report 2025
Financial Report > Combined Management Report > Risk report
Events and near misses in the group are recorded in an OpRisk event database and updated when changes or developments occur. There is regular target group-appropriate reporting on the recorded loss events and any measures initiated as a result. The Executive Board, the Board of Supervisory Directors and the Non-Financial Risk Committee are briefed monthly or quarterly as part of internal risk reporting. Ad hoc reports are also made if a loss exceeds a certain level.
In addition, potential operational risks are identified based on risk scenarios that are collected from across the group. Operational risks are evaluated on the basis of expert assessments in combination with internal and external loss events as well as internal data (e.g., transactions), which are backed by a distribution assumption for loss frequency and loss amount. The results of the annual risk assessment and the calculated risk scenarios are reported to the Non-Financial Risk Committee and the Executive Board. As part of the risk assessment, the business areas check the implementation of additional risk-mitigating measures (e.g., checks as part of the internal control system – “ICS”).
Where adequate monitoring of operational risks using metrics is possible, risk indicators are used. Compliance with centrally prescribed risk-mitigating requirements (e.g., training course participation, deadlines, escalation procedures) is monitored by the overarching Controlling function using business area-specific OpRisk information dashboards to ensure escalation across all levels up to the Executive Board in the event of non-compliance.
The 2025 risk assessment was carried out from April to December 2025.
ICT risk is of particular importance due to the central role played by information and communication technologies (“ICT”) in digital operational resilience. The largest ICT risks arise from adjustments to ICT systems (e.g., programming errors and resulting disruptions to payment transactions) and unauthorised access to systems (e.g., cyberattacks). Safeguarding digital operation resilience, i.e., the ability to ensure KfW’s operational reliability even in the event of disruptions, requires overarching management and control of the ICT risk affecting various risk (sub)types. Specific ICT requirements of ICT-relevant functions are defined to this end, which address the provisions of DORA.
Information security risk
Information security risk (“IS risk”) refers to the uncertainty involved in achieving the respective protection targets (confidentiality, integrity and availability) of information assets and the resulting potential adverse effect on the group’s net assets (including capital adequacy), earnings position or liquidity. An IS risk occurs precisely when a threat (e.g., a cyberattack) is accompanied by a vulnerability (e.g., planned protection measures that have not been implemented). Target security requirements for information assets are being derived from regulatory and statutory requirements, the requirements of the ISO 27001/2 standards, security audits and IS incidents, and defined as topic-specific security requirements. These requirements form the basis for a target/actual comparison. Target requirements to achieve the desired security level, and thus also the mandatory security requirements, may differ for each protection target (confidentiality, integrity and availability). Differences in the target/actual comparison are assessed in a risk analysis and dealt with accordingly.
Compliance risk
Compliance risk is defined as the risk of legal or regulatory sanctions or negative effects on net assets (including capital adequacy), earnings position or liquidity arising from non-compliance with external or internal requirements, voluntary commitments or legal regulations, which contribute to the following aspects of operational compliance:
– fraud and corruption risk; risk of criminal activities,
– securities compliance and conflict of interest risk in provision of investment services,
– money laundering/terrorist financing risk,
– risk of breaching embargoes or sanctions,
or which fall under the overall process of compliance with minimum requirements for risk management (Mindestanforderungen an das Risikomanagement – “MaRisk”) as published by the German Federal Financial Supervisory Authority (Bundesanstalt für Finanzdienstleistungsaufsicht – “BaFin”), in accordance with MaRisk
51
KfW Financial Report 2025
Financial Report > Combined Management Report > Risk report
AT 4.4.2. The processes for identifying, assessing, controlling and monitoring compliance risk, including the aspects listed above, are part of the Compliance Management Framework (“CMF”). This includes minimum requirements both for implementing regulatory requirements and for ensuring appropriate group-wide risk management. Under the CMF, the Compliance department acts as a second line of defence to ensure that risks of material rule violations are identified promptly and mitigated.
Reputational risk is the risk that public perception of the group from the point of view of the relevant internal and external stakeholders will deteriorate for the long term with a negative impact on KfW Group. This negative impact could lead to a decrease in KfW Group’s net assets, earnings or liquidity (e.g. a decline in new business) or may be of a non-monetary nature (e.g. difficulty in recruiting new staff). Reputational risk may arise as a consequence of other types of risk, or independently.
Reputational risk is categorised as a non-material risk type in the risk inventory. Due to KfW’s special role and business model, this risk type is nevertheless of particular importance, which is why its treatment is essentially unchanged throughout the risk management cycle.
Reputational risks are managed based on qualitative criteria. This reflects both stakeholders’ expectations and the bank’s self-image of adhering to all relevant ethical, governance, environmental and compliance standards. In recent years, an internal method was developed to incorporate reputational risk into the decision-making process for financing and investments based on uniform standards; this method is gradually being rolled out in the KfW Group entities.
Moreover, as part of risk identification, the central reputational risk control function coordinates qualitative reputational risk assessment and creates a risk profile outlining the group’s greatest reputational risks relating to the bank’s most important stakeholders. In addition, reputational risk events that have occurred are reported on an ongoing basis.
Additional internal control procedures
Process-integrated internal control system (ICS)
The aim of KfW Group’s ICS is to use suitable principles, measures and procedures to ensure the effectiveness and profitability of business activities, compliance with the legal requirements applicable to KfW Group, the accuracy and reliability of external and internal accounting, and the protection of assets. There are group-wide ICS rules as well as binding group-wide minimum requirements of the ICS. KfW Group’s ICS is based on the relevant legal (bank regulatory) requirements 10), in particular those set forth in the KWG and MaRisk, and the standard market ICS framework, such as the COSO model 11). The KfW Executive Board holds overall responsibility for the group’s ICS. The respective company management of the subsidiaries KfW IPEX-Bank, KfW Capital and DEG holds overall ICS responsibility. Design and implementation at the different corporate levels are the responsibility of the relevant managers according to the organisational structure. Procedural rules form the basis of the ICS. These constitute the framework for a proper business organisation within KfW Group, in the form of a binding policy. Workflow organisational measures and controls are intended to ensure that monitoring is integrated into processes. Monitoring measures integrated into processes serve to avoid, reduce, detect and correct processing errors or financial loss. The effects of any planned changes to operational processes and structures on the procedure and intensity of monitoring are analysed in advance. To ensure the adequacy and effectiveness of the ICS, KfW regularly scrutinises and continually refines its standards and conventions. A report is rendered annually to KfW Group’s supervisory bodies. The adequacy and effectiveness of the ICS within KfW Group is also assessed by Internal Auditing on the basis of risk-based audits carried out independently of group procedures.
10) See Section 25a (1) no. 1 KWG, MaRisk AT 4.3, and Sections 289 (5), 315 (2) no. 5, 324, and 264d HGB
11) COSO = Committee of Sponsoring Organizations of the Treadway Commission
52
KfW Financial Report 2025
Financial Report > Combined Management Report > Risk report
Compliance
The Executive Board bears overall responsibility for compliance within the Group. The Executive Board delegates the associated tasks to the Compliance department. The officers appointed by the Executive Board for the relevant areas of responsibility are located in the Compliance department. They include, in particular, the (group) money laundering officer, the fraud officer (central unit in accordance with Section 25h KWG) and the company data protection officer. The Compliance organisation is structured in accordance with a Three Lines of Defence model; as the second line of defence, it is aligned with the requirements for a MaRisk compliance function. In this context, group compliance has in particular included measures to prevent insider trading (securities compliance), general conflicts of interest (conflict of interest risk), money laundering and terrorist financing and criminal activities, to comply with sanctions and embargo regulations, and to monitor legal requirements and the associated implementation measures (overall MaRisk compliance process in accordance with MaRisk AT 4.4.2.). There are therefore binding rules and procedures that influence the day-to-day implementation of values and the corporate culture, which are updated regularly and on an ad hoc basis to reflect current law as well as market requirements. These include group-wide policies, that, in particular, serve to prevent criminal acts and set out how to deal with gifts and invitations. The aim is to manage and assess compliance risks as part of non-financial risks, among other things, by means of key indicators in line with the central requirements for operational risk management. Since the entry into force of the material requirements of the Supply Chain Act (Lieferkettensorgfaltspflichtengesetz) on 1 January 2023, the compliance organisation has also acted as a central point for recording, monitoring and controlling compliance with the related requirements. Within the scope of its duties as second line of defence, Compliance is responsible for and authorised to ensure implementation of statutory or regulatory requirements and Executive Board decisions, to analyse individual cases/irregularities, to coordinate necessary measures and, where applicable, to initiate ad hoc measures to limit damage. In relation to all other areas of the group, the Compliance department performs its tasks autonomously and independently and is not subject to any instructions, in particular with regard to analysis (including evaluation of results), monitoring activities, defining and implementing rules and measures, and reporting. In order to perform its duties, Compliance has a complete and unrestricted right to information, inspection and access to all premises, documents, records, audio recordings and systems. Where necessary, internal auditing and monitoring processes of the compliance organisation have been adapted to the changed risk situation (for example, regarding the Russian war on Ukraine and the Gaza war resulting from the Hamas attack). Group-wide task forces were established for this purpose where necessary. Compliance monitors legal and regulatory requirements on an ongoing basis and, as necessary, adapts them to the changed risk situation in coordination with the affected functions of the first line of defence. Legal matters are analysed in collaboration with the Legal Department where necessary.
Internal Auditing
Internal Auditing is an instrument of the Executive Board. As an entity that works independently of KfW Group procedures, it audits and assesses all of KfW Group’s processes and activities to identify the risks involved and reports directly to the Executive Board. With a view to risk management processes, Internal Auditing performed an audit in the reporting year of the decentralised risk management processes and central aspects of risk management and risk control which were relevant group-wide. The focus areas of the audit across all risk types were the application, operation and further development of the models used in risk management, and management of the bank’s market price and liquidity risks. A substantive test was also performed in the area of model risk management. Audits of key second line functions were also part of the 2025 audit plan. The risk management projects that Internal Auditing assessed as material were supported by Internal Auditing, maintaining the latter’s impartiality and avoiding any conflicts of interest. Moreover, Internal Auditing continued to monitor the ongoing development of risk measurement procedures in 2025 by attending meetings of decision-making bodies (as a guest). Internal Auditing also functions as KfW Group’s internal auditing department. It is involved in subsidiaries’ audit planning. In addition to the audit results obtained independently in group-wide audits, it also incorporates the audit results of third parties (group auditors, BaFin and the internal auditing departments of the other group companies) in its group-wide internal audit reporting, in the tracking of measures and as a source of information when preparing its own audits.
53
KfW Financial Report 2025
Financial Report > Combined Management Report > Forecast and opportunity report
Forecast and opportunity report
General economic environment and development trends
KfW expects global real gross domestic product (“GDP”) to grow by 3.1% year on year in 2026, after increasing according to International Monetary Fund (“IMF”) estimates by 3.3% in 2025. A lower growth rate than the prior year is expected for the group of industrialised countries as well as for the group of developing countries and emerging economies (see table “Gross domestic product at constant prices”). The IMF’s forecasts show that global consumer price inflation is expected to fall from an annual average of 4.1% in 2025 to an annual average of 3.8% in 2026. This means that the inflation rate for industrialised countries in 2026 is expected to be 5.1 percentage points below and that of the developing countries and emerging markets 4.9 percentage points below the highest rate of the past ten years, which was reached in 2022. KfW agrees with the IMF’s assessment that the economic outlook will be determined by the trade policy measures introduced in 2025, reduced official development assistance and migration restrictions, and that economies, institutions and markets will adjust to rising protectionism and increased fragmentation of the global economy.
Gross domestic product at constant prices
| Year-on-year change |
2025 estimate |
2026 forecast |
average for 2015–2024 |
|||||||||||
|
|
in % | in % | in % | |||||||||||
| Global economy* |
3.3 | 3.1 | 3.1 | |||||||||||
| Industrialised countries* |
1.7 | 1.6 | 1.9 | |||||||||||
| Developing countries and emerging economies* | 4.4 | 4.0 | 4.0 | |||||||||||
| * | Aggregation of annual GDP growth rates at each country’s constant price based on the shares of each country’s GDP valued at purchasing power parity in the corresponding aggregate. Grouped into industrialised countries and developing countries/emerging economies based on IMF classification. The average is calculated as the geometric mean of annual growth rates. |
Development of the global economy going forward is subject to particular uncertainty. The IMF believes that negative risks predominate. For one thing, US tariff increases and the backlash from some trading partners may have a worse impact on international trade than expected. For another, escalating trade conflicts and an increased use of protectionist measures could disrupt international value chains and impede technological progress. Industrialised nations are encountering fiscal vulnerabilities, primarily due to rising costs of financing sovereign debt, meaning that a further increase in term premiums could result in greater refinancing risks. In the case of developing countries, reduced funds from Official Development Assistance increases the need for refinancing covered by private creditors. If risk premiums increase, greater debt stress in developing countries and emerging markets could result. A reassessment by the financial markets of assets and, in particular, technology shares due to a worsening economic outlook, disappointed artificial intelligence earnings expectations or spill-over effects from the revaluation of government bonds, may lead to disorderly asset repricing. The resulting negative effects on assets would also impact private consumption. Additional downside risks come from geopolitical tensions that may escalate and have an adverse effect on international trade and value chains, and exacerbate geoeconomic fragmentation. Geopolitical risks are posed primarily by the conflicts in the Middle East and the war in Ukraine, geopolitical competition in the Indo-Pacific region, the current US National Security Strategy (particularly concerning Latin America) and geopolitical interests in the Arctic. If commodity prices are more volatile than forecast or rise, due to climate-related and geopolitical shocks as well as regional conflicts, this could boost inflation, particularly in commodity-importing countries. If environmental disasters result in crop failures, elevated food insecurity would affect low-income countries in particular. Should rising food prices result in higher inflation expectations, this may cause central banks
54
KfW Financial Report 2025
Financial Report > Combined Management Report > Forecast and opportunity report
to tighten monetary policy and damage consumer confidence. Monetary policy reactions would be required if restrictive migration policies resulted in labour market shortages, wage increases and, as a consequence, inflationary pressure. If the principles of good governance are disregarded, there is an increased risk of bad economic policy decisions.
There is also a possibility that the global economy will grow faster than forecast. This would be the case if international trade agreements substantially reduced existing trade barriers. Global economic development would also be more positive than expected if structural reforms to bolster productivity growth were implemented more rapidly and comprehensively than previously planned. Moreover, advances associated with artificial intelligence may provide unexpectedly strong impetus for productivity development.
For the euro area, KfW expects price-adjusted GDP to grow by 1.3% year on year in 2026. The expected growth rate would therefore be only 0.2 percentage points lower than in the previous year, albeit slightly below the average for the 2015–2024 period (see the table “Gross domestic product at constant prices, year-on-year change”). According to the European Commission’s Autumn Forecast, GDP growth will be boosted in 2026 by increased private and public domestic demand, underpinned by fiscal impetus from increased infrastructure and defence spending. In addition to the German fiscal package, the funds from the EU’s “NGEU” recovery programme will make a particular contribution to growth. The easing uncertainty among businesses thanks to the trade agreement between the USA and the European Union, along with the economic upturn, may result in a slight uptick in investment activity. The improved financing conditions due to monetary easing are also stimulating investment. Increasing consumer demand from private households will be a key driver of economic growth. Further real growth in household income, even if weaker year on year, due to the ongoing drop in inflation, and the stable employment situation are expected to generate higher consumer spending. Weak foreign demand due to the US tariffs and the appreciation of the euro versus the US dollar are expected to have an adverse effect on the price competitiveness of export goods, and thus exert further pressure on exports.
KfW estimates that, among the four largest eurozone countries, Germany will record growth close to the euro area average, while France and Italy can be expected to record below-average growth and Spain above-average growth compared to the euro area as a whole.
The effects on the euro area of the increased global tariffs imposed by the US may be much worse than assumed. There are also elevated risks of disruptions in supply chains in the manufacturing sector, which is heavily reliant on the import of critical raw materials from China.
KfW expects price-adjusted GDP in Germany to increase by 1.5% year on year in 2026. This would mean tangible growth for the first time since 2022, and an expected increase of 1.8% compared to 2019, the year before the outbreak of the coronavirus pandemic (see the table “Gross domestic product at constant prices, year-on-year change”). The main driver of this development would be fiscal stimulus, which KfW expects to contribute 0.8 percentage points to the aforementioned GDP growth. The impetus would be the result of significantly higher spending on defence and infrastructure targeted by the current Federal Government, which has been in office since the spring of 2025. Furthermore, there will be more working days in 2026 than in the previous year, which will make possible an additional GDP increase of 0.3 percentage points. In light of the global economic forecasts set out above, and assuming a continued increase in the purchasing power of private households and the aforementioned fiscal stimulus, KfW expects on the demand side that all GDP components, with the exception of net exports, will make positive contributions to growth. Aside from government final consumption expenditure and government investment, whose substantial expansion will be a result of fiscal impetus, the strongest growth driver is likely to be private consumption. In terms of output, KfW expects both the service sector and manufacturing to contribute to greater price-adjusted gross value added in 2026. The average annual number of persons in employment located in Germany is expected to rise again in 2026, although the skilled labour shortage is expected to increase due to demographics.
55
KfW Financial Report 2025
Financial Report > Combined Management Report > Forecast and opportunity report
Gross domestic product at constant prices, year-on-year change
|
|
2025 | 2026 forecast |
2015–2024 average |
2026 forecast |
||||||||||||||
|
|
in % | in % | in % | 2019 index = 100 |
||||||||||||||
| Euro area |
1.5 | 1.3 | 1.5 | 108.0 | ||||||||||||||
| Germany |
0.2 | 1.5 | 0.9 | 101.8 | ||||||||||||||
| USA | 1.8 | 1.9 | 2.4 | 117.0 | ||||||||||||||
In addition to geopolitical and geoeconomic risks, domestic and global economic uncertainty could have a heavier adverse impact on GDP growth in Germany than expected. Further downside risks to Germany’s price-adjusted GDP as expected by KfW are posed by additional import tariffs imposed by the USA on goods from the EU, an escalation of trade disputes between the USA and China, more shortages and sudden price increases on the energy and raw materials markets, an economic slump in China, an unexpectedly sharp downturn on the German labour market, an abrupt end to the current AI boom, and environmental and natural disasters.
There would be a chance of higher than expected growth in price-adjusted GDP in 2026 in scenarios including an unexpectedly rapid decrease in economic policy uncertainty, including the waiver of US import tariffs on goods from the EU, a substantial reform of social security systems or taxes, or a reduction of bureaucracy in Germany, an end to Russia’s war on Ukraine and the resulting additional export opportunities, a decline in the savings rate of German private households due, for instance, to a general improvement in sentiment, and in the event of a surprising boost in productivity due to artificial intelligence.
The ECB began reducing key interest rates in June 2024, and gradually reduced the deposit facility rate to 2.0%. Inflation in the euro area has been close to the ECB’s medium-term target of 2% since mid-2025, based on the Harmonised Index of Consumer Prices. KfW concurs with the ECB’s forecast that inflation will continue to develop in line with the medium-term inflation target in 2026. It therefore assumes that the ECB has ended its rate-cutting cycle and will leave key interest rates at their current level in 2026.
The ECB is continuing to shrink its balance sheet. Consequently the redemption amounts of maturing securities from the Asset Purchase Programme and the Pandemic Emergency Purchase Programme initiated during the COVID-19 pandemic are not being reinvested. This will likely result in a balance sheet reduction of around EUR 500 billion, or approximately 8% of total assets, for 2026. The yield curve (the spread between ten and two-year EUR swap rates) stabilised at around 60 basis points at the end of the rate-cutting cycle. KfW expects the curve to remain in moderately positive territory in 2026.
The US Federal Reserve also began to lower key interest rates in September 2024, and continued following a break from January to September 2025 due to the weakening labour market. KfW expects continued monetary easing in 2026, and a cut in the federal funds rate to a range of 3.00% to 3.25%. In KfW’s opinion, the US Federal Reserve is likely to continue to make decisions based on data in an uncertain economic policy environment.
The USD yield curve is likely to continue to steepen somewhat in 2026 in light of expected key rate cuts, and be slightly steeper than its euro counterpart (spread between ten and two-year USD swap rates).
56
KfW Financial Report 2025
Financial Report > Combined Management Report > Forecast and opportunity report
New business projections of KfW Group
Overview
KfW’s strategic objectives are presented to the Board of Supervisory Directors along with its planning on an annual basis. The annual planning operationalises and substantiates the objectives into a consistent whole in terms of strategy, promotion, finance, risk and funding. The Board of Supervisory Directors discusses the business strategy in accordance with regulatory requirements and acknowledges it; it further approves the annual planning in accordance with the KfW Bylaws. The internal management system supports the realisation and monitoring of objectives, with regular reports provided to the Board of Supervisory Directors.
KfW Group projects new business volume of EUR 97.5 billion for 2026. This reflects the stabilisation of new commitment growth, as well as the role KfW plays in supporting the German economy and society in times of persistent uncertainty.
KfW is careful to avoid potential adverse effects and risks to society and the environment in its promotional activities, and where possible attempts to reduce or offset such effects via suitable measures (inside-out perspective). Furthermore, KfW considers environmental changes, such as to the climate and biodiversity, social transformation and governance standards with an impact on the credit rating of KfW clients, as well as the effects of various climate scenarios on KfW’s business model and risk profile (outside-in perspective). These considerations are not expected to have any impact on the new commitment volume projected for 2026.
Domestic business
After new business development came under pressure in 2024 due to the EU interest rate benchmark and recovered in 2025, a substantial increase in new business volume is expected for the business sector Mittelstandsbank & Private Kunden (SME Bank & Private Clients) in 2026, driven by new developments in the promotional area of housing. The challenging macroeconomic environment and budget funds continue to affect new business expectations. In addition, for example, to risk-bearing capacity and passing on of favourable refinancing costs, promotional expense is yet another instrument to underpin the primary objective of promotion. The use of further promotional expense in projections creates additional incentives in the promotion of digitalisation and innovation, and in corporate environmental financing. Overall, new business volume of EUR 49.3 billion is expected for 2026. The projections allow EUR 9.6 billion for ERP programmes, which are planned to be expanded further in the digitalisation and innovation segment in particular. Around EUR 0.3 billion in ERP promotional expense is budgeted to support the positive sales impact of the ERP programmes, amounting to 59% of the total promotional expense budget.
The business sector bundles the retail business capable of being digitalised and automated and carries a large share of the domestic promotional volume. The business sector positions itself as a reliable partner to the Federal Government and is divided into two segments by customer group. The SME Bank segment supports the German economy with a wide range of promotional programmes for commercial customers with various promotional priorities. The Private Clients segment supports education and energy efficiency in the construction and refurbishment of residential buildings, and also promotes the acquisition and construction of owner-occupied housing as well as accessible conversion/construction of homes. The necessary transformation towards renewable energy, the high level of investment required to achieve climate neutrality, the persistent uncertainty regarding the energy supply due to the ongoing war and the worsening consequences of climate change have a direct impact on relevant markets and customer groups in the business sector, while also constituting an opportunity. New promotional objectives and approaches to expand renewable energy are emerging, which, among other things, serve the transformation of companies in order to achieve environmental and climate targets as well as further expanding renewable energy. In addition, the issue of climate resilience is increasingly coming to the fore as climate change intensifies.
The business sector Individualfinanzierung & Öffentliche Kunden (Customised Finance & Public Clients) bundles innovative and tailored promotional solutions for companies and banks, and promotion of municipal and social infrastructure. Based on its expertise, the business sector is responsible for implementing large-volume Federal Government-mandated transactions in the energy context and focuses its core business on the targeted promotion of environmental protection and climate action, innovation and the acceleration of digitalisation, contributing directly to the strategic focal issue “promotional mandate, impact and impetus”. The business sector’s promotional activities use own funds, federal budget funds and ERP programmes.
57
KfW Financial Report 2025
Financial Report > Combined Management Report > Forecast and opportunity report
This sector is split into three business segments. With regard to customised financing for companies, the moderate economic recovery and extended product portfolio may generate an increase in loan demand. However, even with a moderate economic recovery in Germany, potentially lower risk tolerance on the part of partner banks cannot be ruled out. This could result in greater demand for KfW’s risk participation. In this context, particularly the risk-bearing promotional products in the megatrends “climate change and environment”, “digitalisation and innovation” and “venture debt financing” are achieving greater relevance for young, growth-oriented companies.
The demand for investment in municipal and social infrastructure remains strong given the central role municipalities play in meeting the challenges presented by climate change and digital transformation. However, the strained budget situation of many municipalities in conjunction with limited planning capacities continues to limit their investment and borrowing opportunities. On the other hand, the heating transformation is expected to generate the chance of high demand for promotion and financing for geothermal energy/district heating and expansion of the electricity distribution grid.
Individual financing with financing partners in Germany and Europe, as well as funding of promotional institutions of the federal states, will continue to be characterised by a sound funding situation at partner banks, which tends to limit business potential. Export loan refinancing demand for small and medium-sized projects is robust at present, yet potential for the German export industry has waned in the face of growing geoeconomic fragmentation, tougher tariff policy and increasing competition from China. The innovative synthetic risk transfer instrument will likely present new opportunities to promote transformative investments.
Following subdued volume due to the development of the EU interest rate benchmark through the end of 2024, the business sector plans to return to its previous longer-term target level in 2026. The projected new business volume of just under EUR 10 billion includes a significant proportion of newly developed promotional programmes with Federal Government participation, such as the new hedging instrument for the transforming industries.
KfW Capital invests in venture capital (“VC”) and venture debt funds, and, via special purpose vehicles, in start-ups and innovative, high-growth technology companies to improve the sustainable provision of venture and growth capital, thereby also strengthening Germany as an innovation hub for the long term. Strengthening the German VC market is also necessary to tackle the persistent deficit in the amount of VC investment in future technologies compared to other countries. KfW Capital itself provides more venture capital directly to the market through its own fund and direct investments. Particularly in the years when private investors were hesitant to raise funds, KfW Capital successfully positioned itself as a reliable partner and financier of VC funds and thus indirectly of technology companies in Germany.
ERP Venture Capital Fund Investments and ERP/Future Fund – Growth Facility will remain the two main own-risk programmes of KfW Capital in 2026 as well. KfW Capital has also developed a co-investment approach (Scale-up Direct), in order to invest directly in portfolio companies of fund managers with whom KfW Capital already has a business relationship. In addition, this programme gives KfW Capital the opportunity to invest directly in attractive companies with high growth potential.
In 2026, the strategic focal issue “mobilising private equity” will involve fundraising for the VC umbrella fund Growth Capital II, for which KfW Capital will raise private equity funding as an investment broker following successful fundraising for its predecessor, the German Growth Fund. KfW Capital will also continue to act as financial portfolio manager for individual components of the Future Fund and as an investment advisor in connection with the German Growth Fund in 2026. Since 2025, KfW Capital has invested in VC funds that aim to generate an environmental or social return in addition to a financial return via the Impact Facility component of the Future Fund. This gives KfW Capital the opportunity to give a decisive boost to key future areas. KfW Capital promotes the creation of new VC funds and diversity in the German VC ecosystem through investments made via the Emerging Manager Facility.
In total, new business volume of around EUR 1.1 billion is expected for 2026, of which around EUR 0.5 billion is at KfW Capital’s own risk.
58
KfW Financial Report 2025
Financial Report > Combined Management Report > Forecast and opportunity report
Financial markets
KfW Group bundles all funding activities along with its liquidity and operational market price risk management in the business sector Financial markets. Other tasks include carrying out holding arrangements on behalf of the Federal Government and mandated transactions in accordance with Article 2 (4) of the KfW Law as well as advising other group units on capital market matters and carrying out capital market transactions on behalf of other group units.
In order to reinforce KfW’s sustainability profile and its positioning as a sustainable issuer, KfW consistently develops its green bond issuance strategy. The green bond programme was expanded in 2024 by linking additional loan programmes and international business. Another review of the Green Bond Framework is planned for 2026 with the aim of securing the issuance of large-volume green bonds for the long term and thus further expanding the investor base, promoting a long-term stable and well-diversified capital market position, and further promoting the issue of sustainability on the capital market.
International business
Economic and geopolitical risks, the uncertainty associated with the Russia-Ukraine war, the Middle East conflict and global economic fragmentation trends are relevant for the business sector Export and project finance. There are opportunities in Europe and in the regions relevant for Export and project finance (including North and South America, the Middle East and Asia) in sectors with growth potential (e.g., digital infrastructure, e-mobility, local public transport, energy efficiency, and investments in sustainable transformation). Economic and sustainability programmes and programmes to bolster supply security may also stimulate demand for financing, particularly for infrastructure investments and transformation projects aiming for a climate-neutral economy. Although the future development of the business sector Export and project finance continues to entail many uncertainties, from today’s perspective there are sufficient opportunities and potential for achieving the target commitment volume.
A new commitment volume totalling EUR 25.2 billion is expected for 2026. Of this amount, roughly EUR 23.0 billion is expected to be attributable to the primary business Export and project finance, and roughly EUR 2.2 billion to the commercial interest reference rate business, which cannot be controlled by the business sector.
The business sector KfW Development Bank expects a moderately reduced commitment volume in the next few years, primarily due to federal budget consolidation. The business sector will continue to support the Federal Government and the EU in achieving their development policy targets and in international cooperation, and in so doing, help to safeguard German and European interests.
The Federal Government and the EU support partner countries in fighting poverty, hunger and inequality, and mitigating crises, and also assume responsibility in the area of international environmental protection, climate action and biodiversity conservation. There will also be increased focus on (geo)strategic goals: tackling the reasons that make people flee their countries of origin, cooperation in the energy sector, economic cooperation and securing access to raw materials. Increased involvement of German and European companies is also expected to be ensured.
The federal budget funds provided for development cooperation will be reduced again in 2026. Medium-term financial planning is subject to considerable uncertainty. At the same time, budget funds remain essential for the Federal Government to achieve the ambitious targets it has set itself. KfW Development Bank has developed approaches for new instruments to support the government. These make even better use of KfW funds and, in particular, can help to mobilise additional private investment. In order to fulfil its promotional objectives, the Federal Government must also provide an adequate guarantee framework for Financial Cooperation.
59
KfW Financial Report 2025
Financial Report > Combined Management Report > Forecast and opportunity report
KfW Development Bank faces greater political expectations as well as opportunities to raise its profile in the area of climate financing. Germany has committed to the new climate financing target by 2035. There is potential for KfW Development Bank to become even more involved in international energy/climate/infrastructure financing – primarily with market funds and subject to sufficient cover options. There is also business potential from the creation of new carbon markets, which are the most resilient in the net zero emissions scenario. KfW Development Bank is able to identify suitable projects or sectors in partner countries, prepare them for certification, and promote investment with appropriate financing instruments.
KfW Development Bank currently expects a new business volume of approximately EUR 9.3 billion for 2026.
DEG is assigned to the business sector of the same name. The economic situation in developing countries and emerging economies will remain challenging in 2026 and will also present many opportunities for DEG’s business model. In light of the pressure on the development budgets of public donor countries, development cooperation is currently undergoing a structural change – from focusing solely on poverty alleviation to promoting transformational development. DEG’s private sector mandate is becoming much more significant in this context.
DEG’s objective remains to be a reliable partner and support its customers in making investments with a development impact, such as by creating jobs and incomes and contributing to development of the common good. It provides long-term financing for this purpose – in the form of loans, mezzanine capital and equity investments. This applies to local businesses as well as German and European companies that invest in developing countries and emerging economies. DEG also offers its customers advice on sustainability, climate issues, development impacts and corporate governance. It aims to support businesses in their transformation and increase their contributions to local development. In so doing, DEG also helps to mobilise private capital – a key requirement for achieving the Sustainable Development Goals and the Paris climate targets.
The high demand seen in recent years underscores the relevance of DEG’s offering. On this basis, DEG plans to pursue a scaling agenda from 2026 with a focus on expanding its lending business. A new business volume of EUR 2.6 billion is projected for financial year 2026. This growth is intended to be resource-efficient, through means including larger financing commitments for customers with suitable risk-return-impact profiles and the use of hedging instruments. The planned scaling project is to be implemented in all three business areas: Financial Institutions, Infrastructure & Energy, and Industries & Services, Private Equity and Venture Capital. Collaborative transformation work with companies is the focal point in all areas. In parallel, DEG will be continuing its own transformation – in particular by systematically digitalising its business processes. This will lay a key foundation for efficient growth and scalable business development. To secure sustainable and scaled growth beyond 2026, DEG aims to double its new business volume and mobilisation efforts by 2030. To achieve this, it is currently developing a comprehensive concept that also includes a multi-stage capital increase as a requirement for this growth path.
KfW issues bonds to fund its promotional activities worldwide. It issues these in a large number of currencies and with differing maturities, thereby addressing a variety of target groups. Based on the guarantee of the Federal Republic in accordance with Article 1a of the KfW Law, rating agencies have assigned KfW a triple A rating, signifying top credit quality. KfW has achieved an appropriate and professional position in the capital markets with its diversified long term-oriented funding strategy. The funding volume via the capital markets was approximately EUR 71 billion in 2025. A funding need of EUR 75–80 billion is projected for 2026, of which up to EUR 15 billion is expected to be issued as green bonds.
60
KfW Financial Report 2025
Financial Report > Combined Management Report > Forecast and opportunity report
In the group earnings projections for 2026, KfW expects Consolidated profit of approximately EUR 1,114 million. This puts projected earnings above the strategic target level of EUR 1 billion.
Net interest income (before promotional expense) of EUR 2.9 billion is expected for 2026. Higher income from lending business interest margins than was projected the previous year reflects the positive business performance in the business segment Export and project finance. Rising income is expected from strategic equity investments as a result of higher investment interest rates. Opportunities and risks for Consolidated profit may arise, primarily with respect to the structural contribution, from market conditions deviating from projections in conjunction with KfW’s positioning.
KfW projects Net commission income totalling EUR 0.7 billion. This includes remuneration for the implementation of promotional programmes in Germany on behalf of the Federal Government as well as remuneration based on KfW Development Bank’s General Agreement.
Administrative expense is likely to be approximately EUR 1.8 billion in 2026. This includes the launch of business policy projects such as processing and refining promotion, regulation projects, modernisation of banking systems and driving digitalisation and innovation.
Overall, the operating result before valuation is expected to be higher than was projected in the previous year.
At EUR 0.5 billion, KfW expects the standard risk costs for 2026 to be at the level of the risk provisions projected for 2025.
For 2026, KfW expects a valuation result before IFRS effects of EUR 0.4 billion from operational level equity investments (included in Net gains/losses from other financial instruments at fair value and the Net gains/ losses from investments accounted for using the equity method) and Net other operating income.
In this regard, risk provisions in the lending business and the valuation result depend on further macroeconomic developments. This may lead to significant positive or negative deviations in the projected result, especially in earnings projections for international and equity investment business.
KfW expects promotional expense of EUR 0.5 billion in 2026.
In light of the economic environment and expected demand, KfW projects new business volume of EUR 97.5 billion and consolidated profit of around EUR 1.1 billion for 2026.
The further development of the economic and geopolitical situation, the uncertainty due to the war in Ukraine, the conflict in the Middle East and global economic fragmentation trends could have an impact on German and global economic performance, which in turn may affect the achievement of KfW’s objectives set for financial year 2026. KfW will continue to closely monitor the development of the crises and uncertainty and the consequences thereof for KfW’s business.
61
KfW Financial Report 2025

Consolidated financial statements
Financial Report > Consolidated financial statements
63
KfW Financial Report 2025
Financial Report > Consolidated financial statements
64
KfW Financial Report 2025
Financial Report > Consolidated financial statements > Consolidated statement of comprehensive income
comprehensive income
Consolidated income statement
|
|
Notes | 2025 | 2024 | |||||||||||||
|
|
|
EUR in millions | EUR in millions | |||||||||||||
| Interest income from the effective interest method |
|
|
14,479 | 20,132 | ||||||||||||
| Other interest income |
|
|
1,017 | 1,049 | ||||||||||||
| Interest income, total |
(22) | 15,495 | 21,181 | |||||||||||||
| Interest expense |
(22) | 12,963 | 18,689 | |||||||||||||
| Net interest income1) |
|
|
2,532 | 2,493 | ||||||||||||
| Net gains/losses from risk provisions |
(7), (23) | –158 | 39 | |||||||||||||
| Net interest income after risk provisions |
|
|
2,374 | 2,531 | ||||||||||||
| Commission income |
(11), (24) | 711 | 693 | |||||||||||||
| Commission expense |
(24) | 39 | 30 | |||||||||||||
| Net commission income |
|
|
672 | 664 | ||||||||||||
| Net gains/losses from hedge accounting |
(8), (25), (58), (59) | –128 | 107 | |||||||||||||
| Net gains/losses from other financial instruments at fair value through profit or loss |
(26) | 30 | 44 | |||||||||||||
| Net gains/losses from disposal of financial assets at amortised cost |
(27) | 0 | 0 | |||||||||||||
| Net gains/losses from investments accounted for using the equity method |
(6), (28) | –6 | 20 | |||||||||||||
| Administrative expense |
(29) | 1,751 | 1,672 | |||||||||||||
| Net other operating income or loss |
(30) | 0 | –52 | |||||||||||||
| Profit/loss from operating activities |
|
|
1,192 | 1,641 | ||||||||||||
| Taxes on income | (19), (31) | 189 | 239 | |||||||||||||
| Consolidated profit | 1,002 | 1,402 | ||||||||||||||
| 1) | Refer to Note 22 for a gross presentation of Interest income and Interest expense related to reporting of negative interest income and positive interest expense. |
Consolidated statement of comprehensive income
|
|
2025 | 2024 | ||||||||
|
|
EUR in millions | EUR in millions | ||||||||
| Consolidated profit |
1,002 | 1,402 | ||||||||
| Other comprehensive income |
48 | 98 | ||||||||
| Change in own credit risk of liabilities designated at fair value through profit or loss |
–81 | 105 | ||||||||
| Defined benefit pension obligations (before taxes) |
135 | –6 | ||||||||
| Deferred taxes on defined benefit pension obligations |
–6 | –1 | ||||||||
| Consolidated comprehensive income | 1,050 | 1,500 | ||||||||
Other comprehensive income comprises amounts recognised directly in equity under Revaluation reserves. These amounts include income and expense from the change in own credit risk of liabilities designated at fair value through profit or loss, changes in actuarial gains and losses for defined benefit pension obligations, and changes in deferred taxes reported depending on the underlying transaction.
65
KfW Financial Report 2025
Financial Report > Consolidated financial statements > Consolidated statement of financial position
Consolidated statement of financial position
Assets
|
|
Notes | 31 Dec. 2025 | 31 Dec. 2024 | |||||||||||||||||
|
|
|
EUR in millions | EUR in millions | |||||||||||||||||
| Cash reserves |
(34) | 19,535 | 26,522 | |||||||||||||||||
| Financial assets at amortised cost |
(7), (12), (35), (36), (37), (58), (59) | 511,710 | 502,666 | |||||||||||||||||
| Financial assets at fair value |
(7), (38), (60) | 15,581 | 15,716 | |||||||||||||||||
| Value adjustments from macro fair value hedge accounting |
(8), (39), (60) | –10,444 | –9,375 | |||||||||||||||||
| Derivatives designated for hedge accounting |
(8), (40), (58), (59), (60) | 2,031 | 7,445 | |||||||||||||||||
| Investments accounted for using the equity method |
(41), (6) | 448 | 500 | |||||||||||||||||
| Non-current assets held for sale |
(13), (42) | 12 | 37 | |||||||||||||||||
| Property, plant and equipment |
(15), (43) | 925 | 922 | |||||||||||||||||
| Intangible assets |
(17), (44) | 50 | 69 | |||||||||||||||||
| Income tax assets |
(19), (45) | 83 | 109 | |||||||||||||||||
| Other assets | (11), (46) | 793 | 754 | |||||||||||||||||
| Total | 540,722 | 545,366 | ||||||||||||||||||
Liabilities and equity
|
|
Notes | 31 Dec. 2025 | 31 Dec. 2024 | |||||||||||||||||
|
|
|
EUR in millions | EUR in millions | |||||||||||||||||
| Financial liabilities at amortised cost |
(7), (47), (58), (59) | 479,133 | 485,502 | |||||||||||||||||
| Financial liabilities at fair value |
(7), (48), (60), (61) | 9,305 | 9,774 | |||||||||||||||||
| Value adjustments from macro fair value hedge accounting |
(8), (49), (60) | –16 | –16 | |||||||||||||||||
| Derivatives designated for hedge accounting |
(8), (50), (58), (59), (60) | 8,185 | 6,982 | |||||||||||||||||
| Provisions |
(7), (18), (51) | 3,027 | 2,948 | |||||||||||||||||
| Income tax liabilities |
(19), (52) | 102 | 230 | |||||||||||||||||
| Other liabilities |
(11), (53) | 362 | 374 | |||||||||||||||||
| Equity |
(20), (54) | 40,623 | 39,573 | |||||||||||||||||
| Paid-in subscribed capital |
|
|
3,300 | 3,300 | ||||||||||||||||
| Capital reserve |
|
|
8,447 | 8,447 | ||||||||||||||||
| Reserve from the ERP Special Fund |
|
|
1,191 | 1,191 | ||||||||||||||||
| Retained earnings |
|
|
27,555 | 26,552 | ||||||||||||||||
| Revaluation reserves |
(7), (20), (54) | 131 | 83 | |||||||||||||||||
| Total | 540,722 | 545,366 | ||||||||||||||||||
66
KfW Financial Report 2025
Financial Report > Consolidated financial statements > Consolidated statement of changes in equity
Consolidated statement of changes in equity
Consolidated statement of changes in equity
|
|
Subscribed capital |
Capital reserve |
Reserve from the ERP Special Fund |
Retained earnings |
Fund for general banking risks |
Revalua- tion reserves |
Total | |||||||||||||||||||||||||
|
|
EUR in millions |
EUR in millions |
EUR in millions |
EUR in millions |
EUR in millions |
EUR in millions |
EUR in millions |
|||||||||||||||||||||||||
| As of 1 Jan. 2024 |
3,300 | 8,447 | 1,191 | 25,150 | 0 | –15 | 38,073 | |||||||||||||||||||||||||
| Consolidated comprehensive income |
0 | 0 | 0 | 1,402 | 0 | 98 | 1,500 | |||||||||||||||||||||||||
| Consolidated profit |
0 | 0 | 0 | 1,402 | 0 | 0 | 1,402 | |||||||||||||||||||||||||
| Other comprehensive income |
0 | 0 | 0 | 0 | 0 | 98 | 98 | |||||||||||||||||||||||||
| Reclassifications within Equity |
0 | 0 | 0 | 0 | 0 | 0 | 0 | |||||||||||||||||||||||||
| As of 31 Dec. 2024 |
3,300 | 8,447 | 1,191 | 26,552 | 0 | 83 | 39,573 | |||||||||||||||||||||||||
| Consolidated comprehensive income |
0 | 0 | 0 | 1,002 | 0 | 48 | 1,050 | |||||||||||||||||||||||||
| Consolidated profit |
0 | 0 | 0 | 1,002 | 0 | 0 | 1,002 | |||||||||||||||||||||||||
| Other comprehensive income |
0 | 0 | 0 | 0 | 0 | 48 | 48 | |||||||||||||||||||||||||
| Reclassifications within Equity | 0 | 0 | 0 | 0 | 0 | 0 | 0 | |||||||||||||||||||||||||
|
|
||||||||||||||||||||||||||||||||
| As of 31 Dec. 2025 | 3,300 | 8,447 | 1,191 | 27,555 | 0 | 131 | 40,623 | |||||||||||||||||||||||||
The difference to the consolidated comprehensive income is allocated to Other retained earnings or – if recognised directly in equity – to Revaluation reserves.
The note “Equity” provides details on the consolidated statement of changes in equity.
67
KfW Financial Report 2025
Financial Report > Consolidated financial statements > Consolidated statement of cash flows
Consolidated statement of cash flows
|
|
2025 |
2024 | ||||||||
|
|
EUR in millions | EUR in millions | ||||||||
| Consolidated profit |
1,002 | 1,402 | ||||||||
| Non-cash items included in consolidated profit and reconciliation to cash flow from operating activities: |
|
|
||||||||
| Depreciation, amortisation, impairment and reversal of impairment losses (assets) and changes in risk provisions for lending business |
301 | 143 | ||||||||
| Changes in provisions for pensions and similar commitments and Other provisions |
329 | 264 | ||||||||
| Other non-cash expenses and income |
41 | 72 | ||||||||
| Profit/loss from the disposal of assets |
0 | 0 | ||||||||
| Other adjustments |
–2,383 | –2,325 | ||||||||
| Subtotal |
–711 | –444 | ||||||||
| Changes in assets and liabilities from operating activities after adjustment for non-cash items: |
|
|
||||||||
| Financial assets at amortised cost |
–9,249 | 444 | ||||||||
| Financial assets at fair value |
–356 | 1,061 | ||||||||
| Other assets relating to operating activities |
6,986 | –7,251 | ||||||||
| Financial liabilities at amortised cost |
–6,369 | –14,198 | ||||||||
| Financial liabilities at fair value |
–641 | –66 | ||||||||
| Other liabilities relating to operating activities |
988 | –2,836 | ||||||||
| Interest and dividends received |
15,495 | 21,181 | ||||||||
| Interest paid |
–12,963 | –18,689 | ||||||||
| Income tax paid |
–149 | –167 | ||||||||
| Cash flow from operating activities |
–6,969 | –20,965 | ||||||||
| Property, plant and equipment/Intangible assets: |
|
|
||||||||
| Cash proceeds from disposals |
10 | 17 | ||||||||
| Cash payments for acquisitions |
–82 | –90 | ||||||||
| Securities and investments (equity investments): |
|
|
||||||||
| Cash proceeds from disposals/Cash payments for acquisitions |
55 | 129 | ||||||||
| Cash flow from investing activities |
–18 | 56 | ||||||||
| Cash proceeds from/Cash payments for capital increases/decreases |
0 | 0 | ||||||||
| Changes from other financing activities |
0 | 0 | ||||||||
| Cash flow from financing activities |
0 | 0 | ||||||||
| Cash and cash equivalents as of the end of the previous period |
26,522 | 47,431 | ||||||||
| Cash flow from operating activities |
–6,969 | –20,965 | ||||||||
| Cash flow from investing activities |
–18 | 56 | ||||||||
| Cash flow from financing activities |
0 | 0 | ||||||||
| Cash and cash equivalents as of the end of the period | 19,535 | 26,522 | ||||||||
68
KfW Financial Report 2025
Financial Report > Consolidated financial statements > Consolidated statement of cash flows
The balance of Cash and cash equivalents reported in the statement of cash flows in accordance with IAS 7 is identical to the statement of financial position item Cash reserves and thus comprises cash on hand and balances with central banks.
The statement of cash flows shows the changes in Cash and cash equivalents in the financial year classified as the Cash flows from operating activities, investing activities and financing activities. The Other adjustments item consisted primarily of the adjustment for net interest income in the amount of EUR –2,532 million (2024: EUR –2,493 million). The cash payments for the repayment portion of lease liabilities included in Cash flow from operating activities amounted to EUR 9 million in financial year 2025 (2024: EUR 13 million). The cash payments for the interest portion of lease liabilities are reported under Interest paid.
For more information on the group’s liquidity risk management, see the section on liquidity risk in the combined management report.
69
KfW Financial Report 2025
Financial Report > Consolidated financial statements > Consolidated notes – Accounting policies
(1) Basis of presentation of KfW Group
KfW, the parent company of KfW Group, is the promotional bank of the Federal Republic of Germany and was founded in 1948 as a public-law institution based in Frankfurt am Main (Palmengartenstraße 5–9, 60325 Frankfurt am Main, Germany). KfW promotes the sustainable improvement of economic, environmental and social conditions around the world, but with an emphasis on the German economy.
The Executive Board of KfW is responsible for preparing the consolidated financial statements and the combined management report. The Executive Board will approve the publication of the consolidated financial statements on 5 March 2026.
As of the reporting date, KfW Group comprises KfW and six fully consolidated subsidiaries. One joint venture and two associated companies are accounted for using the equity method.
Pursuant to Section 315e (1) of the German Commercial Code (Handelsgesetzbuch – “HGB”), the consolidated financial statements as of 31 December 2025 have been prepared in accordance with International Financial Reporting Standards (“IFRS”), as adopted by the European Union (“EU”), and with the interpretations set out by the IFRS Interpretations Committee (“IFRS IC”), as mandatory consolidated accounts in accordance with Article 4 of Regulation (EC) No. 1606/2002 (“IAS Regulation”) of the European Parliament and of the Council of 19 July 2002, as well as further regulations on the adoption of certain international accounting standards. The standards and interpretations that apply are those that have been published and endorsed by the European Union as of the reporting date.
The supplementary provisions of HGB that also apply to IFRS consolidated financial statements have been taken into account. The combined management report prepared in accordance with Section 315 HGB includes the risk report with risk-oriented information on financial instruments as set out in IFRS 7, as well as information on capital and capital management as set out in IAS 1.134.
The consolidated financial statements are prepared in accordance with accounting policies that are consistent across KfW Group and on a going-concern basis. The companies included in the consolidated financial statements prepared their annual financial statements as of 31 December 2025, except for associated companies accounted for using the equity method, whose financial statements as of 30 September 2025 were used. Material events for the latter companies as of the reporting date were also taken into account.
The accounting policies in the consolidated financial statements were applied consistently with the exception of the items described in Note 3.
The reporting currency is the euro. Unless otherwise specified, all amounts are stated in millions of euros (EUR in millions).
(2) Accounting standards that are new, amended or to be adopted for the first time
A. Impact of new or amended IFRS/IFRIC interpretations adopted for the first time in the 2025 financial year
The amendments to IAS 21, published in August 2023, require an entity to apply a consistent approach when assessing whether a currency is exchangeable into another currency. KfW classifies a currency as exchangeable if, at the time of valuation, it is actually exchangeable via enforceable markets or mechanisms without undue delay. Additional information must be disclosed in cases of non-exchangeability. No such circumstances arose to any material extent.
The accounting standards that are new, amended or to be adopted for the first time have no significant impact on the net assets, financial and earnings position of KfW Group.
71
KfW Financial Report 2025
Financial Report > Consolidated financial statements > Consolidated notes – Accounting policies
B. New or amended IFRS/IFRIC interpretations to be adopted in the future that were endorsed by the EU into European law before the reporting date
|
| ||||||
| Standard concerned |
Mandatory application for financial years from |
Description | ||||
|
|
|
| ||||
| IFRS 9 /IFRS 7 | 1 Jan. 2026 | The amendments to IFRS 7 and IFRS 9 published in May 2024 relate, among other things, to the requirements in IFRS 9 on the derecognition of financial liabilities using electronic payment systems and on the classification of financial assets, particularly taking into account conditional interest payments (linking interest to ESG factors). In addition, disclosure requirements have been added for financial instruments with conditional cash flows (e.g., those tied to ESG factors) and for investments in equity instruments recognised at fair value directly in equity. In mid-December 2024, the IASB published amendments to IFRS 9 and IFRS 7 on nature-dependent electricity contracts. Accordingly, the own-use exception in accordance with IFRS 9.2.4 et seq. is to be applied to long-term physical power purchase agreements if the company has been a net purchaser of renewable electricity under the contract to date and is expected to be a net purchaser for the entire remaining term of the contract. Furthermore, adjustments to the requirements for hedge accounting in IFRS 9 are planned that will make it possible to use contracts for electricity from renewable energy sources as a hedging instrument under certain conditions. The hedge accounting requirements in accordance with IAS 39 remain unaffected. Moreover, additional disclosure requirements are to be effected in order to better understand the effects of nature-dependent electricity on the financial performance and future cash flows of an entity. | ||||
|
|
|
| ||||
| AIP – Volume 11 |
1 Jan. 2026 | At the end of July 2024, the IASB published the “Annual Improvements to IFRS Accounting Standards – Volume 11” with clarifications and corrections: | ||||
| IFRS 1: | Hedge accounting by a first-time adopter. In IFRS 1 paragraphs B5 and B6, cross-references to IFRS 9 6.4.1 have been added, and the term “conditions” has been replaced by “qualifying criteria”. | |||||
| IFRS 7: | Gain or loss on derecognition. Disclosure of deferred difference between fair value and transaction price, credit risk disclosures. In particular, changes have been made to referencing and wording to eliminate ambiguities and inconsistencies. | |||||
| IFRS 9: | Lessee derecognition of lease liabilities; transaction price. IFRS 9 2.1 (b)(ii) is supplemented by a cross-reference to the IFRS 9 rules on accounting for profit or loss on disposal. The reference to the definition of transaction price in accordance with IFRS 15 in IFRS 9 5.1.3 and in Appendix A has been removed, as the term “transaction price” is used in certain sections of IFRS 9 in a context that does not necessarily correspond to the definition of this term in IFRS 15. | |||||
| IFRS 10: | Determination of a ‘de facto agent’. The amendment resolves a confusion between IFRS 10 paragraphs B73 and B74 by aligning the language in the two paragraphs. | |||||
| IAS 7: | Cost method. In IAS 7 paragraph 37 the term “cost method” has been replaced by “at cost”.
| |||||
KfW does not intend to use the permitted early-application options of the standard amendments. The changes in IFRS 9 concerning financial instruments with conditional cash flows that are not directly linked to fundamental credit risks and costs have no material impact on the financial statements. The process for assessing the cash flow criterion for these financial instruments will take account of the changed requirements from 2026. The disclosure requirements under IFRS 7 relate to ESG-linked financing. Environmental factors are the focus of the conditional events. These result in a margin adjustment based on the reduction in carbon emissions. Measures designed to implement the new disclosure requirements are largely complete. The standard amendments to IFRS 9/IFRS 7 concerning nature-dependent electricity contracts and the clarifications from the Annual Improvements to IFRS Accounting Standards – Volume 11 did not have any impact on the group’s net assets, financial and earnings position.
72
KfW Financial Report 2025
Financial Report > Consolidated financial statements > Consolidated notes – Accounting policies
C. New or amended IFRS/IFRIC interpretations to be applied in the future that were published by the EU before the reporting date but have not yet been endorsed into European law
| Standard concerned |
Effective for financial years from |
Description | ||
|
|
|
| ||
| IFRS 18 | 1 Jan. 2027 | The new standard IFRS 18 ‘Presentation and Disclosure in Financial Statements’ will replace the previous IAS 1 ‘Presentation of Financial Statements’ and is aimed at more transparent presentation and comparability of the performance of entities with a focus on a restructured income statement. Income and expenses are divided into five categories (operating, investing, financing, income taxes, and discontinued operations) with the income statement broken down by predefined subtotals. IFRS 18 also contains provisions to improve the summary and breakdown of items, as well as disclosure requirements for management-defined performance measures that are not specified in IFRS accounting standards.
| ||
|
|
|
| ||
| IFRS 19 | 1 Jan. 2027 | The new standard IFRS 19 ‘Subsidiaries without Public Accountability: Disclosures’ permits certain subsidiaries to apply IFRS accounting standards with reduced disclosures. An entity may elect to apply IFRS 19 if it is a subsidiary (within the meaning of IFRS 10), does not have public accountability (is not a financial institution and not capital markets-oriented) and has an ultimate or intermediate parent that produces publicly available consolidated financial statements that comply with IFRS accounting standards.
| ||
|
|
|
| ||
| IAS 21 | 1 Jan. 2027 | The IASB issued standard amendments to IAS 21 ‘Translation to a Hyperinfla- tionary Presentation Currency’ in November 2025. This requires that amounts for translation from a non-hyperinflationary currency into a hyperinflationary one be translated at the exchange rate on the most recent reporting date, including the comparative figures. If the presentation currency is no longer hyperinflationary, the previous method is prospectively to be used without adjusting the comparative figures. The use of methods and changes to hyperinfla- tionary status are to be disclosed. There is an exception regarding currency translation for companies that apply IAS 29.
| ||
KfW does not intend to use the permitted early-application options of the standard amendments. These amendments are expected to have only minor effects, if any, on KfW’s net assets, financial and earnings position. The introduction of IFRS 18 results in changes in the presentation and disclosure in the consolidated financial statements, relating in particular to future classification in the income statement, and will result in additional notes to the financial statements, primarily in connection with the requirements to disclose management-defined performance measures not specified by the IFRS Accounting Standards.
(3) Changes to material accounting policies
There were no changes to material accounting policies in the reporting period.
(4) Judgements and accounting estimates
The consolidated financial statements include amounts based on management’s judgement and/or estimates and assumptions which are determined to the best of management’s ability and in accordance with the applicable accounting standard. Actual results realised in a future period may differ from these estimates. Material judgements, estimates and assumptions are required, in particular, for calculating risk provisions (including risk provisions in the lending business), recognising and measuring provisions (primarily for pension liabilities and legal risks), measuring the fair value of financial instruments based on valuation models (including determining the existence of an active market), determining remaining terms of leases, assessing and measuring impairment of assets, and assessing the utilisation of deferred tax assets. The estimates and the assumptions underlying these estimates are reviewed on an ongoing basis and are based, among other things, on historical experience or expected future events that appear likely given the particular circumstances. Where judgements as well as estimates and their underlying assumptions were required, the assumptions made are explained in the relevant notes.
KfW Group does not expect any deviations from its assumptions and does not foresee any uncertainties in its estimates that could result in a material adjustment to the related assets and liabilities during the next
73
KfW Financial Report 2025
Financial Report > Consolidated financial statements > Consolidated notes – Accounting policies
financial year. Given the strong dependency on the development of the economy and financial markets, however, such deviations and uncertainties cannot be fully ruled out. These risks are nevertheless low because valuation models – especially those involving the use of inputs not based on observable market data – are employed to measure only small parts of receivables, securities, investments and borrowings measured at fair value, on the one hand, and only a small portion of financial derivatives used to economically hedge risk, on the other hand.
Risk provisions for performing loans (Stages 1 and 2) are calculated using risk parameters geared to regulatory and internal credit risk models for the parameterisation of probability of default (“PD”), loss given default (“LGD”) and exposure at default (“EAD”) and adjusted to meet IFRS 9 requirements.
The current geopolitical situation remains characterised by considerable uncertainty. Including a second adverse scenario in the calculation of risk provisions assumes an increased risk of sharply rising raw material and energy prices, extensive supply chain disruptions and an economic slump that could be triggered by escalating trade conflicts and geopolitical tension. The adverse scenario has been included as a post-model adjustment with a weighting of 45% (compared with 30% as of 31 Dec. 2024) since the first quarter of 2025, to reflect the greater forecast uncertainty. The heavier weighting resulted in an increase of EUR 46 million in risk provisions in 2025.
In addition to geoeconomic risks, climate-related risks, as a category of ESG risks, may also affect credit risk and thus risk provisions through various risk drivers.
Relevant ESG risk drivers are identified consistently throughout KfW Group using the ESG materiality assessment, and are taken in account in risk management via the ESG risk profile. They are also considered in the rating processes within non-retail business. In this process, the climate, environmental and social risks highlighted in the ESG risk profile indicate any necessary adjustment to the credit rating where they are not already adequately reflected. This procedure also applies for eligible personal collateral. In this way, relevant climate-related risks within ESG risks are taken into account in determining risk provisions in both the probability of default and loss given default.
In addition to individual consideration of each climate-related risk directly in the rating process, they are also included – if relevant – in the use of macroeconomic and other influencing factors in the point-in-time adjustment of probabilities of default; of particular note is the effect on transition climate risks on energy-intensive sectors. Climate-related risks may additionally appear as risk drivers in the second adverse scenario if significant impacts are expected in the short term.
Given that risk drivers in credit risk are subject to a complete analysis for the purpose of determining risk provisions, both the impacts of macroeoconomic factors in the base scenario and the adverse scenario are predominantly charcterised by geopolitical risks and impending trade conflicts in the current environment, and to a lesser extent by climate-related risks.
In addition to risk provisions, climate-related risks may also affect the calculation of fair value of the equity investments. If climate-related risks are known at the time of valuation, they are included in the calculation.
Please refer to the relevant sections of the combined management report (risk report) for further information on the consideration of ESG risks in risk management.
The Act for a Tax-Based Immediate Investment Programme to Strengthen Germany as a Business Location (Gesetz für ein steuerliches Investitionssofortprogramm zur Stärkung des Wirtschaftsstandorts Deutschland) provides for a gradual reduction in the corporation tax rate, currently 15% until 2027, to 10% by 2032. Determination of deferred taxes is to be based on the tax rate expected to be applicable at the time of reversal of temporary differences. The transition to the future tax rates primarily affects the deferred taxes of KfW IPEX-Bank, particularly pension provisions, loans and advances to customers and risk provisions, and to a lesser extent also Interkonnektor as regards valuations of equity investments and tax loss carryforwards.
74
KfW Financial Report 2025
Financial Report > Consolidated financial statements > Consolidated notes – Accounting policies
The effect of the reduction in the corporation tax rate from 15% (as of 31 Dec. 2024) to the future rates amounted to EUR 12 million as of 31 December 2025. The effects relate largely to the differences in measurement of statement of financial position items, and only to a small extent to tax loss carryforwards.
The ongoing tense geopolitical environment also had an impact on foreign exchange rates. Most importantly, this resulted in a significant devaluation of the US dollar, with corresponding effects on KfW Group’s earnings position. An expansion of the hedging volume through EUR/USD currency forwards has been part of the active management of foreign currency risk since the fourth quarter of 2025.
The model-based approach to determining Other comprehensive income (“OCI”) was further developed in financial year 2025 for fair value designated liabilities in line with the market standard (change in estimate). This involved, from April 2025 onwards, changing the parameter used to measure the KfW funding spread, from an almost risk-free reference curve (the synthetic EONIA) to the ESTR. This resulted in a one-time income statement effect of EUR –44 million in Net gains/losses from other financial instruments at fair value through profit or loss, split between certificated liabilities and liabilities to banks and customers, as well as in an increase in OCI in the same amount.
(5) Group of consolidated companies
All significant subsidiaries, joint ventures and associated companies are included in the consolidated financial statements.
Subsidiaries are all business units (including structured entities) over which the group exercises control. Control exists when a group is exposed or entitled to variable cash flows through its relationship and has the opportunity to use its power of disposal to influence the amount of such cash flows. Subsidiaries are included in the consolidated financial statements (full consolidation) from the point at which control is transferred to the group. They are deconsolidated when control is lost.
Joint ventures and associated companies are included in the consolidated financial statements in accordance with IFRS 11/IAS 28 if a joint agreement is in place or the group has significant influence. Significant influence exists when KfW can participate in financial and business policy decisions regarding the associated company even if it does not have sole or joint control.
The composition of the group of consolidated companies has not changed since the consolidated financial statements as of 31 December 2024.
The composition of the group of consolidated companies is presented in the Notes under “List of KfW Group shareholdings”.
Consolidation involves revaluing the total assets and liabilities of the subsidiaries at the acquisition date, irrespective of the equity interest held, incorporating them into the consolidated statement of financial position and accounting for them in subsequent periods in accordance with the applicable standards. If the revaluation adjustments result in an excess compared to acquisition cost, this excess amount is capitalised as goodwill. No goodwill is currently recognised.
Any intercompany assets and liabilities as well as expenses and revenues from transactions between consolidated group companies are eliminated through debt consolidation, or earnings and expenses consolidation, respectively. Intercompany profits between fully consolidated companies are also eliminated.
Investments in associates and joint ventures are accounted for using the equity method. The group’s share of the profits or losses of associates and joint ventures is recognised in the “Net gains/losses from investments accounted for using the equity method” line item in the income statement.
There are no minority interests within KfW Group.
75
KfW Financial Report 2025
Financial Report > Consolidated financial statements > Consolidated notes – Accounting policies
A. Classification and measurement
A financial instrument is any contract that gives rise to a financial asset of one entity and a financial liability or equity instrument of another entity. The rules under IFRS 9 “Financial Instruments” serve as the basis for recognition and measurement of financial instruments.
Classification of financial assets at initial recognition thus determines their subsequent measurement. Classification and subsequent measurement of debt instruments is based on the business model and characteristics of the contractual cash flows (solely payments of principal and interest, or “SPPI” criterion). Equity instruments, on the other hand, must always be measured at fair value.
IFRS 9 distinguishes between four categories of measurement for financial assets:
1. At amortised cost;
2. At fair value through profit or loss (“FVTPL”), with the two sub-categories: mandatory and designated;
3. At fair value through other comprehensive income (“FVTOCI”) with no recycling into profit or loss (not used in the group);
4. At fair value through other comprehensive income (“FVTOCI”) with recycling into profit or loss (not used in the group).
Instruments are assigned to business models on a portfolio basis. IFRS 9 provides for three business models to manage financial assets:
1. Hold to collect – financial assets are held with the objective of collecting contractual cash flows.
2. Hold to collect and sell – financial assets are held with the objective of both collecting the contractual cash flows and selling the financial assets (not
used in the group).
3. Hold to sell – financial assets held with the objective of selling, or which do not fulfil the “hold to collect” or “hold to collect and sell” criteria.
The cash flow criterion is assessed for each individual financial asset as the second step. The cash flows of financial instruments are then checked for consistency with a basic lending arrangement and as to whether they thus constitute SPPIs on the outstanding loan balance. IFRS 9 defines interest as compensation for the time value of money and credit risk assumed, although it can also include a premium for liquidity risk. As is customary for the sector, compensation (e.g. for equity or administrative costs,) and a profit margin may also be included.
If payments contain payments beyond SPPIs, they must be measured at fair value. This also applies to non-recourse financing where the cash flows of the financed asset are increased or limited in such a way that they no longer constitute interest or principal payments in economic terms and the bank is consequently not exposed to a credit risk but rather to a project or investment risk.
A financing agreement condition does not affect classification if its effect on the contractual cash flows of the financial asset is only minor (de minimis). The group employs group-wide rules and a standardised classification of contractual covenants in assessing the SPPI criterion. For sustainability-linked loans in which the interest rate varies depending on compliance with defined ESG criteria, a de minimis threshold value is generally taken as the basis for assessing the SPPI criterion. The threshold value refers to the level of margin variability.
An assessment is made in non-recourse loans as to whether mitigation of the property or project risks creates a sufficient risk buffer and whether this then outweighs the credit risk.
A financial asset must have been allocated to a portfolio with the “hold to collect” business model and meet the cash flow criterion for measurement at amortised cost. The KfW business model is focused on a long-term sustainability approach. As the group does not enter into any transactions with the intention of generating a short-term profit, the Executive Board has decided on the “hold to collect” business model for
76
KfW Financial Report 2025
Financial Report > Consolidated financial statements > Consolidated notes – Accounting policies
all credit portfolios (except for the two cases mentioned below). Moreover, the group’s lending business is largely consistent with the definition of a basic lending arrangement, and thus meets the SPPI criterion. The two exceptions to the “hold to collect” business model in the lending business are as follows:
| - | Holding arrangements for the Federal Republic of Germany: Holdings KfW maintains by mandate for the Federal Republic of Germany are not subject to KfW management. Sales are to be executed upon the Federal Government’s instruction. As KfW cannot assume that these positions will remain in the portfolio for the long term, it cannot assume a “hold to collect” intention. |
| - | KfW IPEX-Bank’s syndication business: This business focuses on short-term sales and not on the objective of holding and selling the assets in equal measure. |
Both cases of exception are assigned to the “hold to sell” business model. The holdings are measured at FVTPL.
Securities portfolios are also assigned to the “hold to collect” business model. This applies to the group’s liquidity portfolio as well. As the group places minimum requirements on the ECB-eligibility of securities with regard to its liquidity portfolio, liquidity is secured by means of repo transactions. This therefore means that sales from the liquidity portfolio are unnecessary. The ancillary agreements are recorded and evaluated in the system to check the SPPI criterion. Securitisations are checked on a case-by-case basis to address the special rules for “contractually linked instruments”. Consequently, the group’s securities portfolios are largely measured at amortised cost using the effective interest method, as is its lending business.
The group’s investments from equity finance are accounted for at fair value through profit or loss, as these are either equity instruments or debt instruments with no fixed interest or principal payments. The group does not exercise the option of FVTOCI for equity instruments.
Consequently, the group applies only the first two categories for financial assets: amortised cost and FVTPL.
IFRS 9 only provides for two categories for financial liabilities: amortised cost and FVTPL. Financial liabilities are accounted for at FVTPL if they are classified as held for trading (mandatory fair value) or assigned to this measurement category at initial recognition through application of the fair value option (designated fair value); otherwise, they are accounted for at amortised cost. The classification must be irrevocably determined at initial recognition. Reclassification is not permitted.
All non-derivative financial liabilities are held for non-trading purposes in the group. All non-derivative financial liabilities for which the fair value option has not been exercised are classified as liabilities at amortised cost. These are thus measured at amortised cost using the effective interest method. For the group, this category covers funding reported in Financial liabilities at amortised cost (Liabilities to banks, Liabilities to customers and Certificated liabilities). The fair value option is exercised for some structured liabilities such as promissory note loans (Schuldscheindarlehen) and certificated liabilities. This concerns liabilities with bifurcated structures as well as liabilities with non-bifurcated structures for which there is an accounting mismatch unless they meet the requirements for application of hedge accounting. In exercising the fair value option, valuation effects resulting from changes in own credit risk are recognised directly in equity in the revaluation reserve.
Derivatives are concluded solely for hedging purposes in the group and measured at FVTPL.
Derivatives are recognised as of the trade date, and all other financial assets as of the settlement date. They are derecognised when the contractual rights from the assets have expired, the power of disposal or control has been transferred, or a substantial portion of the risks and rewards has been transferred to a third party unrelated to KfW Group. Financial liabilities are derecognised if the obligations specified in the contract have been discharged or cancelled or have expired.
Financial instruments are initially recognised at fair value. Directly attributable transaction costs are included as incidental acquisition costs. Loans subsequently to be measured at fair value are an exception, with their transaction costs recognised directly.
Financial instruments subsequently measured at amortised cost are measured based on the fair value at initial recognition, taking into account any principal repayments, impairments, and where applicable,
77
KfW Financial Report 2025
Financial Report > Consolidated financial statements > Consolidated notes – Accounting policies
contractual amendments. The amortisation of premiums and discounts, transaction costs and fees is performed in accordance with the effective interest method on the basis of the contractual cash flows. Discounts are amortised in the promotional lending business until the end of the first fixed interest rate period (generally five to ten years).
Subsequent measurement at fair value for recognition in the financial statements or for the disclosure of financial instruments in the Notes is presented in Section D. “Fair value” below.
In accordance with Article 2 (4) of the KfW Law, the German Federal Government may mandate transactions to KfW on a case-by-case basis involving a public interest on the part of the Federal Republic of Germany. Such transactions are referred to as mandated transactions (Zuweisungsgeschäfte). This means that KfW is mandated by the Federal Government to enter into or acquire certain financial instruments. Both equity and debt instruments can be used for such purposes. Mandated transactions are accounted for by applying the generally accepted IFRS rules on additions and disposals, but also on the receipt of income.
Due to the supplemental agreements with the Federal Government often associated with mandated transactions, the disposal criteria and, in particular, the existence of on-lending agreements must also be checked. In addition, a review of the initial recognition of the relevant financial instruments must be conducted. On-lending agreements ensure that cash flows between KfW and the counterparty to a given agreement are ultimately passed on to the Federal Government. While the disposal criteria are normally not met with respect to debt instruments, they are generally met when applied to equity instruments, and the financial instrument is thus de-recognised immediately after initial recognition in the statement of financial position. Equity instruments resulting from mandated transactions are therefore not recognised in the financial statements, but are included in disclosures on trust activities in the notes. See section “Other notes”, notes on “Trust activities and administered loans” and “Related party disclosures”.
B. Impairments
In the group, provisions for loan losses are accounted for in accordance with IFRS 9 requirements and applied to the following financial instruments:
| - | Loans and receivables as well as third-party securities measured at amortised cost; |
| - | Loan commitments not measured at fair value through profit or loss; |
| - | Financial guarantees not measured at fair value through profit or loss. |
Impairments are calculated based on a three-stage model. All assets are assigned to Stage 1 at initial recognition and an impairment is calculated that is equivalent to the 12-month expected credit loss (“ECL”).
The change in credit risk since initial recognition of a financial instrument is then used in determining the ECL. If there has been a significant increase in credit risk (Stage 2), or there are objective indications of impairment (Stage 3), ECLs are recognised as lifetime expected losses. If, in contrast, there has been no significant increase in credit risk, the financial instrument is still assigned to Stage 1 and only the ECLs for the term of the instrument resulting within the next 12 months from potential loss events are taken into account.
A lifetime ECL is recognised for financial instruments in Stage 2 as risk provisioning. This is based on risk parameters oriented to regulatory and internal credit risk models for parameterisation of probability of default (“PD”), loss given default (“LGD”) and exposure at default (“EAD”). Interest income for financial instruments in Stage 2 is recorded using the effective interest method based on the gross carrying amount.
A lifetime ECL is also recognised for financial instruments in Stage 3 as risk provisioning. Assignment to Stage 3 and thus classification as impaired is undertaken in line with the group-wide default definition, which reflects the definition of “default of an obligor” in accordance with Article 178 of the Capital Requirements Regulation. The definition distinguishes between the 90 days past due and unlikely to pay criteria. A distinction is made in calculating impairment in Stage 3 between significant (non-retail) and non-significant (retail) financial instruments. Impairment for retail business in Stage 3 is calculated based on risk parameters and applying a PD of 1. Individual impairment is recognised for incurred losses and is computed on the basis of individual loans for significant portfolios in the lending business. The amount of the impairment loss equals the difference between the carrying amount of the loan and the present value of discounted expected future cash flows from interest, redemption payments and collateral cash flows.
78
KfW Financial Report 2025
Financial Report > Consolidated financial statements > Consolidated notes – Accounting policies
Any reversals of individual impairment losses are accounted for through profit or loss. Interest income for these financial instruments is recognised based on the net carrying amount.
In contrast to the lending business, expected losses for defaulted securities are not calculated based on cash flow but instead on market values in Stage 3. This is due to the assumption that the market value in the case of impairment is primarily influenced by credit rating factors.
Purchased or originated credit-impaired financial assets (“POCI”) are not significant due to the group’s business model. The group has therefore decided not to separately disclose these special requirements. If there are individual cases that meet the POCI definition, they are assigned to Stage 3 based on the default rating at the time of purchase.
In assigning an asset to a stage, the group uses a nuanced approach that takes both ratings and qualitative information into account.
It uses the change in the probability of default over the remaining term (lifetime PD) compared with the probability of default expected for this period at the time of initial recognition (forward lifetime PD) as a basis to assess whether a transaction can migrate from Stage 1 to Stage 2. This ensures that only transactions for which there is a significant deviation from the originally expected probability of default are transferred to Stage 2. Concessions (contractual modifications) made to the obligor for economic or legal reasons (forbearance), are also considered as a factor in transfer to a subsequent stage. KfW uses portfolio-level assessment (collective assessment) only in justified cases for risky portfolios.
As there is no individual rating specific to an obligor in the retail business, transfers from Stage 1 to Stage 2 are based on other credit deterioration indicators, such as negative factors or 30-days-past-due status.
The group does not exercise the option of waiving assessment on whether there has been a significant increase in credit risk, if the instrument is determined to have low credit risk at the reporting date (low credit risk exemption).
The IFRS 9 impairment model takes a symmetrical approach to migration, meaning that forward migration to Stage 2 or Stage 3 as well as reversion back from Stages 2 and 3 are possible. Periods of good conduct are defined for the retail business, based on previous past-due status (> 30 days) or default. These range from 90 days to two years, depending on the specifics of the case. This accounts for the fact that no rating-based transfer criterion is applied to the retail business, and therefore, for example, in the absence of a payment default (> 30 days) without a good conduct period, there would be an immediate reversion to Stage 1.
Expected credit losses for Stage 1 and Stage 2 and the retail business in Stage 3 are calculated based on individual transactions using statistical risk parameters. The regulatory and internal credit risk models for parametrisation of PD, EAD and LGD that are used in risk management serve as the basis for this calculation. These parameters are adjusted as appropriate to determine expected credit losses in accordance with IFRS 9. This approach makes it possible to apply a largely uniform credit risk modelling in line with regulatory, risk management and IFRS requirements even though they may individually differ somewhat in scope. Fundamentally, best estimate parameters are therefore used to determine the expected credit loss; margins of conservatism are not included. Downturn components are only taken into account in the risk parameters in crisis situations.
Calculation of one-year PD is based on the internal rating system, in which every exposure is assigned a PD score that corresponds to a rating scale of 18 levels for non-defaulted transactions and two levels for defaulted transactions. The lifetime PDs are derived from the one-year PD via migration matrices. For IFRS-9-compliant PD modelling, the internal credit risk parameters are adjusted by placing a greater weight on macroeconomic factors from a point-in-time perspective. The adjustment is made through segment and rating-specific modelling of PD premiums and discounts on regulatory PD (through-the-cycle PD). This is based on expert estimates of the economic situation of sectors and countries, with assessment of expected effects, taking into account forward-looking information. This approach differs for the retail business, for which premiums and discounts are calculated applying an expert model based on econometric factors.
LGD is the loss ratio that results in the event of default after taking collateral into account. In accordance with IFRS 9 impairment requirements, a multi-year view without taking internal costs into account is generally
79
KfW Financial Report 2025
Financial Report > Consolidated financial statements > Consolidated notes – Accounting policies
required. The regulatory LGD parameters are adjusted so that internal costs for IFRS 9 are not included in the calculation of expected credit losses.
The EAD for a given quantum of time corresponds to the loan drawdown expected at the time of default, taking into account additional drawings on open lines of credit. For the off-balance sheet portion, the expected drawdown is calculated based on credit conversion factors.
The macroeconomic information to be considered when calculating ECLs is included through both the point-in-time adjustment of the probability of default and a second macroeconomic scenario, in order to address forecast uncertainty in the current macroeconomic environment.
Risk provisions for on-balance sheet lending and securities business are deducted directly from the statement of financial position line item Financial assets at amortised cost. Risk provisions for the off-balance sheet lending business are accounted for on the liabilities side under Provisions (sub-item: Risk provisions for lending business).
Credit risks resulting from the on- and off-balance sheet lending business and from financial assets measured at amortised cost are accounted for through impairments recognised in profit or loss in the amount of the one-year expected credit loss (Stage 1) or the lifetime expected credit loss (Stage 2 and Stage 3). Additions to and reversals of risk provisions are recognised in Net gains/losses from risk provisions in the income statement.
An asset is written off in the event that it, or a portion thereof, is estimated as irrecoverable. In the non-retail business, this is not performed until there is no longer a prospect of recovery, as, for instance, all collateral has been realised or, in the event of insolvency, creditor quotas have been distributed or insolvency proceedings have been discontinued for lack of assets. Write-offs in the retail business are performed pursuant to defined criteria such as insolvency or a fixed default period, which are both related to termination of the loan. Recovery is pursued as long as it is economically viable.
In the case of a write-off, the gross carrying amount is reduced by the amount of the write-off. Current provisions for loan losses are utilised first, and any remaining amount is written off directly. Similar to recoveries on loans already written off, this direct write-off is also reported through profit or loss in the Net gains/losses from risk provisions item.
C. Contractual modifications
Contractual modifications are credit rating or market-induced adjustments to contractual cash flows. By contrast, an adjustment of contractual payments agreed at the time the contract was concluded is not deemed a contractual modification.
Substantial contractual modifications result in derecognition of financial assets even if the same or the modified contract legally remains valid. The modified financial instrument is treated in accordance with IFRS 9 as a new contract and reclassified on the basis of classification criteria. Derecognition resulting from substantial modification is not relevant for the “hold to collect” business model.
There is no write-off for non-substantial contractual modifications. Instead, the gross carrying amount is adjusted to the present value of the modified cash flows calculated using the original effective interest rate. This valuation difference is recognised in profit or loss as a modification gain or loss and amortised through net interest income on subsequent reporting dates.
The modification list serves as the group-wide basis for identification of relevant contractual modifications. This distinction between substantial and non-substantial modification is normally made based on qualitative criteria such as contractual amendments that result in a violation of the cash flow criterion within the meaning of IFRS 9 4.1.1(b).
In the event of a non-substantial modification, an assessment must be made of whether the credit risk has increased significantly and whether a stage transfer may consequently be necessary. This ensures that a credit risk-related contractual modification triggers an ad hoc rating as an early warning signal or at least a documented review of the need for an ad hoc rating in accordance with requirements for early detection of risks. This current rating is taken into account accordingly in the assignment to stages.
80
KfW Financial Report 2025
Financial Report > Consolidated financial statements > Consolidated notes – Accounting policies
D. Fair value
Subsequent measurement at fair value, which, depending on the measurement category, is regularly determined either for recognition in the statement of financial position or for the disclosure of financial instruments in the Notes, is based on the following hierarchy at KfW Group:
Active market – allocation to level 1 (Quoted market price)
The best objective evidence of fair value is provided by published price quotations in an active market. A financial instrument is regarded as quoted in an active market if quoted prices are readily and regularly available and those prices represent current – i.e., traded on the date of conclusion or shortly before – and regularly occurring market transactions on an arm’s length basis. Together with the traded nominal volumes, the contract sizes and the number of contracts, this assessment takes into account in particular the bid-ask spreads observed which in the event of a significant increase indicate the absence of an active market.
No active market – allocation to level 2 (Valuation methods based on observable market data [model]) or level 3 (Valuation methods based in part on data not observable in a market)
If the financial instrument is not quoted in an active market, valuation techniques are used. The valuation techniques applied include, in particular, the discounted cash flow (“DCF”) method and option pricing models, as well as a comparison to the fair value of a financial instrument with almost identical characteristics (e.g., multiple-based models). The valuation techniques take account of all input parameters that the market participants would include in the pricing of that financial instrument, e.g., market interest rates, risk-free interest rates, credit spreads or swap curves. As these input parameters can generally be observed in the market and are usually the only significant parameters for measuring financial instruments using valuation techniques, the level for the financial instruments measured at fair value using valuation methods is usually level 2. This allocation also generally applies for prices quoted on inactive markets published by price service agencies.
If significant input parameters that are not observable on the market, such as expected risk-free customer margins or capital costs, are used in valuation techniques, the financial instrument is allocated to level 3.
If, at the date of initial recognition, differences arise between the market-based transaction price and the model price resulting from a valuation technique that makes significant use of unobservable parameters, an analysis is performed to determine whether there are economic reasons for these initial differences (e.g. conclusion of a transaction on a market that is not the main market for this transaction). These economic reasons only apply to a small part of the derivative portfolio of KfW Group, which comprises a hedging instrument for customers with respect to the export and project financing business. In relation to this, OTC (over the counter) derivatives in line with the market are not concluded on the main market (OTC interbank market) relevant to valuation. The initial differences determined upon conclusion of these derivatives are amortised through profit or loss over the life of the financial instruments, as the valuation parameters unobservable on the market are relevant to the valuation procedure. The reliability of this valuation technique is ensured via regular model validations.
This (valuation) hierarchy is applied in the group as follows:
Fair values are derived from active markets, in particular, for bonds and other fixed-income securities – unless there are inactive markets, and valuation techniques or prices quoted on inactive markets published by price service agencies are therefore used – as well as own issues reported on the liabilities side. Valuation techniques for non-derivative financial instruments are used primarily for products reported under Financial assets at fair value (loans and advances to banks, loans and advances to customers, and equity investments) and Financial liabilities at fair value (liabilities to banks, liabilities to customers, and certificated liabilities). Valuation techniques are also used for OTC derivatives.
81
KfW Financial Report 2025
Financial Report > Consolidated financial statements > Consolidated notes – Accounting policies
The steps detailed below are taken for certain product groups:
For securities in the Securities and investments line item, the group examines whether a financial instrument is quoted on an active market on the basis of homogeneous portfolios. Market activity is assessed based on the following criteria:
– There is more than one market maker.
– Prices are set on a regular basis.
– Prices deviate only slightly between market makers.
– The bid-ask spread is narrow.
Prices on active markets are used to determine the fair value of the group’s asset securities as of the reporting date. In addition, for parts of the portfolio, prices from price service agencies are used that do not qualify as prices quoted on active markets. Should these not be available in individual cases, valuation techniques are used to determine fair value taking into account observable market parameters. The input parameters include, in particular, changes in creditworthiness and risk-free interest rates, but they also take into account general and financial instrument-specific tightening of the market due to lower liquidity.
In measuring OTC derivatives, valuation adjustments are determined for counterparty risks (credit valuation adjustments), own default risk (debt valuation adjustments), collateral costs under credit support annexes, collateral valuation adjustments and funding cost adjustments (“FCA”). KfW’s institute-specific funding costs are used to calculate the FCA. Value adjustments are not calculated separately for each transaction but for the portfolio of transactions on which a framework agreement is based. The allocation to individual transactions is based on the relative credit adjustment approach. The resulting adjustment amounts are very low as KfW generally pledges collateral for positive market values in accordance with standard market collateral agreements. In accordance with market practices, risk-free overnight interest rates are used for the valuation of the derivatives portfolio.
The fair value of Loans to banks and customers is calculated using the DCF method based on the discounting of the risk-adjusted cash flows. The expected loss calculated for the respective reporting date is used to correct the contractual cash flows.
The holding arrangements for the Federal Republic of Germany (Platzhaltergeschäfte) are accounted for as receivables from the Federal Government. The receivables comprise the KfW-funded purchase price of the assets held for the Federal Republic of Germany as well as additional benefit from the sales proceeds of the assets. The receivables are measured at fair value, with the additional benefit being accounted for as a key value driver using current market prices of the assets held.
The valuation of equity investments is often based on generally accepted standard methods such as the DCF method for valuation of direct investments and the net asset value method for fund investments. The procedure used in the past in the equity investment environment of DEG and Capital has been refined, particularly with a view to the measurement of fund investments at fair value. Because the funds provide the net asset values at a later point in time, there is a three-month time lag between the group’s reporting date (31 December 2025) and the reporting date for the funds (30 September 2025). Measures are therefore being taken to minimise this time lag by looking through the investments as of the group’s reporting date and taking into account additional information at the level of the investments in the valuation as of the reporting date.
Plausibility checks also continue to be conducted on fund valuations to ensure the quality of the reported net asset values. These include, among other things, quality assurance measures such as standardising valuations for identical investments in different funds and analysing changes in value of the investments within the fund over time.
The Federal Republic of Germany’s liability for specific KfW liabilities in accordance with Article 1a of the KfW Law has an advantageous effect on KfW’s ability to refinance itself. In determining the fair value of KfW’s liabilities, the effect of this explicit direct state guarantee is also taken into account. The state guarantee does not represent an independent unit of account.
82
KfW Financial Report 2025
Financial Report > Consolidated financial statements > Consolidated notes – Accounting policies
The fair value of financial instruments due on demand, such as cash reserves or receivables and liabilities due on demand, is their carrying amount.
When no prices from liquid markets are available and prices on inactive markets cannot be provided by price service agencies, recognised valuation models and methods are used. The DCF method is used for securities, swaps, and currency and money market transactions with no embedded options or complex coupons. Stand-alone options, as well as derivatives with embedded options, triggers, guaranteed interest rates and/or complex coupon agreements, are measured using recognised models (e.g., Hull & White) unless they are listed on a stock exchange.
The aforementioned models are calibrated, if possible, on the basis of observable market data for instruments that are similar in terms of the type of transaction, maturity, and credit quality.
E. Financial guarantee contracts
A financial guarantee contract is a contract that requires the guarantor to make specified payments that compensate the holder for a loss it incurs because a specified debtor fails to meet its contractual payment obligations. For the guarantor, a financial guarantee contract is to be measured at fair value at initial recognition, which is zero at contract conclusion, as the value of the premium on fair value contracts is equal to the value of the guarantee obligation (net presentation). Moreover, fair value at initial recognition is no longer carried forward in such net presentation, but rather incoming premium payments are recognised through profit or loss in Net commission income. If a financial guarantee contract is not designated to the fair value measurement category at initial recognition, a provision is recognised for expected losses from a financial guarantee as part of a subsequent assessment, applying IFRS 9 rules for risk provisioning. The group does not voluntarily designate financial guarantee contracts for measurement at fair value.
For the holder, on the other hand, this is a contingent asset that may not be capitalised. However, a (non-impaired) financial guarantee contract is, for the holder, collateral that may be included in calculating risk provisions for the recognised reference asset.
Provisions for expected losses from financial guarantees are reported under Provisions for credit risks.
KfW also uses financial guarantee instruments via both public and private credit agencies as collateral for loans. Due in particular to its role as partner institution for government programmes, KfW uses both federal guarantees and guarantees from the EU’s EFSD+ (European Fund for Sustainable Development) programme in its global activities.
KfW assumes the role of protection seller in its loan programmes by assuming credit risks in the form of risk sub-participations and financial guarantees.
F. Reporting and Notes
Current interest and similar income from a financial asset are generally recorded under Interest income. If, due to the low interest environment, negative interest rates arise from a financial asset, these are also recorded in Interest income, with a minus sign. Premiums, discounts, processing fees and charges are amortised in Interest income using the effective interest method. Processing fees that are not amortised under the effective interest method are recognised under Commission income.
Any fair value changes of financial assets at fair value through profit or loss are recognised in Net gains/losses from other financial instruments at fair value through profit or loss.
Current interest arising from a financial liability is recorded in Interest expense. This also applies in the case of negative interest resulting from an environment. Premiums and discounts are also amortised in Interest expense using the effective interest method over the expected life.
Results from the repurchase of own issues categorised as liabilities measured at amortised cost are recognised at the repurchase date in Net other operating income.
83
KfW Financial Report 2025
Financial Report > Consolidated financial statements > Consolidated notes – Accounting policies
Classes for financial instruments have been largely defined in agreement with the group’s business model which is focused on the lending business. The definition is based in particular on the national requirements for balance sheet classification at banks and financial services institutions. The following classes (and sub-classes) were defined for financial assets and financial liabilities:
Transition of the statement of financial position items for financial instruments to classes in accordance with IFRS 7.6
|
Statement of financial position item |
Class |
Sub-class | ||||||||||
| Financial assets at amortised cost |
Loans and advances to banks |
Money-market transactions | ||||||||||
| Loans and advances | ||||||||||||
| Promissory note loans | ||||||||||||
| Other receivables | ||||||||||||
| Loans and advances to customers | Money-market transactions | |||||||||||
| Loans and advances | ||||||||||||
| Promissory note loans | ||||||||||||
| Other receivables | ||||||||||||
| Securities and investments | Bonds and other fixed-income securities | |||||||||||
| Financial assets at fair value | Loans and advances to banks | Money-market transactions | ||||||||||
| Loans and advances | ||||||||||||
| Promissory note loans | ||||||||||||
| Other receivables | ||||||||||||
| Loans and advances to customers |
Money-market transactions | |||||||||||
| Loans and advances | ||||||||||||
| Promissory note loans | ||||||||||||
| Other receivables | ||||||||||||
| Securities and investments | Bonds and other fixed-income securities | |||||||||||
| Shares and other non-fixed income securities | ||||||||||||
| Equity investments | ||||||||||||
| Shares in non-consolidated subsidiaries | ||||||||||||
| Other derivatives | Interest-related derivatives | |||||||||||
| Cross-currency derivatives | ||||||||||||
| Other derivatives | ||||||||||||
| Financial liabilities at amortised cost |
Liabilities to banks | Money-market transactions | ||||||||||
| Promissory note loans | ||||||||||||
| Other financial liabilities | ||||||||||||
| Liabilities to customers | Money-market transactions | |||||||||||
| Promissory note loans | ||||||||||||
| Other financial liabilities | ||||||||||||
| Certificated liabilities | Money-market issues | |||||||||||
| Bonds and notes | ||||||||||||
| Financial liabilities at fair value |
Liabilities to banks | Money-market transactions | ||||||||||
| Promissory note loans | ||||||||||||
| Other financial liabilities | ||||||||||||
| Liabilities to customers | Money-market transactions | |||||||||||
| Promissory note loans | ||||||||||||
| Other financial liabilities | ||||||||||||
| Certificated liabilities | Money-market issues | |||||||||||
| Bonds and notes | ||||||||||||
| Other derivatives | Interest-related derivatives | |||||||||||
| Cross-currency derivatives | ||||||||||||
| Other derivatives
|
84
KfW Financial Report 2025
Financial Report > Consolidated financial statements > Consolidated notes – Accounting policies
In addition, the items from the asset and liability sides of the statement of financial position, Value adjustments from macro fair value hedge accounting, Derivatives designated for hedge accounting, and Off-balance sheet transactions each form a separate class.
The Loans and advances to banks class primarily consists of the promotional lending business, in which loans are typically granted to the final borrowers through accredited commercial banks. These assets are presented in this class when the commercial banks underwrite part of the liability. Promotional loans that commercial banks on-lend without underwriting of liability are recognised in the class Loans and advances to customers.
The Loans and advances to banks and Loans and advances to customers classes also include loans that benefit from a subsidy (interest rate reductions) granted by KfW under the European Recovery Program (“ERP”) economic promotion programme. The promotional grants awarded annually to KfW through the ERP Special Fund based on the ERP Economic Planning Act (ERP-Wirtschaftsplangesetz) for the purpose of executing the ERP economic promotion programme are recognised as deferred income in other liabilities and are amortised in profit or loss under Interest income as the underlying funding expenses occur.
The Securities and investments class mainly comprises bonds and other fixed-income securities held in securities portfolios that belong to KfW and its subsidiaries, along with equity investments.
The securities portfolios mainly serve to support KfW’s liquidity position and to stabilise and ensure the group’s promotional capacity in the long term.
To achieve the same accounting treatment for equity investments with and without significant influence, individual group business areas that provide equity finance as part of their promotional mandate are considered as venture capital organisations for accounting purposes provided, they meet the respective requirements (DEG and KfW Capital). These equity investments, like other equity investments, are allocated to the Securities and investments class.
The Liabilities to banks and Liabilities to customers classes largely comprise KfW Group borrowings and money-market transactions.
Issued bonds, notes and money market securities are allocated to the Certificated liabilities class. Own issues repurchased in the open market are deducted from the liabilities as of the repurchase date.
In some of the Notes, these classes are broken down into additional sub-classes that relate mainly to products (for example, Loans and advances to banks are reported separately for money-market transactions and loans and advances).
Information about the type and extent of risks associated with financial instruments is also provided in the risk report section of the combined management report.
(8) Derivatives and hedging relationships
A. Hedging transactions / Hedge accounting
KfW Group enters into financial derivatives to economically hedge interest rate fluctuation and currency risks, particularly those related to funding, lending and securities activities. Interest rate swaps, interest rate/currency swaps and base currency swaps are mainly used for this purpose. Interest rate swaps are used to convert fixed rate interest payments of the issuances or lending transactions into variable payments. In the case of refinancing in a foreign currency, payments are also converted into the functional currency (EUR). The hedge ratio for the issues is normally 1:1. Ineffectiveness therefore results exclusively from unhedged risks such as counterparty risk or tenor or basis spread risks.
Economic hedging relationships are designated as hedge accounting relationships or designated as fair value through profit or loss by using the fair value option when the IFRS requirements are met. Economic hedging relationships can also be recognised in the financial statements through bifurcation of separable embedded derivatives on the liabilities side that are accounted for through profit or loss. In these cases, if the hedges are
85
KfW Financial Report 2025
Financial Report > Consolidated financial statements > Consolidated notes – Accounting policies
economically effective, the impact on the financial statements, with respect to the hedged risks, from the instruments used for hedging purposes and the hedged transactions will substantially offset each other, so that the group’s income statement substantially reflects the risk-mitigating impact of these hedging relationships.
However, not all economic hedging relationships qualify for hedge accounting or the fair value option. In these cases, the risk-mitigating impact of the derivatives used for hedging purposes is not reflected in the accounts because the hedged risk associated with the underlying transactions is not recognised in profit or loss under IFRS. The applicable recognition requirements may therefore lead to one-sided valuation results from the derivatives used for hedging purposes in the group’s income statement – as well as volatility in profit or loss – despite an economically effective hedging relationship.
Hedge accounting in the group is used solely in the form of fair value hedges to recognise economic hedging relationships. The hedging relationship is designated, firstly, at individual transaction and group level in the form of micro fair value hedge accounting, and, secondly, at portfolio level in the form of macro fair value hedge accounting. The group has exercised the option of applying IAS 39 rules for hedge accounting. If risk-free overnight interest rates are used in the valuation of the derivatives, this market practice is also subject to micro fair value hedge accounting for the measurement of the hedged risk related to the hedged item. The hedged risk in macro fair value hedge accounting generally relates to the variable interest rates of the derivative portfolio. The effectiveness of the hedging relationships is assessed using the dollar offset method and a regression analysis (80%–125% range for assessing effectiveness).
In micro fair value hedge accounting, interest and currency risks from bonds allocated to Securities and investments (in the Financial assets at amortised cost item) and, above all, from borrowings (in the Financial liabilities at amortised cost item) are hedged. In micro fair value hedging relationships at individual transaction level, the fair value changes attributable to the hedged risks are reported as an adjustment of the carrying amount of the hedged items with the corresponding gain or loss recognised under Net gains/losses from hedge accounting. The hedging instruments used for this purpose are recognised at fair value in Derivatives designated for hedge accounting. Changes in the value of the hedging instruments are also recognised in Net gains/losses from hedge accounting, largely compensating the profit or loss effects of the hedged items.
Macro fair value hedge accounting is used to hedge against interest risks primarily from loan receivables (in the Financial assets at amortised cost item) and firm obligations via future fixed-rate financing that are hedged against interest risks as part of dynamic asset liability management in the group. The fair value changes attributable to the hedged risks in the hedged portfolios in the Amortised cost category (loans and advances / liabilities) are accounted for in Value adjustments from macro fair value hedge accounting on the assets or liabilities side. Fair value changes attributable to the hedged risks from the hedged portfolios are reported in Net gains/losses from hedge accounting.
The hedging instruments are reported at fair value in Derivatives designated for hedge accounting. Changes in the value of these instruments are also recognised in Net gains/losses from hedge accounting, with the effect that they almost fully offset the earnings effects from the valuation of the hedged portfolios.
The portfolio of hedged items is updated monthly in the context of a dynamic hedge de-designation and designation process. The resulting fair value adjustments are amortised over the residual term of the maturity period in Net gains/losses from hedge accounting. Disposals from the hedged portfolios result in a proportional amortisation of the related fair value adjustments in Net gains/losses from hedge accounting. When cash flows from hedging instruments are derecognised while the economic hedge based on non-derivative financial instruments remains, the related fair value adjustments from the hedged portfolios are amortised in Net interest income.
If the strict hedge accounting requirements for the designation of hedging relationships between derivatives and financial assets/liabilities are not fulfilled within KfW Group, the fair value option is used in certain circumstances. The fair values of the hedging instruments are presented in Financial assets at fair value or Financial liabilities at fair value, and the changes are presented in Net gains/losses from other financial instruments at fair value through profit or loss. These are largely offset by valuation effects from the hedged transactions. Fair value changes in liabilities resulting from changes in KfW’s own credit risk are directly recognised in OCI.
86
KfW Financial Report 2025
Financial Report > Consolidated financial statements > Consolidated notes – Accounting policies
Further derivative financial instruments are used to hedge risks, but their economic hedging relationships are not reflected in the accounts. The fair values of these hedging instruments are also presented in Financial assets at fair value or Financial liabilities at fair value, and the changes are presented in Net gains/losses from other financial instruments at fair value through profit or loss.
KfW Group neither uses derivatives for trading purposes nor enters into derivatives acting as a broker or intermediary on behalf of third parties.
B. Embedded derivatives
Derivative financial instruments can be part of a hybrid (combined) financial liability as embedded derivatives. Under certain conditions, they are accounted for separately from the host contract, similar to stand-alone derivatives. They must be bifurcated if the economic characteristics and risks of the embedded derivative are not closely related to the economic characteristics and risks of the host contract. The host contract is accounted for according to its classification at inception.
KfW Group enters into contracts with separable embedded derivatives particularly with respect to its own funding. In the case of these products, the embedded derivatives must be bifurcated and recognised separately. Changes in fair value are then recognised in Net gains/losses from other financial instruments at fair value through profit or loss in the sub-line item Financial derivatives not qualifying for hedge accounting, where they have a compensatory effect on the valuation of the economic hedging derivatives.
The fair value option was selected for certificated liabilities with bifurcated (embedded) derivatives recorded prior to bifurcation.
(9) Offsetting of financial instruments
KfW uses the EUREX central clearing system to settle some of its derivative transactions. This form of settling derivative transactions results in the recognition of a net amount in the statement of financial position for the transactions affected, as the involvement of EUREX as the central counterparty (CCP) meets all of the requirements for offsetting as set out in the relevant IFRS standard. This means that positive and negative fair values of derivatives for which EUREX acts as the central counterparty are offset against the corresponding collateral and reported in a net item in the statement of financial position.
In the case of reverse repo and repo transactions, for which EUREX acts as the central counterparty, receivables and liabilities are also offset if the currencies and the value dates are the same.
In addition, framework agreements featuring netting agreements are in place between KfW and its business partners for OTC derivatives and securities repo transactions.
One form of netting is close-out netting, which provides for the elimination of all rights and obligations relating to individual transactions under the framework agreement upon termination of said framework agreement by the contractual partner, or upon the latter’s insolvency, with the rights and obligations replaced by a single compensation claim (or obligation) in the amount of the net replacement costs of the terminated individual transactions. This does not represent a present legal claim for offsetting.
Close-out netting is not to be confused with the offsetting of payments in the ordinary course of business. The same framework agreement may provide for the latter, i.e., that payments due on the same day and in the same currency may be offset and a net payment made instead of each individual payment (payment netting). This represents a present legal claim for offsetting.
KfW’s framework agreements relating to bilateral OTC derivatives (not in central clearing) generally include close-out netting agreements with the business partners. Payment netting is limited in the agreement to the relevant individual transaction, so that multiple transaction payment netting does not occur. The requirements for offsetting financial assets and financial liabilities are therefore not met for these KfW OTC derivatives.
87
KfW Financial Report 2025
Financial Report > Consolidated financial statements > Consolidated notes – Accounting policies
KfW’s framework agreements for repo transactions include close-out netting agreements and, in some cases, payment netting agreements with the business partners as well. However, as KfW does not, as a rule, perform multiple transaction payment netting with repo transactions, the requirements for the offsetting of financial assets and financial liabilities are not met for such KfW repo transactions.
In accordance with the collateral agreements concluded for OTC derivatives and repo transactions, the values of the available collateral are used in determining the single compensation claim (or obligation) in close-out netting. Both cash and securities are permitted forms of collateral under the existing collateral agreements between KfW and its business partners. The collateral agreements provide for a transfer of title in the case of securities as collateral. Consequently, the transferred securities are not subject to any selling or pledging restrictions.
(10) Foreign currency translation
The functional currency of KfW and its consolidated subsidiaries is the euro. Monetary assets and liabilities denominated in a foreign currency are converted at the spot rate as of the reporting date.
Non-monetary assets and liabilities denominated in a foreign currency are normally converted at historical rates if they are measured at (amortised) cost. Currency translation is based on the European Central Bank reference rates.
The changes in value resulting from foreign currency translation are reported in the income statement under Net gains/losses from other financial instruments at fair value through profit or loss.
(11) Revenue from contracts with customers
IFRS 15 defines the nature, amount and timing of revenue arising from contracts with customers. Such revenue includes fees which are not an integral part of the effective interest rate and which are reported under Commission income. In this context, a five-step principle-based model is to be applied to relevant customer contracts. Moreover, the Notes are to include comprehensive detailed quantitative and qualitative information. IFRS 15 does not apply to fees and charges that are an integral part of the effective interest rate as they fall under the scope of IFRS 9.
There are primarily mandate contractual arrangements with the Federal Government as contracting authority within the meaning of IFRS 15. They include fees for the administration of German Financial Cooperation for the promotion of developing countries and emerging economies, fees for the administration of certain programmes subsidised by the Federal Government, and fees for debt collection on certain loans. The group also charges fees for administrative services for other mandate agreements as well as for processing services and for services for lending and trust activities. Individual services may be grouped together into a bundle of services that qualifies as a separate performance obligation within the meaning of IFRS 15. The value of the transaction is therefore not broken down.
As performance obligations are mostly satisfied over time, revenue from customer contracts is recognised according to the measure of progress and is thus normally recognised over time.
KfW Group has no items that require recognising customer acquisition or contract fulfilment costs as assets. One-time advance payments to be allocated are deferred and recognised as contract liabilities in the statement of financial position under Other liabilities.
If the service has already been performed but fees have not yet been paid or if there is not yet any claim to payment, a contract asset is to be recognised in the statement of financial position under Other assets. If the claim becomes unconditional, the contract asset is to be reclassified as a Trade receivable adjusting the carrying amount where applicable. This rule is applied to fees for administration of certain programmes subsidised by the Federal Government. Based on the very good credit rating and short remaining life, no expected credit loss is calculated.
88
KfW Financial Report 2025
Financial Report > Consolidated financial statements > Consolidated notes – Accounting policies
(12) Promotional lending business at KfW
The general promotional loans market, which distinguishes itself from the market for general lending business, is relevant for KfW’s promotional lending business conducted as part of its legal promotional mandate. This market is characterised by the fact that promotional banks, as part of their legal mandate, pass on all funding advantages to the ultimate borrowers in financing projects eligible for promotion. In setting the terms and conditions of the corresponding promotional loans, KfW uses its current term-differentiated refinancing rates.
At initial recognition of such loans, the fair value is thus equivalent to the transaction value.
KfW also grants promotional loans which include additional subsidies granted during the first fixed interest rate period, in the form of interest rate reductions impacting KfW’s earnings position. The fair value of these promotional loans – measured using the parameters of the general promotional loan market – is thus not equivalent to the transaction value at initial recognition as in this case the interest rate is below the market rate.
The difference that normally results from such loan commitments – present value of the nominal scheduled interest rate reductions during the first fixed interest rate period – is recognised in profit or loss as an interest expense and accounted for as an adjustment to the carrying amount in loans and advances under the item Financial assets at amortised cost. The adjustment to the carrying amount is amortised in Net interest income using the effective interest rate method. In the event of unscheduled repayment in full, this is recognised in profit or loss under Interest income.
Differences that relate to irrevocable loan commitments are reported in Provisions. Changes to the portfolio are offset via the adjustments to the carrying amounts of already disbursed promotional loans recognised on the assets side.
In certain circumstances, KfW can agree with the shareholder ERP Special Fund on an obligation for future grants under ERP programmes. This obligation is recognised at the time of the contractual agreement as a provision with a negative impact on the current earnings position, and is utilised in subsequent years for specific grants under ERP programmes. The requirements for such obligations are reviewed annually before year-end and presented to the Executive Board for decision.
(13) Non-current assets held for sale
Under IFRS 5, separate presentation and measurement requirements apply to non-current assets held for sale if the assets are available for immediate sale and such sale is highly probable. Assets that meet the IFRS 5 criteria are reported in the separate statement of financial position item: Non-current assets held for sale. The IFRS 5 measurement requirements are not applied if they relate to financial assets. In this case, the IFRS 9 measurement requirements continue to apply instead.
KfW Group enters into repurchase agreements as standardised repos or reverse repos. These are combinations of simultaneous spot and forward transactions on interest-bearing securities with the same counterparty. The terms and modalities of collateral and its use follow common market practice. Credit claims are also an eligible type of collateral for open-market transactions.
The interest-bearing securities sold under repo transactions (spot sales) continue to be recognised and measured under Financial assets at amortised cost. The repayment obligation towards the counterparty is carried under Financial liabilities at amortised cost for the amount of cash consideration received. The repo rate as a fee for borrowing is recorded by the group, as the borrower, under Interest expense over the term of the agreement. The borrower is entitled to the coupon on the security. A repayment claim is recognised and measured under Financial assets at amortised cost for the amount of cash outflow generated by reverse repos. The securities received (spot purchases) are not recognised or measured. The repo rate as a fee for lending is recorded in the group as the lender under Interest income over the term of the agreement.
89
KfW Financial Report 2025
Financial Report > Consolidated financial statements > Consolidated notes – Accounting policies
(15) Property, plant and equipment
The land and buildings and the plant and equipment reported by KfW Group are carried at cost less depreciation on a straight-line basis and any impairment, both recognised in Administrative expense. In accordance with the requirements in IAS 36, an impairment is recognised if there are indications of impairment and the carrying amount of the asset exceeds the recoverable amount, i.e., the lower of fair value less costs of disposal and value in use. The useful life is determined based on expected wear and tear. KfW Group assumes an estimated useful life of 40 to 50 years for buildings, four years for workstation computer equipment and five to 15 years for other property, plant and equipment. Gains and losses from the sale of property, plant and equipment are recognised in Net other operating income.
Payments in advance and assets under construction are recognised in Other property, plant and equipment and are not subject to depreciation.
In accordance with IFRS 16 “Leases”, KfW as lessee reports each right of use in Property, plant and equipment and the associated lease obligation in Other liabilities. The lessee measures lease liabilities at the present value of the lease payments not paid at that date, discounted at the lessee’s incremental borrowing rate. The incremental borrowing rate is the rate of interest that a lessee would have to pay to borrow over a similar term, and with a similar security, the funds necessary to obtain an asset of a similar value to the right-of-use asset in a similar economic environment. Accordingly, KfW determines the incremental borrowing rate of the basis of the refinancing rate it uses for its own issues.
KfW applies IAS 36 “Impairment of Assets” to rights of use to determine whether the right of use is impaired and to recognise any impairment loss identified. Depreciation, amortisation and impairments of rights of use are reported in Administrative expense. Interest expense from discounting the rights of use and the interest compounded on lease liabilities are included in Other interest expense.
The effects on net assets, financial and earnings position, which are minimal, arise only from the “leasing buildings” class.
For short-term leases with a maximum term of 12 months and leases in which the underlying asset is of low value, KfW uses the relief provided for in IFRS 16.5 and does not recognise a right of use.
The small number of contracts in which KfW Group acts as a lessor are classified as operating leases. The leased asset is recognised under Property, plant and equipment and the corresponding rental income in Other operating income.
Under Intangible assets, KfW Group reports purchased and internally generated software at cost, less straight-line amortisation and impairments, both recognised in Administrative expense. The useful life is determined based on expected wear and tear. KfW Group assumes a useful life of five years.
Assets are impaired when the carrying amount of an asset exceeds the recoverable amount. An impairment is recorded when no future economic benefits can be identified.
Internally generated software under development is reported under Other intangible assets and is not subject to amortisation.
90
KfW Financial Report 2025
Financial Report > Consolidated financial statements > Consolidated notes – Accounting policies
Provisions include provisions for pensions and similar commitments, credit risks, interest rate reductions in irrevocable loan commitments granted by KfW in the promotional lending business and negatively affecting its earnings position, as well as other obligations of uncertain amount and timing involving a probable outflow of funds.
The employees of the group participate in a company pension plan that pays retirement, long-term disability and survivor benefits. KfW Group has various pension plans, consisting exclusively of defined-benefit schemes. The benefits largely depend on the length of company service and salary. The pension plan that was applied for new hires until 1985 offered a full pension (Gesamtversorgung), in which a certain portion of the income paid before the benefits were due was allocated as a benefit after deducting the state pension. Apart from employer-financed pension plans there are also plans in place involving contributions by employees.
The group pension plans are subject to the following risks in particular: longevity, interest rate fluctuation, pension adjustment risk as well as the risk of future changes to the assessment bases.
Longevity risk is the risk that higher expenses will be incurred for the company pension plan if the pensioners live longer than projected. In general, this risk is balanced out across all pensioners and would only have an impact if life expectancy were to rise faster in the future than anticipated.
Due to the long term of the company pension plan, provisions for pension obligations are subject to general interest rate fluctuation risks.
Pension adjustment risk largely relates to the pension plan offering a full pension (Gesamtversorgung). In this scheme, benefits are recalculated as soon as there is a change in the base income eligible for pension or the state pension to be offset. Another pension plan must be examined regularly in terms of forecast and actual pension adjustments, undertaking such adjustments if necessary.
The amount of the benefits promised under the existing pension plans in the group depends, among other things, on development of the income eligible for benefits and the social security contribution ceiling (Beitragsbemessungsgrenze). There is a risk that the basis of assessment will develop differently than was assumed.
Pension obligations are calculated by an independent qualified actuary in accordance with the projected unit credit method on the basis of group-wide uniform parameters such as age, length of company service and salary. The pension provision is recognised at the present value of the defined-benefit obligations as of the reporting date. The discount factor is based on current market conditions for a portfolio of high-quality corporate bonds/bonds from supranational issuers with a maturity matching that of the obligations. The definition of the portfolio takes into account current market conditions. Additional demographic factors (including the 2018 G Heubeck actuarial tables) and actuarial assumptions (rate of salary and pension increases, rate of staff turnover, etc.) are taken into account.
No plan assets were defined for the pension obligations of the group, so the related special accounting rules do not apply. Provisions for pensions and similar obligations are financed in-house with assets with corresponding maturities.
Actuarial gains and losses are immediately recognised at the time they occur. They occur as a result of remeasurement of pension obligations as of the reporting date compared to the figures forecast at the beginning of the year.
91
KfW Financial Report 2025
Financial Report > Consolidated financial statements > Consolidated notes – Accounting policies
Additions to pension provisions distinguish between service cost and interest expense. Service cost is reported under Administrative expense; interest expense is reported under Other interest expense. The pension provision changes recognised directly in equity comprise the actuarial gains and losses reported in Revaluation reserves; these are reported in Other comprehensive income.
Pension-like obligations include commitments for deferred compensation, early retirement and partial retirement (Altersteilzeit). Actuarial reports are prepared, and a provision is recognised accordingly for these types of commitments as well. No actuarial gains or losses are incurred.
Other provisions, including those for obligations to employees and for audit and consultancy services, are recognised at the estimated expenditure. Long-term provisions are discounted where the effect is material. Added to this are obligations arising from the assumption of the tasks of the State Insurance Company of the German Democratic Republic in liquidation (Staatliche Versicherung der Deutschen Demokratischen Republik in Abwicklung – “SinA” institution under public law), which are offset by receivables in the same amount from the Federal Agency for Special Tasks Associated with Unification (Bundesanstalt für vereinigungsbedingte Sonderaufgaben – “BvS”) reported under Other assets. If the provision is not required in full or if the reason for creating the provision no longer applies, the provision is reversed via the same income statement item that was used in creating the provision.
See the note on “Promotional lending business at KfW” for provisions relating to promotional grants.
(19) Income tax assets and liabilities
Income taxes are accounted for and measured in accordance with IAS 12. Current and deferred income tax assets are reported in the item Income tax assets; current and deferred income tax liabilities under Income tax liabilities. Current income tax assets and liabilities are recognised in the amount expected to be returned or paid in the future.
The tax rates applicable are those in effect on the reporting date or those that can be assumed with sufficient certainty to be in effect on the reporting date. KfW and DEG are exempt from income taxes pursuant to Section 5 (1) no. 2 of the German Corporation Tax Act (Körperschaftsteuergesetz – KStG) and Section 3 no. 2 of the German Trade Tax Act (Gewerbesteuergesetz – GewStG).
Deferred income tax assets and liabilities are generally recognised on temporary differences between the carrying amounts of assets and liabilities in accordance with IFRS and the corresponding tax value. Deferred tax assets are only recognised for temporary differences from items and for unused tax loss carryforwards if their realisation is sufficiently probable. The impairment test is carried out regularly on the basis of group business sector planning for each group company. Deferred taxes are measured at the tax rates expected at the time of realisation of the deferred taxes. The tax rates used are those in force or that have been announced as of the reporting date. Reversal effects for the significant temporary differences for each year affected by the tax rate reduction were forecast using appropriate methods (cash flow development and average valuations of general risk provisions carried forward). In so doing, the tax rate applicable in each year of the reversal effect was used for the calculation of deferred taxes. Deferred income tax assets and liabilities are offset on the assumption that they relate to the same taxable entity, the same tax type and the same tax authority.
If temporary differences have arisen from a transaction recognised directly in equity, the resulting deferred income tax assets and liabilities are also recognised directly in equity. Income from and expenses for current and deferred income taxes is recognised in the consolidated income statement under Income taxes.
92
KfW Financial Report 2025
Financial Report > Consolidated financial statements > Consolidated notes – Accounting policies
The equity structure is determined, in particular, by the KfW Law and the requirements of IFRS.
Pursuant to Article 10 (2) and (3) of the KfW Law, KfW’s net income for the period determined in accordance with HGB is transferred to reserves and is included in equity under IFRS.
Under IFRS, any remaining consolidated net income is allocated to Other retained earnings in the same period.
Revaluation reserves comprise transactions to be recognised directly in equity in accordance with IFRS. These include valuation results from the change in own credit risk of liabilities measured at fair value through profit or loss and from defined benefit pension obligations. They also may include deferred taxes, depending on the underlying transaction.
Assets and liabilities held by KfW Group in its own name but for the account of third parties are not recognised if the trustor retains all risks and opportunities. At KfW, this applies in particular to loans and equity investments made by KfW on behalf of the Federal Government. Both opportunities and risks remain with the Federal Government in such transactions.
Fees from trust activities are recognised under Commission income.
Further information can be found in the note “Financial instruments” in section “A. Classification and measurement” in the comments on mandated transactions.
93
KfW Financial Report 2025
Financial Report > Consolidated financial statements > Consolidated notes – Notes to the consolidated statement of comprehensive income
Notes to the consolidated statement of comprehensive income
Analysis of Net interest income
|
|
2025 | 2024 | ||||||||||||
|
|
EUR in millions | EUR in millions | ||||||||||||
| Interest and similar income from loans and advances to banks and customers |
10,187 | 10,358 | ||||||||||||
| Similar income from off-balance sheet transactions |
34 | 38 | ||||||||||||
| Interest income from securities and investments |
748 | 703 | ||||||||||||
| Interest income from hedges recognised in the statement of financial position |
3,109 | 7,464 | ||||||||||||
| Other interest income |
401 | 1,568 | ||||||||||||
| Interest income from the effective interest method |
14,479 | 20,132 | ||||||||||||
| Interest and similar income from loans and advances to banks and customers |
212 | 343 | ||||||||||||
| Interest income from securities and investments |
89 | 86 | ||||||||||||
| Interest income from Other derivatives |
715 | 619 | ||||||||||||
| Other interest income |
1,017 | 1,049 | ||||||||||||
| Interest income, total |
15,495 | 21,181 | ||||||||||||
| Interest and similar expense for liabilities to banks and customers |
401 | 795 | ||||||||||||
| Interest expense for certificated liabilities |
10,420 | 8,969 | ||||||||||||
| Interest expense from hedges recognised in the statement of financial position |
1,292 | 7,653 | ||||||||||||
| Interest expense from Other derivatives |
255 | 518 | ||||||||||||
| Other interest expense |
595 | 754 | ||||||||||||
| Interest expense, total | 12,963 | 18,689 | ||||||||||||
|
|
||||||||||||||
| Net interest income | 2,532 | 2,493 | ||||||||||||
Expenses for granting promotional loans below market rates – due to additional promotional funds in the form of interest rate reductions with an impact on KfW’s earnings position – amount to EUR 421 million (2024: EUR 408 million) and are reported in Other interest expense. In addition to the charges resulting from the present value of the nominal scheduled interest rate reductions in new lending business, the Other interest expense item also includes the expenses arising from amortisation at a constant effective interest rate. Other interest expense also contains interest expense for pension provisions in the amount of EUR 66 million (2024: EUR 62 million). Interest and similar income from loans and advances to banks and customers also comprises income from accrual-based amortisation in the amount of the pro-rata nominal planned interest rate reductions for these promotional loans in the amount of EUR 251 million (2024: EUR 211 million).
Interest income resulting from balances with central banks in the amount of EUR 390 million (2024: EUR 1,565 million) is reported under Other interest income from the effective interest method.
94
KfW Financial Report 2025
Financial Report > Consolidated financial statements > Consolidated notes – Notes to the consolidated statement of comprehensive income
Interest income from stage 3 loan receivables in the amount of EUR 41 million (2024: EUR 63 million) is reported under Interest and similar income from loans and advances to banks and customers.
Interest income from hedges recognised in the statement of financial position comprises interest income from derivatives designated for hedge accounting as well as interest income from amortisation of value adjustments from hedge accounting. Interest income or interest expense from derivatives designated for hedge accounting is recognised depending on the related hedged item in the interest income or interest expense from hedges recognised in the statement of financial position for related financial assets or liabilities. Including the interest income or expense from the hedged items and derivatives in hedge accounting means that presentation is based on the economic substance of the hedged financial assets (floating rate financial assets) or hedged financial liabilities (floating rate financial liabilities).
Gross analysis of negative interest contributions
|
|
2025 | 2024 | ||||||||
|
|
EUR in millions | EUR in millions | ||||||||
| Interest income, total |
15,495 | 21,181 | ||||||||
| Negative interest from the lending business |
39 | 49 | ||||||||
| Interest income from the deposit-taking business | 183 | 252 | ||||||||
|
|
||||||||||
| Interest income (gross) | 15,718 | 21,482 | ||||||||
|
|
|
|
|
|
||||||
| Interest expense, total |
12,963 | 18,689 | ||||||||
| Negative interest from the deposit-taking business |
183 | 252 | ||||||||
| Interest expense from the lending business | 39 | 49 | ||||||||
|
|
||||||||||
| Interest expense (gross) | 13,186 | 18,989 | ||||||||
The negative interest contributions included in Interest income resulted from loans and advances to banks, loans and advances to customers, and securities and investments.
The positive interest contributions in Interest expense are largely due to liabilities to banks and liabilities to customers and certificated liabilities.
95
KfW Financial Report 2025
Financial Report > Consolidated financial statements > Consolidated notes – Notes to the consolidated statement of comprehensive income
(23) Net gains/losses from risk provisions
Analysis of Risk provisions by transaction
|
|
2025 | 2024 | ||||||||
|
|
EUR in millions | EUR in millions | ||||||||
| Expenses for risk provisions for lending business (Loans and advances to banks/customers and off-balance sheet lending transactions) |
843 | 781 | ||||||||
| Expenses for additions to risk provisions |
798 | 730 | ||||||||
| Direct write-offs |
45 | 51 | ||||||||
| Expenses for risk provisions for securities and investments |
10 | 11 | ||||||||
| Expenses for additions to risk provisions |
10 | 11 | ||||||||
| Expenses for risk provisions |
853 | 792 | ||||||||
| Income from risk provisions for lending business (Loans and advances to banks/customers and off-balance sheet lending transactions) |
676 | 832 | ||||||||
| Income from the reversal of risk provisions |
634 | 789 | ||||||||
| Income from recoveries of amounts previously written off |
42 | 43 | ||||||||
| Income from risk provisions for securities and investments |
6 | 11 | ||||||||
| Income from the reversal of risk provisions |
6 | 11 | ||||||||
| Income from risk provisions |
682 | 843 | ||||||||
| Net gains/losses from non-substantial contractual modifications |
1 | –4 | ||||||||
| Other risk provisions for lending business | 12 | –8 | ||||||||
|
|
||||||||||
| Total | –158 | 39 | ||||||||
Analysis of Commission income
|
|
2025 | 2024 | ||||||||
|
|
EUR in millions | EUR in millions | ||||||||
| Revenue from contracts with customers |
699 | 690 | ||||||||
| From mandate contractual arrangements with the Federal Government1) |
613 | 626 | ||||||||
| Fee income from mandate agreements, processing activities and services |
23 | 20 | ||||||||
| Fee income from the lending business |
57 | 37 | ||||||||
| Other revenue from contracts with customers |
7 | 7 | ||||||||
| Other commission income |
11 | 3 | ||||||||
| Financial guarantee contracts |
0 | 0 | ||||||||
| Other |
11 | 3 | ||||||||
|
|
||||||||||
| Commission income, total | 711 | 693 | ||||||||
| 1) | Includes commission income in the amount of EUR 67 million (2024: EUR 68 million) from mandate contractual arrangements with the Federal Government in trust activities |
96
KfW Financial Report 2025
Financial Report > Consolidated financial statements > Consolidated notes – Notes to the consolidated statement of comprehensive income
Commission income by segment in financial year 2025
| 2025 |
Mittelstandsbank & Private Kunden (SME Bank & Private Clients) |
Individualfinanzierung & Öffentliche Kunden (Customised Finance & Public Clients) |
KfW Capital | Export and project finance |
||||||||||||||
|
|
EUR in millions | EUR in millions | EUR in millions | EUR in millions | ||||||||||||||
| Commission income |
305 | 38 | 16 | 47 | ||||||||||||||
| of which Federal Government |
303 | 34 | 9 | 0 | ||||||||||||||
| % | 99% | 90% | 58% | 0% | ||||||||||||||
| 2025 |
KfW Development Bank |
DEG |
Financial markets |
Head office |
KfW Group |
|||||||||||||||||
|
|
EUR in millions | EUR in millions | EUR in millions | EUR in millions | EUR in millions | |||||||||||||||||
| Commission income |
279 | 21 | 0 | 6 | 711 | |||||||||||||||||
| of which Federal Government |
258 | 4 | 0 | 5 | 613 | |||||||||||||||||
| % | 93% | 19% | 0% | 83% | 86% | |||||||||||||||||
Commission income by segment in financial year 2024
| 2024 |
Mittelstandsbank & Private Kunden (SME Bank & Private Clients) |
Individualfinanzierung & Öffentliche Kunden (Customised Finance & Public Clients) |
KfW Capital | Export and project finance |
||||||||||||||
|
|
EUR in millions | EUR in millions | EUR in millions | EUR in millions | ||||||||||||||
| Commission income |
328 | 32 | 16 | 26 | ||||||||||||||
| of which Federal Government |
326 | 29 | 9 | 0 | ||||||||||||||
| % | 99% | 89% | 59% | 0% | ||||||||||||||
| 2024 |
KfW Development Bank |
DEG |
Financial markets |
Head office |
KfW Group |
|||||||||||||||||
|
|
EUR in millions | EUR in millions | EUR in millions | EUR in millions | EUR in millions | |||||||||||||||||
| Commission income |
274 | 12 | 0 | 4 | 693 | |||||||||||||||||
| of which Federal Government |
255 | 4 | 0 | 4 | 626 | |||||||||||||||||
| % | 93% | 33% | 0% | 81% | 90% | |||||||||||||||||
97
KfW Financial Report 2025
Financial Report > Consolidated financial statements > Consolidated notes – Notes to the consolidated statement of comprehensive income
Out-of-period income
|
|
2025 |
2024 |
||||||||
|
|
EUR in millions | EUR in millions | ||||||||
| Revenue in current period resulting from service(s) performed in the previous period(s) | 19 | 26 | ||||||||
Variable consideration may have been agreed in connection with services for the Federal Government which is to be recognised at the point in time when the service is performed, to the extent that it is highly probable that a significant reversal in revenue will not occur. If the underlying conditions cease to apply, this may result in a revaluation, which in turn may lead to aperiodic revenue that is to be recognised prospectively through profit or loss in accordance with IFRS 15.
Analysis of Commission expense
|
|
2025 |
2024 |
||||||||
|
|
EUR in millions | EUR in millions | ||||||||
| Commission expense for lending business |
11 | 10 | ||||||||
| Other commission expense | 28 | 19 | ||||||||
|
|
||||||||||
| Commission expense | 39 | 30 | ||||||||
(25) Net gains/losses from hedge accounting
Analysis of Net gains/losses from hedge accounting by type of hedging relationship
|
|
Hedge ineffectiveness |
Items in the income statement that contain cases of hedge ineffectiveness | ||||||||||
|
|
2025 |
2024 |
| |||||||||
|
|
EUR in millions | EUR in millions |
| |||||||||
| Micro fair value hedges |
21 | –52 | Net gains/losses from hedge accounting | |||||||||
| Interest risk |
–6 | –13 | – | |||||||||
| Interest-currency risk |
28 | –39 | – | |||||||||
| Macro fair value hedges |
–149 | 159 | Net gains/losses from hedge accounting | |||||||||
| Interest risk | –149 | 159 | – | |||||||||
|
| ||||||||||||
| Total | –128 | 107 | Net gains/losses from hedge accounting | |||||||||
Analysis of Net gains/losses from micro fair value hedge accounting by hedged item
|
|
2025 | 2024 | ||||||||
|
|
EUR in millions | EUR in millions | ||||||||
| Hedging of securities and investments |
4 | 3 | ||||||||
| Hedging of liabilities to banks and customers |
–3 | –5 | ||||||||
| Hedging of certificated liabilities |
21 | –49 | ||||||||
| Subtotal: Effectiveness of hedges |
23 | –51 | ||||||||
| Amortisation of value adjustments | –1 | –1 | ||||||||
|
|
||||||||||
| Total | 21 | –52 | ||||||||
98
KfW Financial Report 2025
Financial Report > Consolidated financial statements > Consolidated notes – Notes to the consolidated statement of comprehensive income
Gross analysis of valuation gains/losses from micro fair value hedge accounting:
Comparison of hedged items and hedging instruments in financial year 2025
|
|
Hedged items | Hedging instruments |
Effectiveness of hedges |
|||||||||||
|
|
EUR in millions | EUR in millions | EUR in millions | |||||||||||
| Hedging of securities and investments |
9 | –5 | 4 | |||||||||||
| Hedging of liabilities to banks and customers |
–270 | 267 | –3 | |||||||||||
| Hedging of certificated liabilities | –59 | 79 | 20 | |||||||||||
|
|
||||||||||||||
| Total | –320 | 342 | 21 | |||||||||||
Gross analysis of valuation gains/losses from micro fair value hedge accounting:
Comparison of hedged items and hedging instruments in financial year 2024
|
|
Hedged items | Hedging instruments |
Effectiveness of hedges |
|||||||||||
|
|
EUR in millions | EUR in millions | EUR in millions | |||||||||||
| Hedging of securities and investments |
655 | –652 | 3 | |||||||||||
| Hedging of liabilities to banks and customers |
–605 | 600 | –5 | |||||||||||
| Hedging of certificated liabilities | –5,961 | 5,911 | –50 | |||||||||||
|
|
||||||||||||||
| Total | –5,911 | 5,858 | –52 | |||||||||||
Gross analysis of net gains/losses from macro fair value hedge accounting:
Comparison of hedged items and hedging instruments in financial year 2025
|
|
Hedged items | Hedging instruments |
Effectiveness of hedges |
|||||||||||
|
|
EUR in millions | EUR in millions | EUR in millions | |||||||||||
| Valuation result |
–3,915 | 4,082 | 168 | |||||||||||
| Amortisation |
2,801 | –3,152 | –351 | |||||||||||
| Realisation | 34 | 0 | 34 | |||||||||||
|
|
||||||||||||||
| Net gains/losses from macro fair value hedge accounting | –1,080 | 931 | –149 | |||||||||||
Gross analysis of net gains/losses from macro fair value hedge accounting:
Comparison of hedged items and hedging instruments in financial year 2024
|
|
Hedged items | Hedging instruments |
Effectiveness of hedges |
|||||||||||
|
|
EUR in millions | EUR in millions | EUR in millions | |||||||||||
| Valuation result |
2,193 | –1,526 | 667 | |||||||||||
| Amortisation |
3,209 | –3,761 | –552 | |||||||||||
| Realisation | 43 | 0 | 43 | |||||||||||
|
|
||||||||||||||
| Net gains/losses from macro fair value hedge accounting | 5,446 | –5,287 | 159 | |||||||||||
99
KfW Financial Report 2025
Financial Report > Consolidated financial statements > Consolidated notes – Notes to the consolidated statement of comprehensive income
Net gains/losses from macro fair value hedge accounting include the valuation of hedging instruments and the valuation of hedged risks from the hedged portfolios. It also includes the amortisation of the value adjustments from the dynamic hedge designation and de-designation and the pro rata reversal of value adjustments in the event of derecognition of financial instruments from the underlying portfolios as well as the pull-to-par effect of the hedging derivatives.
(26) Net gains/losses from other financial instruments at fair value through profit or loss
Analysis of Net gains/losses from other financial instruments at fair value through profit or loss
|
|
2025 | 2024 | ||||||||
|
|
EUR in millions | EUR in millions | ||||||||
| Loans and advances to banks/customers |
14 | 35 | ||||||||
| Loans and advances |
5 | 16 | ||||||||
| Miscellaneous receivables (money market transactions, promissory note loans and Other receivables) |
8 | 19 | ||||||||
| Securities and investments |
393 | –6 | ||||||||
| Bonds and other fixed-income securities |
0 | 0 | ||||||||
| Shares and other non-fixed income securities |
275 | –28 | ||||||||
| Equity investments |
118 | 23 | ||||||||
| Liabilities to banks and customers |
23 | –5 | ||||||||
| Certificated liabilities |
–45 | 199 | ||||||||
| Other derivatives |
–143 | –267 | ||||||||
| Financial derivatives not qualifying for hedge accounting |
–143 | –267 | ||||||||
| Foreign currency translation | –212 | 88 | ||||||||
|
|
||||||||||
| Total | 30 | 44 | ||||||||
Net gains/losses from assets include the net gains/losses from holding arrangements for the Federal Republic of Germany – if attributable to KfW, KfW IPEX-Bank’s syndication business with a focus on short-term placement, loans that do not meet the SPPI criterion (loans and advances to banks and loans and advances to customers), equity investments and fund investments, recognised in Shares and other non-fixed income securities.
The gains realised from the disposal of non-current assets held for sale included in net gains/losses from securities and investments amounted to EUR 18 million in financial year 2025 (2024: EUR 0 million).
Net gains/losses from liabilities measured at fair value include the results from promissory note loans (liabilities to banks/liabilities to customers) and bonds and notes (certificated liabilities).
Net gains/losses from financial derivatives not qualifying for hedge accounting are mainly attributable to derivatives in economic hedges. Economic hedges are recognised by exercising the fair value option for the hedged items. The hedged items include, in particular, borrowings in the form of Certificated liabilities, Liabilities to banks and Liabilities to customers.
Furthermore, this line item includes gains/losses from bifurcated embedded derivatives resulting from hybrid contracts under financial liabilities. The net gains/losses from the valuation of the associated hedging derivatives are thus compensated for.
100
KfW Financial Report 2025
Financial Report > Consolidated financial statements > Consolidated notes – Notes to the consolidated statement of comprehensive income
Gross analysis of results from economically hedged borrowings:
Comparison of hedged items and hedging instruments
|
|
2025 | 2024 | ||||||||
|
|
EUR in millions | EUR in millions | ||||||||
| Borrowings |
–22 | 194 | ||||||||
| Hedging instruments | 5 | –249 | ||||||||
|
|
||||||||||
| Total (effectiveness of economic hedges) | –17 | –55 | ||||||||
(27) Net gains/losses from disposal of financial assets at amortised cost
|
|
2025 | 2024 | ||||||||
|
|
EUR in millions | EUR in millions | ||||||||
| Income from the disposal of financial assets at amortised cost |
0 | 0 | ||||||||
| Expense from the disposal of financial assets at amortised cost | 1 | 0 | ||||||||
| Total | 0 | 0 | ||||||||
(28) Net gains/losses from investments accounted for using the equity method
|
|
2025 | 2024 | ||||||||||
|
|
EUR in millions | EUR in millions | ||||||||||
| Net gains/losses from investments accounted for using the equity method | –6 | 20 | ||||||||||
Analysis of Administrative expense
|
|
2025 | 2024 | ||||||||
|
|
EUR in millions | EUR in millions | ||||||||
| Wages and salaries |
848 | 795 | ||||||||
| Social security contributions |
131 | 116 | ||||||||
| Expenses for pension provision and other employee benefits |
109 | 49 | ||||||||
| Personnel expense |
1,088 | 961 | ||||||||
| Other administrative expenses |
575 | 621 | ||||||||
| thereof Office costs |
60 | 62 | ||||||||
| thereof Personnel-related material costs |
41 | 44 | ||||||||
| thereof Office operating costs |
134 | 123 | ||||||||
| thereof Costs of external services |
303 | 355 | ||||||||
| thereof Costs of public relations work |
27 | 27 | ||||||||
| thereof Other material costs |
9 | 10 | ||||||||
| Depreciation, amortisation and impairment of property, plant and equipment and intangible assets |
88 | 90 | ||||||||
| of which impairments of rights of use arising from leases |
9 | 10 | ||||||||
| Non-personnel expense | 663 | 711 | ||||||||
|
|
||||||||||
| Total | 1,751 | 1,672 | ||||||||
101
KfW Financial Report 2025
Financial Report > Consolidated financial statements > Consolidated notes – Notes to the consolidated statement of comprehensive income
(30) Net other operating income or loss
Analysis of Net other operating income or loss
|
|
2025 | 2024 | ||||||||
|
|
EUR in millions | EUR in millions | ||||||||
| Other operating income |
25 | 31 | ||||||||
| Other operating expense | 25 | 83 | ||||||||
|
|
||||||||||
| Total | 0 | –52 | ||||||||
Other operating income primarily includes income from the reversal of other provisions in the amount of EUR 5 million (2024: EUR 12 million).
In the previous year, Other operating expense consisted primarily of the obligation to award grants under KfW’s ERP promotional programmes in the amount of EUR 70 million. No contribution was made in 2025.
Analysis of Taxes on income by component
|
|
2025 | 2024 | ||||||||
|
|
EUR in millions | EUR in millions | ||||||||
| Current taxes on income |
149 | 167 | ||||||||
| Deferred taxes | 41 | 72 | ||||||||
|
|
||||||||||
| Total | 189 | 239 | ||||||||
Current taxes include taxes on income for group companies and non-deductible investment income tax recorded at the level of (tax-exempt) KfW and DEG, and tax expenses posted for previous years at the level of DEG.
The reconciliation presents the relationship between the calculated income tax expense for the financial year and reported taxes on income.
102
KfW Financial Report 2025
Financial Report > Consolidated financial statements > Consolidated notes – Notes to the consolidated statement of comprehensive income
Income tax reconciliation
|
|
2025 | 2024 | ||||||||
|
|
EUR in millions | EUR in millions | ||||||||
| Profit/loss from operating activities (before taxes) |
1,192 | 1,641 | ||||||||
| Group income tax rate |
0% | 0% | ||||||||
| Calculated income tax expense in the financial year |
0 | 0 | ||||||||
| Effects of tax rate differentials within the group |
186 | 177 | ||||||||
| Effect of tax rate changes |
12 | 36 | ||||||||
| Effects of previous year taxes recorded in the reporting year |
9 | 7 | ||||||||
| Effects of non-deductible taxes on income |
0 | 0 | ||||||||
| Effects of non-deductible business expenses |
1 | 3 | ||||||||
| Effects of tax-free income |
–6 | –22 | ||||||||
| Trade tax add-ons/reductions |
0 | 0 | ||||||||
| Permanent accounting differences |
–16 | 37 | ||||||||
| Effects of changes in recognised deferred tax assets | 3 | 1 | ||||||||
|
|
||||||||||
| Reported taxes on income/expense |
189 | 239 | ||||||||
| Average effective tax rate | 16% | 15% | ||||||||
KfW’s applicable income tax rate of 0%, on which the reconciliation is based, takes into account the tax status of KfW as a non-taxable public-law institution and the fact that this status predominantly determines profit/ loss from operating activities.
The effects of tax rate differentials result from individual group companies being taxable and the related different tax rates. The tax rates continue to range from 0% to 32%.
Global Minimum Tax (“GMT”) in accordance with the OECD Pillar Two rules
KfW Group falls within the scope of the GMT pursuant to the OECD Pillar Two rules.
KfW as group parent is a state-owned promotional bank and is therefore deemed an excluded entity pursuant to Section 5 (1) no. 1 of the German Minimum Tax Act (Mindeststeuergesetz – “MinStG”). KfW Capital GmbH & Co. KG and DEG GmbH are also excluded from the scope of the MinStG. The remainder of the KfW enterprise group that falls within the scope of the Minimum Tax Act applies the transitional safe harbour rules pursuant to Section 83 Minimum Tax Act. The group assumes that there will be no relevant tax burden as a result of the global minimum taxation law due to this transitional arrangement.
KfW Group currently assumes that the joint venture DC Nordseekabel GmbH & Co. KG falls under the country-by-country reporting (“CbCR”) safe harbour rules of Section 84 (1) no. 3 MinStG and, accordingly, that national top-up taxes will not apply for the joint venture.
103
KfW Financial Report 2025
Financial Report > Consolidated financial statements > Consolidated notes – Segment reporting
(32) Segment reporting by business sector
In accordance with the provisions of IFRS 8, segment reporting follows the internal management reporting system, which is used by the group’s main decision-makers to assess each segment’s performance and to allocate resources to segments.
In accordance with the business sector structure for the group, the segments and their products and services can be presented as follows:
| – Start-up financing | ||||
| Mittelstandsbank & Private Kunden (SME Bank & Private Clients) |
– Financing of general corporate investments and investments in innovation, energy and environmental protection | |||
| – Education financing | ||||
| – Financing for housing construction, conversion and refurbishment | ||||
| Individualfinanzierung & Öffentliche Kunden |
– Financing of municipal and social infrastructure | |||
| – Customised corporate financing with equity and debt capital | ||||
| (Customised Finance & Public Clients) | – Customised financing of banks and promotional institutions of the federal states | |||
| – Mandated transactions for energy supply (debt capital) | ||||
| KfW Capital | – Investments in German and European venture capital and venture debt funds | |||
| – Co-investments in start-ups (via special purpose vehicles) | ||||
| Export and project finance | – Financing of German and European export activities | |||
| – Financing of projects and investments which are of special interest for Germany and Europe
| ||||
| KfW Development Bank | – Promotion of developing countries and emerging economies on behalf of the Federal Government with standard | |||
| loans/grants refinanced through budget funds and promotional/development loans from market funds raised by KfW | ||||
| DEG |
– Financing provided by DEG – Deutsche Investitions- und Entwicklungs-gesellschaft mbH in developing countries and | |||
| emerging economies (private enterprise financing)
| ||||
| – Securities and money market investments | ||||
| Financial markets | – Holding arrangements of the Federal Republic of Germany | |||
| – Transactions mandated by the Federal Government, loan granted to Greece | ||||
| – Funding | ||||
| – Central interest rate and currency management | ||||
| Head office | – Strategic equity investments | |||
The internal schedule of earnings was adjusted in financial year 2025. The new variables added were the economic result, consolidated profit before IFRS effects from hedging, and IFRS effects from hedging1). The comparative figures from the previous year were adjusted on the basis of the new earnings structure. The business sectors are measured on the basis of their contribution to consolidated profit before IFRS effects.
The individual items are based on the following methods:
| – | Net interest income (before promotional expense) includes the net interest generated from lending business calculated on the basis of the market interest rate method2). The item also includes the imputed return on equity allocated according to the business sectors’ planned regulatory capital. Head office also includes the treasury result, which largely consists of the income/loss from maturity transformation. The profit contribution from KfW funding3) is allocated to the Financial markets business sector. |
| 1) | See the Alternative key financial figures used section in the group management report for a description of the economic result and IFRS effects from hedging |
| 2) | Funding at matching maturities using KfW’s internal refinancing curve is assumed for the calculation of net interest income in this method. |
| 3) | The difference between the realised refinancing rates and the maturity-matched refinancing rates calculated in-house |
104
KfW Financial Report 2025
Financial Report > Consolidated financial statements > Consolidated notes – Segment reporting
| – | Promotional expense included in Interest, Commission and Administrative expense and Other operating expense in the income statement is reported separately pursuant to the internal management report due to the special relevance of promotional expense as a management variable. |
Promotional expense is understood to mean certain expenses from the two business sectors Mittelstandsbank & Private Kunden (SME Bank & Private Clients) and Individualfinanzierung & Öffentliche Kunden (Customised Finance & Public Clients) that have a positive impact on the achievement of KfW’s promotional objectives. Promotional expense primarily consists of additions of the interest rate reductions accounted for at present value4) from new commitments as well as from the compounding effect. Additional promotional components are the expenses for upfront fees paid to sales partners for the processing of small and micro loans (included in Commission expense), for innovative digital promotional approaches (included in Commission and Administrative expense), for available and product-related marketing and sales measures (included in Administrative expense), and, from 2023, for promotional grants awarded by KfW under ERP promotion (included in Other operating expense).
| – | The allocation of Administrative expense (before promotional expense) is based on the results from activity-based accounting by cost centres5). Administrative expense (before promotional expense) includes depreciation on property, plant and equipment and amortisation of intangible assets and rights of use. |
| – | In the Risk provisions for lending business item, net impairment charges, direct write-offs, recoveries on loans written off and the net gains/losses from non-substantial contractual modifications are distributed among the segments according to the underlying loan. |
| – | The valuation result (before promotional expense and IFRS effects) comprises net gains/losses from other financial instruments at fair value (before IFRS effects from hedging), net gains/losses from risk provisions in the securities business, net gains/losses from the disposal of financial instruments measured at amortised cost, net gains/losses from investments accounted for using the equity method and net other operating income (before promotional expense). |
| – | The item IFRS effects from hedging relates to temporary effects on earnings from the valuation of derivative financial instruments. It comprises the result from hedge accounting and other valuation results included in net gains/losses from other derivative financial instruments at fair value through profit or loss, and is recognised separately in the internal income accounts. |
| – | When taxes on income are allocated to the business sectors (excluding the Head office) only the current taxes on income are taken into account. Deferred taxes are allocated to the Head office. |
| – | Segment assets are not reported because, in accordance with the internal management reporting system, they are used neither to assess each segment’s performance nor to allocate resources to segments. |
| – | The presentation of segment income and expenses is based on consolidated figures. Administrative and commission expense as well as commission income and other operating income resulting from service relationships within KfW Group are adjusted in segment reporting. Any remaining negligible consolidation effects are reported in the reconciliation/consolidation column. |
| 4) | See note regarding “KfW’s promotional lending business” for details of KfW’s interest rate reductions in the promotional lending business |
| 5) | The costs incurred in the organisational units are largely allocated to the products by means of core services. |
105
KfW Financial Report 2025
Financial Report > Consolidated financial statements > Consolidated notes – Segment reporting
Segment reporting by business sector for financial year 2025
|
|
Mittelstandsbank & Private Kunden (SME Bank & Private Clients) |
Individualfinan- zierung & Öffent- liche Kunden (Customised Finance & Public Clients) |
KfW Capital1) |
Export and project finance |
KfW Development Bank1) |
|||||||||||||||||||
|
|
EUR in millions | EUR in millions | EUR in millions | EUR in millions | EUR in millions | |||||||||||||||||||
| Volume of new commitments |
49,059 | 12,212 | 748 | 24,181 | 9,960 | |||||||||||||||||||
| Net interest income (before promotional expense) |
500 | 131 | –12 | 1,049 | 205 | |||||||||||||||||||
| Net commission income (before promotional expense) |
304 | 37 | 16 | 47 | 279 | |||||||||||||||||||
| Administrative expense (before promotional expense) |
441 | 90 | 30 | 338 | 437 | |||||||||||||||||||
| Operating result before valuation (before promotional expense) |
364 | 79 | –26 | 757 | 47 | |||||||||||||||||||
| Risk provisions for lending business |
–8 | –16 | 0 | –112 | –1 | |||||||||||||||||||
| Valuation result (before promotional expense and IFRS effects) |
4 | 28 | 184 | –1 | 54 | |||||||||||||||||||
| Economic result |
359 | 91 | 158 | 644 | 100 | |||||||||||||||||||
| Promotional expense |
433 | 35 | 0 | 0 | 0 | |||||||||||||||||||
| Taxes on income |
0 | 0 | 1 | 139 | 0 | |||||||||||||||||||
| Consolidated profit before IFRS effects |
–74 | 56 | 158 | 505 | 100 | |||||||||||||||||||
| IFRS effects from hedging |
0 | 0 | 0 | –1 | 0 | |||||||||||||||||||
| Consolidated profit |
–74 | 56 | 158 | 504 | 100 | |||||||||||||||||||
|
|
DEG |
Financial markets |
Head office1) |
Reconciliation/ consolidation |
KfW Group |
|||||||||||||||||||
|
|
EUR in millions | EUR in millions | EUR in millions | EUR in millions | EUR in millions | |||||||||||||||||||
| Volume of new commitments |
2,350 | 0 | 0 | –548 | 97,961 | |||||||||||||||||||
| Net interest income (before promotional expense) |
162 | 495 | 426 | 0 | 2,957 | |||||||||||||||||||
| Net commission income (before promotional expense) |
5 | –8 | 6 | 0 | 685 | |||||||||||||||||||
| Administrative expense (before promotional expense) |
160 | 99 | 145 | 0 | 1,739 | |||||||||||||||||||
| Operating result before valuation (before promotional expense) |
8 | 389 | 286 | 0 | 1,903 | |||||||||||||||||||
| Risk provisions for lending business |
–13 | –5 | 0 | 0 | –155 | |||||||||||||||||||
| Valuation result (before promo-tional expense and IFRS effects) |
16 | –7 | –9 | –1 | 267 | |||||||||||||||||||
| Economic result |
11 | 377 | 277 | –2 | 2,016 | |||||||||||||||||||
| Promotional expense |
0 | 0 | 0 | 0 | 468 | |||||||||||||||||||
| Taxes on income |
10 | 0 | 40 | 0 | 189 | |||||||||||||||||||
| Consolidated profit before IFRS effects |
1 | 377 | 237 | –2 | 1,359 | |||||||||||||||||||
| IFRS effects from hedging |
–1 | –2 | –353 | 0 | –356 | |||||||||||||||||||
| Consolidated profit |
0 | 375 | –116 | –2 | 1,002 | |||||||||||||||||||
| 1) | The valuation result of the business sectors includes the following net gains/losses from investments accounted for using the equity method: KfW Capital EUR –26 million, KfW Development Bank EUR 6 million and head office EUR 14 million. |
106
KfW Financial Report 2025
Financial Report > Consolidated financial statements > Consolidated notes – Segment reporting
Segment reporting by business sector for financial year 2024
|
|
Mittelstandsbank & Private Kunden (SME Bank & Private Clients) |
Individualfinan- zierung & Öffent- liche Kunden (Customised Finance & Public Clients) |
KfW Capital1) |
Export and project finance1) |
KfW Development Bank1) |
|||||||||||||||||||
|
|
EUR in millions | EUR in millions | EUR in millions | EUR in millions | EUR in millions | |||||||||||||||||||
| Volume of new commitments |
35,816 | 41,570 | 1,590 | 23,916 | 7,839 | |||||||||||||||||||
| Net interest income (before promotional expense) |
531 | 108 | –22 | 1,012 | 202 | |||||||||||||||||||
| Net commission income (before promotional expense) |
327 | 32 | 16 | 26 | 274 | |||||||||||||||||||
| Administrative expense (before promotional expense) |
462 | 87 | 27 | 321 | 436 | |||||||||||||||||||
| Operating result before valuation (before promotional expense) |
397 | 53 | –32 | 717 | 40 | |||||||||||||||||||
| Risk provisions for lending business |
–56 | 0 | 0 | 28 | 12 | |||||||||||||||||||
| Valuation result (before promotional expense and IFRS effects) |
0 | 1 | 31 | 25 | 20 | |||||||||||||||||||
| Economic result |
341 | 54 | –2 | 770 | 73 | |||||||||||||||||||
| Promotional expense |
477 | 26 | 0 | 0 | 0 | |||||||||||||||||||
| Taxes on income |
0 | 0 | 1 | 150 | 0 | |||||||||||||||||||
| Consolidated profit before IFRS effects |
–136 | 28 | –2 | 620 | 73 | |||||||||||||||||||
| IFRS effects from hedging |
0 | 0 | 0 | –9 | 0 | |||||||||||||||||||
| Consolidated profit |
–136 | 28 | –2 | 611 | 73 | |||||||||||||||||||
|
|
DEG |
Financial markets |
Head office |
Reconciliation/ consolidation |
KfW Group |
|||||||||||||||||||
|
|
EUR in millions | EUR in millions | EUR in millions | EUR in millions | EUR in millions | |||||||||||||||||||
| Volume of new commitments |
2,470 | 0 | 0 | –369 | 112,831 | |||||||||||||||||||
| Net interest income (before promotional expense) |
136 | 478 | 454 | 0 | 2,900 | |||||||||||||||||||
| Net commission income (before promotional expense) |
1 | –5 | 4 | 0 | 675 | |||||||||||||||||||
| Administrative expense (before promotional expense) |
153 | 99 | 73 | 0 | 1,658 | |||||||||||||||||||
| Operating result before valuation (before promotional expense) |
–17 | 375 | 385 | 0 | 1,917 | |||||||||||||||||||
| Risk provisions for lending business |
58 | –4 | 0 | 0 | 39 | |||||||||||||||||||
| Valuation result (before promotional expense and IFRS effects) |
5 | 16 | 41 | 0 | 140 | |||||||||||||||||||
| Economic result |
47 | 387 | 426 | 0 | 2,097 | |||||||||||||||||||
| Promotional expense |
0 | 0 | 0 | 0 | 504 | |||||||||||||||||||
| Taxes on income |
16 | 0 | 72 | 0 | 239 | |||||||||||||||||||
| Consolidated profit before IFRS effects |
31 | 387 | 354 | 0 | 1,354 | |||||||||||||||||||
| IFRS effects from hedging |
–2 | –3 | 62 | 0 | 48 | |||||||||||||||||||
| Consolidated profit |
29 | 384 | 416 | 0 | 1,402 | |||||||||||||||||||
| 1) | The valuation result of the business sectors includes the following net gains/losses from investments accounted for using
the equity method: |
107
KfW Financial Report 2025
Financial Report > Consolidated financial statements > Consolidated notes – Segment reporting
The reconciliation/consolidation column includes all adjustments necessary to reconcile segment information with the aggregated information for the group. The consolidation effects reported for “Volume of new commitments” relate to commitments for programme loans made by Mittelstandsbank & Private Kunden (SME Bank & Private Clients) and Individualfinanzierung & Öffentliche Kunden (Customised Finance & Public Clients) for which KfW IPEX-Bank acts as on-lending bank. The other amounts in this column result from minimal consolidation effects.
(33) Segment reporting by region
Net interest and commission income are allocated on the basis of the customers’ geographical location. The imputed return on equity included in net interest income, the profit contribution from KfW funding and the treasury result are allocated to Germany. KfW receives commission income from the Federal Government for supporting developing countries and emerging economies using budget funds of the Federal Government. These funds are allocated according to the region of the country receiving the investment.
Property, plant and equipment and intangible assets are not reported according to region because, apart from immaterial amounts, these assets relate to Germany.
Segment reporting by region for financial year 2025
| Germany | Europe | Rest of the world | Reconciliation/ | KfW Group | ||||||||||||||||||
|
|
|
(excl. Germany) |
|
consolidation |
|
|||||||||||||||||
|
|
EUR in millions | EUR in millions | EUR in millions | EUR in millions | EUR in millions | |||||||||||||||||
| Net interest income |
1,377 | 531 | 624 | 0 | 2,532 | |||||||||||||||||
| Net commission income | 350 | 50 | 272 | 0 | 672 | |||||||||||||||||
|
|
||||||||||||||||||||||
| Segment income | 1,727 | 582 | 896 | 0 | 3,204 | |||||||||||||||||
Segment reporting by region for financial year 2024
| Germany | Europe | Rest of the world | Reconciliation/ | KfW Group | ||||||||||||||||||
|
|
|
(excl. Germany) |
|
consolidation |
|
|||||||||||||||||
|
|
EUR in millions | EUR in millions | EUR in millions | EUR in millions | EUR in millions | |||||||||||||||||
| Net interest income |
1,360 | 524 | 609 | 0 | 2,493 | |||||||||||||||||
| Net commission income | 370 | 39 | 254 | 0 | 664 | |||||||||||||||||
|
|
||||||||||||||||||||||
| Segment income | 1,730 | 563 | 863 | 0 | 3,156 | |||||||||||||||||
The reconciliation/consolidation column includes all adjustments necessary to reconcile segment information with the aggregated information for the group. The amounts in this column result solely from minimal consolidation effects.
108
KfW Financial Report 2025
Financial Report > Consolidated financial statements > Consolidated notes – Notes to the consolidated statement of financial position
statement of financial position
Analysis of Cash reserves
|
|
31 Dec. 2025 |
31 Dec. 2024 | ||||||||
|
|
EUR in millions | EUR in millions | ||||||||
| Cash |
0 | 0 | ||||||||
| Balances with central banks | 19,535 | 26,522 | ||||||||
|
|
||||||||||
| Total | 19,535 | 26,522 | ||||||||
(35) Financial assets at amortised cost
Analysis of Financial assets at amortised cost by class
|
|
31 Dec. 2025 | 31 Dec. 2024 | ||||||||
|
|
EUR in millions | EUR in millions | ||||||||
| Loans and advances to banks |
|
|
|
|
||||||
| Money-market transactions |
17,134 | 16,499 | ||||||||
| Loans and advances |
288,316 | 291,690 | ||||||||
| Other receivables |
30,290 | 12,339 | ||||||||
| Loans and advances to customers |
|
|
|
|
||||||
| Money-market transactions |
800 | 500 | ||||||||
| Loans and advances |
135,478 | 141,993 | ||||||||
| Promissory note loans |
2,316 | 1,989 | ||||||||
| Other receivables |
1,529 | 1,492 | ||||||||
| Securities and investments |
|
|
|
|
||||||
| Bonds and other fixed-income securities |
37,746 | 37,991 | ||||||||
| Total gross |
513,609 | 504,492 | ||||||||
| less risk provisions for |
|
|
|
|
||||||
| Loans and advances to banks |
–115 | –122 | ||||||||
| Loans and advances to customers |
–1,772 | –1,696 | ||||||||
| Securities and investments |
–12 | –8 | ||||||||
|
|
||||||||||
| Total net | 511,710 | 502,666 | ||||||||
Receivables from reverse repurchase agreements (“reverse repos”) amounted to EUR 23,282 million (31 Dec. 2024: EUR 9,630 million) and are included in Loans and advances to banks – Other receivables and Loans and advances to customers – Other receivables.
The cash collateral pledged of EUR 6,633 million (31 Dec. 2024: EUR 2,469 million) is attributable to cash collateral on derivatives and is included in Loans and advances to banks – Other receivables and Loans and advances to customers – Other receivables.
109
KfW Financial Report 2025
Financial Report > Consolidated financial statements > Consolidated notes – Notes to the consolidated statement of financial position
Analysis of Loans and advances by underwriting liability type
| Loans and advances to banks
|
Loans and advances to customers
|
|||||||||||||||||||
|
|
31 Dec. 2025 |
31 Dec. 2024 |
31 Dec. 2025 |
31 Dec. 2024 |
||||||||||||||||
|
|
EUR in millions | EUR in millions | EUR in millions | EUR in millions | ||||||||||||||||
| Direct loans |
69,141 | 68,919 | 129,594 | 132,812 | ||||||||||||||||
| On-lent customer loans with full underwriting borne by the on-lending commercial bank |
210,146 | 209,116 | 0 | 0 | ||||||||||||||||
| On-lent customer loans with partial underwriting borne by the on-lending commercial bank |
9,725 | 14,248 | 0 | 0 | ||||||||||||||||
| On-lent customer loans without underwriting borne by the on-lending commercial bank |
0 | 0 | 3,886 | 5,159 | ||||||||||||||||
| Direct customer loans with full underwriting borne by the on-lending commercial bank |
0 | 0 | 1,171 | 3,074 | ||||||||||||||||
| Direct and on-lent subordinated loans |
320 | 314 | 859 | 983 | ||||||||||||||||
| Adjustment to the carrying amount due to the interest rate being below the market rate for promotional loans paid out with additional promotional funds in the form of interest rate reductions with an impact on KfW’s earnings position. | –1,016 | –907 | –31 | –33 | ||||||||||||||||
|
|
|
|
||||||||||||||||||
| Total | 288,316 | 291,690 | 135,478 | 141,993 | ||||||||||||||||
Direct loans to banks include, in particular, global loans granted as part of financing for domestic housing construction and SMEs.
Direct loans to customers include, in particular, loans granted under export and project financing, municipal financing and education financing. The item also includes loans connected with certain transactions mandated by the Federal Government in accordance with the KfW Law.
110
KfW Financial Report 2025
Financial Report > Consolidated financial statements > Consolidated notes – Notes to the consolidated statement of financial position
Development of gross carrying amounts of financial assets at amortised cost – Loans and advances to banks
| Financial year 2025 |
Financial year 2024 | |||||||||||||||||||||||||||||||||||
|
|
Stage 1 | Stage 2 | Stage 3 | Total | Stage 1 | Stage 2 | Stage 3 | Total | ||||||||||||||||||||||||||||
| EUR in | EUR in | EUR in | EUR in | EUR in | EUR in | EUR in | EUR in | |||||||||||||||||||||||||||||
|
|
millions | millions | millions | millions | millions | millions | millions | millions | ||||||||||||||||||||||||||||
| As of 1 Jan. |
318,108 | 1,223 | 1,196 | 320,527 | 321,416 | 2,098 | 1,128 | 324,642 | ||||||||||||||||||||||||||||
| Transfer from stage 2 and stage 3 to stage 1 |
30 | –30 | 0 | 0 | 657 | –656 | –1 | 0 | ||||||||||||||||||||||||||||
| Transfer from stage 1 and stage 3 to stage 2 |
–444 | 462 | –18 | 0 | –503 | 531 | –27 | 0 | ||||||||||||||||||||||||||||
| Transfer from stage 1 and stage 2 to stage 3 |
–468 | –139 | 607 | 0 | –665 | –208 | 873 | 0 | ||||||||||||||||||||||||||||
| Additions – New business and increased utilisation |
326,274 | 49 | 35 | 326,358 | 123,210 | 29 | 68 | 123,307 | ||||||||||||||||||||||||||||
| Disposals |
–311,414 | –516 | –729 | –312,659 | –126,710 | –578 | –769 | –128,056 | ||||||||||||||||||||||||||||
| of which financial assets written off |
–311,414 | –516 | –713 | –312,644 | –126,710 | –578 | –713 | –128,000 | ||||||||||||||||||||||||||||
| of which default on receivables |
0 | 0 | –15 | –15 | 0 | 0 | –56 | –56 | ||||||||||||||||||||||||||||
| Changes from non-substantial contractual modification |
0 | 0 | 0 | 0 | 0 | 0 | 0 | 0 | ||||||||||||||||||||||||||||
| Exchange rate and other changes |
1,541 | –3 | –25 | 1,514 | 704 | 7 | –77 | 635 | ||||||||||||||||||||||||||||
| As of 31 Dec. | 333,627 | 1,047 | 1,067 | 335,741 | 318,108 | 1,223 | 1,196 | 320,527 | ||||||||||||||||||||||||||||
Development of gross carrying amounts of financial assets at amortised cost – Loans and advances to customers
| Financial year 2025 |
Financial year 2024 | |||||||||||||||||||||||||||||||||||
|
|
Stage 1 | Stage 2 | Stage 3 | Total | Stage 1 | Stage 2 | Stage 3 | Total | ||||||||||||||||||||||||||||
| EUR in | EUR in | EUR in | EUR in | EUR in | EUR in | EUR in | EUR in | |||||||||||||||||||||||||||||
|
|
millions | millions | millions | millions | millions | millions | millions | millions | ||||||||||||||||||||||||||||
| As of 1 Jan. |
138,066 | 3,714 | 4,193 | 145,974 | 134,370 | 5,252 | 4,707 | 144,328 | ||||||||||||||||||||||||||||
| Transfer from stage 2 and stage 3 to stage 1 |
607 | –607 | 0 | 0 | 1,778 | –1,774 | –5 | 0 | ||||||||||||||||||||||||||||
| Transfer from stage 1 and stage 3 to stage 2 |
–2,328 | 2,662 | –334 | 0 | –1,567 | 1,666 | –98 | 0 | ||||||||||||||||||||||||||||
| Transfer from stage 1 and stage 2 to stage 3 |
–1,085 | –237 | 1,322 | 0 | –864 | –305 | 1,169 | 0 | ||||||||||||||||||||||||||||
| Additions – New business and increased utilisation |
26,221 | 139 | 34 | 26,395 | 36,386 | 271 | 41 | 36,698 | ||||||||||||||||||||||||||||
| Disposals |
–23,904 | –901 | –1,046 | –25,851 | –33,541 | –1,500 | –1,386 | –36,428 | ||||||||||||||||||||||||||||
| of which financial assets written off |
–23,903 | –901 | –951 | –25,756 | –33,541 | –1,499 | –1,251 | –36,291 | ||||||||||||||||||||||||||||
| of which default on receivables |
–1 | 0 | –95 | –96 | 0 | –1 | –135 | –137 | ||||||||||||||||||||||||||||
| Changes from non-substantial contractual modification |
0 | 1 | 0 | 1 | –4 | 0 | 0 | –4 | ||||||||||||||||||||||||||||
| Exchange rate and other changes |
–6,075 | –114 | –206 | –6,396 | 1,509 | 104 | –234 | 1,379 | ||||||||||||||||||||||||||||
| As of 31 Dec. | 131,502 | 4,657 | 3,964 | 140,123 | 138,066 | 3,714 | 4,193 | 145,974 | ||||||||||||||||||||||||||||
111
KfW Financial Report 2025
Financial Report > Consolidated financial statements > Consolidated notes – Notes to the consolidated statement of financial position
Development of gross carrying amounts of financial assets at amortised cost – Securities and investments
| Financial year 2025 |
Financial year 2024 | |||||||||||||||||||||||||||||||||||
|
|
Stage 1 | Stage 2 | Stage 3 | Total | Stage 1 | Stage 2 | Stage 3 | Total | ||||||||||||||||||||||||||||
| EUR in | EUR in | EUR in | EUR in | EUR in | EUR in | EUR in | EUR in | |||||||||||||||||||||||||||||
|
|
millions | millions | millions | millions | millions | millions | millions | millions | ||||||||||||||||||||||||||||
| As of 1 Jan. |
37,907 | 83 | 0 | 37,991 | 36,001 | 64 | 0 | 36,065 | ||||||||||||||||||||||||||||
| Transfer from stage 2 and stage 3 to stage 1 |
82 | –82 | 0 | 0 | 65 | –65 | 0 | 0 | ||||||||||||||||||||||||||||
| Transfer from stage 1 and stage 3 to stage 2 |
–21 | 21 | 0 | 0 | –84 | 84 | 0 | 0 | ||||||||||||||||||||||||||||
| Additions – New business and increased utilisation |
33,382 | 0 | 0 | 33,382 | 33,632 | 0 | 0 | 33,632 | ||||||||||||||||||||||||||||
| Disposals |
–33,594 | 0 | 0 | –33,594 | –32,406 | –1 | 0 | –32,407 | ||||||||||||||||||||||||||||
| of which financial assets written off |
–33,594 | 0 | 0 | –33,594 | –32,406 | –1 | 0 | –32,407 | ||||||||||||||||||||||||||||
| Exchange rate and other changes |
–32 | –1 | 0 | –32 | 700 | 1 | 0 | 701 | ||||||||||||||||||||||||||||
| As of 31 Dec. | 37,724 | 22 | 0 | 37,746 | 37,907 | 83 | 0 | 37,991 | ||||||||||||||||||||||||||||
Development of gross carrying amounts of off-balance sheet lending transactions
| Financial year 2025 |
Financial year 2024 | |||||||||||||||||||||||||||||||||||
|
|
Stage 1 | Stage 2 | Stage 3 | Total | Stage 1 | Stage 2 | Stage 3 | Total | ||||||||||||||||||||||||||||
| EUR in | EUR in | EUR in | EUR in | EUR in | EUR in | EUR in | EUR in | |||||||||||||||||||||||||||||
|
|
millions | millions | millions | millions | millions | millions | millions | millions | ||||||||||||||||||||||||||||
| As of 1 Jan. |
140,475 | 1,322 | 283 | 142,081 | 137,227 | 1,847 | 455 | 139,528 | ||||||||||||||||||||||||||||
| Transfer from stage 2 and stage 3 to stage 1 |
0 | 0 | 0 | 0 | 14 | –14 | 0 | 0 | ||||||||||||||||||||||||||||
| Transfer from stage 1 and stage 3 to stage 2 |
–66 | 66 | 0 | 0 | –390 | 390 | 0 | 0 | ||||||||||||||||||||||||||||
| Transfer from stage 1 and stage 2 to stage 3 |
–3 | –8 | 11 | 0 | –50 | 0 | 50 | 0 | ||||||||||||||||||||||||||||
| Additions – New business and increased utilisation |
46,317 | 750 | 109 | 47,176 | 65,955 | 448 | 9 | 66,412 | ||||||||||||||||||||||||||||
| Disposals |
–48,801 | –426 | –7 | –49,233 | –62,261 | –1,349 | –231 | –63,842 | ||||||||||||||||||||||||||||
| Exchange rate and other changes |
–73 | –1 | –14 | –88 | –18 | 0 | 0 | –18 | ||||||||||||||||||||||||||||
| As of 31 Dec. | 137,850 | 1,704 | 382 | 139,936 | 140,475 | 1,322 | 283 | 142,081 | ||||||||||||||||||||||||||||
The gross carrying amount of financial assets for which risk provisioning at the time of modification was assigned to stage 2 or 3 and was transferred back to stage 1 during the reporting period amounted to EUR 35 million as of the reporting date (31 Dec. 2024: EUR 103 million).
112
KfW Financial Report 2025
Financial Report > Consolidated financial statements > Consolidated notes – Notes to the consolidated statement of financial position
Development of risk provisions for financial assets at amortised cost – Loans and advances to banks
| Financial year 2025 |
Financial year 2024 | |||||||||||||||||||||||||||||||||||
|
|
Stage 1 | Stage 2 | Stage 3 | Total | Stage 1 | Stage 2 | Stage 3 | Total | ||||||||||||||||||||||||||||
| EUR in | EUR in | EUR in | EUR in | EUR in | EUR in | EUR in | EUR in | |||||||||||||||||||||||||||||
|
|
millions | millions | millions | millions | millions | millions | millions | millions | ||||||||||||||||||||||||||||
| As of 1 Jan. |
45 | 24 | 52 | 122 | 52 | 32 | 84 | 167 | ||||||||||||||||||||||||||||
| Transfer from stage 2 and stage 3 to stage 1 |
1 | –1 | 0 | 0 | 14 | –14 | 0 | 0 | ||||||||||||||||||||||||||||
| Transfer from stage 1 and stage 3 to stage 2 |
–1 | 1 | 0 | 0 | 0 | 0 | 0 | 0 | ||||||||||||||||||||||||||||
| Transfer from stage 1 and stage 2 to stage 3 |
–1 | –2 | 3 | 0 | 0 | –3 | 3 | 0 | ||||||||||||||||||||||||||||
| Additions |
45 | 12 | 16 | 74 | 27 | 27 | 14 | 68 | ||||||||||||||||||||||||||||
| Utilisation |
0 | 0 | –8 | –8 | 0 | 0 | –49 | –49 | ||||||||||||||||||||||||||||
| Reversals |
–50 | –10 | –7 | –66 | –49 | –18 | –24 | –92 | ||||||||||||||||||||||||||||
| Net present value effect |
0 | 0 | 3 | 3 | 0 | 0 | 4 | 4 | ||||||||||||||||||||||||||||
| Exchange rate and other changes |
–3 | 0 | –6 | –9 | 1 | 0 | 21 | 22 | ||||||||||||||||||||||||||||
| As of 31 Dec. | 37 | 25 | 53 | 115 | 45 | 24 | 52 | 122 | ||||||||||||||||||||||||||||
Development of risk provisions for financial assets at amortised cost – Loans and advances to customers
| Financial year 2025 |
Financial year 2024 | |||||||||||||||||||||||||||||||||||
|
|
Stage 1 | Stage 2 | Stage 3 | Total | Stage 1 | Stage 2 | Stage 3 | Total | ||||||||||||||||||||||||||||
| EUR in | EUR in | EUR in | EUR in | EUR in | EUR in | EUR in | EUR in | |||||||||||||||||||||||||||||
|
|
millions | millions | millions | millions | millions | millions | millions | millions | ||||||||||||||||||||||||||||
| As of 1 Jan. |
192 | 229 | 1,276 | 1,696 | 162 | 300 | 1,223 | 1,685 | ||||||||||||||||||||||||||||
| Transfer from stage 2 and stage 3 to stage 1 |
29 | –29 | 0 | 0 | 62 | –62 | 0 | 0 | ||||||||||||||||||||||||||||
| Transfer from stage 1 and stage 3 to stage 2 |
–11 | 27 | –16 | 0 | –7 | 23 | –16 | 0 | ||||||||||||||||||||||||||||
| Transfer from stage 1 and stage 2 to stage 3 |
–9 | –54 | 63 | 0 | –8 | –24 | 31 | 0 | ||||||||||||||||||||||||||||
| Additions |
167 | 182 | 315 | 663 | 169 | 133 | 271 | 573 | ||||||||||||||||||||||||||||
| Utilisation |
0 | 0 | –57 | –57 | 0 | 0 | –93 | –93 | ||||||||||||||||||||||||||||
| Reversals |
–149 | –126 | –240 | –515 | –188 | –146 | –258 | –593 | ||||||||||||||||||||||||||||
| Net present value effect |
0 | 0 | 55 | 55 | 0 | 0 | 95 | 95 | ||||||||||||||||||||||||||||
| Exchange rate and other changes |
–3 | –6 | –61 | –70 | 3 | 4 | 22 | 29 | ||||||||||||||||||||||||||||
| As of 31 Dec. | 215 | 223 | 1,335 | 1,772 | 192 | 229 | 1,276 | 1,696 | ||||||||||||||||||||||||||||
113
KfW Financial Report 2025
Financial Report > Consolidated financial statements > Consolidated notes – Notes to the consolidated statement of financial position
Development of risk provisions for financial assets at amortised cost – Securities and investments
| Financial year 2025 |
Financial year 2024 | |||||||||||||||||||||||||||||||||||
|
|
Stage 1 | Stage 2 | Stage 3 | Total | Stage 1 | Stage 2 | Stage 3 | Total | ||||||||||||||||||||||||||||
| EUR in | EUR in | EUR in | EUR in | EUR in | EUR in | EUR in | EUR in | |||||||||||||||||||||||||||||
|
|
millions | millions | millions | millions | millions | millions | millions | millions | ||||||||||||||||||||||||||||
| As of 1 Jan. |
8 | 0 | 0 | 8 | 8 | 0 | 0 | 8 | ||||||||||||||||||||||||||||
| Transfer from stage 2 and stage 3 to stage 1 |
0 | 0 | 0 | 0 | 6 | –6 | 0 | 0 | ||||||||||||||||||||||||||||
| Additions |
9 | 1 | 0 | 10 | 5 | 6 | 0 | 11 | ||||||||||||||||||||||||||||
| Reversals |
–6 | 0 | 0 | –7 | –10 | –1 | 0 | –11 | ||||||||||||||||||||||||||||
| As of 31 Dec. | 10 | 2 | 0 | 12 | 8 | 0 | 0 | 8 | ||||||||||||||||||||||||||||
Development of Risk provisions for lending business (off-balance sheet lending transactions)
| Financial year 2025 |
Financial year 2024 | |||||||||||||||||||||||||||||||||||
|
|
Stage 1 | Stage 2 | Stage 3 | Total | Stage 1 | Stage 2 | Stage 3 | Total | ||||||||||||||||||||||||||||
| EUR in | EUR in | EUR in | EUR in | EUR in | EUR in | EUR in | EUR in | |||||||||||||||||||||||||||||
|
|
millions | millions | millions | millions | millions | millions | millions | millions | ||||||||||||||||||||||||||||
| As of 1 Jan. |
17 | 9 | 48 | 74 | 24 | 16 | 50 | 90 | ||||||||||||||||||||||||||||
| Transfer from stage 2 and stage 3 to stage 1 |
1 | –1 | 0 | 0 | 2 | –2 | 0 | 0 | ||||||||||||||||||||||||||||
| Transfer from stage 1 and stage 3 to stage 2 |
–1 | 1 | 0 | 0 | –1 | 1 | 0 | 0 | ||||||||||||||||||||||||||||
| Transfer from stage 1 and stage 2 to stage 3 |
0 | –2 | 2 | 0 | 0 | 0 | 0 | 0 | ||||||||||||||||||||||||||||
| Additions |
31 | 24 | 5 | 60 | 28 | 14 | 47 | 89 | ||||||||||||||||||||||||||||
| Reversals |
–25 | –11 | –16 | –52 | –36 | –19 | –50 | –105 | ||||||||||||||||||||||||||||
| Exchange rate and other changes |
–1 | 0 | –4 | –4 | 0 | 0 | 0 | 1 | ||||||||||||||||||||||||||||
| As of 31 Dec. | 21 | 21 | 36 | 78 | 17 | 9 | 48 | 74 | ||||||||||||||||||||||||||||
The post-model adjustment for the greater forecast uncertainty regarding global economic development particularly due to geopolitical crises and the threat of trade conflicts amounted to EUR 145 million as of the reporting date (31 Dec. 2024: EUR 100 million).
Provisions for losses on loans and advances also include money market investments and reverse repos.
In the reporting year, EUR 58 million (2024: EUR 100 million) in interest income was not collected for impaired loans and advances.
The contractual balance outstanding of financial assets that were written off during the reporting period and that are still subject to enforcement measures amounted to EUR 90 million as of the reporting date (31 Dec. 2024: EUR 98 million).
114
KfW Financial Report 2025
Financial Report > Consolidated financial statements > Consolidated notes – Notes to the consolidated statement of financial position
(38) Financial assets at fair value
Analysis of Financial assets at fair value by class
|
|
31 Dec. 2025 |
31 Dec. 2024 | ||||||||
|
|
EUR in millions | EUR in millions | ||||||||
| Loans and advances to banks – FVM |
|
|
||||||||
| Loans and advances |
0 | 0 | ||||||||
| Other receivables |
14 | 58 | ||||||||
| Loans and advances to customers – FVM |
|
|
||||||||
| Loans and advances |
8,154 | 8,232 | ||||||||
| Other receivables |
0 | 0 | ||||||||
| Securities and investments – FVM |
|
|
||||||||
| Bonds and other fixed-income securities |
0 | 0 | ||||||||
| Shares and other non-fixed income securities |
4,360 | 3,919 | ||||||||
| Equity investments |
1,142 | 1,112 | ||||||||
| Shares in non-consolidated subsidiaries |
96 | 92 | ||||||||
| Other derivatives – FVM |
|
|
||||||||
| Interest-related derivatives |
1,205 | 1,357 | ||||||||
| Cross-currency derivatives |
610 | 947 | ||||||||
|
|
||||||||||
| Total | 15,581 | 15,716 | ||||||||
An amount of EUR 8.0 billion (31 Dec. 2024: EUR 8.1 billion) is attributable to Holding arrangements of the Federal Republic of Germany within Loans and advances to customers – FVM (Loans and advances).
Cross-currency swaps are presented under Cross-currency derivatives.
Other derivatives include derivatives with positive fair values of EUR 149 million (31 Dec. 2024: EUR 87 million) attributable to embedded derivatives that are bifurcated.
(39) Value adjustments from macro fair value hedge accounting
|
|
31 Dec. 2025 | 31 Dec. 2024 | ||||||||
|
|
EUR in millions | EUR in millions | ||||||||
| Value adjustments to assets under macro fair value hedge accounting | –10,444 | –9,375 | ||||||||
The fair values attributable to hedged risks in the hedged portfolios in the at amortised cost measurement category are included in this item.
(40) Derivatives designated for hedge accounting
Analysis of derivatives with positive fair values designated for hedge accounting by type of hedging relationship
|
|
31 Dec. 2025 | 31 Dec. 2024 | ||||||||
|
|
EUR in millions | EUR in millions | ||||||||
| Micro fair value hedge accounting |
1,339 | 6,572 | ||||||||
| Macro fair value hedge accounting |
692 | 873 | ||||||||
| Total | 2,031 | 7,445 | ||||||||
115
KfW Financial Report 2025
Financial Report > Consolidated financial statements > Consolidated notes – Notes to the consolidated statement of financial position
Analysis of derivatives with positive fair values designated for hedge accounting
by type of hedging instrument
|
|
31 Dec. 2025 | 31 Dec. 2024 | ||||||||
|
|
EUR in millions | EUR in millions | ||||||||
| Interest-related derivatives |
1,471 | 1,529 | ||||||||
| Cross-currency derivatives | 560 | 5,916 | ||||||||
|
|
||||||||||
| Total | 2,031 | 7,445 | ||||||||
Only Interest-related derivatives are designated for macro fair value hedge accounting. Cross-currency swaps are presented under Cross-currency derivatives.
(41) Investments accounted for using the equity method
|
|
31 Dec. 2025 |
31 Dec. 2024 | ||||||||
|
|
EUR in millions | EUR in millions | ||||||||
| Investments accounted for using the equity method | 448 | 500 | ||||||||
|
|
||||||||||
| Total | 448 | 500 | ||||||||
The note regarding “Disclosures on shareholdings” includes a list of Investments accounted for using the equity method.
(42) Non-current assets held for sale
This item from the statement of financial position contains an equity investment of KfW with a fair value of EUR 12 million (31 Dec. 2024: EUR 37 million of DEG) in a technology company that meets the criteria under IFRS 5 of “non-current assets held for sale”, and is therefore to be reported separately.
Disposal of the equity investment within the next 12 months is highly likely.
All equity investments recognised as assets held for sale in the consolidated financial statements as of 31 December 2024 were sold as planned in 2025.
116
KfW Financial Report 2025
Financial Report > Consolidated financial statements > Consolidated notes – Notes to the consolidated statement of financial position
(43) Property, plant and equipment
Analysis of Property, plant and equipment by class
|
|
31 Dec. 2025 | 31 Dec. 2024 | ||||||||
|
|
EUR in millions | EUR in millions | ||||||||
| Land and buildings |
802 | 818 | ||||||||
| Plant and equipment |
66 | 65 | ||||||||
| Rights of use arising from leases |
39 | 29 | ||||||||
| Other property, plant and equipment | 18 | 10 | ||||||||
|
|
||||||||||
| Total | 925 | 922 | ||||||||
Additions to rights of use arising from leases amounted to EUR 28 million (2024: EUR 4 million). Payments in advance and assets under construction are presented in Other property, plant and equipment.
Development of Property, plant and equipment in financial year 2025
| Acquisition/ | Accumulated | Net carrying | ||||||||||||
| production cost | depreciation, | amount | ||||||||||||
| impairment and | ||||||||||||||
| reversal of | ||||||||||||||
| impairment | ||||||||||||||
|
|
|
losses |
|
|||||||||||
|
|
EUR in millions | EUR in millions | EUR in millions | |||||||||||
| Carrying amount as of 1 Jan. 2025 |
1,493 | –571 | 922 | |||||||||||
| Additions/reversals of impairment losses |
70 | 0 | 70 | |||||||||||
| Disposals |
–79 | 69 | –10 | |||||||||||
| Amortisation |
0 | –58 | –58 | |||||||||||
| Impairment losses | 0 | 0 | 0 | |||||||||||
|
|
||||||||||||||
| Carrying amount as of 31 Dec. 2025 | 1,485 | –560 | 925 | |||||||||||
Development of Property, plant and equipment in financial year 2024
| Acquisition/ | Accumulated | Net carrying | ||||||||||||
| production cost | depreciation, | amount | ||||||||||||
| impairment and | ||||||||||||||
| reversal of | ||||||||||||||
| impairment | ||||||||||||||
|
|
|
losses |
|
|||||||||||
|
|
EUR in millions | EUR in millions | EUR in millions | |||||||||||
| Carrying amount as of 1 Jan. 2024 |
1,533 | –604 | 929 | |||||||||||
| Additions/reversals of impairment losses |
70 | –2 | 68 | |||||||||||
| Disposals |
–109 | 92 | –17 | |||||||||||
| Amortisation |
0 | –57 | –57 | |||||||||||
| Impairment losses | 0 | 0 | 0 | |||||||||||
|
|
||||||||||||||
| Carrying amount as of 31 Dec. 2024 | 1,493 | –571 | 922 | |||||||||||
117
KfW Financial Report 2025
Financial Report > Consolidated financial statements > Consolidated notes – Notes to the consolidated statement of financial position
Analysis of Intangible assets by class
|
|
31 Dec. 2025 |
31 Dec. 2024 | ||||||||
|
|
EUR in millions | EUR in millions | ||||||||
| Software |
45 | 60 | ||||||||
| Purchased software |
21 | 24 | ||||||||
| Internally generated software |
24 | 36 | ||||||||
| Other intangible assets | 5 | 8 | ||||||||
|
|
||||||||||
| Total | 50 | 69 | ||||||||
Other intangible assets include, in particular, software under development.
Development of Intangible assets in financial year 2025
| Acquisition/ | Accumulated | Net carrying amount | ||||||||||||
| production cost | amortisation, | |||||||||||||
| impairment and | ||||||||||||||
| reversal of | ||||||||||||||
|
|
|
impairment losses |
|
|||||||||||
|
|
EUR in millions | EUR in millions | EUR in millions | |||||||||||
| Carrying amount as of 1 Jan. 2025 |
459 | –391 | 69 | |||||||||||
| Additions/reversals of impairment losses |
12 | 0 | 12 | |||||||||||
| Disposals |
–15 | 15 | 0 | |||||||||||
| Amortisation |
0 | –30 | –30 | |||||||||||
| Impairment losses | 0 | 0 | 0 | |||||||||||
|
|
||||||||||||||
| Carrying amount as of 31 Dec. 2025 | 456 | –406 | 50 | |||||||||||
Development of Intangible assets in financial year 2024
| Acquisition/ | Accumulated | Net carrying amount | ||||||||||||
| production cost | amortisation, | |||||||||||||
| impairment and | ||||||||||||||
| reversal of | ||||||||||||||
|
|
|
impairment losses |
|
|||||||||||
|
|
EUR in millions | EUR in millions | EUR in millions | |||||||||||
| Carrying amount as of 1 Jan. 2024 |
473 | –391 | 82 | |||||||||||
| Additions/reversals of impairment losses |
19 | 0 | 19 | |||||||||||
| Disposals |
–33 | 33 | 0 | |||||||||||
| Amortisation |
0 | –33 | –33 | |||||||||||
| Impairment losses | 0 | 0 | 0 | |||||||||||
|
|
||||||||||||||
| Carrying amount as of 31 Dec. 2024 | 459 | –391 | 69 | |||||||||||
118
KfW Financial Report 2025
Financial Report > Consolidated financial statements > Consolidated notes – Notes to the consolidated statement of financial position
Analysis of Income tax assets
|
|
31 Dec. 2025 | 31 Dec. 2024 | ||||||||
|
|
EUR in millions | EUR in millions | ||||||||
| Current income tax assets |
11 | 23 | ||||||||
| Deferred income tax assets | 72 | 86 | ||||||||
|
|
||||||||||
| Total | 83 | 109 | ||||||||
Current income tax assets result from creditable taxes (investment income tax/solidarity surcharge) and tax receivables from advance tax payments of the taxable group subsidiaries during financial year 2025 and the preceding years.
Deferred income tax assets mostly result from valuation differences relating to the statement of financial position items listed below and to loss carryforwards. The amount of deferred tax assets relating to loss carryforwards is based on a corresponding forecast of future income. As of 31 December 2024, the volume of deferred tax assets not recognised was EUR 10 million (31 Dec. 2024: EUR 8 million) relating to loss carryforwards, and EUR 0 million (31 Dec. 2024: EUR 0 million) relating to accounting issues.
Further information on the amount recognised directly in equity as deferred taxes under Revaluation reserves can be found in the note on “Equity”.
Composition of deferred tax assets by statement of financial position item
|
|
31 Dec. 2025 | 31 Dec. 2024 | ||||||||
|
|
EUR in millions | EUR in millions | ||||||||
| Financial assets at amortised cost |
50 | 52 | ||||||||
| Financial assets at fair value |
0 | 2 | ||||||||
| Financial liabilities at amortised cost |
0 | 0 | ||||||||
| Financial liabilities at fair value |
0 | 2 | ||||||||
| Provisions |
22 | 31 | ||||||||
| Other statement of financial position items |
1 | 1 | ||||||||
| Tax loss carryforwards |
2 | 4 | ||||||||
| Subtotal |
75 | 92 | ||||||||
| Offset against deferred tax liabilities | 3 | 6 | ||||||||
|
|
||||||||||
| Total | 72 | 86 | ||||||||
119
KfW Financial Report 2025
Financial Report > Consolidated financial statements > Consolidated notes – Notes to the consolidated statement of financial position
Analysis of Other assets
|
|
31 Dec. 2025 | 31 Dec. 2024 | ||||||||
|
|
EUR in millions | EUR in millions | ||||||||
| Other assets and receivables |
739 | 696 | ||||||||
| Prepaid expenses | 54 | 57 | ||||||||
|
|
||||||||||
| Total | 793 | 754 | ||||||||
Other assets and receivables includes primarily the receivables from the Federal Agency for Special Tasks Associated with Unification (Bundesanstalt für vereinigungsbedingte Sonderaufgaben – “BvS”) in the amount of EUR 682 million (31 Dec. 2024: EUR 634 million), which are offset in equal amount by provisions arising from the assumption of the operations of the State Insurance Company of the German Democratic Republic in liquidation (Staatliche Versicherung der Deutschen Demokratischen Republik in Abwicklung – “SinA”), an institution under public law.
Development of assets from contractual rights
|
|
2025 | 2024 | ||||||||
|
|
EUR in millions | EUR in millions | ||||||||
| As of 1 Jan. |
0 | 0 | ||||||||
| Additions |
0 | 0 | ||||||||
| Disposals | 0 | 0 | ||||||||
|
|
||||||||||
| As of 31 Dec. | 0 | 0 | ||||||||
(47) Financial liabilities at amortised cost
Analysis of Financial liabilities at amortised cost by class
|
|
31 Dec. 2025 | 31 Dec. 2024 | ||||||||
|
|
EUR in millions | EUR in millions | ||||||||
| Liabilities to banks |
|
|
||||||||
| Money-market transactions |
438 | 982 | ||||||||
| Promissory note loans |
1,287 | 1,087 | ||||||||
| Other financial liabilities |
928 | 4,393 | ||||||||
| Liabilities to customers |
|
|
||||||||
| Money-market transactions |
638 | 471 | ||||||||
| Promissory note loans |
15,722 | 23,964 | ||||||||
| Other financial liabilities |
5,557 | 5,654 | ||||||||
| Certificated liabilities |
|
|
||||||||
| Money-market issues |
53,919 | 32,494 | ||||||||
| Bonds and notes |
400,645 | 416,457 | ||||||||
|
|
||||||||||
| Total | 479,133 | 485,502 | ||||||||
Liabilities from cash collateral received are included in Other financial liabilities. These are attributable to cash collateral on derivatives in the amount of EUR 249 million (31 Dec. 2024: EUR 3,339 million), and to cash collateral on other transactions in the amount of EUR 941 million (31 Dec. 2024: EUR 1,148 million).
120
KfW Financial Report 2025
Financial Report > Consolidated financial statements > Consolidated notes – Notes to the consolidated statement of financial position
New securities (money market issues, bonds and notes) under the sub-item certificated liabilities, with a nominal volume of EUR 212.7 billion and which are to be measured at amortised cost, were issued during the current financial year (2024: EUR 157.6 billion). The volume of repayments due to maturity during the same period amounted to EUR 191.0 billion (nominal) (2024: EUR 167.2 billion) and the volume of early repurchases to EUR 0.2 billion (nominal) (2024: EUR 0.5 billion).
Liabilities include liabilities from repurchase agreements and securities lending transactions under Other financial liabilities.
(48) Financial liabilities at fair value
Analysis of Financial liabilities at fair value by class
|
|
31 Dec. 2025 |
31 Dec. 2024 | ||||||||
|
|
EUR in millions | EUR in millions | ||||||||
| Liabilities to banks – FVD |
|
|
||||||||
| Promissory note loans |
268 | 225 | ||||||||
| Liabilities to customers – FVD |
|
|
||||||||
| Promissory note loans |
590 | 719 | ||||||||
| Certificated liabilities – FVD |
|
|
||||||||
| Bonds and notes |
6,062 | 6,537 | ||||||||
| Other derivatives – FVM |
|
|
||||||||
| Interest-related derivatives |
1,537 | 1,494 | ||||||||
| Cross-currency derivatives |
847 | 799 | ||||||||
|
|
||||||||||
| Total | 9,305 | 9,774 | ||||||||
As in the previous year, there were no new issues in the current financial year under sub-item certificated liabilities to be measured at fair value. The volume of repayments due to maturity during the same period amounted to EUR 0.1 billion (nominal) (2024: EUR 0.2 billion) and the volume of early repurchases to EUR 0.2 billion (nominal) (2024: EUR 0.0 billion).
Cross-currency swaps are presented under Cross-currency derivatives.
Other derivatives include derivatives with negative fair values of EUR 2 million (31 Dec. 2024: EUR 5 million) attributable to embedded derivatives that are bifurcated.
121
KfW Financial Report 2025
Financial Report > Consolidated financial statements > Consolidated notes – Notes to the consolidated statement of financial position
(49) Value adjustments from macro fair value hedge accounting
|
|
31 Dec. 2025 | 31 Dec. 2024 | ||||||||
|
|
EUR in millions | EUR in millions | ||||||||
| Value adjustments to liabilities under macro fair value hedge accounting | –16 | –16 | ||||||||
The fair values attributable to hedged risks in the hedged portfolios in the at amortised cost measurement category are included in this item.
(50) Derivatives designated for hedge accounting
Analysis of derivatives with negative fair values designated for hedge accounting
by type of hedging relationship
|
|
31 Dec. 2025 | 31 Dec. 2024 | ||||||||
|
|
EUR in millions | EUR in millions | ||||||||
| Micro fair value hedge accounting |
7,472 | 5,619 | ||||||||
| Macro fair value hedge accounting | 714 | 1,362 | ||||||||
|
|
||||||||||
| Total | 8,185 | 6,982 | ||||||||
Analysis of derivatives with negative fair values designated for hedge accounting
by type of hedging instrument
|
|
31 Dec. 2025 | 31 Dec. 2024 | ||||||||
|
|
EUR in millions | EUR in millions | ||||||||
| Interest-related derivatives |
3,095 | 5,068 | ||||||||
| Cross-currency derivatives | 5,091 | 1,914 | ||||||||
|
|
||||||||||
| Total | 8,185 | 6,982 | ||||||||
Analysis of Provisions by class
|
|
31 Dec. 2025 | 31 Dec. 2024 | ||||||||
|
|
EUR in millions | EUR in millions | ||||||||
| Provisions for pensions and similar commitments |
1,881 | 1,904 | ||||||||
| Provisions for credit risks |
78 | 74 | ||||||||
| Other provisions | 1,069 | 969 | ||||||||
|
|
||||||||||
| Total | 3,027 | 2,948 | ||||||||
122
KfW Financial Report 2025
Financial Report > Consolidated financial statements > Consolidated notes – Notes to the consolidated statement of financial position
Development of Provisions for pensions and similar commitments in financial year 2025
|
|
Defined benefit obligations |
Early retirement |
Partial retirement |
Total | ||||||||||||||
|
|
EUR in millions | EUR in millions | EUR in millions | EUR in millions | ||||||||||||||
| As of 1 Jan. 2025 |
1,874 | 27 | 3 | 1,904 | ||||||||||||||
| Additions |
111 | 60 | 2 | 172 | ||||||||||||||
| Current service cost |
45 | 60 | 2 | 107 | ||||||||||||||
| Interest cost |
66 | 0 | 0 | 66 | ||||||||||||||
| Actuarial gains and losses |
–135 | 0 | 0 | –135 | ||||||||||||||
| Changes in demographic assumptions |
0 | 0 | 0 | 0 | ||||||||||||||
| Changes in financial assumptions |
–164 | 0 | 0 | –164 | ||||||||||||||
| Changes in experience adjustments |
29 | 0 | 0 | 29 | ||||||||||||||
| Utilisation |
–65 | –7 | –1 | –73 | ||||||||||||||
| Reversals |
0 | –4 | 0 | –4 | ||||||||||||||
| Transfers |
0 | 0 | 0 | 0 | ||||||||||||||
| Contributions by members (recognised in equity) | 16 | 0 | 0 | 16 | ||||||||||||||
|
|
||||||||||||||||||
| As of 31 Dec. 2025 | 1,800 | 77 | 3 | 1,881 | ||||||||||||||
The average expected residual term of the defined-benefit pension obligations was 15.0 years as of 31 December 2025 (31 Dec. 2024: 16.0 years).
Development of Provisions for pensions and similar commitments in financial year 2024
|
|
Defined benefit |
Early retirement |
Partial retirement |
Total | ||||||||||||||
|
|
EUR in millions | EUR in millions | EUR in millions | EUR in millions | ||||||||||||||
| As of 1 Jan. 2024 |
1,809 | 33 | 2 | 1,844 | ||||||||||||||
| Additions |
108 | 3 | 1 | 112 | ||||||||||||||
| Current service cost |
46 | 0 | 1 | 48 | ||||||||||||||
| Interest cost |
62 | 2 | 0 | 64 | ||||||||||||||
| Actuarial gains and losses |
6 | 0 | 0 | 6 | ||||||||||||||
| Changes in demographic assumptions |
–22 | 0 | 0 | –22 | ||||||||||||||
| Changes in experience adjustments |
28 | 0 | 0 | 28 | ||||||||||||||
| Utilisation |
–63 | –9 | –1 | –73 | ||||||||||||||
| Contributions by members (recognised in equity) | 14 | 0 | 0 | 14 | ||||||||||||||
|
|
||||||||||||||||||
| As of 31 Dec. 2024 | 1,874 | 27 | 3 | 1,904 | ||||||||||||||
123
KfW Financial Report 2025
Financial Report > Consolidated financial statements > Consolidated notes – Notes to the consolidated statement of financial position
Provisions for pensions and similar commitments are calculated on the basis of the 2018 G Heubeck actuarial tables and the following other actuarial assumptions:
Actuarial assumptions in % p.a.
|
|
31 Dec. 2025 | 31 Dec. 2024 | ||||||||
| Technical discount rate |
4.08 | 3.49 | ||||||||
| Rate of salary increases |
3.00 | 3.00 | ||||||||
| Rate of pension increases |
2.00 | 2.00 | ||||||||
| Rate of staff turnover | 3.23 | 3.23 | ||||||||
The technical discount rate as of 31 December 2025 reflects an adjustment to the average residual term of the defined benefit pension obligations translating into an adjustment to the average capital commitment period used.
Sensitivity of defined benefit pension obligations as of 31 December 2025
| Difference | Change in | Difference | Change in | |||||||||||||||||
| defined benefit | defined benefit | |||||||||||||||||||
|
|
|
obligations |
|
obligations | ||||||||||||||||
|
|
|
EUR in millions |
|
EUR in millions | ||||||||||||||||
| Life expectancy |
+1 year | 64 | –1 year | –67 | ||||||||||||||||
| Technical discount rate |
+0.25% | –63 | –0.25% | 67 | ||||||||||||||||
| Rate of salary increases |
+0.50% | 10 | –0.50% | –10 | ||||||||||||||||
| Rate of pension increases |
+0.50% | 94 | –0.50% | –52 | ||||||||||||||||
| Rate of staff turnover | +1.00% | –1 | –1.00% | 1 | ||||||||||||||||
Sensitivity of defined benefit pension obligations as of 31 December 2024
| Difference | Change in | Difference | Change in | |||||||||||||||||
| defined benefit | defined benefit | |||||||||||||||||||
|
|
|
obligations |
|
obligations | ||||||||||||||||
|
|
|
EUR in millions |
|
EUR in millions | ||||||||||||||||
| Life expectancy |
+1 year | 71 | –1 year | –73 | ||||||||||||||||
| Technical discount rate |
+0.25% | –70 | –0.25% | 75 | ||||||||||||||||
| Rate of salary increases |
+0.50% | 13 | –0.50% | –12 | ||||||||||||||||
| Rate of pension increases |
+0.50% | 103 | –0.50% | –57 | ||||||||||||||||
| Rate of staff turnover | +1.00% | –1 | –1.00% | 1 | ||||||||||||||||
Development of Risk provisions for lending business
For the development of Risk provisions for lending business (off-balance sheet transactions) see the note regarding “Risk provisions”.
124
KfW Financial Report 2025
Financial Report > Consolidated financial statements > Consolidated notes – Notes to the consolidated statement of financial position
Development of Other provisions in financial year 2025
|
|
Obligations to employees |
Other provisions |
Total |
|||||||||||||||||||||||||
|
|
EUR in millions | EUR in millions | EUR in millions | |||||||||||||||||||||||||
| As of 1 Jan. 2025 |
38 | 931 | 969 | |||||||||||||||||||||||||
| Additions |
12 | 154 | 166 | |||||||||||||||||||||||||
| Utilisation |
–10 | –51 | –60 | |||||||||||||||||||||||||
| Reversals | 0 | –6 | –6 | |||||||||||||||||||||||||
|
|
||||||||||||||||||||||||||||
| As of 31 Dec. 2025 | 40 | 1,029 | 1,069 | |||||||||||||||||||||||||
The Obligations to employees column shows other long-term employee benefits including provisions for service anniversaries. Corresponding actuarial reports have been prepared for these obligations.
Other provisions include provisions for the obligation to award grants under the ERP Special Fund in subsequent years in the amount of EUR 124 million (31 Dec. 2024: EUR 135 million).
An Other provisions item in the amount of EUR 149 million (31 Dec. 2024: EUR 100 million) is reported due to the interest rate being below the market rate for irrevocable promotional loan commitments with additional promotional funds in the form of interest rate reductions impacting KfW’s earnings position. Changes to existing provisions are presented as net additions or, in the case of a decline, as a transfer via the adjustments to the carrying amounts of already disbursed promotional loans recognised on the assets side under Financial assets at amortised cost – Loans and advances to banks or customers.
Other provisions also comprise obligations arising from the assumption of the operations of the State Insurance Company of the German Democratic Republic in liquidation (Staatliche Versicherung der Deutschen Demokra-tischen Republik in Abwicklung – “SinA”), an institution under public law, in the amount of EUR 682 million (31 Dec. 2024: EUR 634 million), which are offset by receivables in the same amount from the Federal Agency for Special Tasks Associated with Unification (Bundesanstalt für vereinigungsbedingte Sonderaufgaben – “BvS”) recognised in Other assets. Other provisions also include provisions for legal risks offset by receivables from the Federal Government in the same amount.
Development of Other provisions in financial year 2024
|
|
Obligations to |
Other |
Total |
|||||||||||||||||||
|
|
EUR in millions |
EUR in millions |
EUR in millions |
|||||||||||||||||||
| As of 1 Jan. 2024 |
35 |
842 |
877 |
|||||||||||||||||||
| Additions |
11 |
154 |
165 |
|||||||||||||||||||
| Utilisation |
–8 |
–53 |
–61 |
|||||||||||||||||||
| Reversals | –1 | –12 | –13 | |||||||||||||||||||
|
|
||||||||||||||||||||||
| As of 31 Dec. 2024 | 38 | 931 | 969 | |||||||||||||||||||
Analysis of Income tax liabilities
|
|
31 Dec. 2025 |
31 Dec. 2024 | ||||||||||||||||
|
|
EUR in millions | EUR in millions | ||||||||||||||||
| Current income tax liabilities |
46 | 206 | ||||||||||||||||
| Deferred income tax liabilities |
56 | 23 | ||||||||||||||||
|
|
||||||||||||||||||
| Total |
102 | 230 | ||||||||||||||||
125
KfW Financial Report 2025
Financial Report > Consolidated financial statements > Consolidated notes – Notes to the consolidated statement of financial position
Current income tax liabilities as of 31 December 2025 primarily consisted of tax provisions at the level of taxable companies included in the group.
Deferred income tax liabilities mostly resulted from valuation differences relating to the statement of financial position items listed below.
Composition of deferred tax liabilities by statement of financial position item
|
|
31 Dec. 2025 |
31 Dec. 2024 |
||||||||||||
|
|
EUR in millions |
EUR in millions |
||||||||||||
| Financial assets at fair value – Other derivatives |
0 |
0 |
||||||||||||
| Financial assets at amortised cost |
0 |
0 |
||||||||||||
| Financial assets at fair value – Securities and investments |
55 |
24 |
||||||||||||
| Investments accounted for using the equity method |
3 |
4 |
||||||||||||
| Other statement of financial position items |
1 |
1 |
||||||||||||
| Subtotal |
59 |
29 |
||||||||||||
| Offset against deferred tax assets |
3 | 6 | ||||||||||||
|
|
||||||||||||||
| Total |
56 | 23 | ||||||||||||
Analysis of Other liabilities
|
|
31 Dec. 2025 |
31 Dec. 2024 |
||||||||||||
|
|
EUR in millions |
EUR in millions |
||||||||||||
| Other financial liabilities |
274 |
300 |
||||||||||||
| thereof Accruals |
201 |
202 |
||||||||||||
| Deferred income |
49 |
44 |
||||||||||||
| Lease liabilities |
39 | 30 | ||||||||||||
|
|
||||||||||||||
| Total |
362 | 374 | ||||||||||||
Deferred income contains liabilities resulting from contractual obligations (“contract liabilities” in accordance with IFRS 15). These developed as follows:
Development of liabilities from contractual obligations
|
|
2025 |
2024 |
||||||||||||
|
|
EUR in millions |
EUR in millions |
||||||||||||
| As of 1 Jan. |
43 |
37 |
||||||||||||
| Additions |
15 |
25 |
||||||||||||
| Disposals |
–19 | –19 | ||||||||||||
|
|
||||||||||||||
| As of 31 Dec. |
38 | 43 | ||||||||||||
126
KfW Financial Report 2025
Financial Report > Consolidated financial statements > Consolidated notes – Notes to the consolidated statement of financial position
Analysis of Equity
|
|
31 Dec. 2025 |
31 Dec. 2024 |
||||||||||||
|
|
EUR in millions | EUR in millions |
||||||||||||
| Subscribed capital |
3,750 | 3,750 |
||||||||||||
| less uncalled outstanding contributions |
–450 | –450 |
||||||||||||
| Paid-in subscribed capital |
3,300 | 3,300 |
||||||||||||
| Capital reserve |
8,447 | 8,447 |
||||||||||||
| Reserve from the ERP Special Fund |
1,191 | 1,191 |
||||||||||||
| Retained earnings |
27,555 | 26,552 |
||||||||||||
| Statutory reserve under Article 10 (2) KfW Law |
1,875 | 1,875 |
||||||||||||
| Special reserve under Article 10 (3) KfW Law |
18,916 | 17,988 |
||||||||||||
| Special reserve less the special loss account from provisioning pursuant to Section 17 (4) of the D-Mark Balance Sheet Law |
21 | 21 |
||||||||||||
| Other retained earnings |
6,742 | 6,668 |
||||||||||||
| Revaluation reserves |
131 | 83 |
||||||||||||
| Valuation result from the change in own credit risk of liabilities designated at fair value through profit or loss |
79 | 160 |
||||||||||||
| Actuarial gains and losses from defined-benefit pension obligations (after tax) |
52 | –77 | ||||||||||||
|
|
||||||||||||||
| Total |
40,623 | 39,573 | ||||||||||||
The Federal Government owns 80% of KfW’s share capital, the German federal states 20%. In accordance with Article 1a of the KfW Law, the Federal Republic of Germany is liable for certain liabilities of KfW. There is no profit distribution in accordance with Article 10 (1) of the KfW Law. KfW’s net income amounting to EUR 928 million (2024: EUR 871 million) was used to increase the special reserve under Article 10 (3) KfW Law.
Equity forms the basis for the capital available for covering risks, which is matched against the capital requirements derived from internal management.
For information concerning Equity in relation to risk-bearing capacity, see the risk report in the combined management report.
The revaluation reserves developed as follows:
Development of revaluation reserves
|
|
Valuation result from the change in own credit risk of liabilities designated at fair value through profit or loss |
Actuarial gains and losses from defined benefit pension obligations |
Effects of deferred taxes |
Total | ||||||||||||||||||
|
|
EUR in millions | EUR in millions | EUR in millions | EUR in millions | ||||||||||||||||||
| As of 1 Jan. 2024 |
55 | –68 | –2 | –15 | ||||||||||||||||||
| Consolidated comprehensive income |
105 | –6 | –1 | 98 | ||||||||||||||||||
| Other comprehensive income |
105 | –6 | –1 | 98 | ||||||||||||||||||
| As of 31 Dec. 2024 |
160 | –74 | –3 | 83 | ||||||||||||||||||
| Consolidated comprehensive income |
–81 | 135 | –6 | 48 | ||||||||||||||||||
| Other comprehensive income |
–81 | 135 | –6 | 48 | ||||||||||||||||||
|
|
||||||||||||||||||||||
| As of 31 Dec. 2025 |
79 | 61 | –9 | 131 | ||||||||||||||||||
127
KfW Financial Report 2025
Financial Report > Consolidated financial statements > Consolidated notes – Notes to the consolidated statement of financial position
(55) Expected time to maturity for assets and liabilities
The table below breaks down the assets and liabilities by maturity, or expected realisation.
There is a differentiation between assets and liabilities due or realisable within up to 12 months after the reporting date (short term) and those due or realisable more than 12 months after the reporting date (long term).
Financial instruments without contractually agreed terms are classed as short term. These also include the statement of financial position items Cash reserves, Non-current assets held for sale, and Current income tax assets and liabilities.
The long term category includes the items Investments accounted for using the equity method, Property, plant and equipment, Intangible assets, and Deferred Income tax assets and liabilities.
Assets
|
|
31 Dec. 2025 |
31 Dec. 2024 |
||||||||||||||||||
|
|
short term | long term | short term |
long term |
||||||||||||||||
|
|
EUR in millions | EUR in millions | EUR in millions |
EUR in millions |
||||||||||||||||
| Cash reserves |
19,535 | 0 | 26,522 |
0 |
||||||||||||||||
| Financial assets at amortised cost |
106,667 | 405,043 | 107,460 |
395,207 |
||||||||||||||||
| Financial assets at fair value |
379 | 15,202 | 697 |
15,020 |
||||||||||||||||
| Value adjustments from macro fair value hedge accounting |
–161 | –10,283 | –1,271 |
–8,103 |
||||||||||||||||
| Derivatives designated for hedge accounting |
572 | 1,458 | 2,127 |
5,318 |
||||||||||||||||
| Investments accounted for using the equity method |
0 | 448 | 0 |
500 |
||||||||||||||||
| Non-current assets held for sale |
12 | 0 | 37 |
0 |
||||||||||||||||
| Property, plant and equipment |
0 | 925 | 0 |
922 |
||||||||||||||||
| Intangible assets |
0 | 50 | 0 |
69 |
||||||||||||||||
| Income tax assets |
11 | 72 | 23 |
86 |
||||||||||||||||
| Other assets | 111 | 682 | 119 | 635 | ||||||||||||||||
|
|
||||||||||||||||||||
| Total |
127,127 | 413,596 | 135,713 | 409,652 | ||||||||||||||||
Liabilities and equity
|
|
31 Dec. 2025 |
31 Dec. 2024 |
||||||||||||||||||
|
|
short term | long term | short term |
long term |
||||||||||||||||
|
|
EUR in millions | EUR in millions | EUR in millions |
EUR in millions |
||||||||||||||||
| Financial liabilities at amortised cost |
135,541 | 343,591 | 134,496 |
351,006 |
||||||||||||||||
| Financial liabilities at fair value |
441 | 8,864 | 344 |
9,430 |
||||||||||||||||
| Value adjustments from macro fair value hedge accounting |
–2 | –14 | –2 |
–14 |
||||||||||||||||
| Derivatives designated for hedge accounting |
1,696 | 6,490 | 1,268 |
5,713 |
||||||||||||||||
| Provisions |
218 | 2,809 | 165 |
2,783 |
||||||||||||||||
| Income tax liabilities |
46 | 56 | 206 |
23 |
||||||||||||||||
| Other liabilities | 325 | 37 | 348 | 27 | ||||||||||||||||
|
|
||||||||||||||||||||
| Total |
138,266 | 361,834 | 136,825 | 368,968 | ||||||||||||||||
128
KfW Financial Report 2025
Financial Report > Consolidated financial statements > Consolidated notes – Notes to financial instruments
Notes to financial instruments
The different IFRS 9 measurement categories are abbreviated as follows in the Notes to financial instruments:
| ACO | = | Financial instruments measured at amortised cost | ||
| FVM | = | Financial instruments measured at fair value | ||
| FVD | = | Financial instruments designated at fair value |
(56) Gains and losses from financial instruments by measurement category
The following tables show the results from financial instruments included in the different statement of comprehensive income items presented by measurement category. The result from foreign currency translation is not included.
Gains and losses from financial instruments by measurement category in financial year 2025
| Financial liabilities at fair value |
||||||||||||||||||||||||||||||||||
| Financial | Financial | Financial | FVM | FVD | Derivatives | Total | ||||||||||||||||||||||||||||
| assets at | liabilities at | assets at | designated | |||||||||||||||||||||||||||||||
| amortised | amortised | fair value – | for hedge | |||||||||||||||||||||||||||||||
|
|
cost | cost | FVM |
|
|
accounting | ||||||||||||||||||||||||||||
| EUR in | EUR in | EUR in | EUR in | EUR in | EUR in | EUR in | ||||||||||||||||||||||||||||
|
|
millions | millions | millions | millions | millions | millions | millions | |||||||||||||||||||||||||||
| Interest income |
11.3611) | 0 | 607 | 410 | 0 | 3,118 | 15,495 | |||||||||||||||||||||||||||
| Interest expense |
–421 | –10,545 | –61 | –195 | –333 | –1,337 | –12,893 | |||||||||||||||||||||||||||
| Net gains/losses from risk provisions |
–158 | 0 | 0 | 0 | 0 | 0 | –158 | |||||||||||||||||||||||||||
| Commission income |
11 | 0 | 0 | 0 | 0 | 0 | 11 | |||||||||||||||||||||||||||
| Commission expense |
–11 | –8 | 0 | 0 | 0 | 0 | –19 | |||||||||||||||||||||||||||
| Net gains/losses from hedge accounting |
–1,070 | –329 | 0 | 0 | 0 | 1,272 | –128 | |||||||||||||||||||||||||||
| Net gains/losses from other financial instruments at fair value through profit or loss |
0 | 0 | 111 | –133 | –22 | 0 | –44 | |||||||||||||||||||||||||||
| Net gains/losses from disposal of financial assets at amortised cost |
0 | 0 | 0 | 0 | 0 | 0 | 0 | |||||||||||||||||||||||||||
| Net other operating income or loss |
0 | 0 | 0 | 0 | 0 | 0 | 0 | |||||||||||||||||||||||||||
| Change in revaluation reserves | 0 | 0 | 0 | 0 | –81 | 0 | –81 | |||||||||||||||||||||||||||
| Total | 9,712 | –10,883 | 656 | 82 | –436 | 3,052 | 2,184 | |||||||||||||||||||||||||||
| 1) | Includes interest income from financial guarantees of EUR 34 million |
129
KfW Financial Report 2025
Financial Report > Consolidated financial statements > Consolidated notes – Notes to financial instruments
Gains and losses from financial instruments by measurement category in financial year 2024
| Financial liabilities at fair value |
||||||||||||||||||||||||||||||||||
| Financial | Financial | Financial | FVM | FVD | Derivatives | Total | ||||||||||||||||||||||||||||
| assets at | liabilities at | assets at | designated | |||||||||||||||||||||||||||||||
| amortised | amortised | fair value – | for hedge | |||||||||||||||||||||||||||||||
|
|
cost | cost | FVM |
|
|
accounting |
|
|||||||||||||||||||||||||||
| EUR in | EUR in | EUR in | EUR in | EUR in | EUR in | EUR in | ||||||||||||||||||||||||||||
|
|
millions | millions | millions | millions | millions | millions | millions | |||||||||||||||||||||||||||
| Interest income |
12.6441) | 0 | 808 | 241 | 0 | 7,488 | 21,181 | |||||||||||||||||||||||||||
| Interest expense |
–406 | –9,579 | –89 | –430 | –356 | –7,765 | –18,624 | |||||||||||||||||||||||||||
| Net gains/losses from risk provisions |
39 | 0 | 0 | 0 | 0 | 0 | 39 | |||||||||||||||||||||||||||
| Commission income |
3 | 0 | 0 | 0 | 0 | 0 | 3 | |||||||||||||||||||||||||||
| Commission expense |
–10 | –5 | 0 | 0 | 0 | 0 | –16 | |||||||||||||||||||||||||||
| Net gains/losses from hedge accounting |
6,085 | –6,550 | 0 | 0 | 0 | 572 | 107 | |||||||||||||||||||||||||||
| Net gains/losses from other financial instruments at fair value through profit or loss |
0 | 0 | –162 | 58 | 194 | 0 | 90 | |||||||||||||||||||||||||||
| Net gains/losses from disposal of financial assets at amortised cost |
0 | 0 | 0 | 0 | 0 | 0 | 0 | |||||||||||||||||||||||||||
| Net other operating income or loss |
0 | 3 | 0 | 0 | 0 | 0 | 3 | |||||||||||||||||||||||||||
| Change in revaluation reserves | 0 | 0 | 0 | 0 | 105 | 0 | 105 | |||||||||||||||||||||||||||
| Total | 18,356 | –16,132 | 557 | –130 | –58 | 295 | 2,888 | |||||||||||||||||||||||||||
1) Includes interest income from financial guarantees of EUR 38 million
130
KfW Financial Report 2025
Financial Report > Consolidated financial statements > Consolidated notes – Notes to financial instruments
(57) Disclosures on fair value
The following tables show the financial instruments measured at fair value or for which the fair value is indicated in the Notes according to the valuation methods used. There is also a comparison of fair value and carrying amount.
Fair value of financial instruments by valuation method as of 31 December 2025
| Fair Value | ||||||||||||||||||||||||||
| Carrying | Level 1 | Level 2 | Level 3 | Total | Difference | |||||||||||||||||||||
| amount | from | |||||||||||||||||||||||||
| (statement | carrying | |||||||||||||||||||||||||
| of financial | amount | |||||||||||||||||||||||||
|
|
position) |
|
|
|
|
|
||||||||||||||||||||
| EUR in | EUR in | EUR in | EUR in | EUR in | EUR in | |||||||||||||||||||||
|
|
millions | millions | millions | millions | millions | millions | ||||||||||||||||||||
| Assets |
|
|
|
|
|
|
|
|
|
|
||||||||||||||||
| Cash reserves |
19,535 | 19,535 | 0 | 0 | 19,535 | 0 | ||||||||||||||||||||
| Financial assets at amortised cost |
|
|
|
|
|
|
|
|
|
|
||||||||||||||||
| Loans and advances to banks |
335,625 | 0 | 46,850 | 277,437 | 324,287 | –11,338 | ||||||||||||||||||||
| Loans and advances to customers |
138,351 | 0 | 989 | 134,999 | 135,988 | –2,363 | ||||||||||||||||||||
| Securities and investments |
37,734 | 29,334 | 3,489 | 4,965 | 37,788 | 54 | ||||||||||||||||||||
| Financial assets at fair value |
|
|
|
|
|
|
|
|
|
|
||||||||||||||||
| Loans and advances to banks – FVM |
14 | 0 | 0 | 14 | 14 | 0 | ||||||||||||||||||||
| Loans and advances to customers – FVM |
8,154 | 0 | 8,026 | 128 | 8,154 | 0 | ||||||||||||||||||||
| Securities and investments – FVM |
5,599 | 102 | 3,360 | 2,136 | 5,599 | 0 | ||||||||||||||||||||
| Other derivatives – FVM |
1,814 | 0 | 1,812 | 2 | 1,814 | 0 | ||||||||||||||||||||
| Value adjustments from macro fair value hedge accounting |
–10,444 | n/a | n/a | n/a | n/a | 10,444 | ||||||||||||||||||||
| Derivatives designated for hedge accounting |
2,031 | 0 | 2,031 | 0 | 2,031 | 0 | ||||||||||||||||||||
| Non-current assets held for sale | 12 | 0 | 0 | 12 | 12 | 0 | ||||||||||||||||||||
|
|
||||||||||||||||||||||||||
| Total | 538,424 | 48,971 | 66,557 | 419,693 | 535,221 | –3,203 | ||||||||||||||||||||
| Liabilities and equity |
|
|
|
|
|
|
|
|
|
|
||||||||||||||||
| Financial liabilities at amortised cost |
|
|
|
|
|
|
|
|
|
|
||||||||||||||||
| Liabilities to banks |
2,652 | 0 | 2,634 | 0 | 2,634 | –18 | ||||||||||||||||||||
| Liabilities to customers |
21,917 | 0 | 21,201 | 0 | 21,201 | –715 | ||||||||||||||||||||
| Certificated liabilities |
454,564 | 381,679 | 69,441 | 4 | 451,124 | –3,440 | ||||||||||||||||||||
| Financial liabilities at fair value |
|
|
|
|
|
|
|
|
|
|
||||||||||||||||
| Liabilities to banks – FVD |
268 | 0 | 268 | 0 | 268 | 0 | ||||||||||||||||||||
| Liabilities to customers – FVD |
590 | 0 | 590 | 0 | 590 | 0 | ||||||||||||||||||||
| Certificated liabilities – FVD |
6,062 | 3,990 | 2,066 | 6 | 6,062 | 0 | ||||||||||||||||||||
| Other derivatives – FVM |
2,384 | 0 | 2,369 | 15 | 2,384 | 0 | ||||||||||||||||||||
| Value adjustments from macro fair value hedge accounting |
–16 | n/a | n/a | n/a | n/a | 16 | ||||||||||||||||||||
| Derivatives designated for hedge accounting | 8,185 | 0 | 8,185 | 0 | 8,185 | 0 | ||||||||||||||||||||
|
|
||||||||||||||||||||||||||
| Total | 496,608 | 385,669 | 106,755 | 26 | 492,450 | –4,158 | ||||||||||||||||||||
131
KfW Financial Report 2025
Financial Report > Consolidated financial statements > Consolidated notes – Notes to financial instruments
Fair value of financial instruments by valuation method as of 31 December 2024
| Fair Value | ||||||||||||||||||||||||||
| Carrying | Level 1 | Level 2 | Level 3 | Total | Difference | |||||||||||||||||||||
| amount | from | |||||||||||||||||||||||||
| (statement | carrying | |||||||||||||||||||||||||
| of financial | amount | |||||||||||||||||||||||||
|
|
position) |
|
|
|
|
|
||||||||||||||||||||
| EUR in | EUR in | EUR in | EUR in | EUR in | EUR in | |||||||||||||||||||||
|
|
millions | millions | millions | millions | millions | millions | ||||||||||||||||||||
| Assets |
|
|
|
|
|
|
|
|
|
|
||||||||||||||||
| Cash reserves |
26,522 | 26,522 | 0 | 0 | 26,522 | 0 | ||||||||||||||||||||
| Financial assets at amortised cost |
|
|
|
|
|
|
|
|
|
|
||||||||||||||||
| Loans and advances to banks |
320,406 | 0 | 28,320 | 279,286 | 307,607 | –12,799 | ||||||||||||||||||||
| Loans and advances to customers |
144,278 | 0 | 778 | 141,528 | 142,306 | –1,972 | ||||||||||||||||||||
| Securities and investments |
37,982 | 29,660 | 3,257 | 4,899 | 37,816 | –167 | ||||||||||||||||||||
| Financial assets at fair value |
|
|
|
|
|
|
|
|
|
|
||||||||||||||||
| Loans and advances to banks – FVM |
58 | 0 | 0 | 58 | 58 | 0 | ||||||||||||||||||||
| Loans and advances to customers – FVM |
8,232 | 0 | 8,085 | 147 | 8,232 | 0 | ||||||||||||||||||||
| Securities and investments – FVM |
5,123 | 91 | 2,699 | 2,334 | 5,123 | 0 | ||||||||||||||||||||
| Other derivatives – FVM |
2,303 | 0 | 2,299 | 4 | 2,303 | 0 | ||||||||||||||||||||
| Value adjustments from macro fair value hedge accounting |
–9,375 | n/a | n/a | n/a | n/a | 9,375 | ||||||||||||||||||||
| Derivatives designated for hedge accounting |
7,445 | 0 | 7,445 | 0 | 7,445 | 0 | ||||||||||||||||||||
| Non-current assets held for sale | 37 | 0 | 37 | 0 | 37 | 0 | ||||||||||||||||||||
|
|
||||||||||||||||||||||||||
| Total | 543,012 | 56,273 | 52,920 | 428,256 | 537,449 | –5,563 | ||||||||||||||||||||
| Liabilities and equity |
|
|
|
|
|
|
|
|
|
|
||||||||||||||||
| Financial liabilities at amortised cost |
|
|
|
|
|
|
|
|
|
|
||||||||||||||||
| Liabilities to banks |
6,462 | 0 | 6,447 | 0 | 6,447 | –15 | ||||||||||||||||||||
| Liabilities to customers |
30,089 | 0 | 29,367 | 0 | 29,367 | –722 | ||||||||||||||||||||
| Certificated liabilities |
448,951 | 396,089 | 46,383 | 0 | 442,472 | –6,479 | ||||||||||||||||||||
| Financial liabilities at fair value |
|
|
|
|
|
|
|
|
|
|
||||||||||||||||
| Liabilities to banks – FVD |
225 | 0 | 225 | 0 | 225 | 0 | ||||||||||||||||||||
| Liabilities to customers – FVD |
719 | 0 | 719 | 0 | 719 | 0 | ||||||||||||||||||||
| Certificated liabilities – FVD |
6,537 | 4,152 | 2,385 | 0 | 6,537 | 0 | ||||||||||||||||||||
| Other derivatives – FVM |
2,293 | 0 | 2,275 | 18 | 2,293 | 0 | ||||||||||||||||||||
| Value adjustments from macro fair value hedge accounting |
–16 | n/a | n/a | n/a | n/a | 16 | ||||||||||||||||||||
| Derivatives designated for hedge accounting | 6,982 | 0 | 6,982 | 0 | 6,982 | 0 | ||||||||||||||||||||
|
|
||||||||||||||||||||||||||
| Total | 502,241 | 400,241 | 94,782 | 18 | 495,042 | –7,200 | ||||||||||||||||||||
Interest-related changes in value are also included in measuring the fair value of the financial instruments. Accordingly, when the comparison is made with the carrying amount, it is necessary to take into account the changes in value (interest-related) resulting from the recognition of Loans and advances and borrowings in macro fair value hedge accounting.
132
KfW Financial Report 2025
Financial Report > Consolidated financial statements > Consolidated notes – Notes to financial instruments
Change in level assignment of financial instruments measured at fair value with a transfer between levels 1 and 2 in financial year 2025
|
|
Transfer from level 1 to level 2 |
Transfer from level 2 to level 1 |
||||||
|
|
EUR in millions | EUR in millions | ||||||
| Assets |
|
|
|
|
||||
| Financial assets at fair value |
|
|
|
|
||||
| Loans and advances to banks – FVM |
0 | 0 | ||||||
| Loans and advances to customers – FVM |
0 | 0 | ||||||
| Securities and investments – FVM |
0 | 0 | ||||||
| Other derivatives – FVM |
0 | 0 | ||||||
| Derivatives designated for hedge accounting |
0 | 0 | ||||||
| Non-current assets held for sale | 0 | 0 | ||||||
|
|
||||||||
| Total | 0 | 0 | ||||||
| Liabilities and equity |
|
|
|
|
||||
| Financial liabilities at fair value |
|
|
|
|
||||
| Liabilities to banks – FVD |
0 | 0 | ||||||
| Liabilities to customers – FVD |
0 | 0 | ||||||
| Certificated liabilities – FVD |
0 | 0 | ||||||
| Other derivatives – FVM |
0 | 0 | ||||||
| Derivatives designated for hedge accounting | 0 | 0 | ||||||
|
|
||||||||
| Total | 0 | 0 | ||||||
The group did not make any transfers between levels in financial year 2025. The group primarily made transfers from level 2 to level 1 in financial year 2024 as quoted market prices from active markets were available again for the respective financial instruments.
133
KfW Financial Report 2025
Financial Report > Consolidated financial statements > Consolidated notes – Notes to financial instruments
Change in level assignment of financial instruments measured at fair value with a transfer between levels 1 and 2 in financial year 2024
|
|
Transfer from level 1 to level 2 |
Transfer from level 2 to level 1 |
||||||
|
|
EUR in millions | EUR in millions | ||||||
| Assets |
|
|
|
|
||||
| Financial assets at fair value |
|
|
|
|
||||
| Loans and advances to banks – FVM |
0 | 0 | ||||||
| Loans and advances to customers – FVM |
0 | 0 | ||||||
| Securities and investments – FVM |
0 | 3 | ||||||
| Other derivatives – FVM |
0 | 0 | ||||||
| Derivatives designated for hedge accounting |
0 | 0 | ||||||
| Non-current assets held for sale | 0 | 0 | ||||||
|
|
||||||||
| Total | 0 | 3 | ||||||
| Liabilities and equity |
|
|
|
|
||||
| Financial liabilities at fair value |
|
|
|
|
||||
| Liabilities to banks – FVD |
0 | 0 | ||||||
| Liabilities to customers – FVD |
0 | 0 | ||||||
| Certificated liabilities – FVD |
0 | 0 | ||||||
| Other derivatives – FVM |
0 | 0 | ||||||
| Derivatives designated for hedge accounting | 0 | 0 | ||||||
|
|
||||||||
| Total | 0 | 0 | ||||||
134
KfW Financial Report 2025
Financial Report > Consolidated financial statements > Consolidated notes – Notes to financial instruments
Development of financial assets measured at fair value assigned to level 3 in financial year 2025
| Financial assets at fair value | ||||||||||||||||||||||||||||||
|
|
Loans and advances to banks – FVM |
Loans and advances to customers – FVM |
Securities and investments – FVM |
Other derivatives – FVM |
Non-current assets held for sale |
Total | ||||||||||||||||||||||||
|
|
EUR in millions |
EUR in millions |
EUR in millions |
EUR in millions |
EUR in millions |
EUR in millions |
||||||||||||||||||||||||
| As of 1 Jan. 2025 |
58 | 147 | 2,334 | 4 | 0 | 2,542 | ||||||||||||||||||||||||
| A.Changes recognised in the income statement |
|
|
|
|
|
|
|
|
|
|
||||||||||||||||||||
| Net interest and commission income |
0 | –2 | 0 | 0 | 0 | –3 | ||||||||||||||||||||||||
| Contracts still valid at year-end |
0 | –2 | 0 | 0 | 0 | –2 | ||||||||||||||||||||||||
| Net gains/losses from hedge accounting |
0 | 0 | 0 | 0 | 0 | 0 | ||||||||||||||||||||||||
| Contracts still valid at year-end |
0 | 0 | 0 | 0 | 0 | 0 | ||||||||||||||||||||||||
| Net gains/losses from other financial instruments at fair value through profit or loss |
–12 | 6 | 35 | –1 | 7 | 35 | ||||||||||||||||||||||||
| Contracts still valid at year-end |
5 | 22 | 82 | –1 | 7 | 116 | ||||||||||||||||||||||||
| Total changes recognised in the income statement |
–12 | 4 | 35 | –1 | 7 | 32 | ||||||||||||||||||||||||
| B.Changes recognised directly in equity |
|
|
|
|
|
|
|
|
|
|
||||||||||||||||||||
| Changes in level assignment |
0 | 0 | –229 | 1 | 0 | –228 | ||||||||||||||||||||||||
| Transfer from level 1 and level 2 |
0 | 0 | 548 | 1 | 0 | 549 | ||||||||||||||||||||||||
| Transfer to level 1 and level 2 |
0 | 0 | –777 | 0 | 0 | –777 | ||||||||||||||||||||||||
| Additions |
0 | 15 | 134 | 4 | 0 | 152 | ||||||||||||||||||||||||
| Disposals |
–26 | –32 | –130 | –4 | 0 | –192 | ||||||||||||||||||||||||
| Total changes recognised directly in equity |
–26 | –17 | –226 | 1 | 0 | –268 | ||||||||||||||||||||||||
| Changes in consolidated group |
0 | 0 | 0 | 0 | 0 | 0 | ||||||||||||||||||||||||
| Exchange rate changes |
–6 | –6 | –1 | –2 | 0 | –15 | ||||||||||||||||||||||||
| Other changes | 0 | 0 | –5 | 0 | 5 | 0 | ||||||||||||||||||||||||
| As of 31 Dec. 2025 | 14 | 128 | 2,136 | 2 | 12 | 2,292 | ||||||||||||||||||||||||
135
KfW Financial Report 2025
Financial Report > Consolidated financial statements > Consolidated notes – Notes to financial instruments
Development of financial liabilities measured at fair value assigned to level 3 in financial year 2025
| Financial liabilities at fair value | ||||||||||||||||||||||||||
|
|
Liabilities to banks – FVD |
Liabilities to customers – FVD |
Certificated liabilities – FVD |
Other derivatives – FVM |
Total | |||||||||||||||||||||
|
|
EUR in millions | EUR in millions | EUR in millions | EUR in millions | EUR in millions | |||||||||||||||||||||
| As of 1 Jan. 2025 |
0 | 0 | 0 | 18 | 18 | |||||||||||||||||||||
| A. Changes recognised in the income statement |
|
|
|
|
|
|
|
|
||||||||||||||||||
| Net interest and commission income |
0 | 0 | 0 | –1 | –1 | |||||||||||||||||||||
| Contracts still valid at year-end |
0 | 0 | 0 | –1 | –1 | |||||||||||||||||||||
| Net gains/losses from hedge accounting |
0 | 0 | 0 | 0 | 0 | |||||||||||||||||||||
| Contracts still valid at year-end |
0 | 0 | 0 | 0 | 0 | |||||||||||||||||||||
| Net gains/losses from other financial instruments at fair value through profit or loss |
0 | 0 | 0 | –4 | –4 | |||||||||||||||||||||
| Contracts still valid at year-end |
0 | 0 | 0 | –3 | –3 | |||||||||||||||||||||
| Total changes recognised in the income statement |
0 | 0 | 0 | –6 | –6 | |||||||||||||||||||||
| B. Changes recognised directly in equity |
|
|
|
|
|
|
|
|
|
|
||||||||||||||||
| Change in revaluation reserves |
0 | 0 | 0 | 0 | 0 | |||||||||||||||||||||
| Contracts still valid at year-end |
0 | 0 | 0 | 0 | 0 | |||||||||||||||||||||
| Changes in level assignment |
0 | 0 | 6 | 3 | 10 | |||||||||||||||||||||
| Transfer from level 1 and level 2 |
0 | 0 | 6 | 3 | 10 | |||||||||||||||||||||
| Transfer to level 1 and level 2 |
0 | 0 | 0 | 0 | 0 | |||||||||||||||||||||
| Additions |
0 | 0 | 0 | 0 | 0 | |||||||||||||||||||||
| Disposals |
0 | 0 | 0 | 0 | 0 | |||||||||||||||||||||
| Total changes recognised directly in equity |
0 | 0 | 6 | 3 | 10 | |||||||||||||||||||||
| Exchange rate changes |
0 | 0 | 0 | –1 | –1 | |||||||||||||||||||||
| Other changes | 0 | 0 | 0 | 0 | 0 | |||||||||||||||||||||
| As of 31 Dec. 2025 | 0 | 0 | 6 | 15 | 22 | |||||||||||||||||||||
The group carried out transfers from levels 1 and 2 to level 3 because in financial years 2025 and 2024 quoted prices on the active market or observable market parameters were no longer available or their effect on fair value was deemed material. In contrast, the group carried out transfers from level 3 to levels 1 and 2 if quoted prices on the active market or observable market parameters were available again or the effect of non-observable parameters on fair value was deemed immaterial.
136
KfW Financial Report 2025
Financial Report > Consolidated financial statements > Consolidated notes – Notes to financial instruments
Development of financial assets measured at fair value assigned to level 3 in financial year 2024
| Financial assets at fair value | ||||||||||||||||||||||||||||||
|
|
Loans and advances to banks – FVM |
Loans and advances to customers – FVM |
Securities and investments – FVM |
Other derivatives – FVM |
Non-current assets held for sale |
Total | ||||||||||||||||||||||||
|
|
EUR in millions |
EUR in millions |
EUR in millions |
EUR in millions |
EUR in millions |
EUR in millions |
||||||||||||||||||||||||
| As of 1 Jan. 2024 |
41 | 284 | 1,370 | 44 | 12 | 1,751 | ||||||||||||||||||||||||
| A.Changes recognised in the income statement |
|
|
|
|
|
|
|
|
|
|
||||||||||||||||||||
| Net interest and commission income |
0 | –5 | 0 | 0 | 0 | –5 | ||||||||||||||||||||||||
| Contracts still valid at year-end |
0 | –4 | 0 | 0 | 0 | –4 | ||||||||||||||||||||||||
| Net gains/losses from hedge accounting |
0 | 0 | 0 | 0 | 0 | 0 | ||||||||||||||||||||||||
| Contracts still valid at year-end |
0 | 0 | 0 | 0 | 0 | 0 | ||||||||||||||||||||||||
| Net gains/losses from other financial instruments at fair value through profit or loss |
14 | 0 | 72 | 4 | 0 | 90 | ||||||||||||||||||||||||
| Contracts still valid at year-end |
16 | 1 | –9 | –2 | 0 | 5 | ||||||||||||||||||||||||
| Total changes recognised in the income statement |
14 | –5 | 72 | 4 | 0 | 85 | ||||||||||||||||||||||||
| B. Changes recognised directly in equity |
|
|
|
|
|
|
|
|
|
|
|
|
||||||||||||||||||
| Changes in level assignment |
0 | 0 | 919 | –43 | 0 | 877 | ||||||||||||||||||||||||
| Transfer from level 1 and level 2 |
0 | 0 | 1,200 | 0 | 0 | 1,200 | ||||||||||||||||||||||||
| Transfer to level 1 and level 2 |
0 | 0 | –280 | –43 | 0 | –323 | ||||||||||||||||||||||||
| Additions |
0 | 13 | 450 | 6 | 0 | 470 | ||||||||||||||||||||||||
| Disposals |
0 | –152 | –491 | –7 | 0 | –651 | ||||||||||||||||||||||||
| Total changes recognised directly in equity |
0 | –139 | 879 | –44 | 0 | 695 | ||||||||||||||||||||||||
| Changes in consolidated group |
0 | 0 | 0 | 0 | 0 | 0 | ||||||||||||||||||||||||
| Exchange rate changes |
3 | 7 | 1 | 1 | 0 | 12 | ||||||||||||||||||||||||
| Other changes | 0 | 0 | 12 | –1 | –12 | –1 | ||||||||||||||||||||||||
| As of 31 Dec. 2024 | 58 | 147 | 2,334 | 4 | 0 | 2,542 | ||||||||||||||||||||||||
137
KfW Financial Report 2025
Financial Report > Consolidated financial statements > Consolidated notes – Notes to financial instruments
Development of financial liabilities measured at fair value assigned to level 3 in financial year 2024
| Financial liabilities at fair value | ||||||||||||||||||||||||||
|
|
Liabilities to banks – FVD |
Liabilities to customers – FVD |
Certificated liabilities – FVD |
Other derivatives – FVM |
Total | |||||||||||||||||||||
|
|
EUR in millions | EUR in millions | EUR in millions | EUR in millions | EUR in millions | |||||||||||||||||||||
| As of 1 Jan. 2024 |
0 | 0 | 0 | 23 | 23 | |||||||||||||||||||||
| A. Changes recognised in the income statement |
|
|
|
|
|
|
|
|
||||||||||||||||||
| Net interest and commission income |
0 | 0 | 0 | 3 | 3 | |||||||||||||||||||||
| Contracts still valid at year-end |
0 | 0 | 0 | 4 | 4 | |||||||||||||||||||||
| Net gains/losses from hedge accounting |
0 | 0 | 0 | 0 | 0 | |||||||||||||||||||||
| Contracts still valid at year-end |
0 | 0 | 0 | 0 | 0 | |||||||||||||||||||||
| Net gains/losses from other financial instruments at fair value through profit or loss |
0 | 0 | 0 | –6 | –6 | |||||||||||||||||||||
| Contracts still valid at year-end |
0 | 0 | 0 | 0 | 0 | |||||||||||||||||||||
| Total changes recognised in the income statement |
0 | 0 | 0 | –3 | –3 | |||||||||||||||||||||
| B. Changes recognised directly in equity |
|
|
|
|
|
|
|
|
||||||||||||||||||
| Change in revaluation reserves |
0 | 0 | 0 | 0 | 0 | |||||||||||||||||||||
| Contracts still valid at year-end |
0 | 0 | 0 | 0 | 0 | |||||||||||||||||||||
| Changes in level assignment |
0 | 0 | 0 | 0 | 0 | |||||||||||||||||||||
| Transfer from level 1 and level 2 |
0 | 0 | 0 | 0 | 0 | |||||||||||||||||||||
| Transfer to level 1 and level 2 |
0 | 0 | 0 | 0 | 0 | |||||||||||||||||||||
| Additions |
0 | 0 | 0 | 0 | 0 | |||||||||||||||||||||
| Disposals |
0 | 0 | 0 | –2 | –2 | |||||||||||||||||||||
| Total changes recognised directly in equity |
0 | 0 | 0 | –2 | –2 | |||||||||||||||||||||
| Exchange rate changes |
0 | 0 | 0 | 2 | 2 | |||||||||||||||||||||
| Other changes |
0 | 0 | 0 | –1 | –1 | |||||||||||||||||||||
| As of 31 Dec. 2024 | 0 | 0 | 0 | 18 | 18 | |||||||||||||||||||||
138
KfW Financial Report 2025
Financial Report > Consolidated financial statements > Consolidated notes – Notes to financial instruments
The following tables show how an alternative determination of relevant unobservable data, i.e., values in best and worst case scenarios, would impact fair values for significant products allocated to this level.
Information on unobservable data as of 31 December 2025
|
Major classes |
Valuation method used |
Relevant unobservable data with alternative determination |
Range | |||
| Loans and advances to banks and loans and advances to customers – FVM | Discounted cash flow method | Risk costs | +/– 10% | |||
|
|
|
|
| |||
| Securities and investments from equity finance business – FVM | Discounted cash flow method1) | Cost of capital | 0.5% to 1.5% (absolute fluctuation) | |||
| Long-term result | 5% (relative fluctuation) | |||||
| Risk costs | +/– 10% | |||||
|
|
|
|
| |||
| Other derivatives – derivatives with positive or negative fair values, which comprise a hedging instrument for customers with respect to export and project finance – FVM | Discounted cash flow method | Expected loss | +/– 30% | |||
1) If the cost of capital and the long-term result could not be used for valuation, the sensitivities were calculated on the basis of the cost of risk.
Information on unobservable data as of 31 December 2024
|
Major classes |
Valuation method used |
Relevant unobservable data with alternative determination |
Range | |||
| Loans and advances to banks and loans and advances to customers – FVM | Discounted cash flow method | Risk costs | +/– 10% | |||
|
|
|
|
| |||
| Securities and investments from equity finance business – FVM | Discounted cash flow method1) | Cost of capital | 0.5% to 1.5% (absolute fluctuation) | |||
| Long-term result | 5% (relative fluctuation) | |||||
| Risk costs | +/– 10% | |||||
|
|
|
|
| |||
| Other derivatives – derivatives with positive or negative fair values, which comprise a hedging instrument for customers with respect to export and project finance – FVM | Discounted cash flow method | Expected loss | +/– 30% | |||
|
| ||||||
1) If the cost of capital and the long-term result could not be used for valuation, the sensitivities were calculated on the basis of the cost of risk.
139
KfW Financial Report 2025
Financial Report > Consolidated financial statements > Consolidated notes – Notes to financial instruments
Sensitivity analysis for the financial assets measured at fair value assigned to level 3
as of 31 December 2025
|
|
Best case scenario |
Reported value | Worst case scenario |
|||||||||
|
|
EUR in millions | EUR in millions | EUR in millions | |||||||||
| Financial assets at fair value |
|
|
|
|
|
|
||||||
| Loans and advances to banks – FVM |
15 | 14 | 14 | |||||||||
| Loans and advances to customers – FVM |
135 | 128 | 118 | |||||||||
| Securities and investments – FVM |
2,378 | 2,136 | 1,915 | |||||||||
| Other derivatives – FVM |
2 | 2 | 2 | |||||||||
| Non-current assets held for sale |
12 | 12 | 11 | |||||||||
|
|
||||||||||||
| Total | 2,543 | 2,292 | 2,060 | |||||||||
Sensitivity analysis for the financial liabilities measured at fair value assigned to level 3
as of 31 December 2025
|
|
Best case scenario |
Reported value | Worst case scenario |
|||||||||
|
|
EUR in millions | EUR in millions | EUR in millions | |||||||||
| Financial liabilities at fair value |
|
|
|
|
|
|
||||||
| Certificated liabilities – FVD |
6 | 6 | 6 | |||||||||
| Other derivatives – FVM |
15 | 15 | 15 | |||||||||
|
|
||||||||||||
| Total | 22 | 22 | 22 | |||||||||
Sensitivity analysis for the financial assets measured at fair value assigned to level 3
as of 31 December 2024
|
|
Best case scenario |
Reported value | Worst case scenario |
|||||||||
|
|
EUR in millions | EUR in millions | EUR in millions | |||||||||
| Financial assets at fair value |
|
|
|
|
|
|
||||||
| Loans and advances to banks – FVM |
60 | 58 | 56 | |||||||||
| Loans and advances to customers – FVM |
155 | 147 | 137 | |||||||||
| Securities and investments – FVM |
2,256 | 2,334 | 2,435 | |||||||||
| Other derivatives – FVM |
4 | 4 | 4 | |||||||||
| Non-current assets held for sale |
0 | 0 | 0 | |||||||||
|
|
||||||||||||
| Total | 2,474 | 2,542 | 2,631 | |||||||||
Sensitivity analysis for the financial liabilities measured at fair value assigned to level 3
as of 31 December 2024
|
|
Best case scenario |
Reported value | Worst case scenario |
|||||||||
|
|
EUR in millions | EUR in millions | EUR in millions | |||||||||
| Financial liabilities at fair value |
|
|
|
|
|
|
||||||
| Other derivatives – FVM |
18 | 18 | 18 | |||||||||
|
|
||||||||||||
| Total | 18 | 18 | 18 | |||||||||
140
KfW Financial Report 2025
Financial Report > Consolidated financial statements > Consolidated notes – Notes to financial instruments
(58) Disclosures on micro fair value hedge accounting
Disclosures on hedged items in micro fair value hedge accounting by risk type – 2025
| Carrying amount of hedged items |
Accumulated hedged risk for the hedged item) |
Hedge fair value adjustment to be amortised |
Statement of financial position items in which the hedged items are reported |
Fair value changes in hedged items to determine hedge ineffectiveness (income statement effect – hedged items) |
||||||||||||||||
|
|
|
|
|
|
|
|
|
|
|
|
||||||||||
|
|
EUR in millions | EUR in millions | EUR in millions |
|
EUR in millions | |||||||||||||||
| Assets |
|
|
|
|
|
|
|
|
|
|
||||||||||
| Interest risk |
|
|
|
|
|
|
|
|
|
|
||||||||||
| Securities and investments – Bonds and other fixed-income securities |
28,736 | –633 | 0 | |
Financial assets at amortised cost |
|
9 | |||||||||||||
|
|
|
|
|
|
|
|
|
|
|
|
||||||||||
| Interest-currency risk |
|
|
|
|
|
|
|
|
|
|
||||||||||
| Securities and investments – Bonds and other fixed-income securities |
0 | 0 | 0 | |
Financial assets at amortised cost |
|
0 | |||||||||||||
|
|
|
|
|
|
|
|
|
|
|
|
||||||||||
| Liabilities and equity |
|
|
|
|
|
|
|
|
|
|
||||||||||
| Interest risk |
|
|
|
|
|
|
|
|
|
|
||||||||||
| Liabilities to banks/customers – promissory note loans |
7,199 | –440 | 0 | |
Financial liabilities at amortised cost |
|
–270 | |||||||||||||
|
|
|
|
|
|
|
|
|
|
|
|
||||||||||
| Certificated liabilities |
246,205 | –8,106 | 56 | |
Financial liabilities at amortised cost |
|
1,261 | |||||||||||||
|
|
|
|
|
|
|
|
|
|
|
|
||||||||||
| Interest-currency risk |
|
|
|
|
|
|
|
|
|
|
||||||||||
| Liabilities to banks/customers – promissory note loans |
0 | 0 | 0 | |
Financial liabilities at amortised cost |
|
0 | |||||||||||||
|
|
|
|
|
|
|
|
|
|
|
|
||||||||||
| Certificated liabilities |
97,921 | –10 | 286 | |
Financial liabilities at amortised cost |
|
–1,320 | |||||||||||||
141
KfW Financial Report 2025
Financial Report > Consolidated financial statements > Consolidated notes – Notes to financial instruments
Disclosures on hedged items in micro fair value hedge accounting by risk type – 2024
| Carrying amount of hedged items |
Accumulated hedged risk for the hedged item) |
Hedge fair value adjustment to be amortised |
Statement of financial position items in which the hedged items are reported |
Fair value changes in hedged items to determine hedge ineffectiveness (income statement effect – hedged items) |
||||||||||||||||
|
|
|
|
|
|
|
|
|
|
|
|
||||||||||
|
|
EUR in millions | EUR in millions | EUR in millions |
|
EUR in millions | |||||||||||||||
| Assets |
|
|
|
|
|
|
|
|
|
|
||||||||||
| Interest risk |
|
|
|
|
|
|
|
|
|
|
||||||||||
| Securities and investments – Bonds and other fixed-income securities |
29,301 | –642 | 0 | |
Financial assets at amortised cost |
|
655 | |||||||||||||
|
|
|
|
|
|
|
|
|
|
|
|
||||||||||
| Interest-currency risk |
|
|
|
|
|
|
|
|
|
|
||||||||||
| Securities and investments – Bonds and other fixed-income securities |
0 | 0 | 0 | |
Financial assets at amortised cost |
|
0 | |||||||||||||
|
|
|
|
|
|
|
|
|
|
|
|
||||||||||
| Liabilities and equity |
|
|
|
|
|
|
|
|
|
|
||||||||||
| Interest risk |
|
|
|
|
|
|
|
|
|
|
||||||||||
| Liabilities to banks/customers – promissory note loans |
19,419 | –710 | 0 | |
Financial liabilities at amortised cost |
|
–605 | |||||||||||||
|
|
|
|
|
|
|
|
|
|
|
|
||||||||||
| Certificated liabilities |
246,255 | –6,842 | 90 | |
Financial liabilities at amortised cost |
|
–5,173 | |||||||||||||
|
|
|
|
|
|
|
|
|
|
|
|
||||||||||
| Interest-currency risk |
|
|
|
|
|
|
|
|
|
|
||||||||||
| Liabilities to banks/customers – promissory note loans |
0 | 0 | 0 | |
Financial liabilities at amortised cost |
|
0 | |||||||||||||
|
|
|
|
|
|
|
|
|
|
|
|
||||||||||
| Certificated liabilities |
113,898 | –1,329 | 221 | |
Financial liabilities at amortised cost |
|
–788 | |||||||||||||
142
KfW Financial Report 2025
Financial Report > Consolidated financial statements > Consolidated notes – Notes to financial instruments
Disclosures on hedging instruments in micro fair value hedge accounting by risk type – 2025
| Par value instruments |
Carrying amount of hedging instruments |
Statement of financial position items in which the hedging instruments are reported |
Fair value changes in hedging instruments) |
Average interest rate of hedging instruments1) |
||||||||||||||||
|
|
|
|
|
|
|
|
|
|
|
|
||||||||||
|
|
EUR in millions |
EUR in millions |
|
EUR in millions |
% | |||||||||||||||
| Assets |
|
|
|
|
|
|
|
|
|
|
||||||||||
| Interest risk |
|
|
|
|
|
|
|
|
|
|
||||||||||
| Interest-related transactions: interest rate swap |
108,176 | 779 | |
Derivatives designated for hedge accounting |
|
–5 | –0.3 | |||||||||||||
|
|
|
|
|
|
|
|
|
|
|
|
||||||||||
| Interest-currency risk |
|
|
|
|
|
|
|
|
|
|
||||||||||
| Cross-currency transactions: cross-currency interest rate swap |
46,083 | 560 | |
Derivatives designated for hedge accounting |
|
0 | |
2.12) |
| |||||||||||
|
|
|
|
|
|
|
|
|
|
|
|
||||||||||
| Liabilities and equity |
|
|
|
|
|
|
|
|
|
|
||||||||||
| Interest risk |
|
|
|
|
|
|
|
|
|
|
||||||||||
| Interest-related transactions: interest rate swap |
181,820 | 2,381 | |
Derivatives designated for hedge accounting |
|
–1,002 | –1.1 | |||||||||||||
|
|
|
|
|
|
|
|
|
|
|
|
||||||||||
| Interest-currency risk |
|
|
|
|
|
|
|
|
|
|
||||||||||
| Cross-currency transactions: cross-currency interest rate swap |
103,584 | 5,091 | |
Derivatives designated for hedge accounting |
|
1,348 | |
1.62) |
| |||||||||||
| 1) | Average interest rate based on the coupon of the fixed leg of the derivatives weighted with nominal volume |
| 2) | Cross-currency interest rate swaps are primarily used to hedge interest risks, but also to hedge foreign currency risks. The difference between the average interest rate of the interest rate swaps and the cross-currency interest rate swaps results from the different interest rate of the hedged currencies, among other factors. |
Disclosures on hedging instruments in micro fair value hedge accounting by risk type – 2024
| Par value instruments |
Carrying amount of hedging instruments |
Statement of financial position items in which the hedging instruments are reported |
Fair value changes in hedging instruments) |
Average interest rate of hedging instruments1) |
||||||||||||||||
|
|
|
|
|
|
|
|
|
|
|
|
||||||||||
|
|
EUR in millions |
EUR in millions |
|
EUR in millions |
% | |||||||||||||||
| Assets |
|
|
|
|
|
|
|
|
|
|
||||||||||
| Interest risk |
|
|
|
|
|
|
|
|
|
|
||||||||||
| Interest-related transactions: interest rate swap |
99,353 | 656 | |
Derivatives designated for hedge accounting |
|
–652 | –1.2 | |||||||||||||
|
|
|
|
|
|
|
|
|
|
|
|
||||||||||
| Interest-currency risk |
|
|
|
|
|
|
|
|
|
|
||||||||||
| Cross-currency transactions: cross-currency interest rate swap |
105,672 | 5,916 | |
Derivatives designated for hedge accounting |
|
0 | 1.92) | |||||||||||||
|
|
|
|
|
|
|
|
|
|
|
|
||||||||||
| Liabilities and equity |
|
|
|
|
|
|
|
|
|
|
||||||||||
| Interest risk |
|
|
|
|
|
|
|
|
|
|
||||||||||
| Interest-related transactions: interest rate swap |
202,989 | 3,705 | |
Derivatives designated for hedge accounting |
|
5,761 | –2.3 | |||||||||||||
|
|
|
|
|
|
|
|
|
|
|
|
||||||||||
| Interest-currency risk |
|
|
|
|
|
|
|
|
|
|
||||||||||
| Cross-currency transactions: cross-currency interest rate swap |
76,683 | 1,914 | |
Derivatives designated for hedge accounting |
|
749 | |
–0.42) |
| |||||||||||
| 1) | Average interest rate based on the coupon of the fixed leg of the derivatives weighted with nominal volume |
| 2) | Cross-currency interest rate swaps are primarily used to hedge interest risks, but also to hedge foreign currency risks. The difference between the average interest rate of the interest rate swaps and the cross-currency interest rate swaps results from the different interest rate of the hedged currencies, among other factors. |
143
KfW Financial Report 2025
Financial Report > Consolidated financial statements > Consolidated notes – Notes to financial instruments
Analysis of par values of hedging instruments by hedge relationship
according to remaining terms as of 31 December 2025
| In up to | Between | Between | Between 1 year | In more than | ||||||||||||||||||
| 1 month | 1 and 3 months | 3 months | and 5 years | 5 years | ||||||||||||||||||
| Due |
|
|
and 1 year |
|
|
|||||||||||||||||
|
|
EUR in millions | EUR in millions | EUR in millions | EUR in millions | EUR in millions | |||||||||||||||||
| Assets |
|
|
|
|
|
|
|
|
|
|
||||||||||||
| Interest risk |
|
|
|
|
|
|
|
|
|
|
||||||||||||
| Interest-related transactions: interest rate swap |
586 | 2,398 | 8,143 | 67,165 | 29,883 | |||||||||||||||||
| Interest-currency risk |
|
|
|
|
|
|
|
|
|
|
||||||||||||
| Cross-currency transactions: cross-currency interest rate swap |
2,979 | 4,232 | 7,095 | 27,148 | 4,630 | |||||||||||||||||
| Liabilities and equity |
|
|
|
|
|
|
|
|
|
|
||||||||||||
| Interest risk |
|
|
|
|
|
|
|
|
|
|
||||||||||||
| Interest-related transactions: interest rate swap |
1,457 | 861 | 11,846 | 101,598 | 66,059 | |||||||||||||||||
| Interest-currency risk |
|
|
|
|
|
|
|
|
|
|
||||||||||||
| Cross-currency transactions: cross-currency interest rate swap |
3,330 | 2,828 | 25,117 | 59,810 | 12,498 | |||||||||||||||||
Analysis of par values of hedging instruments by hedge relationship
according to remaining terms as of 31 December 2024
| In up to | Between | Between | Between 1 year | In more than | ||||||||||||||||||
| 1 month | 1 and 3 months | 3 months | and 5 years | 5 years | ||||||||||||||||||
| Due |
|
|
and 1 year |
|
|
|||||||||||||||||
|
|
EUR in millions | EUR in millions | EUR in millions | EUR in millions | EUR in millions | |||||||||||||||||
| Assets |
|
|
|
|
|
|
|
|
|
|
||||||||||||
| Interest risk |
|
|
|
|
|
|
|
|
|
|
||||||||||||
| Interest-related transactions: interest rate swap |
616 | 3,788 | 6,915 | 49,387 | 38,646 | |||||||||||||||||
| Interest-currency risk |
|
|
|
|
|
|
|
|
|
|
||||||||||||
| Cross-currency transactions: cross-currency interest rate swap |
50 | 3,765 | 22,542 | 63,221 | 16,094 | |||||||||||||||||
| Liabilities and equity |
|
|
|
|
|
|
|
|
|
|
||||||||||||
| Interest risk |
|
|
|
|
|
|
|
|
|
|
||||||||||||
| Interest-related transactions: interest rate swap |
790 | 11,516 | 29,453 | 100,947 | 60,283 | |||||||||||||||||
| Interest-currency risk |
|
|
|
|
|
|
|
|
|
|
||||||||||||
| Cross-currency transactions: cross-currency interest rate swap |
60 | 6,204 | 12,251 | 47,582 | 10,587 | |||||||||||||||||
144
KfW Financial Report 2025
Financial Report > Consolidated financial statements > Consolidated notes – Notes to financial instruments
(59) Disclosures on macro fair value hedge accounting
Disclosures on hedged items in macro fair value hedge accounting by risk type – 2025
| Statement of financial position items in which the hedged items are reported |
||||||||||||||||||||||||||||
| Carrying | Value | Value adjustment | Carrying | Value adjust- | Fair value changes | |||||||||||||||||||||||
| amount of | adjustment | from macro fair | amount before | ment from | in hedged items to | |||||||||||||||||||||||
| hedged | from macro | value hedge | value adjust- | macro fair | determine hedge | |||||||||||||||||||||||
| items | fair value | accounting to be | ment from | value hedge | ineffectiveness | |||||||||||||||||||||||
| hedge | amortised | macro fair | accounting | (income statement | ||||||||||||||||||||||||
| accounting | (discontinued | value hedge | effect – hedged | |||||||||||||||||||||||||
| hedge | accounting | items) | ||||||||||||||||||||||||||
|
|
|
|
relationships) |
|
|
|
||||||||||||||||||||||
| EUR in | EUR in | EUR in | EUR in | |||||||||||||||||||||||||
|
|
millions | millions | millions |
|
|
millions | ||||||||||||||||||||||
| Interest risk |
|
|
|
|
|
|
|
|
|
|
|
|
||||||||||||||||
| Assets |
Financial assets | |
Value adjustment from macro fair value |
|
||||||||||||||||||||||||
|
|
261,399 | –10,444 | –5 | at amortised cost | hedge accounting | –1,079 | ||||||||||||||||||||||
| Liabilities and equity |
Financial liabilities | |
Value adjustment from macro fair value |
|
||||||||||||||||||||||||
| 0 | –16 | –16 | at amortised cost | hedge accounting | –1 | |||||||||||||||||||||||
Disclosures on hedged items in macro fair value hedge accounting by risk type – 2024
| Statement of financial
position items in which the hedged items are reported |
||||||||||||||||||||||||||||
| Carrying | Value | Value adjustment | Carrying | Value adjust- | Fair value changes | |||||||||||||||||||||||
| amount of | adjustment | from macro fair | amount before | ment from | in hedged items to | |||||||||||||||||||||||
| hedged | from macro | value hedge | value adjust- | macro fair | determine hedge | |||||||||||||||||||||||
| items | fair value | accounting to be | ment from | value hedge | ineffectiveness | |||||||||||||||||||||||
| hedge | amortised | macro fair | accounting | (income statement | ||||||||||||||||||||||||
| accounting | (discontinued | value hedge | effect – hedged | |||||||||||||||||||||||||
| hedge | accounting | items) | ||||||||||||||||||||||||||
|
|
|
|
relationships) |
|
|
|
||||||||||||||||||||||
| EUR in | EUR in | EUR in | EUR in | |||||||||||||||||||||||||
|
|
millions | millions | millions |
|
|
millions | ||||||||||||||||||||||
| Interest risk |
|
|
|
|
|
|
|
|
|
|
|
|
||||||||||||||||
| Assets |
Financial assets | |
Value adjustment from macro fair value |
|
||||||||||||||||||||||||
|
|
265,340 | –9,375 | 4 | at amortised cost | hedge accounting | 5,431 | ||||||||||||||||||||||
| Liabilities and equity |
Financial liabilities | |
Value adjustment from macro fair value |
|
||||||||||||||||||||||||
| 0 | –16 | –16 | at amortised cost | hedge accounting | 15 | |||||||||||||||||||||||
145
KfW Financial Report 2025
Financial Report > Consolidated financial statements > Consolidated notes – Notes to financial instruments
Disclosures on hedging instruments in macro fair value hedge accounting by risk type – 2025
| Par value of | Carrying | Statement of | Fair value changes in | |||||||||||||||||
| hedging | amount of | financial | hedging instruments | |||||||||||||||||
| instruments | hedging | position items | to determine hedge | |||||||||||||||||
| instruments | in which the | ineffectiveness | ||||||||||||||||||
| hedging | (income statement | |||||||||||||||||||
| instruments are | effect – hedging | |||||||||||||||||||
| reported | instruments) | |||||||||||||||||||
|
|
|
|
|
|
||||||||||||||||
|
|
EUR in millions | EUR in millions |
|
EUR in millions | ||||||||||||||||
| Assets |
|
|
|
|
|
|
|
|
||||||||||||
| Interest risk |
|
|
|
|
|
|
|
|
||||||||||||
| Interest-related transactions: |
Derivatives | |||||||||||||||||||
| interest rate swap |
designated for | |||||||||||||||||||
|
|
184,386 | 692 | hedge accounting | –146 | ||||||||||||||||
| Liabilities and equity |
|
|
|
|
|
|
|
|
||||||||||||
| Interest risk |
|
|
|
|
|
|
|
|
||||||||||||
| Interest-related transactions: |
Derivatives | |||||||||||||||||||
| interest rate swap |
designated for | |||||||||||||||||||
| 62,220 | 714 | hedge accounting | 1,076 | |||||||||||||||||
Disclosures on hedging instruments in macro fair value hedge accounting by risk type – 2024
| Par value of | Carrying | Statement of | Fair value changes in | |||||||||||||||||
| hedging | amount of | financial | hedging instruments | |||||||||||||||||
| instruments | hedging | position items | to determine hedge | |||||||||||||||||
| instruments | in which the | ineffectiveness | ||||||||||||||||||
| hedging | (income statement | |||||||||||||||||||
| instruments are | effect – hedging | |||||||||||||||||||
| reported | instruments) | |||||||||||||||||||
|
|
|
|
|
|
||||||||||||||||
|
|
EUR in millions | EUR in millions |
|
EUR in millions | ||||||||||||||||
| Assets |
|
|
|
|
|
|
|
|
||||||||||||
| Interest risk |
|
|
|
|
|
|
|
|
||||||||||||
| Interest-related transactions: |
Derivatives | |||||||||||||||||||
| interest rate swap |
designated for | |||||||||||||||||||
|
|
180,701 | 873 | hedge accounting | –4,610 | ||||||||||||||||
| Liabilities and equity |
|
|
|
|
|
|
|
|
||||||||||||
| Interest risk |
|
|
|
|
|
|
|
|
||||||||||||
| Interest-related transactions: |
Derivatives | |||||||||||||||||||
| interest rate swap |
designated for | |||||||||||||||||||
| 69,494 | 1,362 | hedge accounting | –677 | |||||||||||||||||
146
KfW Financial Report 2025
Financial Report > Consolidated financial statements > Consolidated notes – Notes to financial instruments
Analysis of par values of hedging instruments by remaining terms as of 31 December 2025
| In up to | Between | Between | Between | In more than | ||||||||||||||||||||
| 1 month | 1 and 3 months | 3 months | 1 year and | 5 years | ||||||||||||||||||||
| Due |
|
|
and 1 year | 5 years |
|
|||||||||||||||||||
|
|
EUR in millions | EUR in millions | EUR in millions | EUR in millions | EUR in millions | |||||||||||||||||||
| Assets |
|
|
|
|
|
|
|
|
|
|
||||||||||||||
| Interest risk |
|
|
|
|
|
|
|
|
|
|
||||||||||||||
| Interest-related transactions: |
||||||||||||||||||||||||
| interest rate swap |
1,151 | 1,593 | 21,473 | 79,947 | 80,223 | |||||||||||||||||||
| Liabilities and equity |
|
|
|
|
|
|
|
|
|
|
||||||||||||||
| Interest risk |
|
|
|
|
|
|
|
|
|
|
||||||||||||||
| Interest-related transactions: |
||||||||||||||||||||||||
| interest rate swap |
493 | 1,486 | 6,843 | 26,509 | 26,890 | |||||||||||||||||||
Analysis of par values of hedging instruments by remaining terms as of 31 December 2024
| In up to | Between | Between | Between | In more than | ||||||||||||||||||||
| 1 month | 1 and 3 months | 3 months | 1 year and | 5 years | ||||||||||||||||||||
| Due |
|
|
and 1 year | 5 years |
|
|||||||||||||||||||
|
|
EUR in millions | EUR in millions | EUR in millions | EUR in millions | EUR in millions | |||||||||||||||||||
| Assets |
|
|
|
|
|
|
|
|
|
|
||||||||||||||
| Interest risk |
|
|
|
|
|
|
|
|
|
|
||||||||||||||
| Interest-related transactions: |
||||||||||||||||||||||||
| interest rate swap |
1,296 | 1,796 | 23,358 | 82,880 | 71,371 | |||||||||||||||||||
| Liabilities and equity |
|
|
|
|
|
|
|
|
|
|
||||||||||||||
| Interest risk |
|
|
|
|
|
|
|
|
|
|
||||||||||||||
| Interest-related transactions: |
||||||||||||||||||||||||
| interest rate swap |
325 | 1,057 | 6,100 | 22,090 | 39,922 | |||||||||||||||||||
147
KfW Financial Report 2025
Financial Report > Consolidated financial statements > Consolidated notes – Notes to financial instruments
(60) Additional disclosures on derivatives
Analysis of derivatives by type of hedge
|
|
Notional amount | Fair value 31 Dec. 2025 |
Fair value 31 Dec. 2024 | |||||||||||||||||||||||||||||||||||||||||||||||
|
|
31 Dec. 2025 | 31 Dec. 2024 | positive | negative | positive | negative | ||||||||||||||||||||||||||||||||||||||||||||
|
|
EUR in millions | EUR in millions | EUR in millions | EUR in millions | EUR in millions | EUR in millions | ||||||||||||||||||||||||||||||||||||||||||||
| Interest-related derivatives |
644,511 | 675,658 | 2,535 | 4,631 | 2,807 | 6,559 | ||||||||||||||||||||||||||||||||||||||||||||
| Cross-currency derivatives |
150,768 | 150,258 | 1,161 | 5,937 | 6,854 | 2,710 | ||||||||||||||||||||||||||||||||||||||||||||
| Credit derivatives | 0 | 0 | 0 | 0 | 0 | 0 | ||||||||||||||||||||||||||||||||||||||||||||
| Total | 795,278 | 825,916 | 3,696 | 10,568 | 9,661 | 9,269 | ||||||||||||||||||||||||||||||||||||||||||||
Cross-currency swaps are presented under Cross-currency derivatives.
Analysis of derivatives by counterparty
|
|
Notional amount | Fair value 31 Dec. 2025 |
Fair value 31 Dec. 2024 |
|||||||||||||||||||||||||||||||||||||||||||||||||
|
|
31 Dec. 2025 | 31 Dec. 2024 | positive | negative | positive | negative | ||||||||||||||||||||||||||||||||||||||||||||||
|
|
EUR in millions | EUR in millions | EUR in millions | EUR in millions | EUR in millions | EUR in millions | ||||||||||||||||||||||||||||||||||||||||||||||
| OECD banks |
774,875 | 775,691 | 3,550 | 9,512 | 8,692 | 7,303 | ||||||||||||||||||||||||||||||||||||||||||||||
| Non-OECD banks |
146 | 176 | 1 | 5 | 5 | 5 | ||||||||||||||||||||||||||||||||||||||||||||||
| Other counterparties |
20,083 | 49,890 | 145 | 1,027 | 963 | 1,945 | ||||||||||||||||||||||||||||||||||||||||||||||
| Public sector | 174 | 159 | 0 | 24 | 1 | 17 | ||||||||||||||||||||||||||||||||||||||||||||||
| Total | 795,278 | 825,916 | 3,696 | 10,568 | 9,661 | 9,269 | ||||||||||||||||||||||||||||||||||||||||||||||
The analysis includes financial and credit derivatives which are presented in derivatives designated for hedge accounting and the sub-item other derivatives under Financial assets at fair value or Financial liabilities at fair value. Embedded derivatives that must be bifurcated are not included.
The economic hedge effect of financial derivatives with an aggregate principal amount of EUR 698.0 billion (31 Dec. 2024: EUR 747.4 billion) is reflected in the accounts; it was not possible to reflect the risk-mitigating impact of the remaining financial derivatives in the accounts (hedge accounting).
Unchanged from 31 December 2024, KfW Group did not pledge any collateral (in the form of securities) under derivative transactions that can be resold or repledged at any time without payments being past due.
However, liquid collateral totalling EUR 6,633 million (31 Dec. 2024: EUR 2,469 million) was provided, which is recognised under Financial assets at amortised cost – Loans and advances to banks or customers.
Unchanged from 31 December 2024, KfW Group did not receive any collateral (in the form of securities) under derivative transactions that can be resold or repledged at any time without payments by the protection seller being past due.
However, liquid collateral totalling EUR 249 million (31 Dec. 2024: EUR 3,339 million) was accepted, which was reported under Financial liabilities at amortised cost – Liabilities to banks or Liabilities to customers.
148
KfW Financial Report 2025
Financial Report > Consolidated financial statements > Consolidated notes – Notes to financial instruments
The volume of initial differences between the transaction price and model value arising from the use of a valuation technique that makes significant use of unobservable data which have yet to be amortised over the life of the financial instrument developed as follows during the reporting period:
Day one profit or loss
|
|
2025 |
2024 | ||||||||
|
|
EUR in millions | EUR in millions | ||||||||
| As of 1 Jan. |
–108 | –112 | ||||||||
| Addition |
–23 | –9 | ||||||||
| Reversal |
17 | 15 | ||||||||
| Exchange rate changes | 6 | –2 | ||||||||
| As of 31 Dec. | –108 | –108 | ||||||||
Net gains/losses from financial derivatives not qualifying for hedge accounting include amortisation effects in the amount of EUR 11 million (2024: EUR 11 million).
(61) Additional disclosures on financial liabilities at fair value
Disclosures on financial liabilities at fair value as of 31 December 2025
| Financial liabilities at fair value |
||||||||||||||||||||
| Liabilities | Liabilities | Certificated | Total | |||||||||||||||||
|
|
to banks | to customers | liabilities |
|
||||||||||||||||
|
|
EUR in millions | EUR in millions | EUR in millions | EUR in millions |
||||||||||||||||
| Carrying amount |
268 | 590 | 6,062 | 6,921 |
||||||||||||||||
| Repayment amount at maturity | 285 | 821 | 8,078 | 9,184 | ||||||||||||||||
| Difference |
17 | 230 | 2,015 | 2,263 |
||||||||||||||||
| thereof borrowings for which the repayment amount builds up as a result of the capitalisation over time of interest due |
1 | 228 | 2,172 | 2,401 | ||||||||||||||||
Disclosures on financial liabilities at fair value as of 31 December 2024
| Financial liabilities at fair value |
||||||||||||||||||||
| Liabilities | Liabilities | Certificated | Total | |||||||||||||||||
|
|
to banks | to customers | liabilities |
|
||||||||||||||||
|
|
EUR in millions | EUR in millions | EUR in millions | EUR in millions |
||||||||||||||||
| Carrying amount |
225 | 719 | 6,537 | 7,481 |
||||||||||||||||
| Repayment amount at maturity | 245 | 994 | 9,120 | 10,359 | ||||||||||||||||
| Difference |
20 | 275 | 2,583 | 2,879 |
||||||||||||||||
| thereof borrowings for which the repayment amount builds up as a result of the capitalisation over time of interest due |
0 | 273 | 2,739 | 3,012 | ||||||||||||||||
149
KfW Financial Report 2025
Financial Report > Consolidated financial statements > Consolidated notes – Notes to financial instruments
(62) Contractual payment obligations arising from financial instruments
Analysis of payment obligations by maturity range as of 31 December 20251)
| Up to | More than | More than | More than | More than |
Total |
|||||||||||||||||||||||||
| 1 month | 1 and up to | 3 months | 1 and up to | 5 years | ||||||||||||||||||||||||||
| 3 months | and up to | 5 years | ||||||||||||||||||||||||||||
|
|
|
|
1 year |
|
|
|
||||||||||||||||||||||||
|
|
EUR in millions |
EUR in millions |
EUR in millions |
EUR in millions |
EUR in millions |
EUR in millions |
||||||||||||||||||||||||
| Financial liabilities at amortised cost |
|
|
|
|
|
|
|
|
|
|
||||||||||||||||||||
| Liabilities to banks |
844 | 6 | 850 | 644 | 454 | 2,798 | ||||||||||||||||||||||||
| Liabilities to customers |
3,664 | 1,131 | 5,848 | 9,130 | 3,722 | 23,496 | ||||||||||||||||||||||||
| Certificated liabilities |
19,799 | 44,823 | 63,790 | 250,677 | 116,313 | 495,402 | ||||||||||||||||||||||||
| Financial liabilities at fair value |
|
|
|
|
|
|
|
|
|
|
||||||||||||||||||||
| Liabilities to banks |
0 | 0 | 41 | 249 | 0 | 290 | ||||||||||||||||||||||||
| Liabilities to customers |
0 | 1 | 1 | 280 | 575 | 857 | ||||||||||||||||||||||||
| Certificated liabilities |
12 | 8 | 313 | 3,499 | 5,570 | 9,402 | ||||||||||||||||||||||||
| Net obligations arising from derivative financial instruments |
–42 | –179 | 570 | 1,138 | 1,183 | 2,670 | ||||||||||||||||||||||||
| thereof gross obligations arising from derivative financial instruments |
21,008 | 32,431 | 33,263 | 81,979 | 24,418 | 193,099 | ||||||||||||||||||||||||
| Obligations arising from on-balance sheet financial instruments |
24,279 | 45,791 | 71,412 | 265,616 | 127,817 | 534,915 | ||||||||||||||||||||||||
| Obligations arising from off-balance sheet transactions |
143,189 | 0 | 0 | 0 | 0 | 143,189 | ||||||||||||||||||||||||
| Total | 167,468 | 45,791 | 71,412 | 265,616 | 127,817 | 678,104 | ||||||||||||||||||||||||
| 1) | Net obligations arising from derivative financial instruments comprise payment obligations which are offset against the corresponding payment claims from derivative contracts; gross obligations are reported as obligations arising from derivative financial instruments. Off-balance sheet transactions are generally allocated to the first maturity range. |
Analysis of payment obligations by maturity range as of 31 December 20241)
| Up to | More than | More than | More than | More than |
Total |
|||||||||||||||||||||||||||
| 1 month | 1 and up to | 3 months | 1 and up to | 5 years | ||||||||||||||||||||||||||||
| 3 months | and up to | 5 years | ||||||||||||||||||||||||||||||
|
|
|
|
1 year |
|
|
|
||||||||||||||||||||||||||
|
|
EUR in millions |
EUR in millions |
EUR in millions |
EUR in millions |
EUR in millions |
EUR in millions |
||||||||||||||||||||||||||
| Financial liabilities at amortised cost |
|
|
|
|
|
|
|
|
|
|
||||||||||||||||||||||
| Liabilities to banks |
4,397 | 19 | 1,055 | 896 | 312 | 6,679 | ||||||||||||||||||||||||||
| Liabilities to customers |
4,255 | 2,524 | 12,008 | 6,366 | 6,630 | 31,782 | ||||||||||||||||||||||||||
| Certificated liabilities |
25,854 | 29,860 | 59,643 | 249,993 | 124,296 | 489,646 | ||||||||||||||||||||||||||
| Financial liabilities at fair value |
|
|
|
|
|
|
|
|
|
|
||||||||||||||||||||||
| Liabilities to banks |
0 | 0 | 1 | 250 | 0 | 251 | ||||||||||||||||||||||||||
| Liabilities to customers |
0 | 1 | 3 | 327 | 733 | 1,064 | ||||||||||||||||||||||||||
| Certificated liabilities |
16 | 40 | 214 | 3,789 | 6,805 | 10,865 | ||||||||||||||||||||||||||
| Net obligations arising from derivative financial instruments |
–216 | –25 | –945 | –3,464 | 1,257 | –3,392 | ||||||||||||||||||||||||||
| thereof gross obligations arising from derivative financial instruments |
16,995 | 16,073 | 32,268 | 97,221 | 32,759 | 195,316 | ||||||||||||||||||||||||||
| Obligations arising from on-balance sheet financial instruments |
34,306 | 32,419 | 71,980 | 258,156 | 140,033 | 536,894 | ||||||||||||||||||||||||||
| Obligations arising from off-balance sheet transactions | 145,116 | 0 | 0 | 0 | 0 | 145,116 | ||||||||||||||||||||||||||
| Total | 179,422 | 32,419 | 71,980 | 258,156 | 140,033 | 682,010 | ||||||||||||||||||||||||||
| 1) | Net obligations arising from derivative financial instruments comprise payment obligations which are offset against the corresponding payment claims from derivative contracts; gross obligations are reported as obligations arising from derivative financial instruments. Off-balance sheet transactions are generally allocated to the first maturity range. |
150
KfW Financial Report 2025
Financial Report > Consolidated financial statements > Consolidated notes – Notes to financial instruments
The maturity analysis of lease liabilities as lessee is reported under Other notes (in the “Leasing transactions as lessee” section).
(63) Disclosures on repurchase agreements
Disclosures on repo transactions
|
|
31 Dec. 2025 | 31 Dec. 2024 | ||||||||
|
|
EUR in millions | EUR in millions | ||||||||
| Carrying amount of securities sold under repo transactions that continue to be recognised in Financial assets at amortised cost – Securities and investments |
98 | 313 | ||||||||
| Financial liabilities at amortised cost – Liabilities to banks (countervalue) | 98 | 311 | ||||||||
The fair value of interest-bearing securities sold under repo transactions that continue to be recognised in Financial assets at amortised cost totalled EUR 98 million (31 Dec. 2024: EUR 311 million). The fair value of the corresponding repayment obligations was EUR 98 million (31 Dec. 2024: EUR 311 million).
Moreover, as in 2024, KfW Group did not pledge any collateral (in the form of securities) under repo transactions that can be resold or repledged at any time without payments being past due.
As in 2024, the group did not receive any collateral (in the form of securities) under repo transactions that can be resold or repledged at any time without payments being past due.
As in 2024, the group neither pledged nor accepted any liquid collateral.
Disclosures on reverse repo transactions
|
|
31 Dec. 2025 |
31 Dec. 2024 | ||||||||
|
|
EUR in millions | EUR in millions | ||||||||
| Financial assets at amortised cost – Loans and advances to banks (countervalue) |
23,282 | 9,630 | ||||||||
| Financial assets at amortised cost – Loans and advances to customers (countervalue) | 0 | 0 | ||||||||
| Total | 23,282 | 9,630 | ||||||||
The fair value of interest-bearing securities purchased under reverse repos that are not recognised amounted to EUR 23,229 million (31 Dec. 2024: EUR 9,600 million).
Moreover, KfW Group did not receive any collateral (in the form of securities) under reverse repo transactions that can be resold or repledged at any time without payments by the protection seller being past due, unchanged from 31 December 2024.
As in 2024, the group did not pledge any collateral (in the form of securities) under reverse repo transactions that can be resold or repledged at any time without payments being past due.
As in 2024, the group neither pledged nor accepted any liquid collateral.
151
KfW Financial Report 2025
Financial Report > Consolidated financial statements > Consolidated notes – Notes to financial instruments
(64) Disclosures on offsetting financial instruments
Disclosures on financial assets with netting agreements as of 31 December 2025
| Carrying amount | Netted figure as | Reported | Carrying | Fair value | Total net | |||||||||||||||||||
| of financial | carrying amount | financial | amount of | of collateral | amount | |||||||||||||||||||
| assets before | of financial | assets | non-offsettable | received | ||||||||||||||||||||
| offsetting | liabilities | (net amount) | financial | |||||||||||||||||||||
|
|
(gross amount) |
(gross amount) |
|
liabilities |
|
|
||||||||||||||||||
|
|
EUR in millions |
EUR in millions | EUR in millions | EUR in millions | EUR in millions | EUR in millions | ||||||||||||||||||
| OTC derivatives |
17,791 |
14.1401) | 3,652 | 3,384 | 234 | 33 | ||||||||||||||||||
| Reverse repos | 23,282 | 0 | 23,282 | 78 | 23,203 | 0 | ||||||||||||||||||
|
|
||||||||||||||||||||||||
| Total | 41,073 | 14,140 | 26,933 | 3,462 | 23,438 | 33 | ||||||||||||||||||
| 1) | Thereof obligations from cash collateral for OTC derivatives with EUREX as the central counterparty in the amount of EUR 3,971 million. |
Disclosures on financial liabilities with netting agreements as of 31 December 2025
| Carrying amount | Netted figure as | Reported | Carrying | Fair value | Total net | |||||||||||||||||||
| of financial | carrying amount | financial | amount of | of collateral | amount | |||||||||||||||||||
| liabilities before | of financial | liabilities | non-offsettable | pledged | ||||||||||||||||||||
| offsetting | assets | (net amount) | financial assets | |||||||||||||||||||||
|
|
(gross amount) |
(gross amount) |
|
|
|
|
||||||||||||||||||
|
|
EUR in millions |
EUR in millions | EUR in millions | EUR in millions | EUR in millions | EUR in millions | ||||||||||||||||||
| OTC derivatives |
19,996 |
10,168 | 9,827 | 3,384 | 6,394 | 50 | ||||||||||||||||||
| Repos | 98 | 0 | 98 | 78 | 19 | 0 | ||||||||||||||||||
|
|
||||||||||||||||||||||||
| Total | 20,093 | 10,168 | 9,925 | 3,462 | 6,413 | 50 | ||||||||||||||||||
The disclosures on financial instruments with netting agreements only include gross and net amounts for financial assets and financial liabilities with netting agreements. The Notes on the two classes Derivatives designated for hedge accounting and Other derivatives also include financial assets with a carrying amount of EUR 194 million (31 Dec. 2024: EUR 192 million) and financial liabilities with a carrying amount of EUR 742 million (31 Dec. 2024: EUR 848 million), in particular from bifurcated embedded derivatives and derivatives not subject to netting agreements.
Receivables from reverse repo transactions are reported under Financial assets at amortised cost – Loans and advances to banks and Loans and advances to customers.
152
KfW Financial Report 2025
Financial Report > Consolidated financial statements > Consolidated notes – Notes to financial instruments
Disclosures on financial assets with netting agreements as of 31 December 2024
| Carrying amount | Netted figure as | Reported | Carrying | Fair value | Total net | |||||||||||||||||||
| of financial | carrying amount | financial | amount of | of collateral | amount | |||||||||||||||||||
| assets before | of financial | assets | non-offsettable | received | ||||||||||||||||||||
| offsetting | liabilities | (net amount) | financial | |||||||||||||||||||||
|
|
(gross amount) |
(gross amount) |
|
liabilities |
|
|
||||||||||||||||||
|
|
EUR in millions |
EUR in millions | EUR in millions | EUR in millions | EUR in millions | EUR in millions | ||||||||||||||||||
| OTC derivatives |
25,636 |
16,0801) | 9,556 | 6,066 | 3,318 | 172 | ||||||||||||||||||
| Reverse repos | 9,630 | 0 | 9,630 | 272 | 9,358 | 0 | ||||||||||||||||||
|
|
||||||||||||||||||||||||
| Total | 35,266 | 16,080 | 19,186 | 6,338 | 12,676 | 172 | ||||||||||||||||||
| 1) | Thereof obligations from cash collateral for OTC derivatives with EUREX as the central counterparty in the amount of EUR 4,425 million |
Disclosures on financial liabilities with netting agreements as of 31 December 2024
| Carrying amount | Netted figure as | Reported | Carrying | Fair value | Total net | |||||||||||||||||||||
| of financial | carrying amount | financial | amount of | of collateral | amount | |||||||||||||||||||||
| liabilities before | of financial | liabilities | non offsettable | pledged | ||||||||||||||||||||||
| offsetting | assets | (net amount) | financial assets | |||||||||||||||||||||||
|
|
(gross amount) |
(gross amount) |
|
|
|
|
||||||||||||||||||||
|
|
EUR in millions |
EUR in millions | EUR in millions | EUR in millions | EUR in millions | EUR in millions | ||||||||||||||||||||
| OTC derivatives |
20,083 |
11,655 | 8,427 | 6,066 | 2,299 | 62 | ||||||||||||||||||||
| Repos | 311 | 0 | 311 | 272 | 40 | 0 | ||||||||||||||||||||
|
|
||||||||||||||||||||||||||
| Total | 20,394 | 11,655 | 8,739 | 6,338 | 2,339 | 62 | ||||||||||||||||||||
153
KfW Financial Report 2025
Financial Report > Consolidated financial statements > Consolidated notes – Other notes
(65) Off-balance sheet transactions
Analysis by class
|
|
31 Dec. 2025 |
31 Dec. 2024 | ||||||||||||
|
|
EUR in millions | EUR in millions | ||||||||||||
| Irrevocable loan commitments |
137,023 | 138,628 | ||||||||||||
| Financial guarantee contracts |
906 | 1,101 | ||||||||||||
| Contingent liabilities from financial guarantees |
2,370 | 2,362 | ||||||||||||
| Other contingent liabilities | 2,812 | 2,951 | ||||||||||||
|
|
||||||||||||||
| Total | 143,111 | 145,041 | ||||||||||||
All off-balance-sheet transactions are disclosed in the Notes at their par values less any related provisions.
Other contingent liabilities include payment obligations attributable to equity investments which are not fully paid up and do not have to be consolidated.
As part of the sale of its stake in Deutsche Industriebank (“IKB”) in 2008, KfW agreed to indemnify IKB for certain legal risks up to a certain amount after IKB’s excess. As of the end of the reporting period, no proceedings are pending against IKB which are relevant in this context.
In accordance with IAS 37.92, no further disclosures on contingent liabilities were made.
(66) Trust activities and administered loans
Analysis of trust activities (transactions in KfW’s own name but for the account of third parties)
|
|
31 Dec. 2025 |
31 Dec. 2024 | ||||||||||
|
|
EUR in millions | EUR in millions | ||||||||||
| Loans and advances to banks |
852 | 785 | ||||||||||
| Loans and advances to customers |
10,035 | 10,502 | ||||||||||
| Securities and investments |
11,688 | 11,565 | ||||||||||
| Assets held in trust |
22,575 | 22,853 | ||||||||||
| Liabilities to banks |
0 | 0 | ||||||||||
| Liabilities to customers |
22,575 | 22,853 | ||||||||||
| Liabilities held in trust | 22,575 | 22,853 | ||||||||||
EUR 13,144 million (31 Dec. 2024: EUR 13,381 million) of the assets held in trust is attributable to KfW Development Bank and DEG. Additional transactions with the Federal Government as trustor in the amount of EUR 7,877 million (31 Dec. 2024: EUR 5,787 million) are transactions mandated by the German Federal Government in accordance with Article 2 (4) of the KfW Law and are included in Securities and investments.
Moreover, KfW held guarantees of EUR 295 million (31 Dec. 2024: EUR 145 million) issued under the European Fund for Sustainable Development (EFSD), in trust for the European Union.
154
KfW Financial Report 2025
Financial Report > Consolidated financial statements > Consolidated notes – Other notes
Volume of administered loans granted (loans in the name and for the account of third parties)
|
|
31 Dec. 2025 | 31 Dec. 2024 | ||||||||||||
|
|
EUR in millions | EUR in millions | ||||||||||||
| Administered loans | 25,670 | 22,879 | ||||||||||||
(67) Leasing transactions as lessee
Disclosures on lessee agreements as of 31 December 2025
| Due within | Due in between | Due in more than | Total | |||||||||||||||||
|
|
1 year | 1 and 5 years | 5 years |
|
||||||||||||||||
|
|
EUR in millions | EUR in millions | EUR in millions | EUR in millions | ||||||||||||||||
| Lease liabilities (undiscounted) | 8 | 24 | 7 | 40 | ||||||||||||||||
Disclosures on lessee agreements as of 31 December 2024
| Due within | Due in between | Due in more than | Total | |||||||||||||||||
|
|
1 year | 1 and 5 years | 5 years |
|
||||||||||||||||
|
|
EUR in millions | EUR in millions | EUR in millions | EUR in millions | ||||||||||||||||
| Lease liabilities (undiscounted) | 8 | 21 | 1 | 30 | ||||||||||||||||
Lease payments in the amount of EUR 1 million (2024: EUR 1 million) were incurred for short-term leases in the reporting period. For leases in which the underlying asset is of low value, lease payments amounted to EUR 4 million (2024: EUR 4 million). The group does not apply recognition requirements in either case as provided for in IFRS 16.5.
(68) Average number of employees during the financial year
| 2025 |
2024 |
|||||||||||||
| Female employees | 4,140 |
4,084 |
||||||||||||
| Male employees | 4,559 |
4,409 |
||||||||||||
| Gender not indicated | 0 | 0 | ||||||||||||
| Total1), 2) | 8,699 | 8,493 | ||||||||||||
| Staff not covered by collective agreements |
5,817 |
5,679 |
||||||||||||
| Staff covered by collective agreements |
2,431 |
2,382 |
||||||||||||
| Staff in external offices |
451 | 433 | ||||||||||||
| 1) | Excluding interns and employees on parental leave |
| 2) | Due to immateriality, the prior-year figure for employees on parental leave has not been adjusted. |
155
KfW Financial Report 2025
Financial Report > Consolidated financial statements > Consolidated notes – Other notes
The remuneration report describes the basic structure of the remuneration plan for members of the Executive Board and Board of Supervisory Directors; it also discloses their remuneration on an individual basis. The remuneration report is an integral part of the notes to the consolidated financial statements.
Overview of total remuneration of members of the Executive Board and Board of Supervisory Directors
| 20251) |
2024 |
|||||||||||||
| EUR in thousands |
EUR in thousands |
|||||||||||||
| Members of the Executive Board | 4,012.3 |
3,972.0 |
||||||||||||
| Former members of the Executive Board and their surviving dependants |
4,666.4 |
4,575.3 |
||||||||||||
| Members of the Board of Supervisory Directors |
178.3 | 188.6 | ||||||||||||
| Total |
8,857.0 | 8,735.9 | ||||||||||||
| 1) | Katharina Herrmann stepped down from the Executive Board of KfW as of 30 April 2025. |
Remuneration of the Executive Board
The remuneration system for KfW’s Executive Board is aimed at appropriately compensating members of the Executive Board for their duties and responsibilities. Executive Board contracts are drawn up based on the 1992 version of the policy for hiring executive board members at credit institutions of the Federal Government (Grundsätze für die Anstellung der Vorstandsmitglieder bei den Kreditinstituten des Bundes). The Federal Public Corporate Governance Code (Public Corporate Governance Kodex des Bundes – “PCGK”) is taken into account when drawing up contracts. Each contract is individualised accordingly on this basis.
Components of remuneration
The Executive Board members receive fixed monetary remuneration paid in equal monthly instalments.
The following table shows total remuneration, broken down into remuneration components and other forms of remuneration, as well as additions to pension provisions for each member of the Executive Board.
Annual remuneration of the Executive Board and additions to pension provisions in financial years 2025 and 2024
| Salary |
Other remuneration
|
Total |
Additions to pension provisions1) | |||||||||||||||||||||||||||||||||||
|
|
|
|
|
| ||||||||||||||||||||||||||||||||||
|
|
2025 |
2024 |
2025 |
2024 |
2025 |
2024 |
2025 |
2024 | ||||||||||||||||||||||||||||||
|
|
EUR in |
EUR in |
EUR in |
EUR in |
EUR in |
EUR in |
EUR in |
EUR in | ||||||||||||||||||||||||||||||
| Stefan Wintels (Chief Executive Officer) |
910.7 |
838.7 |
21.5 |
18.7 |
932.2 |
857.4 |
617.4 |
693.3 | ||||||||||||||||||||||||||||||
| Katharina Herrmann2) |
189.5 |
568.4 |
1.9 |
5.1 |
191.4 |
573.5 |
0.0 |
367.1 | ||||||||||||||||||||||||||||||
| Melanie Kehr |
751.6 |
603.4 |
16.1 |
15.0 |
767.7 |
618.4 |
83.7 |
563.1 | ||||||||||||||||||||||||||||||
| Christiane Laibach |
626.7 |
568.4 |
13.1 |
12.3 |
639.8 |
580.7 |
452.9 |
300.3 | ||||||||||||||||||||||||||||||
| Bernd Loewen |
740.8 |
682.4 |
40.1 |
34.4 |
780.9 |
716.8 |
214.5 |
1,894.4 | ||||||||||||||||||||||||||||||
| Dr Stefan Peiß |
677.4 | 603.4 | 22.9 | 21.8 | 700.3 | 625.2 | –14.7 | 362.9 | ||||||||||||||||||||||||||||||
| Total | 3,896.7 | 3,864.7 | 115.6 | 107.3 | 4,012.3 | 3,972.0 | 1,353.8 | 4,181.1 | ||||||||||||||||||||||||||||||
| 1) | The discount rate for pension obligations increased in 2025 due to the rise in long-term capital market rates, from 3.49% (31 Dec. 2024) to 4.08% (31 Dec. 2025). |
| 2) | Until 30 April 2025 |
156
KfW Financial Report 2025
Financial Report > Consolidated financial statements > Consolidated notes – Other notes
Breakdown of other remuneration of the Executive Board in financial year 2025
|
|
Company |
Group |
Health |
Long-term |
Cost of |
Other |
Total | |||||||||||||||||||||||
|
|
EUR in |
EUR in |
EUR in |
EUR in |
EUR in |
EUR in |
EUR in | |||||||||||||||||||||||
| Stefan Wintels (Chief Executive Officer) |
13.9 |
0.6 |
5.8 |
1.2 |
0.0 |
0.0 |
21.5 | |||||||||||||||||||||||
| Katharina Herrmann1) |
0.0 |
0.0 |
1.7 |
0.2 |
0.0 |
0.0 |
1.9 | |||||||||||||||||||||||
| Melanie Kehr |
9.5 |
0.5 |
5.6 |
0.5 |
0.0 |
0.0 |
16.1 | |||||||||||||||||||||||
| Christiane Laibach |
6.7 |
0.4 |
5.4 |
0.6 |
0.0 |
0.0 |
13.1 | |||||||||||||||||||||||
| Bernd Loewen |
15.9 |
0.5 |
22.5 |
1.2 |
0.0 |
0.0 |
40.1 | |||||||||||||||||||||||
| Dr Stefan Peiß | 13.1 | 0.4 | 8.2 | 1.2 | 0.0 | 0.0 | 22.9 | |||||||||||||||||||||||
| Total | 59.1 | 2.4 | 49.2 | 4.9 | 0.0 | 0.0 | 115.6 | |||||||||||||||||||||||
| 1) | Until 30 April 2025 |
Breakdown of other remuneration of the Executive Board in financial year 2024
|
|
Company |
Group |
Health |
Long-term |
Cost of |
Other |
Total | |||||||||||||||||||||||
|
|
EUR in |
EUR in |
EUR in |
EUR in |
EUR in |
EUR in |
EUR in | |||||||||||||||||||||||
| Stefan Wintels (Chief Executive Officer) |
12.0 |
0.6 |
5.1 |
1.1 |
0.0 |
0.0 |
18.7 | |||||||||||||||||||||||
| Katharina Herrmann |
0.0 |
0.4 |
4.1 |
0.5 |
0.0 |
0.0 |
5.1 | |||||||||||||||||||||||
| Melanie Kehr |
9.2 |
0.4 |
4.9 |
0.5 |
0.0 |
0.0 |
15.0 | |||||||||||||||||||||||
| Christiane Laibach |
6.5 |
0.4 |
4.8 |
0.6 |
0.0 |
0.0 |
12.3 | |||||||||||||||||||||||
| Bernd Loewen |
15.6 |
0.5 |
17.2 |
1.1 |
0.0 |
0.0 |
34.4 | |||||||||||||||||||||||
| Dr Stefan Peiß | 13.0 | 0.4 | 7.3 | 1.1 | 0.0 | 0.0 | 21.8 | |||||||||||||||||||||||
| Total | 56.3 | 2.7 | 43.4 | 4.9 | 0.0 | 0.0 | 107.3 | |||||||||||||||||||||||
Breakdown of remuneration of the Executive Board from secondary employment in financial years 2025 and 2024
|
|
2025 |
2024 | ||||||||||
|
|
EUR in thousands | EUR in thousands | ||||||||||
| Stefan Wintels (Chief Executive Officer)1) |
331.7 | 328.6 | ||||||||||
| Katharina Herrmann2) |
0.0 | 0.0 | ||||||||||
| Melanie Kehr |
39.5 | 38.9 | ||||||||||
| Christiane Laibach |
0.0 | 0.0 | ||||||||||
| Bernd Loewen |
0.0 | 0.0 | ||||||||||
| Dr Stefan Peiß | 0.0 | 0.0 | ||||||||||
| 1) | Remuneration payments for 2024 were made in 2025. |
| 2) | Until 30 April 2025 |
157
KfW Financial Report 2025
Financial Report > Consolidated financial statements > Consolidated notes – Other notes
Responsibilities
The Presidial and Nomination Committee has discussed the Executive Board remuneration system including contract components since the committee structure was modified in accordance with the applicable Section 25d of the German Banking Act (Kreditwesengesetz – “KWG”) and adopts and regularly reviews it. The Presidial and Nomination Committee is advised on these matters by the Remuneration Committee, which in turn works together with the Risk and Credit Committee in order to perform its duties. Likewise after consulting with the Remuneration Committee on the matter, the Board of Supervisory Directors decides upon the basic structure of the Executive Board’s remuneration system.
The Presidial and Nomination Committee most recently discussed remuneration issues on 2 April 2025.
Fringe benefits
Other remuneration largely consists of contractual fringe benefits. Executive Board members are entitled to a company car with driver services for business and personal use. Executive Board members reimburse KfW for using a company car with a driver for private purposes in accordance with applicable tax regulations. They are reimbursed under tax regulations for the cost of maintaining a second home for business reasons.
Executive Board members are insured under a group accident insurance policy. Allowances are provided for health and long-term care insurance. Executive Board members are covered by a directors’ and officers’ liability insurance policy, which insures them against the risks of financial loss associated with their actions in their capacity as Executive Board members and by a supplemental legal expenses insurance policy and a contractual protection insurance policy. KfW Executive Board members acting in their management capacity are also protected by a special legal expenses group policy for employees covering criminal activities.
No remuneration is paid to members of the Executive Board for assuming executive body functions at group companies.
As with all other executives, Executive Board members may also opt to participate in the deferred remuneration programme – a supplemental company pension scheme financed via tax-free salary conversion. Moreover, they are entitled to anniversary bonuses in accordance with KfW’s general company policy.
In addition, the fringe benefits include the cost of security systems at Executive Board members’ homes; these benefits are not recognised as Other remuneration but as Non-personnel expenses.
The contractual fringe benefits are subject to taxation as benefits in money’s worth for Executive Board members if they cannot be granted on a tax-free basis or if this is contractually agreed. No Executive Board member was granted or promised any benefits by a third party during the past financial year with a view to his/her position as a member of the KfW Executive Board.
Pension benefits and other benefits in the case of early retirement
In accordance with Article 1 (3) of the KfW Bylaws, the appointment of an Executive Board member should not generally extend past the legal age of retirement. Upon reaching statutory retirement age and the expiry of their Executive Board contract, Executive Board members are entitled to claim pension payments; they are also entitled to pension benefits if their employment relationship terminates due to permanent disability.
Pension commitments for Executive Board members as well as their surviving dependants are based on the 1992 version of the Federal Government’s policy for hiring executive board members at credit institutions. The PCGK is taken into account when drawing up the Executive Board contracts.
Executive Board member contracts include a severance pay cap in accordance with the recommendations of the PCGK. In other words, payments to these Executive Board member due to early termination of the Executive Board function without good cause in accordance with Section 626 of the German Civil Code (Bürgerliches Gesetzbuch – “BGB”) should not exceed the equivalent of two years’ salary or compensation including fringe benefits for the remainder of the contract, depending on which of the amounts is lower.
158
KfW Financial Report 2025
Financial Report > Consolidated financial statements > Consolidated notes – Other notes
The full benefit entitlement totalled 49% of the final salary in the reporting year with different contractual arrangements. The retirement benefit entitlement amounted to 70% of the full entitlement for first-time appointment, with an increase per completed year of service of 0.98 to 1.53 percentage points depending on the contract (from an initial 34.3% to a maximum of 49% of the final salary).
The Executive Board contracts contain additional individual provisions, in particular concerning vesting of pension benefits. The newer contracts also include provisions on retrospective pension contributions where pension benefits are not yet vested and the member in question has not been reappointed, and on discounts in the event of early retirement.
Pension payments and other benefits to former Executive Board members or their surviving dependants were as follows in 2025 and 2024:
Pension payments and other benefits to former Executive Board members or their surviving dependants
|
|
2025 | 2024 | ||||||||||||||||||
|
|
Headcount | EUR in thousands | Headcount | EUR in thousands | ||||||||||||||||
| Former members of the Executive Board |
16 | 4.193.0 | 17 | 4,035.3 | ||||||||||||||||
| Surviving dependants | 4 | 473.4 | 4 | 540.0 | ||||||||||||||||
|
|
||||||||||||||||||||
| Total | 20 | 4,666.4 | 21 | 4,575.3 | ||||||||||||||||
Provisions for pension obligations to former members of the Executive Board and their surviving dependants in the amount of EUR 52,091 thousand (31 Dec. 2024: EUR 51,462 thousand) were set up at the end of financial year 2025.
Remuneration of members of the Board of Supervisory Directors
The amount of remuneration to members of the Board of Supervisory Directors is determined by the supervisory authority in accordance with Article 7 (10) of the KfW Bylaws. With the last revision in May 2010, compensation to members of the Federal Government who are members of the Board of Supervisory Directors pursuant to Article 7 (1) nos. 1 and 2 of the KfW Law was set at EUR 0.
In the reporting year, remuneration for other members of the Board of Supervisory Directors pursuant to Article 7 (1) nos. 3–7 of the KfW Law amounted to EUR 5,113 p.a.; remuneration for membership of a Board of Supervisory Directors committee was a standard amount of EUR 614 p.a. for each member. Committee chairs did not receive special remuneration.
Members who join during the year receive their remuneration on a pro rata basis.
A daily allowance (EUR 200 per meeting day) is paid and travel expenses and applicable VAT are reimbursed upon request.
The following table provides details on the remuneration paid to the Board of Supervisory Directors in financial year 2025; stated amounts are net amounts in thousands of euros. Travel expenses are reimbursed upon submission of receipts and are not taken into account in the table.
159
KfW Financial Report 2025
Financial Report > Consolidated financial statements > Consolidated notes – Other notes
Remuneration of members of the Board of Supervisory Directors for financial year 2025
|
No. |
Name |
Dates
of |
Board of |
Committee |
Daily |
Total |
||||||||||||||||||||||||||||
|
|
|
2025 |
EUR in thousands |
EUR in thousands |
EUR in thousands |
EUR in thousands |
||||||||||||||||||||||||||||
| 1. | Dr Jörg Kukies |
1 Jan. – 6 May |
0.0 | 0.0 | 0.0 | 0.0 | ||||||||||||||||||||||||||||
| 2. | Lars Klingbeil |
6 May – 31 Dec. |
0.0 | 0.0 | 0.0 | 0.0 | ||||||||||||||||||||||||||||
| 3. | Dr Robert Habeck |
1 Jan. – 6 May |
0.0 | 0.0 | 0.0 | 0.0 | ||||||||||||||||||||||||||||
| 4. | Katherina Reiche |
6 May – 31 Dec. |
0.0 | 0.0 | 0.0 | 0.0 | ||||||||||||||||||||||||||||
| 5. | Reem Alabali-Radovan |
6 May – 31 Dec. |
0.0 | 0.0 | 0.0 | 0.0 | ||||||||||||||||||||||||||||
| 6. | Annalena Baerbock |
1 Jan. – 6 May |
0.0 | 0.0 | 0.0 | 0.0 | ||||||||||||||||||||||||||||
| 7. | Katharina Beck |
1 Jan. – 31 Dec. |
5.1 | 1.2 | 0.4 | 6.7 | ||||||||||||||||||||||||||||
| 8. | Dr André Berghegger |
1 Jan. – 31 Dec. |
5.1 | 0.6 | 1.0 | 6.7 | ||||||||||||||||||||||||||||
| 9. | Volker Bouffier2) |
1 Jan. – 31 Dec. |
5.1 | 1.2 | 0.0 | 6.3 | ||||||||||||||||||||||||||||
| 10. | Stefan Evers2) |
1 Jan. – 31 Dec. |
5.1 | 0.0 | 0.2 | 5.3 | ||||||||||||||||||||||||||||
| 11. | Yasmin Fahimi |
1 Jan. – 31 Dec. |
5.1 | 1.2 | 0.4 | 6.7 | ||||||||||||||||||||||||||||
| 12. | Robert Feiger |
1 Jan. – 31 Dec. |
5.1 | 0.6 | 0.4 | 6.1 | ||||||||||||||||||||||||||||
| 13. | Dr. Heiko Geue2) |
1 Jan. – 31 Dec. |
5.1 | 1.1 | 0.8 | 7.0 | ||||||||||||||||||||||||||||
| 14. | Tanja Gönner |
1 Jan. – 31 Dec. |
5.1 | 1.2 | 0.0 | 6.3 | ||||||||||||||||||||||||||||
| 15. | Olav Gutting4) |
1 Jan. – 31 Dec. |
5.1 | 1.8 | 0.8 | 7.7 | ||||||||||||||||||||||||||||
| 16. | Gerald Heere2), 4) |
1 Jan. – 31 Dec. |
5.1 | 1.8 | 1.4 | 8.3 | ||||||||||||||||||||||||||||
| 17. | Marion Höllinger |
1 Jan. – 31 Dec. |
5.1 | 2.5 | 1.2 | 8.8 | ||||||||||||||||||||||||||||
| 18. | Verena Hubertz |
1 Jan. – 21 May |
2.1 | 0.8 | 0.2 | 3.1 | ||||||||||||||||||||||||||||
| 19. | Harald Hübner2) |
1 Jan. – 31 Dec. |
5.1 | 0.4 | 0.6 | 6.1 | ||||||||||||||||||||||||||||
| 20. | Dr Dirk Jandura4) |
1 Jan. – 31 Dec. |
5.1 | 0.6 | 1.6 | 7.3 | ||||||||||||||||||||||||||||
| 21. | Andrea Kocsis |
1 Jan. – 31 Dec. |
5.1 | 0.0 | 0.2 | 5.3 | ||||||||||||||||||||||||||||
| 22. | Stefan Körzell |
1 Jan. – 31 Dec. |
5.1 | 1.2 | 0.4 | 6.7 | ||||||||||||||||||||||||||||
| 23. | Ulrich Lange4) |
1 Jan. – 15 May |
1.9 | 0.0 | 0.2 | 2.1 | ||||||||||||||||||||||||||||
| 24. | Steffi Lemke |
1 Jan. – 6 May |
0.0 | 0.0 | 0.0 | 0.0 | ||||||||||||||||||||||||||||
| 25. | Dr Helena Melnikov |
1 Jan. – 31 Dec. |
5.1 | 0.6 | 1.0 | 6.7 | ||||||||||||||||||||||||||||
| 26. | Rainer Neske |
1 Jan. – 31 Dec. |
5.1 | 0.6 | 1.0 | 6.7 | ||||||||||||||||||||||||||||
| 27. | Dr Marcus Optendrenk2), 5) |
1 Jan. – 31 Dec. |
0.0 | 0.0 | 0.0 | 0.0 | ||||||||||||||||||||||||||||
| 28. | Dr Bettina Orlopp |
1 Jan. – 31 Dec. |
5.1 | 0.6 | 0.0 | 5.7 | ||||||||||||||||||||||||||||
| 29. | Cem Özdemir |
1 Jan. – 6 May |
0.0 | 0.0 | 0.0 | 0.0 | ||||||||||||||||||||||||||||
| 30. | Christian Piwarz2), 5) |
1 Jan. – 31 Dec. |
0.0 | 0.0 | 0.0 | 0.0 | ||||||||||||||||||||||||||||
| 31. | Daniel Quinten |
1 Jan. – 31 Dec. |
5.1 | 1.2 | 0.4 | 6.7 | ||||||||||||||||||||||||||||
| 32. | Alois Rainer |
6 May – 31 Dec. |
0.0 | 0.0 | 0.0 | 0.0 | ||||||||||||||||||||||||||||
| 33. | Prof. Dr Ulrich Reuter |
1 Jan. – 31 Dec. |
5.1 | 2.5 | 0.2 | 7.8 | ||||||||||||||||||||||||||||
| 34. | Dr Thorsten Rudolph |
1 Jan. – 31 Dec. |
5.1 | 1.2 | 0.2 | 6.5 | ||||||||||||||||||||||||||||
| 35. | Joachim Rukwied4) |
1 Jan. – 31 Dec. |
5.1 | 0.6 | 0.6 | 6.3 | ||||||||||||||||||||||||||||
| 36. | Frank Schäffler |
1 Jan. – 31 Dec. |
5.1 | 1.2 | 0.8 | 7.1 | ||||||||||||||||||||||||||||
| 37. | Jan Wenzel Schmidt |
1 Jan. – 31 Dec. |
5.1 | 0.0 | 0.2 | 5.3 | ||||||||||||||||||||||||||||
| 38. | Carsten Schneider |
6 May – 31 Dec. |
0.0 | 0.0 | 0.0 | 0.0 | ||||||||||||||||||||||||||||
| 39. | Patrick Schnieder |
6 May – 31 Dec. |
0.0 | 0.0 | 0.0 | 0.0 | ||||||||||||||||||||||||||||
| 40. | Svenja Schulze |
1 Jan. – 6 May |
0.0 | 0.0 | 0.0 | 0.0 | ||||||||||||||||||||||||||||
| 41. | Holger Schwannecke |
1 Jan. – 31 Dec. |
5.1 | 1.8 | 0.4 | 7.3 | ||||||||||||||||||||||||||||
| 42. | Dr Johann Wadephul |
6 May – 31 Dec. |
0.0 | 0.0 | 0.0 | 0.0 | ||||||||||||||||||||||||||||
| 43. | Dr Kai H. Warnecke |
1 Jan. – 31 Dec. |
5.1 | 0.0 | 0.6 | 5.7 | ||||||||||||||||||||||||||||
| 44. | Dr Volker Wissing |
1 Jan. – 6 May | 0.0 | 0.0 | 0.0 | 0.0 | ||||||||||||||||||||||||||||
| Total | 136.6 | 26.5 | 15.2 | 178.3 | ||||||||||||||||||||||||||||||
| 1) | The amounts had not yet been paid out as of the reporting date 31 December 2025. |
| 2) | Amount governed by state law |
| 3) | Amounts for financial year 2025 until the date of assessment. Any later claims will be included in the next report. |
| 4) | Payments for meeting attendance for 2024 |
| 5) | Member waived entitlement. |
160
KfW Financial Report 2025
Financial Report > Consolidated financial statements > Consolidated notes – Other notes
Remuneration of members of the Board of Supervisory Directors for financial year 2024
|
No. |
Name |
Dates
of |
Board of |
Committee |
Daily |
Total |
||||||||||||||||||||||||||||
|
|
|
2024 |
EUR in thousands |
EUR in thousands |
EUR in thousands |
EUR in thousands |
||||||||||||||||||||||||||||
| 1. | Dr Robert Habeck |
1 Jan. – 31 Dec. |
0.0 | 0.0 | 0.0 | 0.0 | ||||||||||||||||||||||||||||
| 2. | Christian Lindner |
1 Jan. – 7 Nov. |
0.0 | 0.0 | 0.0 | 0.0 | ||||||||||||||||||||||||||||
| 3. | Dr Jörg Kukies |
7 Nov. – 31 Dec. |
0.0 | 0.0 | 0.0 | 0.0 | ||||||||||||||||||||||||||||
| 4. | Annalena Baerbock |
1 Jan. – 31 Dec. |
0.0 | 0.0 | 0.0 | 0.0 | ||||||||||||||||||||||||||||
| 5. | Katharina Beck |
1 Jan. – 31 Dec. |
5.1 | 1.2 | 0.6 | 6.9 | ||||||||||||||||||||||||||||
| 6. | Dr André Berghegger |
1 Jan. – 20 Feb. |
0.9 | 0.3 | 0.0 | 1.2 | ||||||||||||||||||||||||||||
| 7. | Volker Bouffier2) |
1 Jan. – 31 Dec. |
5.1 | 1.2 | 0.2 | 6.5 | ||||||||||||||||||||||||||||
| 8. | Dr Andreas Dressel2) |
1 Jan. – 31 Dec. |
5.1 | 0.6 | 0.0 | 5.7 | ||||||||||||||||||||||||||||
| 9. | Yasmin Fahimi |
1 Jan. – 31 Dec. |
5.1 | 1.2 | 0.4 | 6.7 | ||||||||||||||||||||||||||||
| 10. | Björn Fecker2) |
1 Jan. – 31 Dec. |
5.1 | 1.2 | 0.0 | 6.3 | ||||||||||||||||||||||||||||
| 11. | Robert Feiger |
1 Jan. – 31 Dec. |
5.1 | 0.6 | 0.4 | 6.1 | ||||||||||||||||||||||||||||
| 12. | Tanja Gönner4) |
1 Jan. – 31 Dec. |
5.1 | 1.2 | 0.2 | 6.5 | ||||||||||||||||||||||||||||
| 13. | Olav Gutting |
22 Feb. – 31 Dec. |
4.5 | 1.1 | 0.4 | 6.0 | ||||||||||||||||||||||||||||
| 14. | Gerald Heere2) |
1 Jan. – 31 Dec. |
5.1 | 1.8 | 0.4 | 7.3 | ||||||||||||||||||||||||||||
| 15. | Prof. Dr Hans-Günter Henneke |
1 Jan. – 31 Dec. |
5.1 | 0.6 | 1.4 | 7.1 | ||||||||||||||||||||||||||||
| 16. | Marion Höllinger |
1 Jan. – 31 Dec. |
5.1 | 2.5 | 0.0 | 7.6 | ||||||||||||||||||||||||||||
| 17. | Verena Hubertz |
1 Jan. – 31 Dec. |
5.1 | 1.8 | 0.0 | 6.9 | ||||||||||||||||||||||||||||
| 18. | Harald Hübner2) |
1 Jan. – 31 Dec. |
5.1 | 0.0 | 0.6 | 5.7 | ||||||||||||||||||||||||||||
| 19. | Dr Dirk Jandura |
1 Jan. – 31 Dec. |
5.1 | 0.6 | 1.0 | 6.7 | ||||||||||||||||||||||||||||
| 20. | Andrea Kocsis |
1 Jan. – 31 Dec. |
5.1 | 0.0 | 0.4 | 5.5 | ||||||||||||||||||||||||||||
| 21. | Stefan Körzell |
1 Jan. – 31 Dec. |
5.1 | 1.2 | 0.4 | 6.7 | ||||||||||||||||||||||||||||
| 22. | Ulrich Lange |
1 Jan. – 31 Dec. |
5.1 | 0.0 | 0.4 | 5.5 | ||||||||||||||||||||||||||||
| 23. | Steffi Lemke |
1 Jan. – 31 Dec. |
0.0 | 0.0 | 0.0 | 0.0 | ||||||||||||||||||||||||||||
| 24. | Rainer Neske |
1 Jan. – 31 Dec. |
5.1 | 0.6 | 1.0 | 6.7 | ||||||||||||||||||||||||||||
| 25. | Dr Marcus Optendrenk2), 4), 5) |
1 Jan. – 31 Dec. |
0.0 | 0.0 | 0.2 | 0.2 | ||||||||||||||||||||||||||||
| 26. | Dr Bettina Orlopp |
1 Jan. – 31 Dec. |
5.1 | 0.6 | 0.0 | 5.7 | ||||||||||||||||||||||||||||
| 27. | Cem Özdemir |
1 Jan. – 31 Dec. |
0.0 | 0.0 | 0.0 | 0.0 | ||||||||||||||||||||||||||||
| 28. | Achim Post |
1 Jan. – 22 Mar. |
1.3 | 0.3 | 0.0 | 1.6 | ||||||||||||||||||||||||||||
| 29. | Daniel Quinten4) |
1 Jan. – 31 Dec. |
5.1 | 1.2 | 0.8 | 7.1 | ||||||||||||||||||||||||||||
| 30. | Prof. Dr Ulrich Reuter |
1 Jan. – 31 Dec. |
5.1 | 2.5 | 0.0 | 7.6 | ||||||||||||||||||||||||||||
| 31. | Michael Richter2) |
1 Jan. – 31 Dec. |
5.1 | 0.0 | 0.6 | 5.7 | ||||||||||||||||||||||||||||
| 32. | Dr Thorsten Rudolph |
11 Apr. – 31 Dec. |
3.8 | 0.7 | 0.2 | 4.7 | ||||||||||||||||||||||||||||
| 33. | Joachim Rukwied6) |
1 Jan. – 31 Dec. |
5.1 | 0.6 | 0.8 | 6.5 | ||||||||||||||||||||||||||||
| 34. | Frank Schäffler |
1 Jan. – 31 Dec. |
5.1 | 1.2 | 0.8 | 7.1 | ||||||||||||||||||||||||||||
| 35. | Jan Wenzel Schmidt |
1 Jan. – 31 Dec. |
5.1 | 0.0 | 0.4 | 5.5 | ||||||||||||||||||||||||||||
| 36. | Svenja Schulze |
1 Jan. – 31 Dec. |
0.0 | 0.0 | 0.0 | 0.0 | ||||||||||||||||||||||||||||
| 37. | Holger Schwannecke |
1 Jan. – 31 Dec. |
5.1 | 1.8 | 0.6 | 7.5 | ||||||||||||||||||||||||||||
| 38. | Dr Martin Wansleben |
1 Jan. – 31 Dec. |
5.1 | 0.6 | 0.6 | 6.3 | ||||||||||||||||||||||||||||
| 39. | Dr Kai H. Warnecke |
1 Jan. – 31 Dec. |
5.1 | 0.0 | 0.4 | 5.5 | ||||||||||||||||||||||||||||
| 40. | Dr Volker Wissing |
1 Jan. – 31 Dec. | 0.0 | 0.0 | 0.0 | 0.0 | ||||||||||||||||||||||||||||
| Total | 148.2 | 27.2 | 13.2 | 188.6 | ||||||||||||||||||||||||||||||
| 1) | The amounts had not yet been paid out as of the reporting date 31 December 2024. |
| 2) | Amount governed by state law |
| 3) | Amounts for financial year 2024 until the date of assessment. Any later claims will be included in the next report. |
| 4) | Payments for meeting attendance for 2023 |
| 5) | Member waived entitlement. |
| 6) | Payments for meeting attendance for 2021, 2022 and 2023 |
161
KfW Financial Report 2025
Financial Report > Consolidated financial statements > Consolidated notes – Other notes
There are no pension obligations for members of the Board of Supervisory Directors.
Members of the Board of Supervisory Directors did not receive remuneration in the reporting year for personal services provided.
Members of the Board of Supervisory Directors are also covered by a directors’ and officers’ liability insurance policy, which insures them against the risks of financial loss associated with their actions in their capacity as Supervisory Directors and by a supplemental legal expenses insurance policy and a contractual protection insurance policy. There are currently no deductibles agreed. KfW Supervisory Directors acting in that capacity are also protected by a special legal expenses group policy for employees covering criminal action brought against Supervisory Directors and by a group accident insurance policy.
(70) Related party disclosures
Transactions between KfW and related parties are concluded as part of operating activities. KfW Group’s related parties in accordance with IAS 24 include its subsidiaries which are not consolidated for reasons of immateriality; joint ventures; associates; KfW shareholders (the Federal Republic of Germany (Federal Government) 80%; the federal states an aggregate 20%); interests held by the Federal Government over which it directly has significant influence; key management personnel and their family members; and entities over which this group of persons exercise control. As for the persons in the remuneration report, the persons in key positions are limited to the KfW Executive Board and the members of the Board of Supervisory Directors.
KfW has exercised the relief option in accordance with IAS 24.25 for government-related entities.
Transactions with related parties
The following overview displays the scope of the transactions with KfW shareholders, interests held by the Federal Government and group companies as related parties:
162
KfW Financial Report 2025
Financial Report > Consolidated financial statements > Consolidated notes – Other notes
Transactions with related parties
| 31 Dec. 2025 | 31 Dec. 2024 | |||||||||||||||||||||||||||
|
|
Shareholders | Interests held by the Federal Government |
Group companies |
Shareholders | Interests held by the Federal Government |
Group companies |
||||||||||||||||||||||
| EUR in | EUR in | EUR in | EUR in | EUR in | EUR in | |||||||||||||||||||||||
|
|
millions | millions | millions | millions | millions | millions | ||||||||||||||||||||||
| Assets |
|
|
|
|
|
|
||||||||||||||||||||||
| Cash reserves |
0 | 19,535 | 0 | 0 | 26,522 | 0 | ||||||||||||||||||||||
| thereof Deutsche Bundesbank |
0 | 19,535 | 0 | 0 | 26,522 | 0 | ||||||||||||||||||||||
| Financial assets at amortised cost |
13,770 | 206 | 1 | 13,623 | 306 | 12 | ||||||||||||||||||||||
| Loans and advances to customers/banks |
11,578 | 206 | 1 | 10,850 | 306 | 12 | ||||||||||||||||||||||
| Loans and advances |
11,578 | 206 | 1 | 10,850 | 306 | 12 | ||||||||||||||||||||||
| thereof BAföG government loans |
9,968 | 0 | 0 | 9,242 | 0 | 0 | ||||||||||||||||||||||
| Risk provisions for loans and advances to customers/banks |
0 | 0 | 0 | 0 | 0 | 0 | ||||||||||||||||||||||
| Securities and investments |
2,191 | 0 | 0 | 2,773 | 0 | 0 | ||||||||||||||||||||||
| Bonds |
2,191 | 0 | 0 | 2,773 | 0 | 0 | ||||||||||||||||||||||
| Financial assets at fair value |
8,026 | 0 | 0 | 8,085 | 0 | 0 | ||||||||||||||||||||||
| Loans and advances to customers/banks |
8,026 | 0 | 0 | 8,085 | 0 | 0 | ||||||||||||||||||||||
| Loans and advances |
8,026 | 0 | 0 | 8,085 | 0 | 0 | ||||||||||||||||||||||
| thereof holding arrangements |
8,026 | 0 | 0 | 8,085 | 0 | 0 | ||||||||||||||||||||||
| Other assets | 682 | 0 | 0 | 634 | 0 | 0 | ||||||||||||||||||||||
| Liabilities and equity |
|
|
|
|
|
|
||||||||||||||||||||||
| Financial liabilities at amortised cost |
4,546 | 12,580 | 79 | 4,662 | 20,859 | 74 | ||||||||||||||||||||||
| Liabilities to customers/banks |
4,546 | 12,580 | 79 | 4,662 | 20,859 | 74 | ||||||||||||||||||||||
| thereof holding arrangements |
1,026 | 0 | 0 | 327 | 0 | 0 | ||||||||||||||||||||||
| thereof German Finance Agency |
0 | 12,580 | 0 | 0 | 20,859 | 0 | ||||||||||||||||||||||
| Financial liabilities at fair value |
0 | 0 | 0 | 0 | 0 | 0 | ||||||||||||||||||||||
| Other derivatives – FVM |
0 | 0 | 0 | 0 | 0 | 0 | ||||||||||||||||||||||
| Other liabilities | 0 | 0 | 0 | 0 | 0 | 0 | ||||||||||||||||||||||
| Off-balance sheet transactions |
|
|
|
|
|
|
||||||||||||||||||||||
| Loan commitments, financial guarantees and other commitments granted |
12,764 | 10 | 2 | 11,713 | 85 | 2 | ||||||||||||||||||||||
| thereof BAföG government loans |
11,746 | 0 | 0 | 10,768 | 0 | 0 | ||||||||||||||||||||||
| Loan commitments, financial guarantees and other commitments received |
114,592 | 500 | 0 | 138,136 | 0 | 0 | ||||||||||||||||||||||
163
KfW Financial Report 2025
Financial Report > Consolidated financial statements > Consolidated notes – Other notes
Transactions with related parties
| 31 Dec. 2025 |
31 Dec. 2024 | |||||||||||||||||||||||||||
|
|
Shareholders | Interests held by the Federal Government |
Group companies |
Shareholders | Interests held by the Federal Government |
Group companies |
||||||||||||||||||||||
| EUR in | EUR in | EUR in | EUR in | EUR in | EUR in | |||||||||||||||||||||||
|
|
millions | millions | millions | millions | millions | millions | ||||||||||||||||||||||
| Income and expenses |
|
|
|
|
|
|
||||||||||||||||||||||
| Interest income |
416 | 398 | 3 | 509 | 1,570 | 5 | ||||||||||||||||||||||
| thereof Deutsche Bundesbank |
0 | 390 | 0 | 0 | 1,565 | 0 | ||||||||||||||||||||||
| thereof German Finance Agency |
0 | 0 | 0 | 0 | 1 | 0 | ||||||||||||||||||||||
| Interest expense |
50 | 43 | 2 | 58 | 261 | 4 | ||||||||||||||||||||||
| thereof German Finance Agency |
0 | 43 | 0 | 0 | 261 | 0 | ||||||||||||||||||||||
| Net interest income |
366 | 355 | 1 | 451 | 1,309 | 1 | ||||||||||||||||||||||
| Net gains/losses from risk provisions |
0 | 0 | 0 | 0 | 0 | 0 | ||||||||||||||||||||||
| Commission income |
613 | 0 | 0 | 622 | 0 | 0 | ||||||||||||||||||||||
| Commission expense |
0 | 0 | 0 | 0 | 0 | 0 | ||||||||||||||||||||||
| Net commission income |
613 | 0 | 0 | 622 | 0 | 0 | ||||||||||||||||||||||
| Net gains/ losses from hedge accounting |
25 | –305 | 0 | 74 | –598 | 0 | ||||||||||||||||||||||
| Net gains/losses from other financial instruments at fair value through profit or loss |
–2 | 0 | 0 | 18 | 0 | 3 | ||||||||||||||||||||||
| thereof holding arrangements |
–2 | 0 | 0 | 18 | 0 | 0 | ||||||||||||||||||||||
| Net other operating income or loss | 0 | 0 | 1 | 0 | 0 | 1 | ||||||||||||||||||||||
|
|
||||||||||||||||||||||||||||
Transactions with shareholders
Any transactions with the Federal Government and the federal states in financial year 2025 are covered by the rules and regulations set forth in the KfW Law. This also includes guarantees received for operations in which the Federal Republic of Germany has a state interest and for which the Federal Government has mandated KfW (mandated transactions in accordance with Article 2 (4) of the KfW Law).
Transactions with the Federal Government are, as a rule, offset by countertrade transactions with a third party. They do not constitute transactions within the meaning of IAS 24. For this reason, the treatment under IAS 24 is exclusively limited to business relationships with the Federal Government.
Securities and investments contains notes from the liquidity portfolio. These are exclusively bonds issued by the federal states.
As regards holding arrangements, see “Accounting policies” in section (7).
Under Other assets, KfW reports claims for reimbursement from the Federal Government in connection with the agency agreements.
In addition to holding arrangements, the liabilities primarily include Federal Government funds relating to short-term emergency aid for gas and heat and for interest grants.
The group holds guarantees from the shareholders mainly in connection with support in developing the network infrastructure as part of the energy transition, stabilisation measures through liquidity assistance for businesses during the coronavirus pandemic, the market funds business of the business sector KfW Development Bank, export, project and real estate financing, assistance to Greece, and measures to support the energy sector and promote research and development in the aviation sector.
164
KfW Financial Report 2025
Financial Report > Consolidated financial statements > Consolidated notes – Other notes
There were also agency agreements between the Federal Government and KfW, which are reflected in Net commission income, in particular. See the information provided in the Notes on “Net commission income” and “Trust activities”.
Transactions with interests held by the Federal Government
The liabilities to the German Finance Agency include promissory note loans to refinance support services in the context of the COVID-19 pandemic and energy providers. These promissory note loans are hedged against interest risk by means of a micro hedge. This resulted in the hedge result reported under the Net gains/losses from hedge accounting item.
Transactions with group companies
Liabilities to customers/banks resulted from transactions with a subsidiary not included in the consolidated financial statements.
Transactions with key persons
The business relationships between KfW and the members of the Executive Board and of the Board of Supervisory Directors are primarily determined by the KfW Bylaws and by applying the principles of the Federal Public Corporate Governance Code. KfW primarily provides direct loans under its promotional mandate, such as in the area of education financing, and disbursed grants of minor significance. The conditions and prices reflect market conditions or are concluded in accordance with KfW’s general conditions for its loan programmes open to the general public.
| 2025 | 2024 | |||||||||||
| |
EUR in thousands |
|
|
EUR in thousands |
| |||||||
| Audit |
7,118 | 6,888 | ||||||||||
| Other attestation services | 2,199 | 1,910 | ||||||||||
| Total | 9,317 | 8,798 | ||||||||||
The audit fees include reversals of provisions for the 2024 audit of EUR 22,000 (previous year: EUR 80,000) and additional expense for other attestation services in 2024 of EUR 55,000 (previous year: reversal of provisions of EUR 15,000). Moreover, a fee of EUR 122,000 (previous year: EUR 124,000) was incurred internationally for network companies of the auditor for audit services and of EUR 7,000 (previous year: EUR 7,000) for other attestation services.
165
KfW Financial Report 2025
Financial Report > Consolidated financial statements > Consolidated notes – Other notes
(72) Disclosures on unconsolidated structured entities
The group’s unconsolidated structured entities within the meaning of IFRS 12 relate to the following business sectors:
Structured entities in the business sector Financial markets
KfW makes investments in asset-backed securities and asset-backed commercial paper transactions as part of liquidity management. Moreover, the business sector Financial markets manages an existing portfolio to which no further investments will be added.
As of 31 December 2025, the carrying amount of the positions held totalled EUR 7.3 billion (31 Dec. 2024: EUR 6.8 billion).
Structured entities in the business sector Individualfinanzierung & Öffentliche Kunden
(Customised Finance & Public Clients)
As part of a mandated transactions, KfW is providing assistance, on behalf of the Federal Government, in developing a national hydrogen core network. The funds made available in this context are secured in full by a federal guarantee.
As of 31 December 2025, the carrying amount of the positions held totalled EUR 24.0 billion (31 Dec. 2024: EUR 24.0 billion).
The hydrogen core network mandated transaction results in loans and advances to customers of EUR 176 million of as 31 December 2025 (31 Dec. 2024: EUR 4 million). Irrevocable loan commitments include available funds of EUR 23,828 million (EUR 23,996 million). There is no risk of loss due to the federal guarantee. The company operating in the context of the mandated transaction was ranked as a structured entity for the first time in 2025; the prior-year figures have been adjusted accordingly.
Structured entities in the business sector Export and project finance
Tailored leasing/financing concepts are structured via property leasing companies, primarily in the “Aviation and Rail” and “Maritime Industries” sector departments. A separate entity is created for each transaction, with the group participating as the lender. In the case of some of these business partners, the sponsoring banks act as managers of trust companies, but in the majority of cases, these business partners are set up as separate legal entities. The group provides loans to these companies, generally together with other credit institutions. KfW also has credit relationships with some structured entities as market participants in the commodities financing business, where the group supports these customers with pre-export financing structures.
As of 31 December 2025, the carrying amount of the positions held totalled EUR 1.1 billion (31 Dec. 2024: EUR 1.5 billion).
Structured entities in the business sector DEG
As a finance and advisory institution, DEG provides support within its development mandate in line with its business activity guidelines. DEG’s mandate is to promote the development of the private sector of a) developing countries, b) central and eastern European countries and New Independent States (NIS), and c) other countries approved by its shareholder KfW in agreement with the Federal Government. In certain isolated cases this is undertaken via investments in structured entities in the form of equity investments and loans. In accordance with the applied risk principles, the risk of loss is limited to the volume invested or committed.
As of 31 December 2025, the carrying amount of the positions held totalled EUR 0.4 billion (31 Dec. 2024: EUR 0.4 billion).
166
KfW Financial Report 2025
Financial Report > Combined Management Report > Consolidated notes – Other notes
The following table shows the carrying amounts of assets relating to unconsolidated structured entities and the maximum possible loss that could result from these exposures.
Maximum risk of loss as of 31 December 2025
|
|
Loans and advances to customers |
Securities and investments |
Other assets | Contingent |
||||||||||||||||||||||||||||
| EUR in millions | EUR in millions | EUR in millions | EUR in millions |
|||||||||||||||||||||||||||||
| Carrying amount |
1,429 | 7,452 | 1 | 23,966 |
||||||||||||||||||||||||||||
| Risk and other provisions | 12 | 0 | 0 | 0 | ||||||||||||||||||||||||||||
| Max. risk of loss | 1,4171) | 7,452 | 1 | 23,9652) | ||||||||||||||||||||||||||||
Maximum risk of loss as of 31 December 2024
|
|
Loans and advances to customers |
Securities and investments |
Other assets | Contingent |
||||||||||||||||||||||||||||
| EUR in millions | EUR in millions | EUR in millions | EUR in millions |
|||||||||||||||||||||||||||||
| Carrying amount |
1,535 | 6,908 | 1 | 24,273 |
||||||||||||||||||||||||||||
| Risk and other provisions | 18 | 0 | 0 | 0 | ||||||||||||||||||||||||||||
| Max. risk of loss | 1,5171) | 6,908 | 1 | 24,2732) | ||||||||||||||||||||||||||||
| 1), 2) | The hydrogen core network mandated transaction results in loans and advances to customers of EUR 176 million of as 31 December 2025 (31 Dec. 2024: EUR 4 million). Irrevocable loan commitments include available funds of EUR 23,828 million (EUR 23,996 million). There is no risk of loss due to the federal guarantee. The company operating in the context of the mandated transaction was ranked as a structured entity for the first time in 2025; the prior-year figures have been adjusted accordingly. |
The maximum risk of loss is equal to the nominal amount for credit lines, (financial) guarantees and other liquidity facilities minus the provisions for credit risks recognised in the statement of financial position. The maximum risk of loss relating to the group’s investments is their carrying amount (net). The maximum risk of loss does not include effects from the group’s hedging instruments used to reduce the maximum risk of loss.
No support is provided to structured entities in the group beyond the respective financing.
In exceptional cases, the group acts as sponsor for structured entities in which it holds shares purely on a trust basis on behalf of the Federal Government. The risk of these structured entities lies exclusively with the Federal Government. In such cases, the group is considered the sponsor of the structured entities because the entities were initiated and/or structured by the group on behalf of the Federal Government.
167
KfW Financial Report 2025
Financial Report > Combined Management Report > Consolidated notes – Other notes
(73) Disclosures on shareholdings
Subsidiaries included in the consolidated financial statements
| Name/registered office | Share held |
Equity (IFRS) as of 31 Dec. 2025 |
Equity (IFRS) as of 31 Dec. 2024 |
|||||||||||||||||||||
| % |
EUR in millions |
EUR in millions |
||||||||||||||||||||||
| KfW IPEX-Bank GmbH, Frankfurt am Main | 100.0 |
4,793 |
5,079 |
|||||||||||||||||||||
| DEG – Deutsche Investitions- und Entwicklungsgesellschaft mbH, Cologne | 100.0 |
3,189 |
3,155 |
|||||||||||||||||||||
| KfW IPEX-Beteiligungsholding GmbH, Frankfurt am Main |
100.0 |
4,115 |
3,321 |
|||||||||||||||||||||
| Interkonnektor GmbH, Frankfurt am Main, Germany |
100.0 |
41 |
38 |
|||||||||||||||||||||
| KfW Capital GmbH & Co. KG, Frankfurt am Main, Germany | 100.0 |
1,728 |
1,234 |
|||||||||||||||||||||
| KfW IPEX-Bank Asia Ltd., Singapore |
100.0 | 14 | 14 | |||||||||||||||||||||
Associates included in the consolidated financial statements using the equity method
| Name/registered office | Share held |
Equity as of 30 Sept. |
Equity as of 30 Sept. 2024 |
|||||||||||||||||||||
| % |
EUR in millions |
EUR in millions |
||||||||||||||||||||||
| Green for Growth Fund, Southeast Europe S. A., Luxembourg | 10.4 |
739 |
744 |
|||||||||||||||||||||
| coparion GmbH & Co. KG, Cologne | 16.4 |
249 |
342 |
|||||||||||||||||||||
| Name/registered office | Share held | Equity | Equity | |||||||||||||||||||||
|
|
as of 31 Dec. 2025 |
as of 31 Dec. 2024 |
||||||||||||||||||||||
| % |
EUR in millions |
EUR in millions |
||||||||||||||||||||||
| DC Nordseekabel GmbH und Co. KG, Bayreuth | 50.0 | 685 | 727 | |||||||||||||||||||||
Green for Growth Fund, Southeast Europe S.A. (GGF) has been included in the consolidated financial statements using the equity method since 2010. GGF is a fund to promote SME and private household investment in energy efficiency and renewable energy in the Western Balkans and Turkey (business sector KfW Development Bank).
DC Nordseekabel GmbH und Co. KG (DC Nordseekabel) was accounted for using the equity method, as a joint venture of Interkonnektor GmbH (Nordseekabel-Projekt NordLink in the business sector Export and project finance), for the first time in financial year 2015. The NordLink project is one of the major projects in the European energy sector and represents an investment volume of around EUR 1.5 to 2 billion. As it will primarily serve as a conduit for renewably sourced energy, the underwater cable will play an important role in the success of Germany’s energy transition. Norwegian state-owned power grid operator Statnett, KfW and the transmission systems operator TenneT, which is responsible for the German territory of the North Sea, concluded a cooperation agreement in February 2015 to construct an underwater cable between Germany and Norway. The NordLink project will be realised by a syndicate in which Statnett and DC Nordseekabel each hold a 50% stake. KfW – via its subsidiary Interkonnektor GmbH – and TenneT each hold a 50% stake in DC Nordseekabel, which is responsible for construction and obtaining permits in Germany.
coparion GmbH & Co. KG (coparion; business sector KfW Capital) as an associated company was accounted for using the equity method for the first time in financial year 2016. This co-investment fund by KfW and the German Federal Ministry for Economic Affairs and Energy (BMWE) participated in young technology companies by offering venture capital, together with private lead investors, and is now in the divestment phase.
168
KfW Financial Report 2025
Financial Report > Combined Management Report > Consolidated notes – Other notes
Entities not included in the consolidated financial statements
Six subsidiaries, one joint venture, and five associated companies of minor significance to the presentation of the net assets, financial and earnings position of KfW Group have not been consolidated. Instead, they are shown in the statement of financial position under Securities and investments. These companies account for approximately 0.03% of KfW Group’s total assets.
List of KfW Group shareholdings as of 31 December 2025
| No. | Name | Place | Capital | CC1) | Exchange rate | Equity in | Net income in | |||||||||||||||||
| share | EUR 1.00 | TCU2), 3) | TCU2), 3) | |||||||||||||||||||||
| in % | = CU as of | |||||||||||||||||||||||
|
|
|
|
|
|
31 Dec. 20252) |
|
|
|||||||||||||||||
| KfW shareholdings |
| |||||||||||||||||||||||
|
|
||||||||||||||||||||||||
| A. Fully consolidated subsidiaries included in the consolidated financial statements |
| |||||||||||||||||||||||
| 1 |
DEG – Deutsche Investitions- und Entwicklungsgesellschaft mbH |
Cologne | 100.0 | EUR | 1.00 | 2,561,669 | –17,344 | |||||||||||||||||
| 2 | Interkonnektor GmbH | Frankfurt | ||||||||||||||||||||||
|
|
|
am Main | 100.0 | EUR | 1.00 | 38,498 | –15,944 | |||||||||||||||||
| 3 | KfW Beteiligungsholding GmbH | Frankfurt | ||||||||||||||||||||||
|
|
|
am Main | 100.0 | EUR | 1.00 | 2,888,975 | 571,630 | |||||||||||||||||
| 4 | KfW Capital GmbH & Co. KG | Frankfurt | ||||||||||||||||||||||
| am Main | 100.0 | EUR | 1.00 | 1,117,101 | 0 | |||||||||||||||||||
|
|
||||||||||||||||||||||||
| B. Subsidiaries not included in the consolidated financial statements |
| |||||||||||||||||||||||
| 5 |
Finanzierungs- und Beratungsgesellschaft mbH |
Berlin | 100.0 | EUR | 1.00 | 6,072 | 288 | |||||||||||||||||
| 6 | tbg Technologie- Beteiligungsgesellschaft mbH | Bonn | 100.0 | EUR | 1.00 | 81,761 | 3,411 | |||||||||||||||||
|
|
||||||||||||||||||||||||
| C. Other shareholdings (only capital shares totalling at least 20%) |
| |||||||||||||||||||||||
| 7 | Berliner Energieagentur GmbH | Berlin | 25.0 | EUR | 1.00 | 6,613 | –989 | |||||||||||||||||
|
|
||||||||||||||||||||||||
| Shareholdings of KfW IPEX-Bank GmbH |
|
|||||||||||||||||||||||
|
|
||||||||||||||||||||||||
| A. Fully consolidated subsidiaries included in the consolidated financial statements |
|
|||||||||||||||||||||||
|
|
||||||||||||||||||||||||
| 1 | KfW IPEX-Bank Asia Ltd. | Singapore, | ||||||||||||||||||||||
| Singapore | 100.0 | SGD | 1.51 | 19,980 | 1,864 | |||||||||||||||||||
|
|
||||||||||||||||||||||||
| B. Subsidiaries not included in the consolidated financial statements |
| |||||||||||||||||||||||
| 2 | KFW Bankengruppe Representações Ltda. | São Paulo, Brazil |
50.0 | BRL | 6.44 | 953 | 926 | |||||||||||||||||
|
|
||||||||||||||||||||||||
169
KfW Financial Report 2025
Financial Report > Combined Management Report > Consolidated notes – Other notes
List of KfW Group shareholdings as of 31 December 2025
| No. | Name | Place | Capital | CC1) | Exchange rate | Equity in | Net income in | |||||||||||||||||
| share | EUR 1.00 | TCU2), 3) | TCU2), 3) | |||||||||||||||||||||
| in % | = CU as of | |||||||||||||||||||||||
|
|
|
|
|
|
31 Dec. 20252) |
|
|
|||||||||||||||||
| Shareholdings of KfW Beteiligungsholding GmbH |
|
|||||||||||||||||||||||
|
|
||||||||||||||||||||||||
| A. Fully consolidated subsidiaries included in the consolidated financial statements |
| |||||||||||||||||||||||
| 1 | KfW IPEX-Bank GmbH | Frankfurt am | ||||||||||||||||||||||
|
|
|
Main | 100.0 | EUR | 1.00 | 3,529,335 | 0 | |||||||||||||||||
| Shareholdings of DEG – Deutsche Investitions- und Entwicklungsgesellschaft mbH |
|
|||||||||||||||||||||||
|
|
||||||||||||||||||||||||
| A. Subsidiaries not included in the consolidated financial statements |
| |||||||||||||||||||||||
| 1 |
DEG Impact GmbH |
Cologne | 100.0 | EUR | 1.00 | 4,053 | 399 | |||||||||||||||||
| 2 |
DEG Impact GmbH |
Cologne | 100.0 | EUR | 1.00 | 3,000 | 454 | |||||||||||||||||
| 3 | KFW Bankengruppe Representações Ltda. |
São Paulo, Brazil |
50.0 | BRL | 6.44 | 953 | 926 | |||||||||||||||||
|
|
||||||||||||||||||||||||
| B. Other shareholdings (only capital shares totalling at least 20%) |
|
|||||||||||||||||||||||
|
|
||||||||||||||||||||||||
| 4 | Ace Power Embilipitiya Pvt Ltd. | Colombo, Sri | ||||||||||||||||||||||
|
|
|
Lanka | 26.0 | LKR | 363.64 | 4,025,462 | –250,325 | |||||||||||||||||
| 5 | ADP Enterprises W.L.L. | Manama, | ||||||||||||||||||||||
|
|
|
Bahrain | 23.3 | BHD | 0.44 | 207,021 | –22,398 | |||||||||||||||||
| 6 | ADP II Holding 11 S.à.r.l. | Luxembourg, | ||||||||||||||||||||||
|
|
|
Luxembourg | 22.2 | USD | 1.18 | 55,529 | 22 | |||||||||||||||||
| 7 | AEP China Hydro Ltd. | Ebène CyberCity, | ||||||||||||||||||||||
|
|
|
Mauritius | 30.2 | USD | 1.18 | 292 | –104 | |||||||||||||||||
| 8 | AfricInvest III – SPV 1 | Port Louis, | ||||||||||||||||||||||
|
|
|
Mauritius | 21.8 | EUR | 1.00 | 57,138 | 5,564 | |||||||||||||||||
| 9 |
Agrofundo Brasil VI Fundo de Investimento em Participações Multiestratégia |
São Paulo, Brazil |
29.9 | BRL | 6.44 | 34,768 | 5,998 | |||||||||||||||||
| 10 |
AO Bucharagips |
Kogon, Uzbekistan |
24.9 | UZS | 14,099.78 | 132,739,977 | 101,408,574 | |||||||||||||||||
| 11 | Apis Growth 2 Ltd. | Ebène CyberCity, | ||||||||||||||||||||||
|
|
|
Mauritius | 25.6 | USD | 1.18 | 37,197 | –1,165 | |||||||||||||||||
| 12 |
CGFT Capital Pooling GmbH & Co. KG |
Berlin, Germany | 40.0 | EUR | 1.00 | 43 | –3 | |||||||||||||||||
| 13 |
Evonik Lanxing (Rizhao) Chemical Industrial Co. Ltd. |
Rizhao, China | 41.0 | CNY | 8.23 | 120,021 | –36,016 | |||||||||||||||||
| 14 | Grand Bremner Corp Pte. Ltd. | Singapore, | ||||||||||||||||||||||
|
|
|
Singapore | 23.3 | USD | 1.18 | 61,227 | –1,631 | |||||||||||||||||
| 15 | Greater Pacific Capital MIV Ltd. | George Town, | ||||||||||||||||||||||
|
|
|
Cayman Islands | 26.7 | USD | 1.18 | 42,039 | 12,124 | |||||||||||||||||
| 16 | Knauf Gips Buchara OOO | Bukhara, | ||||||||||||||||||||||
|
|
|
Uzbekistan | 24.9 | UZS | 14,099.78 | 557,319,702 | 115,339,037 | |||||||||||||||||
| 17 | Knauf Gypsum Philippines Inc., | Calaca, | ||||||||||||||||||||||
|
|
|
Philippines | 25.0 | PHP | 69.27 | 1,739,717 | 90,801 | |||||||||||||||||
| 18 | Landsberg Investments LLC | Wilmington, New Castle, |
||||||||||||||||||||||
|
|
|
USA | 52.9 | USD | 1.18 | 4) | 4) | |||||||||||||||||
| 19 | MC II Pasta Ltd. | Ta’ Xbiex, | ||||||||||||||||||||||
|
|
|
Malta | 32.2 | EUR | 1.00 | 6,475 | –1,343 | |||||||||||||||||
| 20 |
Metier Retailability en Commandite Partnership |
Dunkeld, South Africa |
22.1 | ZAR | 19.44 | 830,435 | –167,967 | |||||||||||||||||
| 21 | Novel Sky Global Limited | Road Town, British Virgin |
||||||||||||||||||||||
|
|
|
Islands | 25.0 | USD | 1.18 | 4) | 4) | |||||||||||||||||
| 22 | OAO Belgips | Minsk, | ||||||||||||||||||||||
|
|
|
Belarus | 50.0 | BYN | 3.45 | 32,351 | –612 | |||||||||||||||||
| 23 | Onstar Galaxy SPV Pte. Ltd. | Singapore, | ||||||||||||||||||||||
| Singapore | 33.1 | USD | 1.18 | 37,293 | –1,640 | |||||||||||||||||||
170
KfW Financial Report 2025
Financial Report > Consolidated financial statements > Consolidated notes – Other notes
List of KfW Group shareholdings as of 31 December 2025
| No. | Name | Place | Capital | CC1) | Exchange rate | Equity in | Net income in | |||||||||||||||||
| share | EUR 1.00 | TCU2), 3) | TCU2), 3) | |||||||||||||||||||||
| in % | = CU as of | |||||||||||||||||||||||
|
|
|
|
|
|
31 Dec. 20252) |
|
|
|||||||||||||||||
| Shareholdings of DEG – Deutsche Investitions- und Entwicklungsgesellschaft mbH |
|
|||||||||||||||||||||||
|
|
||||||||||||||||||||||||
| B. Other shareholdings (only capital shares totalling at least 20%) |
| |||||||||||||||||||||||
| 24 |
Osmanthus II Cayman Investment, L.P. |
Grand Cayman, Cayman Islands |
100.0 | USD | 1.18 | 18,593 | 4,812 | |||||||||||||||||
| 25 |
Stratus SCP Fleet Fundo de Investimento em Participações – Multiestratégia |
São Paulo, Brazil |
39.7 | BRL | 6.44 | 97,996 | 14,451 | |||||||||||||||||
| 26 | Thebes B.V. | Cairo, | ||||||||||||||||||||||
|
|
|
Egypt | 38.7 | EGP | 56.03 | 2,341,246 | 551,810 | |||||||||||||||||
| 27 | TOO Isi Gips Inder | Inderborskiy, | ||||||||||||||||||||||
|
|
|
Kazakhstan | 40.0 | KZT | 595.97 | 1,377,788 | 99,207 | |||||||||||||||||
| 28 | TOO Knauf Gips Kapchagay Enterprise | Kapchagay, | ||||||||||||||||||||||
|
|
with DEG participation |
Kazakhstan | 40.0 | KZT | 595.97 | 16,578,872 | 6,756,013 | |||||||||||||||||
| 29 | Vietnam Opportunity Fund II PTE. Ltd. | Singapore, | ||||||||||||||||||||||
|
|
|
Singapore | 32.0 | USD | 1.18 | 48,525 | 2,324 | |||||||||||||||||
| 30 | Whitlam Holding PTE. Ltd. | Singapore, | ||||||||||||||||||||||
|
|
|
Singapore | 38.7 | USD | 1.18 | 38,702 | –10,143 | |||||||||||||||||
| 31 | Worldwide Group, Inc | Charlestown, Saint Kitts |
||||||||||||||||||||||
|
|
|
and Nevis | 33.4 | USD | 1.18 | 33,528 | 2,609 | |||||||||||||||||
| 32 | wpd Duqueco S.p.A. | Santiago, | ||||||||||||||||||||||
|
|
|
Chile | 24.5 | CLP | 1,057.84 | 32,903 | 1,277 | |||||||||||||||||
| 33 | wpd Malleco S.p.A. | Santiago, | ||||||||||||||||||||||
|
|
|
Chile | 24.5 | CLP | 1,057.84 | 101,593 | –5,123 | |||||||||||||||||
| 34 | wpd Negrete S.p.A. | Santiago, | ||||||||||||||||||||||
| Chile | 24.5 | CLP | 1,057.84 | 13,052 | –740 | |||||||||||||||||||
|
|
||||||||||||||||||||||||
| Shareholdings of Interkonnektor GmbH |
|
|||||||||||||||||||||||
|
|
||||||||||||||||||||||||
| A. Joint ventures included in the consolidated financial statements |
|
|||||||||||||||||||||||
|
|
||||||||||||||||||||||||
| 1 | DC Nordseekabel GmbH & Co. KG | Bayreuth | 50.0 | EUR | 1.00 | 684,527 | 27,165 | |||||||||||||||||
|
|
||||||||||||||||||||||||
| B. Joint ventures not included in the consolidated financial statements |
|
|||||||||||||||||||||||
|
|
||||||||||||||||||||||||
| 2 | DC Nordseekabel Beteiligungs GmbH | Bayreuth | 50.0 | EUR | 1.00 | 78 | 3 | |||||||||||||||||
|
|
||||||||||||||||||||||||
| Shareholdings of KfW Capital GmbH & Co. KG |
|
|||||||||||||||||||||||
|
|
||||||||||||||||||||||||
| A. Subsidiaries not included in the consolidated financial statements |
|
|||||||||||||||||||||||
|
|
||||||||||||||||||||||||
| 1 | KfW Capital Verwaltungs GmbH | Frankfurt | ||||||||||||||||||||||
| am Main | 100.0 | EUR | 1.00 | 42 | 1 | |||||||||||||||||||
| 1) | ISO currency code |
| 2) | CU = currency units in local currency; TCU = thousand currency units in local currency |
| 3) | Financial statements prepared in accordance with local financial reporting framework |
| 4) | No current annual financial statements are available. |
(74) Events after the balance sheet date
On 28 February 2026, Israel and the USA commenced air strikes on targets in Iran. This was followed by air attacks from Iran on Israel and other targets in the region. Based on the current perspective, KfW does not expect any significant direct or indirect impacts from the conflict on its net assets, financial and earnings position. It is not really possible to give a reliable forecast of the overall impact on the net assets, financial and earnings position at present, given the dynamic development, particularly concerning uncertain further escalation or de-escalation steps of the military conflict in the region. KfW will continue to closely monitor the development of the conflict and the consequences for KfW’s business.
No further events of particular impact on KfW’s net assets, financial and earnings position occurred after the end of the financial year.
171
KfW Financial Report 2025
Financial Report > Attestations > Independent auditor’s report
To Kreditanstalt für Wiederaufbau Anstalt des öffentlichen Rechts, Frankfurt am Main/Germany
REPORT ON THE AUDIT OF THE CONSOLIDATED FINANCIAL STATEMENTS AND
OF THE COMBINED MANAGEMENT REPORT
Audit Opinions
We have audited the consolidated financial statements of Kreditanstalt für Wiederaufbau Anstalt des öffentlichen Rechts, Frankfurt am Main/Germany, and its subsidiaries (the Group), which comprise the statement of financial position as at 31 December 2025, the consolidated statement of comprehensive income, the consolidated statement of changes in equity and the consolidated statement of cash flows for the financial year from 1 January to 31 December 2025, and the notes to the consolidated financial statements, including material accounting policy information. In addition, we have audited the combined management report for the parent and the group of Kreditanstalt für Wiederaufbau Anstalt des öffentlichen Rechts, Frankfurt am Main/Germany, for the financial year from 1 January to 31 December 2025. In accordance with the German legal requirements, we have not audited the content of the separate combined non-financial report of KfW as the parent company and the group in accordance with Section 289b to Section 289e, Section 315b and Section 315c German German Commercial Code (HGB), which is referred to in the section “Non-financial statement” of the combined management report.
In our opinion, on the basis of the knowledge obtained in the audit,
| ● | the accompanying consolidated financial statements comply, in all material respects, with the IFRS® Accounting Standards issued by the International Accounting Standards Board (IASB) (hereinafter “IFRS Accounting Standards”) as adopted by the EU and the additional requirements of German commercial law pursuant to Section 315e (1) HGB and, in compliance with these requirements, give a true and fair view of the assets, liabilities and financial position of the Group as at 31 December 2025 and of its financial performance for the financial year from 1 January to 31 December 2025, and |
| ● | the accompanying combined management report as a whole provides an appropriate view of the Group’s position. In all material respects, this combined management report is consistent with the consolidated financial statements, complies with German legal requirements and appropriately presents the opportunities and risks of future development. Our audit opinion on the combined management report does not cover the contents of the combined non-financial report of KfW as the parent company and the group in accordance with Section 289b to Section 289e, Section 315b and Section 315c HGB referred to above. |
Pursuant to Section 322 (3) sentence 1 HGB, we declare that our audit has not led to any reservations relating to the legal compliance of the consolidated financial statements and of the combined management report.
Basis for the Audit Opinions
We conducted our audit of the consolidated financial statements and of the combined management report in accordance with Section 317 HGB and in compliance with German Generally Accepted Standards for Financial Statement Audits promulgated by the Institut der Wirtschaftsprüfer (IDW). Our responsibilities under those requirements and principles are further described in the “Auditor’s Responsibilities for the Audit of the Consolidated Financial Statements and of the Combined Management Report” section of our auditor’s report. We are independent of the group entities in accordance with the requirements of German commercial and professional law, and we have fulfilled our other German professional responsibilities in accordance with these requirements. We believe that the audit evidence we have obtained is sufficient and appropriate to provide a basis for our audit opinions on the consolidated financial statements and on the combined management report.
173
KfW Financial Report 2025
Financial Report > Attestations > Independent auditor’s report
Other Information
The executive directors and/or the board of supervisory directors are responsible for the other information. The other information comprises
| ● | the report of the board of supervisory directors which is expected to be presented to us after the date of this auditor’s report, |
| ● | the separate combined non-financial report of KfW as the parent company and the group in accordance with Section 289b to Section 289e, Section 315b and Section 315c HGB, which is referred to in the section “Non-financial statement” of the combined management report, |
| ● | the corporate governance report, which also includes the “Declaration of compliance”, which is referred to in the section “Declaration of compliance” of the combined management report and which is expected to be presented to us only after the date of this auditor’s report, |
| ● | the executive directors’ confirmation in accordance with Section 297 (2) sentence 4 and Section 315 (1) sentence 5 HGB regarding the consolidated financial statements and the combined management report, and |
| ● | all other parts of the annual report, |
| ● | but not the consolidated financial statements, not the audited content of the disclosures in the combined management report and not our auditor’s report thereon. |
The board of supervisory directors is responsible for the report of the board of supervisory directors. In accordance with Section 19 of the KfW Bylaws, the executive directors and the board of supervisory directors are required to annually declare that they recognise the Federal Public Corporate Governance Code as amended and to publish the declaration of compliance as part of the corporate governance report. Otherwise, the executive directors are responsible for the other information.
Our audit opinions on the consolidated financial statements and on the combined management report do not cover the other information, and consequently we do not express an audit opinion or any other form of assurance conclusion thereon.
In connection with our audit, our responsibility is to read the other information identified above and, in doing so, to consider whether the other information
| ● | is materially inconsistent with the consolidated financial statements, with the audited content of the disclosures in the combined management report or our knowledge obtained in the audit, or |
| ● | otherwise appears to be materially misstated. |
Responsibilities of the Executive Directors and the Board of Supervisory Directors for the Consolidated Financial Statements and the Combined Management Report
The executive directors are responsible for the preparation of the consolidated financial statements that comply, in all material respects, with IFRS Accounting Standards as adopted by the EU and the additional requirements of German commercial law pursuant to Section 315e (1) HGB, and that the consolidated financial statements, in compliance with these requirements, give a true and fair view of the assets, liabilities, financial position and financial performance of the Group. In addition, the executive directors are responsible for such internal control as they have determined necessary to enable the preparation of consolidated financial statements that are free from material misstatement, whether due to fraud (i.e. fraudulent financial reporting and misappropriation of assets) or error.
In preparing the consolidated financial statements, the executive directors are responsible for assessing the Group’s ability to continue as a going concern. They also have the responsibility for disclosing, as applicable, matters related to going concern. In addition, they are responsible for financial reporting based on the going concern basis of accounting unless there is an intention to liquidate the Group or to cease operations, or there is no realistic alternative but to do so.
174
KfW Financial Report 2025
Financial Report > Attestations > Independent auditor’s report
Furthermore, the executive directors are responsible for the preparation of the combined management report that as a whole provides an appropriate view of the Group’s position and is, in all material respects, consistent with the consolidated financial statements, complies with German legal requirements, and appropriately presents the opportunities and risks of future development. In addition, the executive directors are responsible for such arrangements and measures (systems) as they have considered necessary to enable the preparation of a combined management report that is in accordance with the applicable German legal requirements, and to be able to provide sufficient appropriate evidence for the assertions in the combined management report.
The board of supervisory directors is responsible for overseeing the Group’s financial reporting process for the preparation of the consolidated financial statements and of the combined management report.
Auditor’s Responsibilities for the Audit of the Consolidated Financial Statements and of the Combined Management Report
Our objectives are to obtain reasonable assurance about whether the consolidated financial statements as a whole are free from material misstatement, whether due to fraud or error, and whether the combined management report as a whole provides an appropriate view of the Group’s position and, in all material respects, is consistent with the consolidated financial statements and the knowledge obtained in the audit, complies with the German legal requirements and appropriately presents the opportunities and risks of future development, as well as to issue an auditor’s report that includes our audit opinions on the consolidated financial statements and on the combined management report.
Reasonable assurance is a high level of assurance, but is not a guarantee that an audit conducted in accordance with Section 317 HGB and in compliance with German Generally Accepted Standards for Financial Statement Audits promulgated by the Institut der Wirtschaftsprüfer (IDW) will always detect a material misstatement. Misstatements can arise from fraud or error and are considered material if, individually or in the aggregate, they could reasonably be expected to influence the economic decisions of users taken on the basis of these consolidated financial statements and this combined management report.
We exercise professional judgement and maintain professional scepticism throughout the audit. We also:
| ● | identify and assess the risks of material misstatement of the consolidated financial statements and of the combined management report, whether due to fraud or error, design and perform audit procedures responsive to those risks, and obtain audit evidence that is sufficient and appropriate to provide a basis for our audit opinions. The risk of not detecting a material misstatement resulting from fraud is higher than the risk of not detecting a material misstatement resulting from error, as fraud may involve collusion, forgery, intentional omissions, misrepresentations, or the override of internal control. |
| ● | obtain an understanding of internal control relevant to the audit of the consolidated financial statements and of arrangements and measures relevant to the audit of the combined management report in order to design audit procedures that are appropriate in the circumstances, but not for the purpose of expressing an audit opinion on the effectiveness of internal control or these arrangements and measures of the Group. |
| ● | evaluate the appropriateness of accounting policies used by the executive directors and the reasonableness of estimates made by the executive directors and related disclosures. |
| ● | conclude on the appropriateness of the executive directors’ use of the going concern basis of accounting and, based on the audit evidence obtained, whether a material uncertainty exists related to events or conditions that may cast significant doubt on the Group’s ability to continue as a going concern. If we conclude that a material uncertainty exists, we are required to draw attention in the auditor’s report to the related disclosures in the consolidated financial statements and in the combined management report or, if such disclosures are inadequate, to modify our respective audit opinions. Our conclusions are based on the audit evidence obtained up to the date of our auditor’s report. However, future events or conditions may cause the Group to cease to be able to continue as a going concern. |
175
KfW Financial Report 2025
Financial Report > Attestations > Independent auditor’s report
| ● | evaluate the overall presentation, structure and content of the consolidated financial statements, including the disclosures, and whether the consolidated financial statements present the underlying transactions and events in a manner that the consolidated financial statements give a true and fair view of the assets, liabilities, financial position and financial performance of the Group in compliance with IFRS Accounting Standards as adopted by the EU and with the additional requirements of German commercial law pursuant to Section 315e (1) HGB. |
| ● | plan and perform the audit of the consolidated financial statements in order to obtain sufficient appropriate audit evidence regarding the financial information of the entities or of the business activities within the Group, which serves as a basis for forming audit opinions on the consolidated financial statements and on the combined management report. We are responsible for the direction, supervision and inspection of the audit procedures performed for the purposes of the group audit. We remain solely responsible for our audit opinions. |
| ● | evaluate the consistency of the combined management report with the consolidated financial statements, its conformity with German law, and the view of the Group’s position it provides. |
| ● | perform audit procedures on the prospective information presented by the executive directors in the combined management report. On the basis of sufficient appropriate audit evidence we evaluate, in particular, the significant assumptions used by the executive directors as a basis for the prospective information, and evaluate the proper derivation of the prospective information from these assumptions. We do not express a separate audit opinion on the prospective information and on the assumptions used as a basis. There is a substantial unavoidable risk that future events will differ materially from the prospective information. |
We communicate with those charged with governance regarding, among other matters, the planned scope and timing of the audit and significant audit findings, including any significant deficiencies in internal control that we identify during our audit.
OTHER LEGAL AND REGULATORY REQUIREMENTS
Report on the Audit of the Electronic Reproductions of the Consolidated Financial Statements and of the Combined Management Report Prepared for Publication Pursuant to Section 317 (3a) HGB
Audit Opinion
We have performed assurance work in accordance with Section 317 (3a) HGB to obtain reasonable assurance whether the electronic reproductions of the consolidated financial statements and of the combined management report (hereinafter referred to as “ESEF documents”) prepared for publication, contained in the file, which has the SHA-256 value d84b219d35845ae59119cd011f5c50d1959786cdd1bb28c8b25e72593b576c48, meet, in all material respects, the requirements for the electronic reporting format pursuant to Section 328 (1) HGB (“ESEF format”). In accordance with the German legal requirements, this assurance work only covers the conversion of the information contained in the consolidated financial statements and the combined management report into the ESEF format, and therefore covers neither the information contained in these electronic reproductions nor any other information contained in the file identified above.
In our opinion, the electronic reproductions of the consolidated financial statements and of the combined management report prepared for publication contained in the file identified above meet, in all material respects, the requirements for the electronic reporting format pursuant to Section 328 (1) HGB. Beyond this assurance opinion and our audit opinions on the accompanying consolidated financial statements and on the accompanying combined management report for the financial year from 1 January to 31 December 2025 contained in the “Report on the Audit of the Consolidated Financial Statements and of the Combined Management Report” above, we do not express any assurance opinion on the information contained within these electronic reproductions or on any other information contained in the file identified above.
176
KfW Financial Report 2025
Financial Report > Attestations > Independent auditor’s report
Basis for the Audit Opinion
We conducted our assurance work on the electronic reproductions of the consolidated financial statements and of the combined management report contained in the file identified above in accordance with Section 317 (3a) HGB and on the basis of the IDW Assurance Standard: Assurance Work the Electronic Reproductions of Financial Statements and Management Reports Prepared for Publication Purposes Pursuant to Section 317 (3a) HGB (IDW AsS 410 (06.2022)). Our responsibilities in this context are further described in the “Group Auditor’s Responsibilities for the Assurance Work on the ESEF Documents” section. Our audit firm has applied the requirements of the IDW Quality Management Standards.
Responsibilities of the Executive Directors and the Board of Supervisory Directors for the ESEF Documents
The executive directors of the parent are responsible for the preparation of the ESEF documents based on the electronic files of the consolidated financial statements and of the combined management report according to Section 328 (1) sentence 4 no. 1 HGB and for the tagging of the consolidated financial statements according to Section 328 (1) sentence 4 no. 2 HGB.
In addition, the executive directors of the parent are responsible for such internal control that they have considered necessary to enable the preparation of ESEF documents that are free from material intentional or unintentional non-compliance with the requirements for the electronic reporting format pursuant to Section 328 (1) HGB.
The board of supervisory directors is responsible for overseeing the process for preparing the ESEF documents as part of the financial reporting process.
Group Auditor’s Responsibilities for the Audit of the ESEF Documents
Our objective is to obtain reasonable assurance about whether the ESEF documents are free from material intentional or unintentional non-compliance with the requirements of Section 328 (1) HGB. We exercise professional judgement and maintain professional scepticism throughout the assurance work. We also:
| ● | identify and assess the risks of material intentional or unintentional non-compliance with the requirements of Section 328 (1) HGB, design and perform assurance procedures responsive to those risks, and obtain assurance evidence that is sufficient and appropriate to provide a basis for our assurance opinion. |
| ● | obtain an understanding of internal control relevant to the assurance work on the ESEF documents in order to design assurance procedures that are appropriate in the circumstances, but not for the purpose of expressing an assurance opinion on the effectiveness of these controls. |
| ● | evaluate the technical validity of the ESEF documents, i.e. whether the file containing the ESEF documents meets the requirements of the Delegated Regulation (EU) 2019/815, in the version in force at the balance sheet date, on the technical specification for this electronic file. |
| ● | evaluate whether the ESEF documents enable an XHTML reproduction with content equivalent to the audited consolidated financial statements and to the audited combined management report. |
| ● | evaluate whether the tagging of the ESEF documents with Inline XBRL technology (iXBRL) in accordance with the requirements of Articles 4 and 6 of the Delegated Regulation (EU) 2019/815, in the version in force at the balance sheet date, enables an appropriate and complete machine-readable XBRL copy of the XHTML reproduction. |
177
KfW Financial Report 2025
Financial Report > Attestations > Independent auditor’s report
OTHER MATTER – USE OF THE AUDITOR’S REPORT
Our auditor’s report must always be read together with the audited consolidated financial statements and the audited combined management report as well as with the assured ESEF documents. The consolidated financial statements and the combined management report converted into the ESEF format – including the versions to be submitted for inclusion in the Company Register – are merely electronic reproductions of the audited consolidated financial statements and the audited combined management report and do not take their place. In particular, the ESEF report and our assurance opinion contained therein are to be used solely together with the assured ESEF documents made available in electronic form.
Frankfurt am Main/Germany, 5 March 2026
Deloitte GmbH
Wirtschaftsprüfungsgesellschaft
| Signed: | Signed: | |||
| Prof. Dr Carl-Friedrich Leuschner | Christian Schweitzer | |||
| Wirtschaftsprüfer | Wirtschaftsprüfer | |||
| (German Public Auditor) | (German Public Auditor) |
178
KfW Financial Report 2025