Shareholder Report
|
6 Months Ended |
|
Feb. 28, 2026
USD ($)
Holding
|
|---|
| Shareholder Report [Line Items] |
|
| Document Type |
N-CSRS
|
| Amendment Flag |
false
|
| Registrant Name |
SEI TAX EXEMPT TRUST
|
| Entity Central Index Key |
0000701817
|
| Entity Investment Company Type |
N-1A
|
| Document Period End Date |
Feb. 28, 2026
|
| C000017636 |
|
| Shareholder Report [Line Items] |
|
| Fund Name |
Intermediate-Term Municipal Fund
|
| Class Name |
Class F
|
| Trading Symbol |
SEIMX
|
| Annual or Semi-Annual Statement [Text Block] |
Semi-Annual Shareholder Report
|
| Shareholder Report Annual or Semi-Annual |
semi-annual shareholder report
|
| Additional Information [Text Block] |
This semi-annual shareholder report contains important information about Class F Shares of the Intermediate-Term Municipal Fund (the "Fund") for the period from September 1, 2025 to February 28, 2026. You can find additional information about the Fund at https://www.seic.com/mutual-fund-documentation/prospectuses-and-reports. You can also request this information by contacting us at (610) 676-1000.
|
| Additional Information Phone Number |
(610) 676-1000
|
| Additional Information Website |
https://www.seic.com/mutual-fund-documentation/prospectuses-and-reports
|
| Expenses [Text Block] |
What were the Fund costs for the last six months?(based on a hypothetical $10,000 investment) Table SummaryFund Name | Costs of a $10,000 investment | Costs paid as a percentage of a $10,000 investment |
|---|
Intermediate-Term Municipal Fund, Class F Shares | $32 | 0.63% |
|---|
|
| Expenses Paid, Amount |
$ 32
|
| Expense Ratio, Percent |
0.63%
|
| AssetsNet |
$ 1,589,122,000
|
| Holdings Count | Holding |
861
|
| Advisory Fees Paid, Amount |
$ 1,486
|
| InvestmentCompanyPortfolioTurnover |
9.00%
|
| Additional Fund Statistics [Text Block] |
Key Fund Statistics as of February 28, 2026Table Summary | Total Net Assets (000's) | Number of Holdings | Total Advisory Fees Paid (000's) | Portfolio Turnover Rate |
|---|
| $1,589,122 | 861 | $1,486 | 9% |
|---|
|
| Holdings [Text Block] |
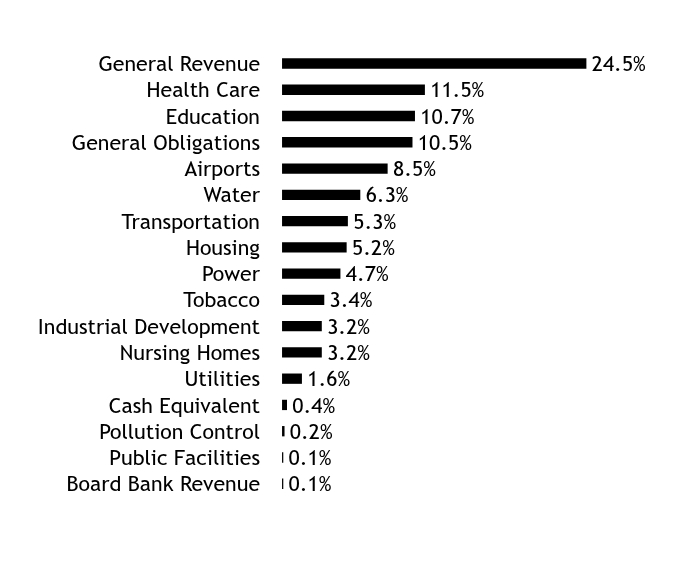
Asset WeightingsFootnote Reference*Table SummaryValue | Value |
|---|
Board Bank Revenue | 0.1% | Public Facilities | 0.1% | Pollution Control | 0.2% | Cash Equivalent | 0.4% | Utilities | 1.6% | Nursing Homes | 3.2% | Industrial Development | 3.2% | Tobacco | 3.4% | Power | 4.7% | Housing | 5.2% | Transportation | 5.3% | Water | 6.3% | Airports | 8.5% | General Obligations | 10.5% | Education | 10.7% | Health Care | 11.5% | General Revenue | 24.5% | | Footnote | Description | Footnote* | Percentages are calculated based on total net assets. |
|
| Largest Holdings [Text Block] |
Table SummaryHolding Name | Coupon Rate | Maturity Date | Percentage of Total
Net AssetsFootnote Reference(A) |
|---|
Southeast Alabama, Energy Authority, Ser E | 5.000%
| 10/01/30
| 0.7% | Wisconsin State, Public Finance Authority, Duke Energy Progress Project | 3.700%
| 10/01/46
| 0.7% | New Jersey State, Tobacco Settlement Financing, Ser A | 5.000%
| 06/01/35
| 0.7% | Massachusetts State, Development Finance Agency, Beth Israel Lahey Health | 5.250%
| 07/01/44
| 0.6% | Pennsylvania State, Economic Development Financing Authority, PENNDOT Major Bridges Project, AMT | 5.000%
| 06/30/34
| 0.6% | Atlanta, Water & Wastewater Revenue Authority, Sub-Ser, BAM | 5.000%
| 11/01/32
| 0.6% | Virginia State, Tobacco Settlement Financing, Sub-Ser C | 0.000%
| 06/01/47
| 0.6% | Puerto Rico, Sales Tax Financing, Sales Tax Revenue, Ser A-1 | 4.550%
| 07/01/40
| 0.5% | Southeast Alabama, Energy Authority, Cooperative District, Ser B | 5.000%
| 09/01/33
| 0.5% | Texas State, Municipal Gas Acquisition & Supply IV, Ser B | 5.500%
| 01/01/54
| 0.5% | | Footnote | Description | Footnote(A) | Cash Equivalents are not shown in the top ten chart. |
|
| C000147417 |
|
| Shareholder Report [Line Items] |
|
| Fund Name |
Intermediate-Term Municipal Fund
|
| Class Name |
Class Y
|
| Trading Symbol |
SINYX
|
| Annual or Semi-Annual Statement [Text Block] |
Semi-Annual Shareholder Report
|
| Shareholder Report Annual or Semi-Annual |
semi-annual shareholder report
|
| Additional Information [Text Block] |
This semi-annual shareholder report contains important information about Class Y Shares of the Intermediate-Term Municipal Fund (the "Fund") for the period from September 1, 2025 to February 28, 2026. You can find additional information about the Fund at https://www.seic.com/mutual-fund-documentation/prospectuses-and-reports. You can also request this information by contacting us at (610) 676-1000.
|
| Additional Information Phone Number |
(610) 676-1000
|
| Additional Information Website |
https://www.seic.com/mutual-fund-documentation/prospectuses-and-reports
|
| Expenses [Text Block] |
What were the Fund costs for the last six months?(based on a hypothetical $10,000 investment) Table SummaryFund Name | Costs of a $10,000 investment | Costs paid as a percentage of a $10,000 investment |
|---|
Intermediate-Term Municipal Fund, Class Y Shares | $19 | 0.38% |
|---|
|
| Expenses Paid, Amount |
$ 19
|
| Expense Ratio, Percent |
0.38%
|
| AssetsNet |
$ 1,589,122,000
|
| Holdings Count | Holding |
861
|
| Advisory Fees Paid, Amount |
$ 1,486
|
| InvestmentCompanyPortfolioTurnover |
9.00%
|
| Additional Fund Statistics [Text Block] |
Key Fund Statistics as of February 28, 2026Table Summary | Total Net Assets (000's) | Number of Holdings | Total Advisory Fees Paid (000's) | Portfolio Turnover Rate |
|---|
| $1,589,122 | 861 | $1,486 | 9% |
|---|
|
| Holdings [Text Block] |
Asset WeightingsFootnote Reference*Table SummaryValue | Value |
|---|
Board Bank Revenue | 0.1% | Public Facilities | 0.1% | Pollution Control | 0.2% | Cash Equivalent | 0.4% | Utilities | 1.6% | Nursing Homes | 3.2% | Industrial Development | 3.2% | Tobacco | 3.4% | Power | 4.7% | Housing | 5.2% | Transportation | 5.3% | Water | 6.3% | Airports | 8.5% | General Obligations | 10.5% | Education | 10.7% | Health Care | 11.5% | General Revenue | 24.5% | | Footnote | Description | Footnote* | Percentages are calculated based on total net assets. |
|
| Largest Holdings [Text Block] |
Table SummaryHolding Name | Coupon Rate | Maturity Date | Percentage of Total
Net AssetsFootnote Reference(A) |
|---|
Southeast Alabama, Energy Authority, Ser E | 5.000%
| 10/01/30
| 0.7% | Wisconsin State, Public Finance Authority, Duke Energy Progress Project | 3.700%
| 10/01/46
| 0.7% | New Jersey State, Tobacco Settlement Financing, Ser A | 5.000%
| 06/01/35
| 0.7% | Massachusetts State, Development Finance Agency, Beth Israel Lahey Health | 5.250%
| 07/01/44
| 0.6% | Pennsylvania State, Economic Development Financing Authority, PENNDOT Major Bridges Project, AMT | 5.000%
| 06/30/34
| 0.6% | Atlanta, Water & Wastewater Revenue Authority, Sub-Ser, BAM | 5.000%
| 11/01/32
| 0.6% | Virginia State, Tobacco Settlement Financing, Sub-Ser C | 0.000%
| 06/01/47
| 0.6% | Puerto Rico, Sales Tax Financing, Sales Tax Revenue, Ser A-1 | 4.550%
| 07/01/40
| 0.5% | Southeast Alabama, Energy Authority, Cooperative District, Ser B | 5.000%
| 09/01/33
| 0.5% | Texas State, Municipal Gas Acquisition & Supply IV, Ser B | 5.500%
| 01/01/54
| 0.5% | | Footnote | Description | Footnote(A) | Cash Equivalents are not shown in the top ten chart. |
|
| C000017624 |
|
| Shareholder Report [Line Items] |
|
| Fund Name |
Short Duration Municipal Fund
|
| Class Name |
Class F
|
| Trading Symbol |
SUMAX
|
| Annual or Semi-Annual Statement [Text Block] |
Semi-Annual Shareholder Report
|
| Shareholder Report Annual or Semi-Annual |
semi-annual shareholder report
|
| Additional Information [Text Block] |
This semi-annual shareholder report contains important information about Class F Shares of the Short Duration Municipal Fund (the "Fund") for the period from September 1, 2025 to February 28, 2026. You can find additional information about the Fund at https://www.seic.com/mutual-fund-documentation/prospectuses-and-reports. You can also request this information by contacting us at (610) 676-1000.
|
| Additional Information Phone Number |
(610) 676-1000
|
| Additional Information Website |
https://www.seic.com/mutual-fund-documentation/prospectuses-and-reports
|
| Expenses [Text Block] |
What were the Fund costs for the last six months?(based on a hypothetical $10,000 investment) Table SummaryFund Name | Costs of a $10,000 investment | Costs paid as a percentage of a $10,000 investment |
|---|
Short Duration Municipal Fund, Class F Shares | $32 | 0.63% |
|---|
|
| Expenses Paid, Amount |
$ 32
|
| Expense Ratio, Percent |
0.63%
|
| AssetsNet |
$ 740,340,000
|
| Holdings Count | Holding |
502
|
| Advisory Fees Paid, Amount |
$ 737
|
| InvestmentCompanyPortfolioTurnover |
16.00%
|
| Additional Fund Statistics [Text Block] |
Key Fund Statistics as of February 28, 2026Table Summary | Total Net Assets (000's) | Number of Holdings | Total Advisory Fees Paid (000's) | Portfolio Turnover Rate |
|---|
| $740,340 | 502 | $737 | 16% |
|---|
|
| Holdings [Text Block] |
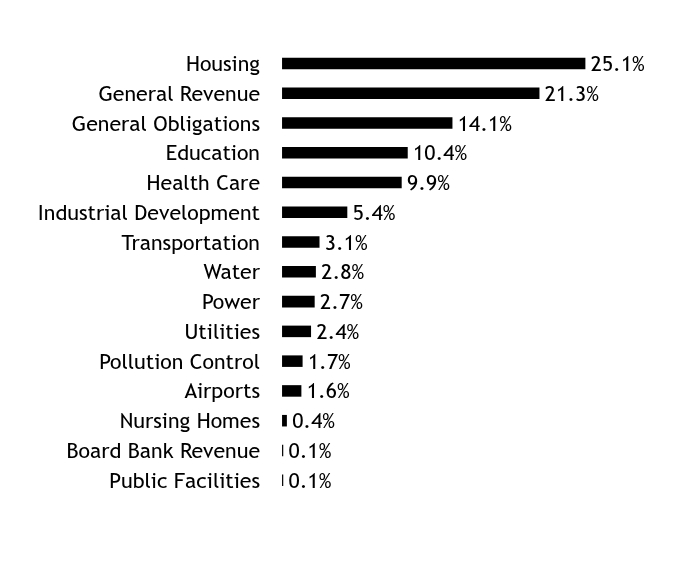
Sector WeightingsFootnote Reference*Table SummaryValue | Value |
|---|
Public Facilities | 0.1% | Board Bank Revenue | 0.1% | Nursing Homes | 0.4% | Airports | 1.6% | Pollution Control | 1.7% | Utilities | 2.4% | Power | 2.7% | Water | 2.8% | Transportation | 3.1% | Industrial Development | 5.4% | Health Care | 9.9% | Education | 10.4% | General Obligations | 14.1% | General Revenue | 21.3% | Housing | 25.1% | | Footnote | Description | Footnote* | Percentages are calculated based on total net assets. |
|
| Largest Holdings [Text Block] |
Table SummaryHolding Name | Coupon Rate | Maturity Date | Percentage of Total
Net Assets |
|---|
Kentucky State, Public Energy Authority, Ser A | 5.250%
| 06/01/55
| 2.5% | City of Andover Kansas, Ser A | 3.500%
| 10/01/28
| 1.4% | District of Columbia, Ser C | 0.000%
| 06/01/51
| 1.4% | Dallas City, Housing Finance Corporation, Multifamily Housing Revenue, Waterford at Goldmark | 3.300%
| 01/01/43
| 1.2% | Tennergy | 5.000%
| 10/01/54
| 1.1% | Alachua County, Housing Finance Authority | 3.300%
| 12/01/29
| 1.0% | Salt Verde Financial Corp, Gas Revenue | 5.250%
| 12/01/27
| 1.0% | Southeast Alabama, Energy Authority, Ser E | 5.000%
| 10/01/30
| 1.0% | Metrowest Regional Transit Authority, COMWLTH APPROP | 3.375%
| 09/11/26
| 0.9% | Georgia State, Main Street Natural Gas, Ser A | 5.000%
| 05/01/54
| 0.9% | |
| C000147411 |
|
| Shareholder Report [Line Items] |
|
| Fund Name |
Short Duration Municipal Fund
|
| Class Name |
Class Y
|
| Trading Symbol |
SHYMX
|
| Annual or Semi-Annual Statement [Text Block] |
Semi-Annual Shareholder Report
|
| Shareholder Report Annual or Semi-Annual |
semi-annual shareholder report
|
| Additional Information [Text Block] |
This semi-annual shareholder report contains important information about Class Y Shares of the Short Duration Municipal Fund (the "Fund") for the period from September 1, 2025 to February 28, 2026. You can find additional information about the Fund at https://www.seic.com/mutual-fund-documentation/prospectuses-and-reports. You can also request this information by contacting us at (610) 676-1000.
|
| Additional Information Phone Number |
(610) 676-1000
|
| Additional Information Website |
https://www.seic.com/mutual-fund-documentation/prospectuses-and-reports
|
| Expenses [Text Block] |
What were the Fund costs for the last six months?(based on a hypothetical $10,000 investment) Table SummaryFund Name | Costs of a $10,000 investment | Costs paid as a percentage of a $10,000 investment |
|---|
Short Duration Municipal Fund, Class Y Shares | $19 | 0.38% |
|---|
|
| Expenses Paid, Amount |
$ 19
|
| Expense Ratio, Percent |
0.38%
|
| AssetsNet |
$ 740,340,000
|
| Holdings Count | Holding |
502
|
| Advisory Fees Paid, Amount |
$ 737
|
| InvestmentCompanyPortfolioTurnover |
16.00%
|
| Additional Fund Statistics [Text Block] |
Key Fund Statistics as of February 28, 2026Table Summary | Total Net Assets (000's) | Number of Holdings | Total Advisory Fees Paid (000's) | Portfolio Turnover Rate |
|---|
| $740,340 | 502 | $737 | 16% |
|---|
|
| Holdings [Text Block] |
Sector WeightingsFootnote Reference*Table SummaryValue | Value |
|---|
Public Facilities | 0.1% | Board Bank Revenue | 0.1% | Nursing Homes | 0.4% | Airports | 1.6% | Pollution Control | 1.7% | Utilities | 2.4% | Power | 2.7% | Water | 2.8% | Transportation | 3.1% | Industrial Development | 5.4% | Health Care | 9.9% | Education | 10.4% | General Obligations | 14.1% | General Revenue | 21.3% | Housing | 25.1% | | Footnote | Description | Footnote* | Percentages are calculated based on total net assets. |
|
| Largest Holdings [Text Block] |
Table SummaryHolding Name | Coupon Rate | Maturity Date | Percentage of Total
Net Assets |
|---|
Kentucky State, Public Energy Authority, Ser A | 5.250%
| 06/01/55
| 2.5% | City of Andover Kansas, Ser A | 3.500%
| 10/01/28
| 1.4% | District of Columbia, Ser C | 0.000%
| 06/01/51
| 1.4% | Dallas City, Housing Finance Corporation, Multifamily Housing Revenue, Waterford at Goldmark | 3.300%
| 01/01/43
| 1.2% | Tennergy | 5.000%
| 10/01/54
| 1.1% | Alachua County, Housing Finance Authority | 3.300%
| 12/01/29
| 1.0% | Salt Verde Financial Corp, Gas Revenue | 5.250%
| 12/01/27
| 1.0% | Southeast Alabama, Energy Authority, Ser E | 5.000%
| 10/01/30
| 1.0% | Metrowest Regional Transit Authority, COMWLTH APPROP | 3.375%
| 09/11/26
| 0.9% | Georgia State, Main Street Natural Gas, Ser A | 5.000%
| 05/01/54
| 0.9% | |
| C000017631 |
|
| Shareholder Report [Line Items] |
|
| Fund Name |
California Municipal Bond Fund
|
| Class Name |
Class F
|
| Trading Symbol |
SBDAX
|
| Annual or Semi-Annual Statement [Text Block] |
Semi-Annual Shareholder Report
|
| Shareholder Report Annual or Semi-Annual |
semi-annual shareholder report
|
| Additional Information [Text Block] |
This semi-annual shareholder report contains important information about Class F Shares of the California Municipal Bond Fund (the "Fund") for the period from September 1, 2025 to February 28, 2026. You can find additional information about the Fund at https://www.seic.com/mutual-fund-documentation/prospectuses-and-reports. You can also request this information by contacting us at (610) 676-1000.
|
| Additional Information Phone Number |
(610) 676-1000
|
| Additional Information Website |
https://www.seic.com/mutual-fund-documentation/prospectuses-and-reports
|
| Expenses [Text Block] |
What were the Fund costs for the last six months?(based on a hypothetical $10,000 investment) Table SummaryFund Name | Costs of a $10,000 investment | Costs paid as a percentage of a $10,000 investment |
|---|
California Municipal Bond Fund, Class F Shares | $31 | 0.60% |
|---|
|
| Expenses Paid, Amount |
$ 31
|
| Expense Ratio, Percent |
0.60%
|
| AssetsNet |
$ 228,489,000
|
| Holdings Count | Holding |
133
|
| Advisory Fees Paid, Amount |
$ 271
|
| InvestmentCompanyPortfolioTurnover |
7.00%
|
| Additional Fund Statistics [Text Block] |
Key Fund Statistics as of February 28, 2026Table Summary | Total Net Assets (000's) | Number of Holdings | Total Advisory Fees Paid (000's) | Portfolio Turnover Rate |
|---|
| $228,489 | 133 | $271 | 7% |
|---|
|
| Holdings [Text Block] |
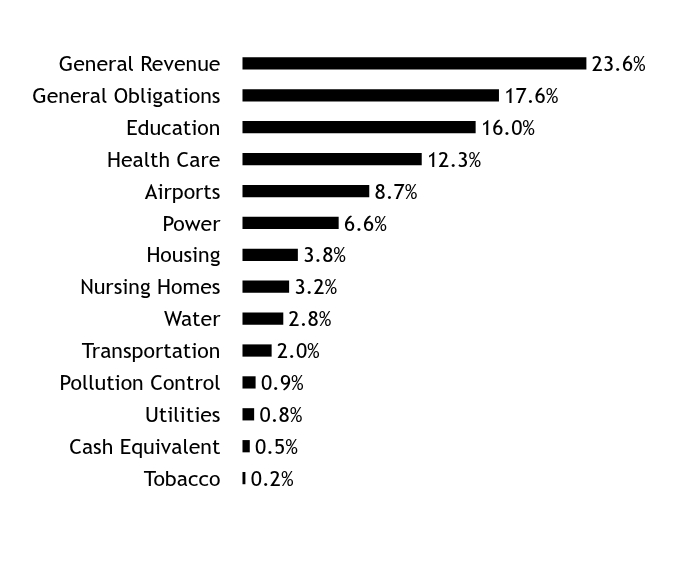
Asset WeightingsFootnote Reference*Table SummaryValue | Value |
|---|
Tobacco | 0.2% | Cash Equivalent | 0.5% | Utilities | 0.8% | Pollution Control | 0.9% | Transportation | 2.0% | Water | 2.8% | Nursing Homes | 3.2% | Housing | 3.8% | Power | 6.6% | Airports | 8.7% | Health Care | 12.3% | Education | 16.0% | General Obligations | 17.6% | General Revenue | 23.6% | | Footnote | Description | Footnote* | Percentages are calculated based on total net assets. |
|
| Largest Holdings [Text Block] |
Table SummaryHolding Name | Coupon Rate | Maturity Date | Percentage of Total
Net AssetsFootnote Reference(A) |
|---|
Los Angeles, Department of Water & Power, Water System Revenue, Ser E | 5.000%
| 07/01/35
| 3.2% | California State | 5.000%
| 10/01/35
| 2.6% | Los Angeles, Unified School District, Ser A | 5.000%
| 07/01/31
| 2.5% | California State, Community Choice Financing Authority, Clean Energy Project, Ser B-1 | 4.000%
| 02/01/52
| 2.3% | California State | 5.000%
| 11/01/31
| 2.2% | Burbank-Glendale-Pasadena Airport Authority Brick Campaign, Ser B, AMT | 5.000%
| 07/01/32
| 2.1% | California State | 4.000%
| 08/01/34
| 2.0% | California State, Various Purpose | 5.000%
| 10/01/29
| 1.9% | California State, Statewide Communities Development Authority, Kaiser Permanente Project, Ser 2004-M | 5.000%
| 04/01/38
| 1.9% | California State, Health Facilities Financing Authority, Kaiser Permanente Project, Ser 2006-C | 5.000%
| 06/01/41
| 1.9% | | Footnote | Description | Footnote(A) | Cash Equivalents are not shown in the top ten chart. |
|
| C000147416 |
|
| Shareholder Report [Line Items] |
|
| Fund Name |
California Municipal Bond Fund
|
| Class Name |
Class Y
|
| Trading Symbol |
SCYYX
|
| Annual or Semi-Annual Statement [Text Block] |
Semi-Annual Shareholder Report
|
| Shareholder Report Annual or Semi-Annual |
semi-annual shareholder report
|
| Additional Information [Text Block] |
This semi-annual shareholder report contains important information about Class Y Shares of the California Municipal Bond Fund (the "Fund") for the period from September 1, 2025 to February 28, 2026. You can find additional information about the Fund at https://www.seic.com/mutual-fund-documentation/prospectuses-and-reports. You can also request this information by contacting us at (610) 676-1000.
|
| Additional Information Phone Number |
(610) 676-1000
|
| Additional Information Website |
https://www.seic.com/mutual-fund-documentation/prospectuses-and-reports
|
| Expenses [Text Block] |
What were the Fund costs for the last six months?(based on a hypothetical $10,000 investment) Table SummaryFund Name | Costs of a $10,000 investment | Costs paid as a percentage of a $10,000 investment |
|---|
California Municipal Bond Fund, Class Y Shares | $23 | 0.45% |
|---|
|
| Expenses Paid, Amount |
$ 23
|
| Expense Ratio, Percent |
0.45%
|
| AssetsNet |
$ 228,489,000
|
| Holdings Count | Holding |
133
|
| Advisory Fees Paid, Amount |
$ 271
|
| InvestmentCompanyPortfolioTurnover |
7.00%
|
| Additional Fund Statistics [Text Block] |
Key Fund Statistics as of February 28, 2026Table Summary | Total Net Assets (000's) | Number of Holdings | Total Advisory Fees Paid (000's) | Portfolio Turnover Rate |
|---|
| $228,489 | 133 | $271 | 7% |
|---|
|
| Holdings [Text Block] |
Asset WeightingsFootnote Reference*Table SummaryValue | Value |
|---|
Tobacco | 0.2% | Cash Equivalent | 0.5% | Utilities | 0.8% | Pollution Control | 0.9% | Transportation | 2.0% | Water | 2.8% | Nursing Homes | 3.2% | Housing | 3.8% | Power | 6.6% | Airports | 8.7% | Health Care | 12.3% | Education | 16.0% | General Obligations | 17.6% | General Revenue | 23.6% | | Footnote | Description | Footnote* | Percentages are calculated based on total net assets. |
|
| Largest Holdings [Text Block] |
Table SummaryHolding Name | Coupon Rate | Maturity Date | Percentage of Total
Net AssetsFootnote Reference(A) |
|---|
Los Angeles, Department of Water & Power, Water System Revenue, Ser E | 5.000%
| 07/01/35
| 3.2% | California State | 5.000%
| 10/01/35
| 2.6% | Los Angeles, Unified School District, Ser A | 5.000%
| 07/01/31
| 2.5% | California State, Community Choice Financing Authority, Clean Energy Project, Ser B-1 | 4.000%
| 02/01/52
| 2.3% | California State | 5.000%
| 11/01/31
| 2.2% | Burbank-Glendale-Pasadena Airport Authority Brick Campaign, Ser B, AMT | 5.000%
| 07/01/32
| 2.1% | California State | 4.000%
| 08/01/34
| 2.0% | California State, Various Purpose | 5.000%
| 10/01/29
| 1.9% | California State, Statewide Communities Development Authority, Kaiser Permanente Project, Ser 2004-M | 5.000%
| 04/01/38
| 1.9% | California State, Health Facilities Financing Authority, Kaiser Permanente Project, Ser 2006-C | 5.000%
| 06/01/41
| 1.9% | | Footnote | Description | Footnote(A) | Cash Equivalents are not shown in the top ten chart. |
|
| C000017627 |
|
| Shareholder Report [Line Items] |
|
| Fund Name |
Massachusetts Municipal Bond Fund
|
| Class Name |
Class F
|
| Trading Symbol |
SMAAX
|
| Annual or Semi-Annual Statement [Text Block] |
Semi-Annual Shareholder Report
|
| Shareholder Report Annual or Semi-Annual |
semi-annual shareholder report
|
| Additional Information [Text Block] |
This semi-annual shareholder report contains important information about Class F Shares of the Massachusetts Municipal Bond Fund (the "Fund") for the period from September 1, 2025 to February 28, 2026. You can find additional information about the Fund at https://www.seic.com/mutual-fund-documentation/prospectuses-and-reports. You can also request this information by contacting us at (610) 676-1000.
|
| Additional Information Phone Number |
(610) 676-1000
|
| Additional Information Website |
https://www.seic.com/mutual-fund-documentation/prospectuses-and-reports
|
| Expenses [Text Block] |
What were the Fund costs for the last six months?(based on a hypothetical $10,000 investment) Table SummaryFund Name | Costs of a $10,000 investment | Costs paid as a percentage of a $10,000 investment |
|---|
Massachusetts Municipal Bond Fund, Class F Shares | $33 | 0.64% |
|---|
|
| Expenses Paid, Amount |
$ 33
|
| Expense Ratio, Percent |
0.64%
|
| AssetsNet |
$ 61,824,000
|
| Holdings Count | Holding |
72
|
| Advisory Fees Paid, Amount |
$ 79
|
| InvestmentCompanyPortfolioTurnover |
9.00%
|
| Additional Fund Statistics [Text Block] |
Key Fund Statistics as of February 28, 2026Table Summary | Total Net Assets (000's) | Number of Holdings | Total Advisory Fees Paid (000's) | Portfolio Turnover Rate |
|---|
| $61,824 | 72 | $79 | 9% |
|---|
|
| Holdings [Text Block] |
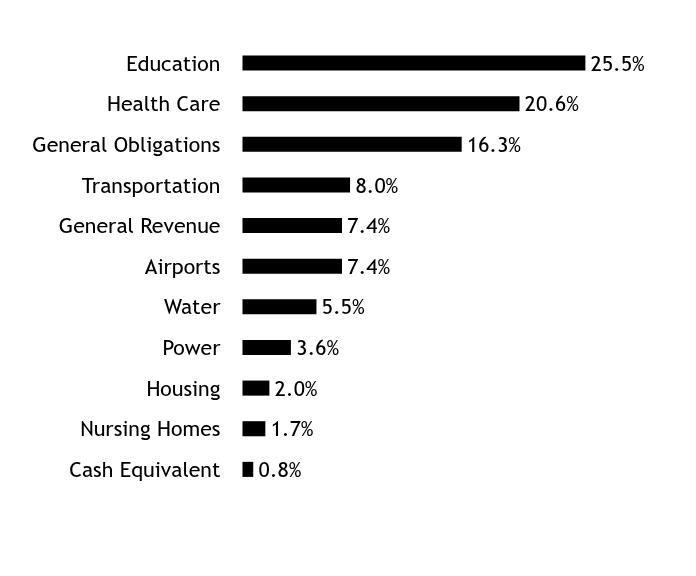
Asset WeightingsFootnote Reference*Table SummaryValue | Value |
|---|
Cash Equivalent | 0.8% | Nursing Homes | 1.7% | Housing | 2.0% | Power | 3.6% | Water | 5.5% | Airports | 7.4% | General Revenue | 7.4% | Transportation | 8.0% | General Obligations | 16.3% | Health Care | 20.6% | Education | 25.5% | | Footnote | Description | Footnote* | Percentages are calculated based on total net assets. |
|
| Largest Holdings [Text Block] |
Table SummaryHolding Name | Coupon Rate | Maturity Date | Percentage of Total
Net AssetsFootnote Reference(A) |
|---|
Massachusetts State, Development Finance Agency, Children's Hospital, Ser T | 5.000%
| 03/01/34
| 5.8% | Massachusetts State, Ser C | 5.000%
| 10/01/33
| 4.7% | Massachusetts Bay, Transportation Authority, Ser A | 5.000%
| 07/01/36
| 3.0% | Boston, Ser A | 4.000%
| 11/01/31
| 2.6% | Massachusetts State, Development Finance Agency, Harvard University, Ser B | 4.000%
| 02/15/36
| 2.3% | Massachusetts State, Development Finance Agency, Babson College | 5.000%
| 10/01/33
| 2.1% | Massachusetts State, Development Finance Agency, Amherst College | 5.000%
| 11/01/55
| 2.0% | Massachusetts Development Finance Agency, Ser N | 5.000%
| 07/01/37
| 1.9% | Massachusetts Development Finance Agency, Ser F | 5.000%
| 07/01/38
| 1.9% | Massachusetts Bay, Transportation Authority Sales Tax Revenue, Ser B | 5.000%
| 07/01/37
| 1.9% | | Footnote | Description | Footnote(A) | Cash Equivalents are not shown in the top ten chart. |
|
| C000147413 |
|
| Shareholder Report [Line Items] |
|
| Fund Name |
Massachusetts Municipal Bond Fund
|
| Class Name |
Class Y
|
| Trading Symbol |
SMSYX
|
| Annual or Semi-Annual Statement [Text Block] |
Semi-Annual Shareholder Report
|
| Shareholder Report Annual or Semi-Annual |
semi-annual shareholder report
|
| Additional Information [Text Block] |
This semi-annual shareholder report contains important information about Class Y Shares of the Massachusetts Municipal Bond Fund (the "Fund") for the period from September 1, 2025 to February 28, 2026. You can find additional information about the Fund at https://www.seic.com/mutual-fund-documentation/prospectuses-and-reports. You can also request this information by contacting us at (610) 676-1000.
|
| Additional Information Phone Number |
(610) 676-1000
|
| Additional Information Website |
https://www.seic.com/mutual-fund-documentation/prospectuses-and-reports
|
| Expenses [Text Block] |
What were the Fund costs for the last six months?(based on a hypothetical $10,000 investment) Table SummaryFund Name | Costs of a $10,000 investment | Costs paid as a percentage of a $10,000 investment |
|---|
Massachusetts Municipal Bond Fund, Class Y Shares | $25 | 0.49% |
|---|
|
| Expenses Paid, Amount |
$ 25
|
| Expense Ratio, Percent |
0.49%
|
| AssetsNet |
$ 61,824,000
|
| Holdings Count | Holding |
72
|
| Advisory Fees Paid, Amount |
$ 79
|
| InvestmentCompanyPortfolioTurnover |
9.00%
|
| Additional Fund Statistics [Text Block] |
Key Fund Statistics as of February 28, 2026Table Summary | Total Net Assets (000's) | Number of Holdings | Total Advisory Fees Paid (000's) | Portfolio Turnover Rate |
|---|
| $61,824 | 72 | $79 | 9% |
|---|
|
| Holdings [Text Block] |
Asset WeightingsFootnote Reference*Table SummaryValue | Value |
|---|
Cash Equivalent | 0.8% | Nursing Homes | 1.7% | Housing | 2.0% | Power | 3.6% | Water | 5.5% | Airports | 7.4% | General Revenue | 7.4% | Transportation | 8.0% | General Obligations | 16.3% | Health Care | 20.6% | Education | 25.5% | | Footnote | Description | Footnote* | Percentages are calculated based on total net assets. |
|
| Largest Holdings [Text Block] |
Table SummaryHolding Name | Coupon Rate | Maturity Date | Percentage of Total
Net AssetsFootnote Reference(A) |
|---|
Massachusetts State, Development Finance Agency, Children's Hospital, Ser T | 5.000%
| 03/01/34
| 5.8% | Massachusetts State, Ser C | 5.000%
| 10/01/33
| 4.7% | Massachusetts Bay, Transportation Authority, Ser A | 5.000%
| 07/01/36
| 3.0% | Boston, Ser A | 4.000%
| 11/01/31
| 2.6% | Massachusetts State, Development Finance Agency, Harvard University, Ser B | 4.000%
| 02/15/36
| 2.3% | Massachusetts State, Development Finance Agency, Babson College | 5.000%
| 10/01/33
| 2.1% | Massachusetts State, Development Finance Agency, Amherst College | 5.000%
| 11/01/55
| 2.0% | Massachusetts Development Finance Agency, Ser N | 5.000%
| 07/01/37
| 1.9% | Massachusetts Development Finance Agency, Ser F | 5.000%
| 07/01/38
| 1.9% | Massachusetts Bay, Transportation Authority Sales Tax Revenue, Ser B | 5.000%
| 07/01/37
| 1.9% | | Footnote | Description | Footnote(A) | Cash Equivalents are not shown in the top ten chart. |
|
| C000017630 |
|
| Shareholder Report [Line Items] |
|
| Fund Name |
New Jersey Municipal Bond Fund
|
| Class Name |
Class F
|
| Trading Symbol |
SENJX
|
| Annual or Semi-Annual Statement [Text Block] |
Semi-Annual Shareholder Report
|
| Shareholder Report Annual or Semi-Annual |
semi-annual shareholder report
|
| Additional Information [Text Block] |
This semi-annual shareholder report contains important information about Class F Shares of the New Jersey Municipal Bond Fund (the "Fund") for the period from September 1, 2025 to February 28, 2026. You can find additional information about the Fund at https://www.seic.com/mutual-fund-documentation/prospectuses-and-reports. You can also request this information by contacting us at (610) 676-1000.
|
| Additional Information Phone Number |
(610) 676-1000
|
| Additional Information Website |
https://www.seic.com/mutual-fund-documentation/prospectuses-and-reports
|
| Expenses [Text Block] |
What were the Fund costs for the last six months?(based on a hypothetical $10,000 investment) Table SummaryFund Name | Costs of a $10,000 investment | Costs paid as a percentage of a $10,000 investment |
|---|
New Jersey Municipal Bond Fund, Class F Shares | $30 | 0.60% |
|---|
|
| Expenses Paid, Amount |
$ 30
|
| Expense Ratio, Percent |
0.60%
|
| AssetsNet |
$ 94,063,000
|
| Holdings Count | Holding |
83
|
| Advisory Fees Paid, Amount |
$ 106
|
| InvestmentCompanyPortfolioTurnover |
4.00%
|
| Additional Fund Statistics [Text Block] |
Key Fund Statistics as of February 28, 2026Table Summary | Total Net Assets (000's) | Number of Holdings | Total Advisory Fees Paid (000's) | Portfolio Turnover Rate |
|---|
| $94,063 | 83 | $106 | 4% |
|---|
|
| Holdings [Text Block] |
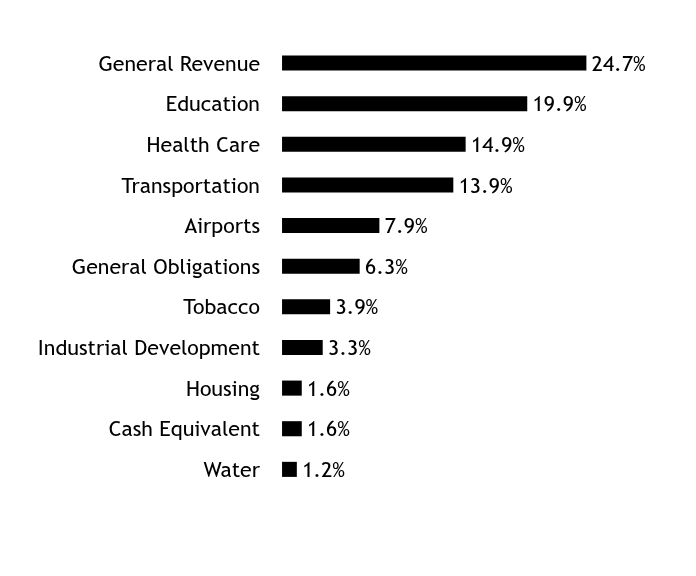
Asset WeightingsFootnote Reference*Table SummaryValue | Value |
|---|
Water | 1.2% | Cash Equivalent | 1.6% | Housing | 1.6% | Industrial Development | 3.3% | Tobacco | 3.9% | General Obligations | 6.3% | Airports | 7.9% | Transportation | 13.9% | Health Care | 14.9% | Education | 19.9% | General Revenue | 24.7% | | Footnote | Description | Footnote* | Percentages are calculated based on total net assets. |
|
| Largest Holdings [Text Block] |
Table SummaryHolding Name | Coupon Rate | Maturity Date | Percentage of Total
Net AssetsFootnote Reference(A) |
|---|
Tobacco Settlement Financing, Ser A | 5.000%
| 06/01/34
| 3.3% | New Jersey State, Transportation Trust Fund Authority, Ser S | 5.000%
| 06/15/32
| 3.0% | New Jersey State, Transportation Trust Fund Authority, Ser A | 4.000%
| 06/15/35
| 2.9% | New Jersey State, Higher Education Student Assistance Authority, Ser A, AMT | 5.000%
| 12/01/33
| 2.8% | New York & New Jersey, Port Authority, AMT | 5.000%
| 11/01/32
| 2.8% | New York & New Jersey, Port Authority, Ser 223, AMT | 5.000%
| 07/15/33
| 2.5% | New Jersey State, Educational Facilities Authority, Ser A1 | 5.000%
| 03/01/37
| 2.5% | New Jersey State, Health Care Facilities Financing Authority, RWJ Barnabas Health Obligated Group | 5.000%
| 07/01/36
| 2.5% | New Jersey State, Educational Facilities Authority, Montclair State University, Ser B | 5.000%
| 07/01/28
| 2.4% | New Jersey State, COVID-19 Emergency Bonds | 4.000%
| 06/01/31
| 2.3% | | Footnote | Description | Footnote(A) | Cash Equivalents are not shown in the top ten chart. |
|
| C000147415 |
|
| Shareholder Report [Line Items] |
|
| Fund Name |
New Jersey Municipal Bond Fund
|
| Class Name |
Class Y
|
| Trading Symbol |
SNJYX
|
| Annual or Semi-Annual Statement [Text Block] |
Semi-Annual Shareholder Report
|
| Shareholder Report Annual or Semi-Annual |
semi-annual shareholder report
|
| Additional Information [Text Block] |
This semi-annual shareholder report contains important information about Class Y Shares of the New Jersey Municipal Bond Fund (the "Fund") for the period from September 1, 2025 to February 28, 2026. You can find additional information about the Fund at https://www.seic.com/mutual-fund-documentation/prospectuses-and-reports. You can also request this information by contacting us at (610) 676-1000.
|
| Additional Information Phone Number |
(610) 676-1000
|
| Additional Information Website |
https://www.seic.com/mutual-fund-documentation/prospectuses-and-reports
|
| Expenses [Text Block] |
What were the Fund costs for the last six months?(based on a hypothetical $10,000 investment) Table SummaryFund Name | Costs of a $10,000 investment | Costs paid as a percentage of a $10,000 investment |
|---|
New Jersey Municipal Bond Fund, Class Y Shares | $23 | 0.45% |
|---|
|
| Expenses Paid, Amount |
$ 23
|
| Expense Ratio, Percent |
0.45%
|
| AssetsNet |
$ 94,063,000
|
| Holdings Count | Holding |
83
|
| Advisory Fees Paid, Amount |
$ 106
|
| InvestmentCompanyPortfolioTurnover |
4.00%
|
| Additional Fund Statistics [Text Block] |
Key Fund Statistics as of February 28, 2026Table Summary | Total Net Assets (000's) | Number of Holdings | Total Advisory Fees Paid (000's) | Portfolio Turnover Rate |
|---|
| $94,063 | 83 | $106 | 4% |
|---|
|
| Holdings [Text Block] |
Asset WeightingsFootnote Reference*Table SummaryValue | Value |
|---|
Water | 1.2% | Cash Equivalent | 1.6% | Housing | 1.6% | Industrial Development | 3.3% | Tobacco | 3.9% | General Obligations | 6.3% | Airports | 7.9% | Transportation | 13.9% | Health Care | 14.9% | Education | 19.9% | General Revenue | 24.7% | | Footnote | Description | Footnote* | Percentages are calculated based on total net assets. |
|
| Largest Holdings [Text Block] |
Table SummaryHolding Name | Coupon Rate | Maturity Date | Percentage of Total
Net AssetsFootnote Reference(A) |
|---|
Tobacco Settlement Financing, Ser A | 5.000%
| 06/01/34
| 3.3% | New Jersey State, Transportation Trust Fund Authority, Ser S | 5.000%
| 06/15/32
| 3.0% | New Jersey State, Transportation Trust Fund Authority, Ser A | 4.000%
| 06/15/35
| 2.9% | New Jersey State, Higher Education Student Assistance Authority, Ser A, AMT | 5.000%
| 12/01/33
| 2.8% | New York & New Jersey, Port Authority, AMT | 5.000%
| 11/01/32
| 2.8% | New York & New Jersey, Port Authority, Ser 223, AMT | 5.000%
| 07/15/33
| 2.5% | New Jersey State, Educational Facilities Authority, Ser A1 | 5.000%
| 03/01/37
| 2.5% | New Jersey State, Health Care Facilities Financing Authority, RWJ Barnabas Health Obligated Group | 5.000%
| 07/01/36
| 2.5% | New Jersey State, Educational Facilities Authority, Montclair State University, Ser B | 5.000%
| 07/01/28
| 2.4% | New Jersey State, COVID-19 Emergency Bonds | 4.000%
| 06/01/31
| 2.3% | | Footnote | Description | Footnote(A) | Cash Equivalents are not shown in the top ten chart. |
|
| C000017629 |
|
| Shareholder Report [Line Items] |
|
| Fund Name |
New York Municipal Bond Fund
|
| Class Name |
Class F
|
| Trading Symbol |
SENYX
|
| Annual or Semi-Annual Statement [Text Block] |
Semi-Annual Shareholder Report
|
| Shareholder Report Annual or Semi-Annual |
semi-annual shareholder report
|
| Additional Information [Text Block] |
This semi-annual shareholder report contains important information about Class F Shares of the New York Municipal Bond Fund (the "Fund") for the period from September 1, 2025 to February 28, 2026. You can find additional information about the Fund at https://www.seic.com/mutual-fund-documentation/prospectuses-and-reports. You can also request this information by contacting us at (610) 676-1000.
|
| Additional Information Phone Number |
(610) 676-1000
|
| Additional Information Website |
https://www.seic.com/mutual-fund-documentation/prospectuses-and-reports
|
| Expenses [Text Block] |
What were the Fund costs for the last six months?(based on a hypothetical $10,000 investment) Table SummaryFund Name | Costs of a $10,000 investment | Costs paid as a percentage of a $10,000 investment |
|---|
New York Municipal Bond Fund, Class F Shares | $30 | 0.60% |
|---|
|
| Expenses Paid, Amount |
$ 30
|
| Expense Ratio, Percent |
0.60%
|
| AssetsNet |
$ 112,845,000
|
| Holdings Count | Holding |
75
|
| Advisory Fees Paid, Amount |
$ 127
|
| InvestmentCompanyPortfolioTurnover |
9.00%
|
| Additional Fund Statistics [Text Block] |
Key Fund Statistics as of February 28, 2026Table Summary | Total Net Assets (000's) | Number of Holdings | Total Advisory Fees Paid (000's) | Portfolio Turnover Rate |
|---|
| $112,845 | 75 | $127 | 9% |
|---|
|
| Holdings [Text Block] |
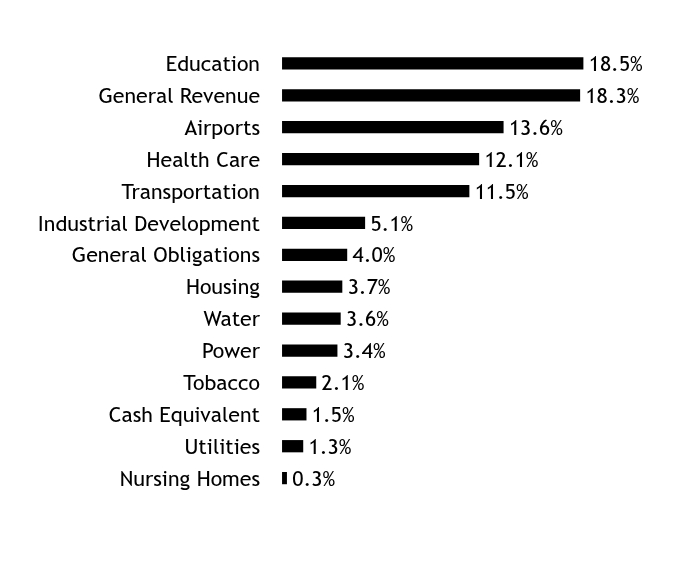
Asset WeightingsFootnote Reference*Table SummaryValue | Value |
|---|
Nursing Homes | 0.3% | Utilities | 1.3% | Cash Equivalent | 1.5% | Tobacco | 2.1% | Power | 3.4% | Water | 3.6% | Housing | 3.7% | General Obligations | 4.0% | Industrial Development | 5.1% | Transportation | 11.5% | Health Care | 12.1% | Airports | 13.6% | General Revenue | 18.3% | Education | 18.5% | | Footnote | Description | Footnote* | Percentages are calculated based on total net assets. |
|
| Largest Holdings [Text Block] |
Table SummaryHolding Name | Coupon Rate | Maturity Date | Percentage of Total
Net AssetsFootnote Reference(A) |
|---|
New York & New Jersey, Port Authority, AMT | 5.000%
| 11/01/30
| 3.9% | Triborough, Bridge & Tunnel Authority, MTA Bridges & Tunnels, Sub-Ser A | 5.000%
| 02/01/28
| 3.1% | New York City Transitional Finance Authority Future Tax Secured Revenue, Sub-Ser S | 5.000%
| 02/01/39
| 3.1% | New York City Transitional Finance Authority Future Tax Secured Revenue, Future Tax Secured, Sub-Ser | 5.000%
| 05/01/37
| 2.3% | New York City, Transitional Finance Authority, Building Aid, Sub-Ser S-3, ST AID WITHHLDG | 5.000%
| 07/15/32
| 2.3% | New York State, Dormitory Authority, School Districts Financing Program, Ser A, ST AID WITHHLDG | 5.000%
| 10/01/29
| 2.3% | Triborough, Bridge & Tunnel Authority, MTA Bridges & Tunnels | 5.000%
| 12/01/37
| 2.1% | Suffolk, Tobacco Asset Securitization | 4.000%
| 06/01/35
| 2.1% | New York State, Dormitory Authority, Presbyterian Hospital Obligated Group | 5.000%
| 08/01/35
| 2.1% | Metropolitan Transportation Authority | 5.000%
| 11/15/32
| 2.1% | | Footnote | Description | Footnote(A) | Cash Equivalents are not shown in the top ten chart. |
|
| C000147414 |
|
| Shareholder Report [Line Items] |
|
| Fund Name |
New York Municipal Bond Fund
|
| Class Name |
Class Y
|
| Trading Symbol |
SNYYX
|
| Annual or Semi-Annual Statement [Text Block] |
Semi-Annual Shareholder Report
|
| Shareholder Report Annual or Semi-Annual |
semi-annual shareholder report
|
| Additional Information [Text Block] |
This semi-annual shareholder report contains important information about Class Y Shares of the New York Municipal Bond Fund (the "Fund") for the period from September 1, 2025 to February 28, 2026. You can find additional information about the Fund at https://www.seic.com/mutual-fund-documentation/prospectuses-and-reports. You can also request this information by contacting us at (610) 676-1000.
|
| Additional Information Phone Number |
(610) 676-1000
|
| Additional Information Website |
https://www.seic.com/mutual-fund-documentation/prospectuses-and-reports
|
| Expenses [Text Block] |
What were the Fund costs for the last six months?(based on a hypothetical $10,000 investment) Table SummaryFund Name | Costs of a $10,000 investment | Costs paid as a percentage of a $10,000 investment |
|---|
New York Municipal Bond Fund, Class Y Shares | $23 | 0.45% |
|---|
|
| Expenses Paid, Amount |
$ 23
|
| Expense Ratio, Percent |
0.45%
|
| AssetsNet |
$ 112,845,000
|
| Holdings Count | Holding |
75
|
| Advisory Fees Paid, Amount |
$ 127
|
| InvestmentCompanyPortfolioTurnover |
9.00%
|
| Additional Fund Statistics [Text Block] |
Key Fund Statistics as of February 28, 2026Table Summary | Total Net Assets (000's) | Number of Holdings | Total Advisory Fees Paid (000's) | Portfolio Turnover Rate |
|---|
| $112,845 | 75 | $127 | 9% |
|---|
|
| Holdings [Text Block] |
Asset WeightingsFootnote Reference*Table SummaryValue | Value |
|---|
Nursing Homes | 0.3% | Utilities | 1.3% | Cash Equivalent | 1.5% | Tobacco | 2.1% | Power | 3.4% | Water | 3.6% | Housing | 3.7% | General Obligations | 4.0% | Industrial Development | 5.1% | Transportation | 11.5% | Health Care | 12.1% | Airports | 13.6% | General Revenue | 18.3% | Education | 18.5% | | Footnote | Description | Footnote* | Percentages are calculated based on total net assets. |
|
| Largest Holdings [Text Block] |
Table SummaryHolding Name | Coupon Rate | Maturity Date | Percentage of Total
Net AssetsFootnote Reference(A) |
|---|
New York & New Jersey, Port Authority, AMT | 5.000%
| 11/01/30
| 3.9% | Triborough, Bridge & Tunnel Authority, MTA Bridges & Tunnels, Sub-Ser A | 5.000%
| 02/01/28
| 3.1% | New York City Transitional Finance Authority Future Tax Secured Revenue, Sub-Ser S | 5.000%
| 02/01/39
| 3.1% | New York City Transitional Finance Authority Future Tax Secured Revenue, Future Tax Secured, Sub-Ser | 5.000%
| 05/01/37
| 2.3% | New York City, Transitional Finance Authority, Building Aid, Sub-Ser S-3, ST AID WITHHLDG | 5.000%
| 07/15/32
| 2.3% | New York State, Dormitory Authority, School Districts Financing Program, Ser A, ST AID WITHHLDG | 5.000%
| 10/01/29
| 2.3% | Triborough, Bridge & Tunnel Authority, MTA Bridges & Tunnels | 5.000%
| 12/01/37
| 2.1% | Suffolk, Tobacco Asset Securitization | 4.000%
| 06/01/35
| 2.1% | New York State, Dormitory Authority, Presbyterian Hospital Obligated Group | 5.000%
| 08/01/35
| 2.1% | Metropolitan Transportation Authority | 5.000%
| 11/15/32
| 2.1% | | Footnote | Description | Footnote(A) | Cash Equivalents are not shown in the top ten chart. |
|
| C000017626 |
|
| Shareholder Report [Line Items] |
|
| Fund Name |
Pennsylvania Municipal Bond Fund
|
| Class Name |
Class F
|
| Trading Symbol |
SEPAX
|
| Annual or Semi-Annual Statement [Text Block] |
Semi-Annual Shareholder Report
|
| Shareholder Report Annual or Semi-Annual |
semi-annual shareholder report
|
| Additional Information [Text Block] |
This semi-annual shareholder report contains important information about Class F Shares of the Pennsylvania Municipal Bond Fund (the "Fund") for the period from September 1, 2025 to February 28, 2026. You can find additional information about the Fund at https://www.seic.com/mutual-fund-documentation/prospectuses-and-reports. You can also request this information by contacting us at (610) 676-1000.
|
| Additional Information Phone Number |
(610) 676-1000
|
| Additional Information Website |
https://www.seic.com/mutual-fund-documentation/prospectuses-and-reports
|
| Expenses [Text Block] |
What were the Fund costs for the last six months?(based on a hypothetical $10,000 investment) Table SummaryFund Name | Costs of a $10,000 investment | Costs paid as a percentage of a $10,000 investment |
|---|
Pennsylvania Municipal Bond Fund, Class F Shares | $32 | 0.63% |
|---|
|
| Expenses Paid, Amount |
$ 32
|
| Expense Ratio, Percent |
0.63%
|
| AssetsNet |
$ 138,181,000
|
| Holdings Count | Holding |
112
|
| Advisory Fees Paid, Amount |
$ 182
|
| InvestmentCompanyPortfolioTurnover |
6.00%
|
| Additional Fund Statistics [Text Block] |
Key Fund Statistics as of February 28, 2026Table Summary | Total Net Assets (000's) | Number of Holdings | Total Advisory Fees Paid (000's) | Portfolio Turnover Rate |
|---|
| $138,181 | 112 | $182 | 6% |
|---|
|
| Holdings [Text Block] |
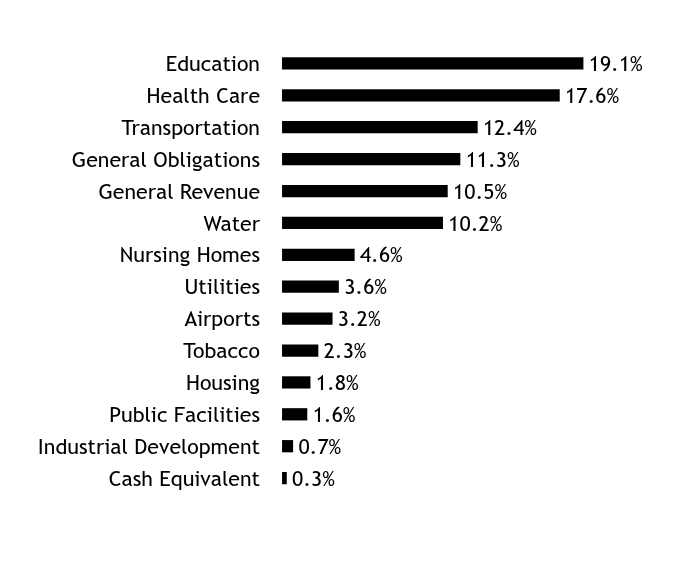
Asset WeightingsFootnote Reference*Table SummaryValue | Value |
|---|
Cash Equivalent | 0.3% | Industrial Development | 0.7% | Public Facilities | 1.6% | Housing | 1.8% | Tobacco | 2.3% | Airports | 3.2% | Utilities | 3.6% | Nursing Homes | 4.6% | Water | 10.2% | General Revenue | 10.5% | General Obligations | 11.3% | Transportation | 12.4% | Health Care | 17.6% | Education | 19.1% | | Footnote | Description | Footnote* | Percentages are calculated based on total net assets. |
|
| Largest Holdings [Text Block] |
Table SummaryHolding Name | Coupon Rate | Maturity Date | Percentage of Total
Net AssetsFootnote Reference(A) |
|---|
Philadelphia, Industrial Development Authority, The Children's Hospital of Philadelphia Project | 4.000%
| 07/01/35
| 3.9% | Pennsylvania State, BAM | 4.000%
| 03/01/35
| 2.6% | Pennsylvania State, Higher Education Assistance Agency, Ser A, AMT | 5.000%
| 06/01/32
| 2.4% | Pennsylvania State | 5.000%
| 09/01/32
| 2.2% | Philadelphia, Water & Wastewater Revenue Authority, Ser C, AGC | 5.000%
| 09/01/35
| 2.2% | Philadelphia, Housing Authority, PHADC Acquisition Program | 5.250%
| 03/01/38
| 2.1% | Adams County, General Authority, The Brethren Home Community | 5.000%
| 06/01/34
| 2.0% | Commonwealth Financing Authority, Tobacco Master Settlement | 5.000%
| 06/01/28
| 1.9% | Allegheny County, Hospital Development Authority, Allegheny Health Network | 5.000%
| 04/01/28
| 1.9% | Philadelphia, Water & Wastewater Revenue Authority, Ser C | 5.000%
| 10/01/31
| 1.8% | | Footnote | Description | Footnote(A) | Cash Equivalents are not shown in the top ten chart. |
|
| C000147412 |
|
| Shareholder Report [Line Items] |
|
| Fund Name |
Pennsylvania Municipal Bond Fund
|
| Class Name |
Class Y
|
| Trading Symbol |
SPAYX
|
| Annual or Semi-Annual Statement [Text Block] |
Semi-Annual Shareholder Report
|
| Shareholder Report Annual or Semi-Annual |
semi-annual shareholder report
|
| Additional Information [Text Block] |
This semi-annual shareholder report contains important information about Class Y Shares of the Pennsylvania Municipal Bond Fund (the "Fund") for the period from September 1, 2025 to February 28, 2026. You can find additional information about the Fund at https://www.seic.com/mutual-fund-documentation/prospectuses-and-reports. You can also request this information by contacting us at (610) 676-1000.
|
| Additional Information Phone Number |
(610) 676-1000
|
| Additional Information Website |
https://www.seic.com/mutual-fund-documentation/prospectuses-and-reports
|
| Expenses [Text Block] |
What were the Fund costs for the last six months?(based on a hypothetical $10,000 investment) Table SummaryFund Name | Costs of a $10,000 investment | Costs paid as a percentage of a $10,000 investment |
|---|
Pennsylvania Municipal Bond Fund, Class Y Shares | $24 | 0.48% |
|---|
|
| Expenses Paid, Amount |
$ 24
|
| Expense Ratio, Percent |
0.48%
|
| AssetsNet |
$ 138,181,000
|
| Holdings Count | Holding |
112
|
| Advisory Fees Paid, Amount |
$ 182
|
| InvestmentCompanyPortfolioTurnover |
6.00%
|
| Additional Fund Statistics [Text Block] |
Key Fund Statistics as of February 28, 2026Table Summary | Total Net Assets (000's) | Number of Holdings | Total Advisory Fees Paid (000's) | Portfolio Turnover Rate |
|---|
| $138,181 | 112 | $182 | 6% |
|---|
|
| Holdings [Text Block] |
Asset WeightingsFootnote Reference*Table SummaryValue | Value |
|---|
Cash Equivalent | 0.3% | Industrial Development | 0.7% | Public Facilities | 1.6% | Housing | 1.8% | Tobacco | 2.3% | Airports | 3.2% | Utilities | 3.6% | Nursing Homes | 4.6% | Water | 10.2% | General Revenue | 10.5% | General Obligations | 11.3% | Transportation | 12.4% | Health Care | 17.6% | Education | 19.1% | | Footnote | Description | Footnote* | Percentages are calculated based on total net assets. |
|
| Largest Holdings [Text Block] |
Table SummaryHolding Name | Coupon Rate | Maturity Date | Percentage of Total
Net AssetsFootnote Reference(A) |
|---|
Philadelphia, Industrial Development Authority, The Children's Hospital of Philadelphia Project | 4.000%
| 07/01/35
| 3.9% | Pennsylvania State, BAM | 4.000%
| 03/01/35
| 2.6% | Pennsylvania State, Higher Education Assistance Agency, Ser A, AMT | 5.000%
| 06/01/32
| 2.4% | Pennsylvania State | 5.000%
| 09/01/32
| 2.2% | Philadelphia, Water & Wastewater Revenue Authority, Ser C, AGC | 5.000%
| 09/01/35
| 2.2% | Philadelphia, Housing Authority, PHADC Acquisition Program | 5.250%
| 03/01/38
| 2.1% | Adams County, General Authority, The Brethren Home Community | 5.000%
| 06/01/34
| 2.0% | Commonwealth Financing Authority, Tobacco Master Settlement | 5.000%
| 06/01/28
| 1.9% | Allegheny County, Hospital Development Authority, Allegheny Health Network | 5.000%
| 04/01/28
| 1.9% | Philadelphia, Water & Wastewater Revenue Authority, Ser C | 5.000%
| 10/01/31
| 1.8% | | Footnote | Description | Footnote(A) | Cash Equivalents are not shown in the top ten chart. |
|
| C000047166 |
|
| Shareholder Report [Line Items] |
|
| Fund Name |
Tax-Advantaged Income Fund
|
| Class Name |
Class F
|
| Trading Symbol |
SEATX
|
| Annual or Semi-Annual Statement [Text Block] |
Semi-Annual Shareholder Report
|
| Shareholder Report Annual or Semi-Annual |
semi-annual shareholder report
|
| Additional Information [Text Block] |
This semi-annual shareholder report contains important information about Class F Shares of the Tax-Advantaged Income Fund (the "Fund") for the period from September 1, 2025 to February 28, 2026. You can find additional information about the Fund at https://www.seic.com/mutual-fund-documentation/prospectuses-and-reports. You can also request this information by contacting us at (610) 676-1000.
|
| Additional Information Phone Number |
(610) 676-1000
|
| Additional Information Website |
https://www.seic.com/mutual-fund-documentation/prospectuses-and-reports
|
| Expenses [Text Block] |
What were the Fund costs for the last six months?(based on a hypothetical $10,000 investment) Table SummaryFund Name | Costs of a $10,000 investment | Costs paid as a percentage of a $10,000 investment |
|---|
Tax-Advantaged Income Fund, Class F Shares | $44 | 0.86% |
|---|
|
| Expenses Paid, Amount |
$ 44
|
| Expense Ratio, Percent |
0.86%
|
| AssetsNet |
$ 824,532,000
|
| Holdings Count | Holding |
441
|
| Advisory Fees Paid, Amount |
$ 1,492
|
| InvestmentCompanyPortfolioTurnover |
14.00%
|
| Additional Fund Statistics [Text Block] |
Key Fund Statistics as of February 28, 2026Table Summary | Total Net Assets (000's) | Number of Holdings | Total Advisory Fees Paid (000's) | Portfolio Turnover Rate |
|---|
| $824,532 | 441 | $1,492 | 14% |
|---|
|
| Holdings [Text Block] |
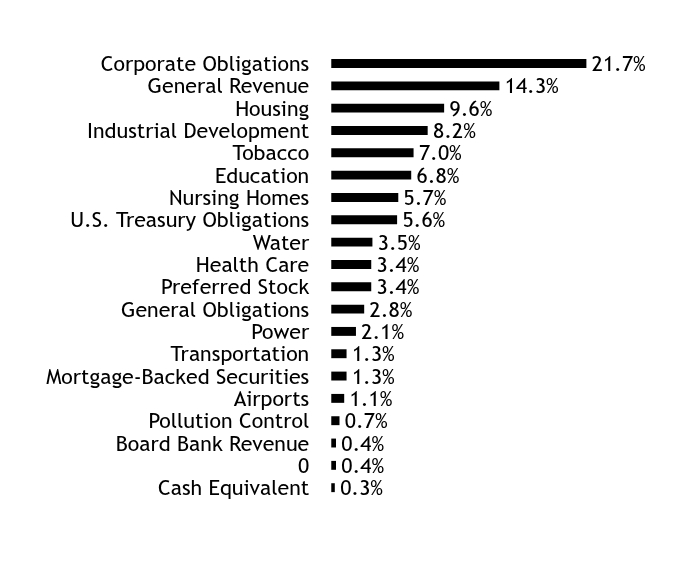
Asset WeightingsFootnote Reference*Table SummaryValue | Value |
|---|
Cash Equivalent | 0.3% | | 0.4% | Board Bank Revenue | 0.4% | Pollution Control | 0.7% | Airports | 1.1% | Mortgage-Backed Securities | 1.3% | Transportation | 1.3% | Power | 2.1% | General Obligations | 2.8% | Preferred Stock | 3.4% | Health Care | 3.4% | Water | 3.5% | U.S. Treasury Obligations | 5.6% | Nursing Homes | 5.7% | Education | 6.8% | Tobacco | 7.0% | Industrial Development | 8.2% | Housing | 9.6% | General Revenue | 14.3% | Corporate Obligations | 21.7% | | Footnote | Description | Footnote* | Percentages are calculated based on total net assets. |
|
| Largest Holdings [Text Block] |
Table SummaryHolding Name | Coupon Rate | Maturity Date | Percentage of Total
Net AssetsFootnote Reference(A) |
|---|
United States Treasury Bill | 3.632%
| 06/02/26
| 1.7% | Puerto Rico, Sub-Ser Senior | 0.000%
| 11/01/51
| 1.5% | Texas State, Water Development Board, Ser A | 4.875%
| 10/15/48
| 1.3% | Puerto Rico, Sales Tax Financing, Sales Tax Revenue, Ser A1 | 0.000%
| 07/01/51
| 1.3% | United States Treasury Bill | 3.635%
| 05/21/26
| 1.2% | Take Back and Exit Facility | 8.500%
| 10/21/27
| 1.1% | North Fort Bend Water Authority, Ser A | 4.000%
| 12/15/44
| 1.0% | Puerto Rico, GDB Debt Recovery Authority | 7.500%
| 08/20/40
| 1.0% | M-S-R, Energy Authority, Ser C | 6.500%
| 11/01/39
| 0.9% | West Virginia State, Tobacco Settlement, Finance Authority, Ser B | 0.000%
| 06/01/47
| 0.9% | | Footnote | Description | Footnote(A) | Cash Equivalents are not shown in the top ten chart. |
|
| C000147418 |
|
| Shareholder Report [Line Items] |
|
| Fund Name |
Tax-Advantaged Income Fund
|
| Class Name |
Class Y
|
| Trading Symbol |
STAYX
|
| Annual or Semi-Annual Statement [Text Block] |
Semi-Annual Shareholder Report
|
| Shareholder Report Annual or Semi-Annual |
semi-annual shareholder report
|
| Additional Information [Text Block] |
This semi-annual shareholder report contains important information about Class Y Shares of the Tax-Advantaged Income Fund (the "Fund") for the period from September 1, 2025 to February 28, 2026. You can find additional information about the Fund at https://www.seic.com/mutual-fund-documentation/prospectuses-and-reports. You can also request this information by contacting us at (610) 676-1000.
|
| Additional Information Phone Number |
(610) 676-1000
|
| Additional Information Website |
https://www.seic.com/mutual-fund-documentation/prospectuses-and-reports
|
| Expenses [Text Block] |
What were the Fund costs for the last six months?(based on a hypothetical $10,000 investment) Table SummaryFund Name | Costs of a $10,000 investment | Costs paid as a percentage of a $10,000 investment |
|---|
Tax-Advantaged Income Fund, Class Y Shares | $31 | 0.61% |
|---|
|
| Expenses Paid, Amount |
$ 31
|
| Expense Ratio, Percent |
0.61%
|
| AssetsNet |
$ 824,532,000
|
| Holdings Count | Holding |
441
|
| Advisory Fees Paid, Amount |
$ 1,492
|
| InvestmentCompanyPortfolioTurnover |
14.00%
|
| Additional Fund Statistics [Text Block] |
Key Fund Statistics as of February 28, 2026Table Summary | Total Net Assets (000's) | Number of Holdings | Total Advisory Fees Paid (000's) | Portfolio Turnover Rate |
|---|
| $824,532 | 441 | $1,492 | 14% |
|---|
|
| Holdings [Text Block] |
Asset WeightingsFootnote Reference*Table SummaryValue | Value |
|---|
Cash Equivalent | 0.3% | | 0.4% | Board Bank Revenue | 0.4% | Pollution Control | 0.7% | Airports | 1.1% | Mortgage-Backed Securities | 1.3% | Transportation | 1.3% | Power | 2.1% | General Obligations | 2.8% | Preferred Stock | 3.4% | Health Care | 3.4% | Water | 3.5% | U.S. Treasury Obligations | 5.6% | Nursing Homes | 5.7% | Education | 6.8% | Tobacco | 7.0% | Industrial Development | 8.2% | Housing | 9.6% | General Revenue | 14.3% | Corporate Obligations | 21.7% | | Footnote | Description | Footnote* | Percentages are calculated based on total net assets. |
|
| Largest Holdings [Text Block] |
Table SummaryHolding Name | Coupon Rate | Maturity Date | Percentage of Total
Net AssetsFootnote Reference(A) |
|---|
United States Treasury Bill | 3.632%
| 06/02/26
| 1.7% | Puerto Rico, Sub-Ser Senior | 0.000%
| 11/01/51
| 1.5% | Texas State, Water Development Board, Ser A | 4.875%
| 10/15/48
| 1.3% | Puerto Rico, Sales Tax Financing, Sales Tax Revenue, Ser A1 | 0.000%
| 07/01/51
| 1.3% | United States Treasury Bill | 3.635%
| 05/21/26
| 1.2% | Take Back and Exit Facility | 8.500%
| 10/21/27
| 1.1% | North Fort Bend Water Authority, Ser A | 4.000%
| 12/15/44
| 1.0% | Puerto Rico, GDB Debt Recovery Authority | 7.500%
| 08/20/40
| 1.0% | M-S-R, Energy Authority, Ser C | 6.500%
| 11/01/39
| 0.9% | West Virginia State, Tobacco Settlement, Finance Authority, Ser B | 0.000%
| 06/01/47
| 0.9% | | Footnote | Description | Footnote(A) | Cash Equivalents are not shown in the top ten chart. |
|