Pay vs Performance Disclosure - USD ($)
|
3 Months Ended |
12 Months Ended |
Apr. 28, 2024 |
Feb. 01, 2026 |
Feb. 02, 2025 |
Jan. 28, 2024 |
Jan. 29, 2023 |
Jan. 30, 2022 |
| Pay vs Performance Disclosure |
|
|
|
|
|
|
| Pay vs Performance Disclosure, Table |
|
| | | | | | | | | | | | | | | | | | | | | | | | | | | | Year | Summary Compensation Table Total for PEO(1) | Compensation Actually Paid to PEO(1)(2)(3) | Average Summary Compensation Table Total for Non-PEO NEOs(1) | Average Compensation Actually Paid to Non-PEO NEOs(1)(2)(4) | Value of Initial Fixed $100 Investment Based On: | Net Income (millions)(7) | Adjusted EPS(8) | Total Stockholder Return(5) | Peer Group Total Stockholder Return(6) | | (a) | (b) | (c) | (d) | (e) | (f) | (g) | (h) | (i) | | 2025 | $33,297,422 | $56,216,918 | $5,242,664 | $6,804,597 | $349.00 | $164.12 | $1,088 | $9.57(9) | | 2024 | $27,692,374 | $132,461,444 | $5,338,172 | $21,413,899 | $355.00 | $161.20 | $1,125 | $8.50(10) | | 2023 | $23,696,540 | $65,270,818 | $6,238,565 | $13,793,742 | $172.58 | $114.73 | $950 | $7.43 | | 2022 | $17,322,255 | $(163,581) | $5,596,435 | $(3,488,288) | $102.31 | $88.85 | $1,128 | $8.27 | | 2021 | $21,324,327 | $78,793,201 | $6,411,575 | $15,913,266 | $122.02 | $108.64 | $1,126 | $7.43 |
|
|
|
|
|
| Company Selected Measure Name |
|
Adjusted EPS
|
|
|
|
|
| Named Executive Officers, Footnote |
|
The following table lists the PEO and non-PEO NEOs for each of fiscal years 2025, 2024, 2023, 2022 and 2021. | | | | | | | | | | Year | PEO | Non-PEO NEOs | | 2025 | Laura Alber | Jeff Howie, Monica Bhargava, David King and Karalyn Yearout | | 2024 | Laura Alber | Jeff Howie, Monica Bhargava, David King and Karalyn Yearout | | 2023 | Laura Alber | Jeff Howie, Marta Benson, David King and Karalyn Yearout | | 2022 | Laura Alber | Jeff Howie, Marta Benson, David King, Alex Bellos and Julie Whalen | | 2021 | Laura Alber | Julie Whalen, Alex Bellos, Marta Benson and Ryan Ross |
|
|
|
|
|
| Peer Group Issuers, Footnote |
|
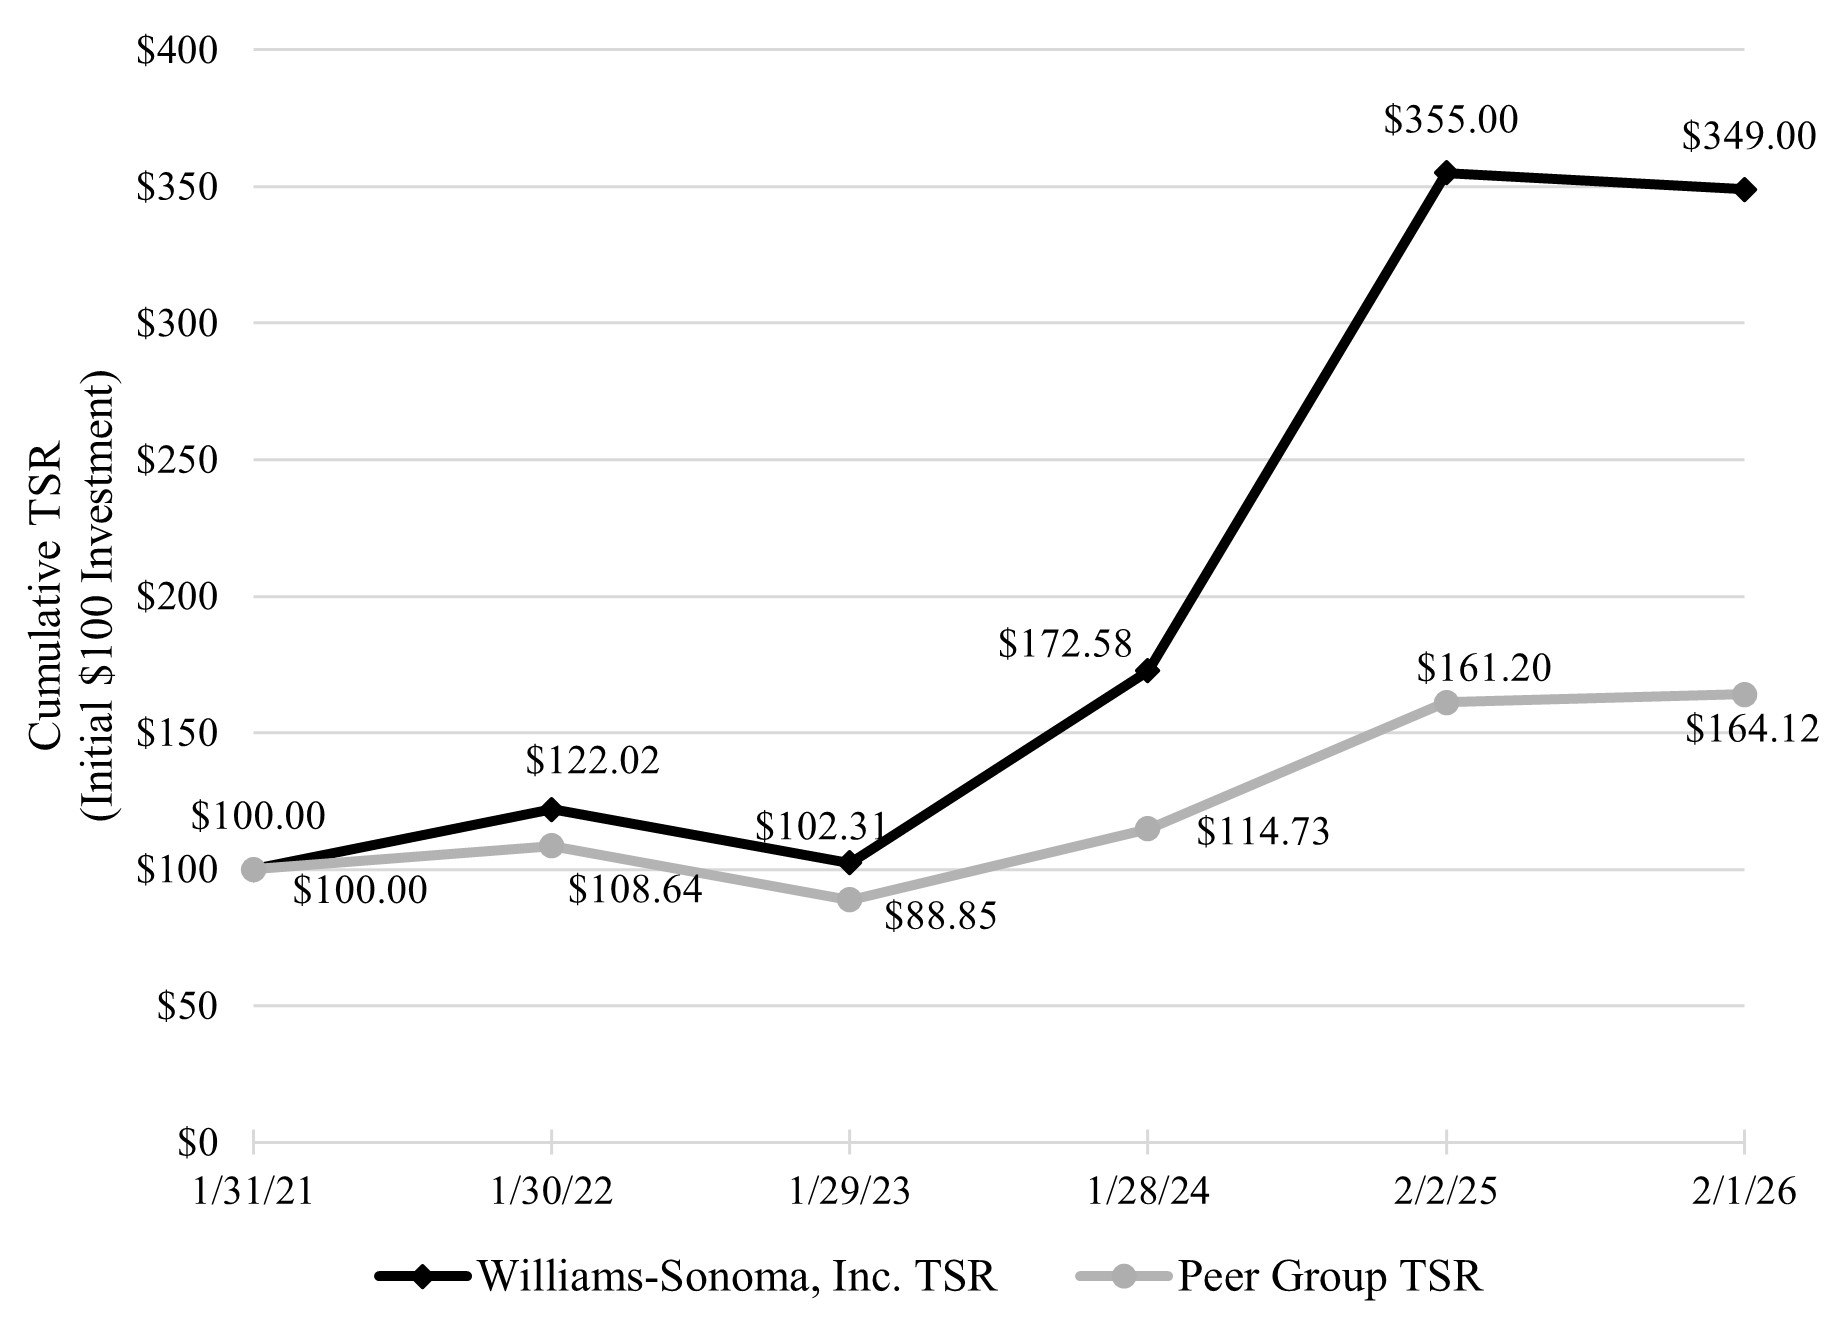
The Company’s peer group total stockholder return, or the Peer Group TSR, set forth in this table was determined using the S&P 500 Consumer Discretionary Distribution and Retail industry index, which we also use in preparing the stock performance graph required by Item 201(e) of Regulation S-K for our Annual Report for the fiscal year ended February 1, 2026. The Peer Group TSR assumes an initial fixed investment of $100 on January 31, 2021, through the end of the listed fiscal year, as well as the reinvestment of dividends.
|
|
|
|
|
| PEO Total Compensation Amount |
|
$ 33,297,422
|
$ 27,692,374
|
$ 23,696,540
|
$ 17,322,255
|
$ 21,324,327
|
| PEO Actually Paid Compensation Amount |
|
$ 56,216,918
|
132,461,444
|
65,270,818
|
(163,581)
|
78,793,201
|
| Adjustment To PEO Compensation, Footnote |
|
The dollar amounts reported represent the amount of “compensation actually paid,” as calculated in accordance with the Pay Versus Performance Rules. These dollar amounts do not reflect the actual amounts of compensation earned by or paid to our NEOs during the applicable year. For purposes of calculating “compensation actually paid,” the fair value of equity awards is calculated in accordance with ASC Topic 718 using the same assumption methodologies used to calculate the grant date fair value of awards for purposes of the Summary Compensation Table (refer to the Summary Compensation Table for additional information).The following table shows the amounts deducted from and added to the Summary Compensation Table total to calculate “compensation actually paid” to Ms. Alber in accordance with the Pay Versus Performance Rules: | | | | | | | | | | | | | | | | | | | | | | | | | | | | | | | | Equity Award Adjustments | Compensation Actually Paid to PEO | | Year | Summary Compensation Table Total for PEO | Reported Value of Equity Awards | Year End Fair Value of Equity Awards Granted in the Year and Unvested at Year End | Year over Year Change in Fair Value of Outstanding and Unvested Equity Awards Granted in Prior Years | Fair Value as of Vesting Date of Equity Awards Granted and Vested in the Year | Change in Fair Value of Equity Awards Granted in Prior Years that Vested in the Year | Fair Value at the End of the Prior Year of Equity Awards that Failed to Meet Vesting Conditions in the Year | Value of Dividends or other Earnings Paid on Stock or Option Awards not Otherwise Reflected in Fair Value | | 2025 | $33,297,422 | $(18,999,797) | $54,529,504 | $(1,759,212) | — | $(10,850,999) | — | — | $56,216,918 | | 2024 | $27,692,374 | $(15,999,690) | $39,825,913 | $69,008,157 | — | $11,934,690 | — | — | $132,461,444 | | 2023 | $23,696,540 | $(13,999,878) | $38,529,195 | $19,637,693 | — | $(2,592,732) | — | — | $65,270,818 | | 2022 | $17,322,255 | $(11,999,916) | $9,258,310 | $(12,970,739) | — | $(1,773,491) | — | — | $(163,581) | | 2021 | $21,324,327 | $(11,999,857) | $21,522,305 | $31,916,002 | — | $16,030,424 | — | — | $78,793,201 |
|
|
|
|
|
| Non-PEO NEO Average Total Compensation Amount |
|
$ 5,242,664
|
5,338,172
|
6,238,565
|
5,596,435
|
6,411,575
|
| Non-PEO NEO Average Compensation Actually Paid Amount |
|
$ 6,804,597
|
21,413,899
|
13,793,742
|
(3,488,288)
|
15,913,266
|
| Adjustment to Non-PEO NEO Compensation Footnote |
|
The following table shows the amounts deducted from and added to the average Summary Compensation Table total to calculate the average “compensation actually paid” to our non-PEO NEOs in accordance with the Pay Versus Performance Rules. | | | | | | | | | | | | | | | | | | | | | | | | | | | | | | | | Equity Award Adjustments | Average Compensation Actually Paid to Non-PEO NEOs | | Year | Average Summary Compensation Table Total for Non-PEO NEOs | Average Reported Value of Equity Awards | Average Year End Fair Value of Equity Awards Granted in the Year and Unvested at Year End | Average Year over Year Change in Fair Value of Outstanding and Unvested Equity Awards Granted in Prior Years | Average Fair Value as of Vesting Date of Equity Awards Granted and Vested in the Year | Average Change in Fair Value of Equity Awards Granted in Prior Years that Vested in the Year | Average Fair Value at the End of the Prior Year of Equity Awards that Failed to Meet Vesting Conditions in the Year | Average Value of Dividends or other Earnings Paid on Stock or Option Awards not Otherwise Reflected in Fair Value | | 2025 | $5,242,664 | $(2,374,923) | $6,125,226 | $(319,697) | — | $(1,868,673) | — | — | $6,804,597 | | 2024 | $5,338,172 | $(2,374,778) | $5,610,605 | $11,201,826 | — | $1,638,074 | — | — | $21,413,899 | | 2023 | $6,238,565 | $(4,062,400) | $7,798,414 | $4,015,120 | — | $(195,957) | — | — | $13,793,742 | | 2022 | $5,596,435 | $(3,899,851) | $1,978,459 | $(984,095) | — | $(252,583) | $(5,926,653) | — | $(3,488,288) | | 2021 | $6,411,575 | $(3,062,327) | $4,943,199 | $5,227,599 | — | $2,393,220 | — | — | $15,913,266 |
|
|
|
|
|
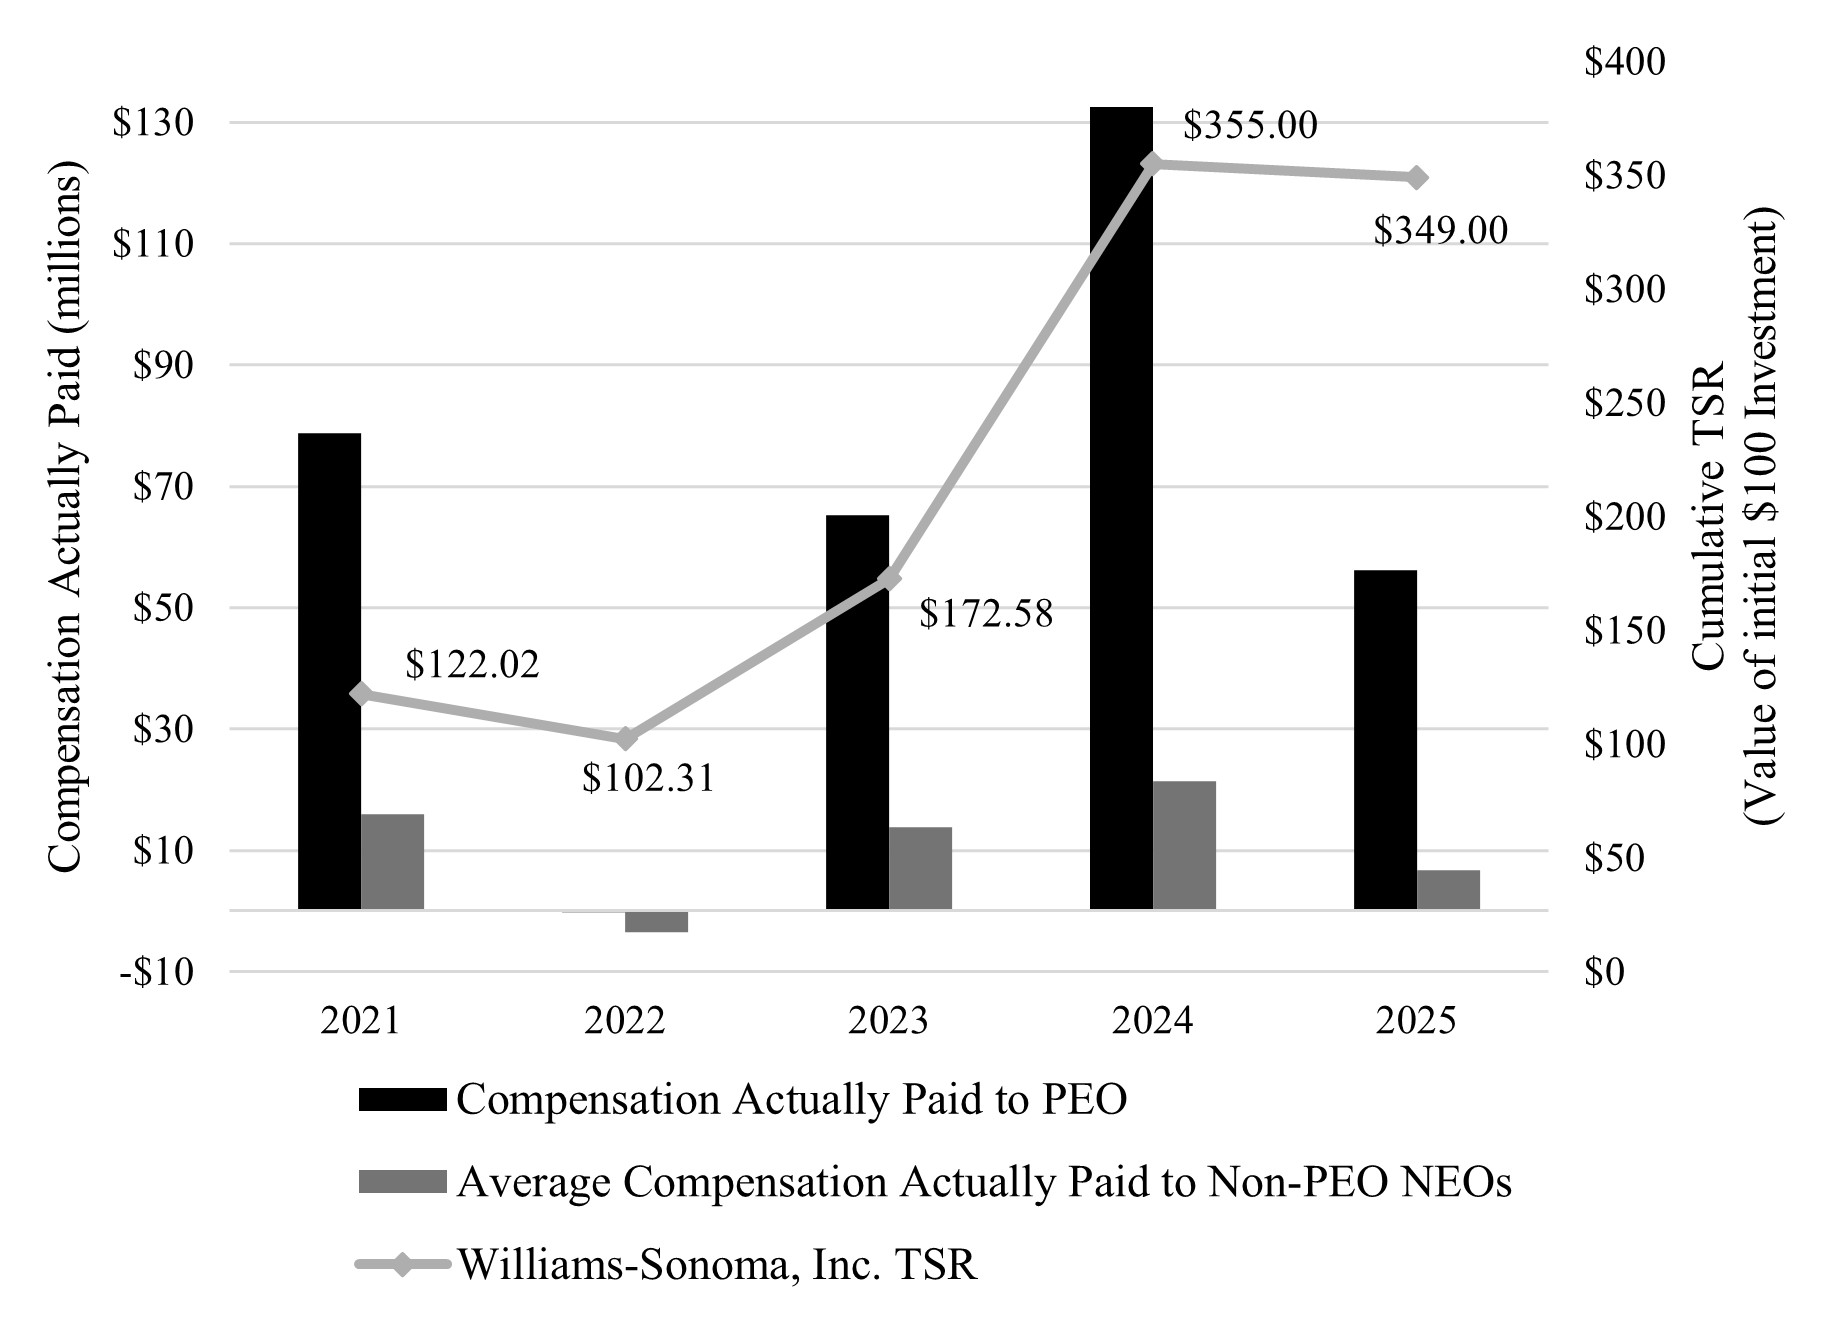
| Compensation Actually Paid vs. Total Shareholder Return |
|
Compensation Actually Paid and Company TSR
|
|
|
|
|
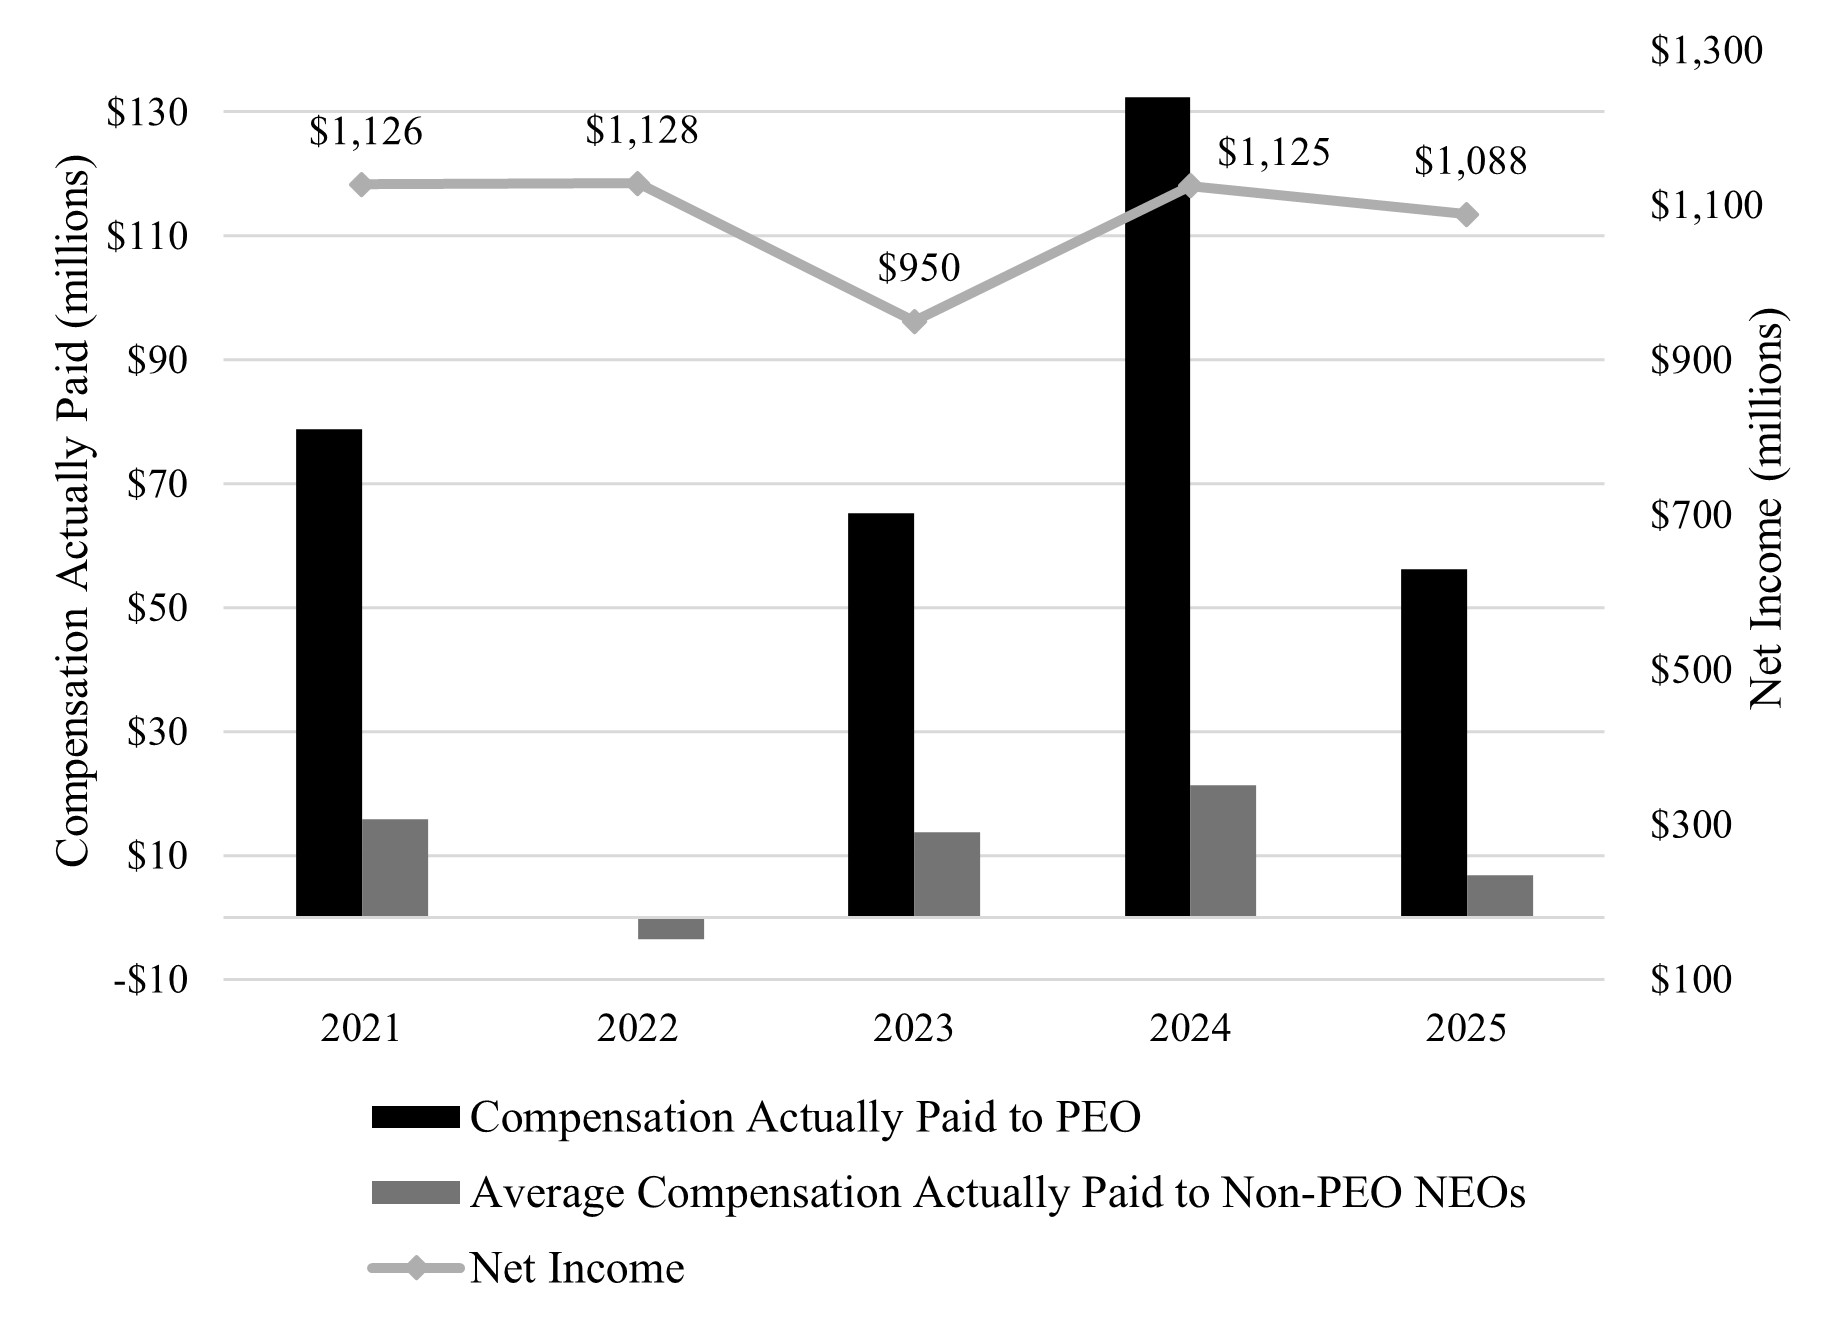
| Compensation Actually Paid vs. Net Income |
|
Compensation Actually Paid and Net Income
|
|
|
|
|
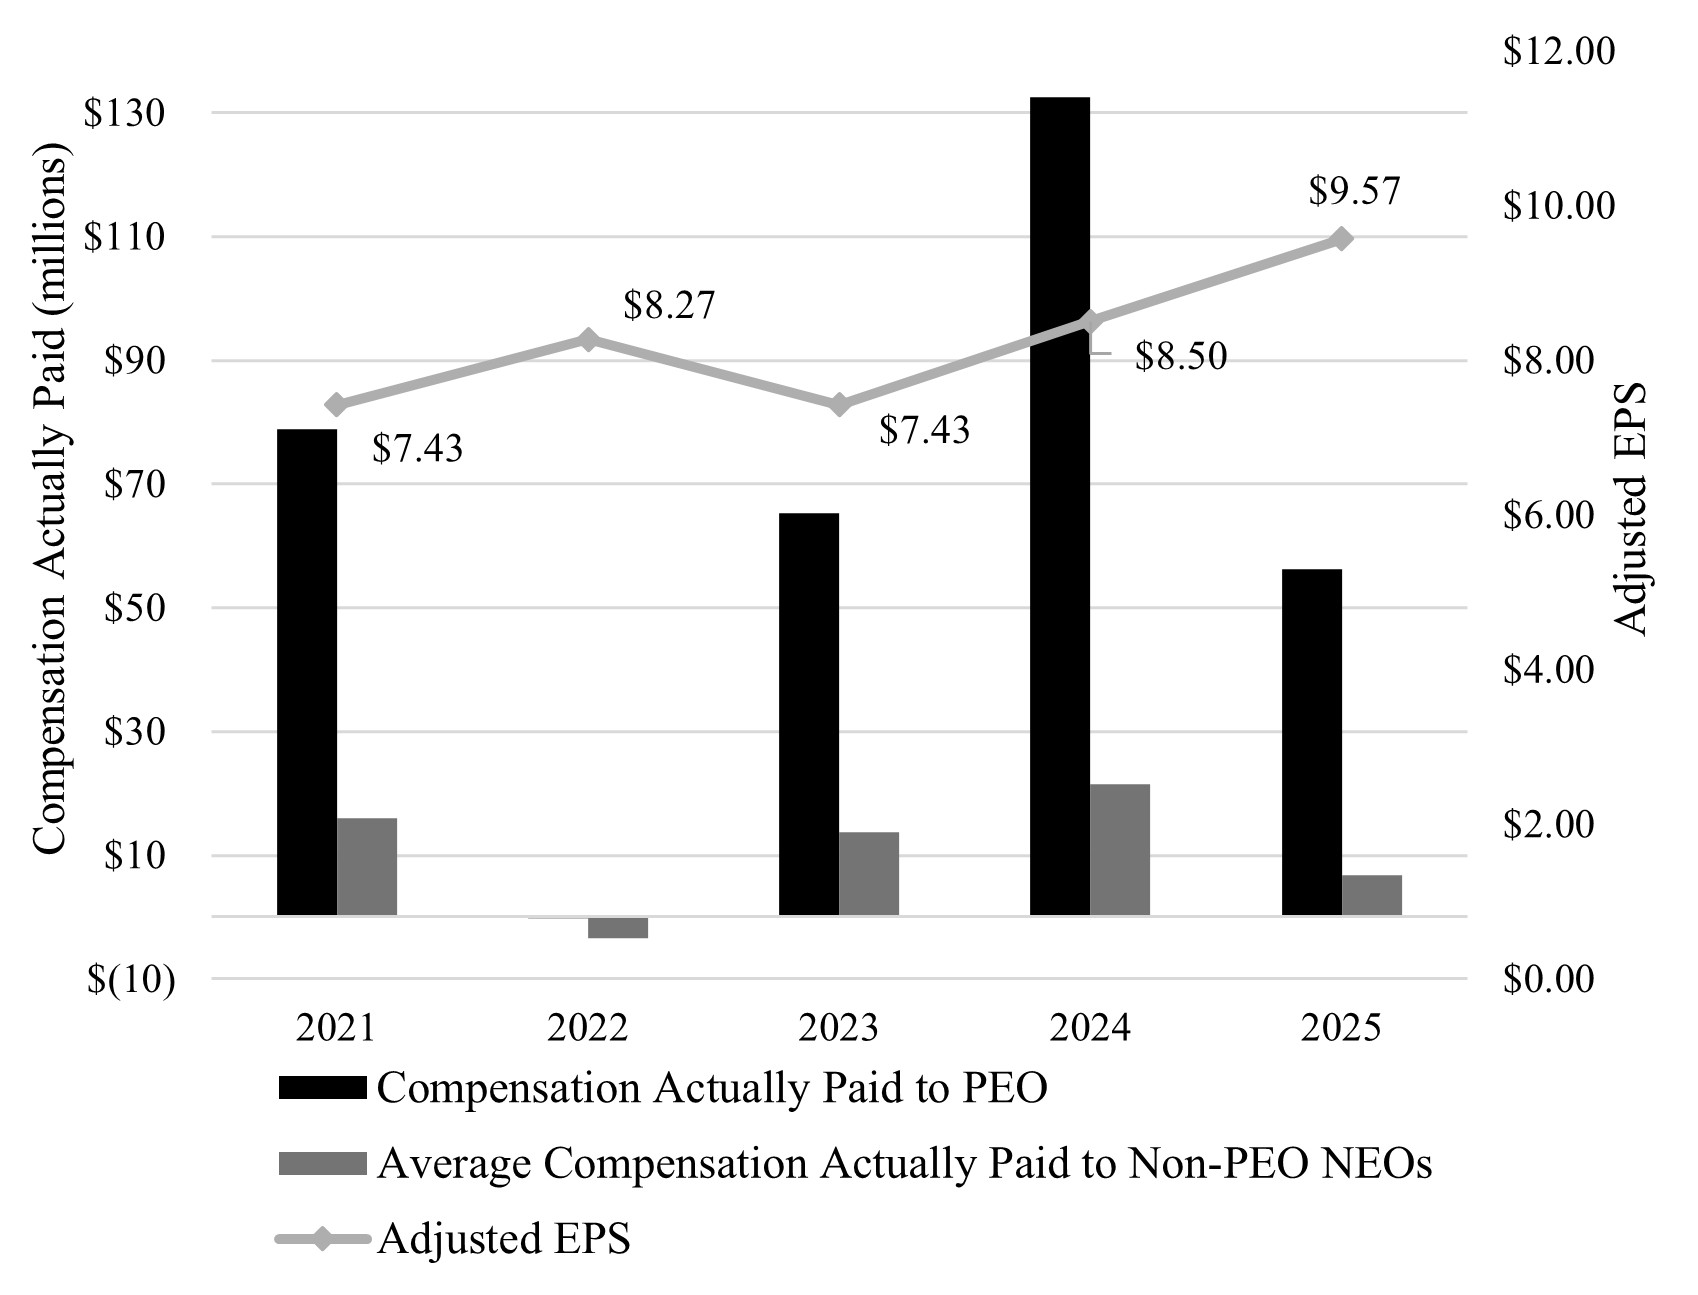
| Compensation Actually Paid vs. Company Selected Measure |
|
Compensation Actually Paid and Adjusted EPS
|
|
|
|
|
| Total Shareholder Return Vs Peer Group |
|
Company TSR and Peer Group TSR(1) (1) As noted above, the Company and the Peer Group TSR assumes an initial fixed investment of $100 on January 31, 2021, the last day of the Company’s 2020 fiscal year, through February 1, 2026, the last day of the Company’s 2025 fiscal year, as well as the reinvestment of dividends.
|
|
|
|
|
| Tabular List, Table |
|
| | | | Most Important Performance Measures | •Adjusted EPS | •Revenue (3-year CAGR) | •EPS (3-year CAGR) | •Operating Cash Flow (3-year average) | •Adjusted ROIC (3-year average) |
|
|
|
|
|
| Total Shareholder Return Amount |
|
$ 349.00
|
355.00
|
172.58
|
102.31
|
122.02
|
| Peer Group Total Shareholder Return Amount |
|
164.12
|
161.20
|
114.73
|
88.85
|
108.64
|
| Net Income (Loss) |
|
$ 1,088,000,000
|
$ 1,125,000,000
|
$ 950,000,000
|
$ 1,128,000,000
|
$ 1,126,000,000
|
| Company Selected Measure Amount |
|
9.57
|
8.50
|
7.43
|
8.27
|
7.43
|
| PEO Name |
|
Laura Alber
|
Laura Alber
|
Laura Alber
|
Laura Alber
|
Laura Alber
|
| Additional 402(v) Disclosure |
|
The Company TSR assumes an initial fixed investment of $100 on January 31, 2021, through the end of the listed fiscal year, as well as the reinvestment of dividends. The dollar amounts reported represent the amount of net income reflected in the Company’s audited financial statements for the applicable year.
|
|
|
|
|
| Freight Adjustment, Price Per Share |
|
|
$ 0.29
|
|
|
|
| Freight Adjustment, Amount |
$ 49,000,000
|
|
|
|
|
|
| Measure:: 1 |
|
|
|
|
|
|
| Pay vs Performance Disclosure |
|
|
|
|
|
|
| Name |
|
•Adjusted EPS
|
|
|
|
|
| Non-GAAP Measure Description |
|
Prior to fiscal 2024, non-GAAP diluted earnings per share was determined to be the most important financial measure used to link “compensation actually paid” to our NEOs to Company performance. Beginning in fiscal 2024, we have determined that our most important financial measure used to link “compensation actually paid” to our NEOs to Company performance is non-GAAP diluted earnings per share adjusted to include the effects of any out-of-period adjustment, which we refer to as “Adjusted EPS”. Adjusted EPS is our “Company Selected Measure” as defined in the Pay Versus Performance Rules. We use achievement of Adjusted EPS performance to fund our Annual Bonus Plan and allocate awards to reflect brand and operational performance. Adjusted EPS is defined as GAAP diluted earnings per share, excluding or including (i) any extraordinary non-recurring or unusual items, (ii) the effect of any changes in accounting principles affecting the Company’s or a business unit’s reported results, as approved by the Chair of the Compensation Committee, and (iii) the effects of any out-of-period adjustment. “Adjusted EPS” is computed as net earnings, exclusive of certain items as described above, divided by the weighted average number of common shares outstanding plus common stock equivalents for the period. “Common stock equivalents” consists of shares subject to stock-based awards with exercise prices less than or equal to the average market price of our common stock for the period, to the extent their inclusion would be dilutive. For fiscal 2025, in determining achievement of Adjusted EPS performance to fund our 2025 Annual Bonus Plan, the only adjustment made to diluted earnings per share was to exclude the impact of the tariffs introduced in 2025, which were not included in the Company’s fiscal 2025 budget.For fiscal 2024, in determining achievement of Adjusted EPS performance to fund our 2024 Annual Bonus Plan, the only adjustment made to diluted earnings per share was to exclude $0.29 per share, which represents the impact of the out-of-period freight adjustment of $49 million in the first quarter of fiscal 2024. See Appendix A for a discussion of the out-of-period adjustment.
|
|
|
|
|
| Measure:: 2 |
|
|
|
|
|
|
| Pay vs Performance Disclosure |
|
|
|
|
|
|
| Name |
|
•Revenue (3-year CAGR)
|
|
|
|
|
| Measure:: 3 |
|
|
|
|
|
|
| Pay vs Performance Disclosure |
|
|
|
|
|
|
| Name |
|
•EPS (3-year CAGR)
|
|
|
|
|
| Measure:: 4 |
|
|
|
|
|
|
| Pay vs Performance Disclosure |
|
|
|
|
|
|
| Name |
|
•Operating Cash Flow (3-year average)
|
|
|
|
|
| Measure:: 5 |
|
|
|
|
|
|
| Pay vs Performance Disclosure |
|
|
|
|
|
|
| Name |
|
•Adjusted ROIC (3-year average)
|
|
|
|
|
| PEO | Aggregate Grant Date Fair Value of Equity Award Amounts Reported in Summary Compensation Table |
|
|
|
|
|
|
| Pay vs Performance Disclosure |
|
|
|
|
|
|
| Adjustment to Compensation, Amount |
|
$ (18,999,797)
|
$ (15,999,690)
|
$ (13,999,878)
|
$ (11,999,916)
|
$ (11,999,857)
|
| PEO | Year-end Fair Value of Equity Awards Granted in Covered Year that are Outstanding and Unvested |
|
|
|
|
|
|
| Pay vs Performance Disclosure |
|
|
|
|
|
|
| Adjustment to Compensation, Amount |
|
54,529,504
|
39,825,913
|
38,529,195
|
9,258,310
|
21,522,305
|
| PEO | Year-over-Year Change in Fair Value of Equity Awards Granted in Prior Years That are Outstanding and Unvested |
|
|
|
|
|
|
| Pay vs Performance Disclosure |
|
|
|
|
|
|
| Adjustment to Compensation, Amount |
|
(1,759,212)
|
69,008,157
|
19,637,693
|
(12,970,739)
|
31,916,002
|
| PEO | Vesting Date Fair Value of Equity Awards Granted and Vested in Covered Year |
|
|
|
|
|
|
| Pay vs Performance Disclosure |
|
|
|
|
|
|
| Adjustment to Compensation, Amount |
|
0
|
0
|
0
|
0
|
0
|
| PEO | Change in Fair Value as of Vesting Date of Prior Year Equity Awards Vested in Covered Year |
|
|
|
|
|
|
| Pay vs Performance Disclosure |
|
|
|
|
|
|
| Adjustment to Compensation, Amount |
|
(10,850,999)
|
11,934,690
|
(2,592,732)
|
(1,773,491)
|
16,030,424
|
| PEO | Prior Year End Fair Value of Equity Awards Granted in Any Prior Year that Fail to Meet Applicable Vesting Conditions During Covered Year |
|
|
|
|
|
|
| Pay vs Performance Disclosure |
|
|
|
|
|
|
| Adjustment to Compensation, Amount |
|
0
|
0
|
0
|
0
|
0
|
| PEO | Dividends or Other Earnings Paid on Equity Awards not Otherwise Reflected in Total Compensation for Covered Year |
|
|
|
|
|
|
| Pay vs Performance Disclosure |
|
|
|
|
|
|
| Adjustment to Compensation, Amount |
|
0
|
0
|
0
|
0
|
0
|
| Non-PEO NEO | Aggregate Grant Date Fair Value of Equity Award Amounts Reported in Summary Compensation Table |
|
|
|
|
|
|
| Pay vs Performance Disclosure |
|
|
|
|
|
|
| Adjustment to Compensation, Amount |
|
(2,374,923)
|
(2,374,778)
|
(4,062,400)
|
(3,899,851)
|
(3,062,327)
|
| Non-PEO NEO | Year-end Fair Value of Equity Awards Granted in Covered Year that are Outstanding and Unvested |
|
|
|
|
|
|
| Pay vs Performance Disclosure |
|
|
|
|
|
|
| Adjustment to Compensation, Amount |
|
6,125,226
|
5,610,605
|
7,798,414
|
1,978,459
|
4,943,199
|
| Non-PEO NEO | Year-over-Year Change in Fair Value of Equity Awards Granted in Prior Years That are Outstanding and Unvested |
|
|
|
|
|
|
| Pay vs Performance Disclosure |
|
|
|
|
|
|
| Adjustment to Compensation, Amount |
|
(319,697)
|
11,201,826
|
4,015,120
|
(984,095)
|
5,227,599
|
| Non-PEO NEO | Vesting Date Fair Value of Equity Awards Granted and Vested in Covered Year |
|
|
|
|
|
|
| Pay vs Performance Disclosure |
|
|
|
|
|
|
| Adjustment to Compensation, Amount |
|
0
|
0
|
0
|
0
|
0
|
| Non-PEO NEO | Change in Fair Value as of Vesting Date of Prior Year Equity Awards Vested in Covered Year |
|
|
|
|
|
|
| Pay vs Performance Disclosure |
|
|
|
|
|
|
| Adjustment to Compensation, Amount |
|
(1,868,673)
|
1,638,074
|
(195,957)
|
(252,583)
|
2,393,220
|
| Non-PEO NEO | Prior Year End Fair Value of Equity Awards Granted in Any Prior Year that Fail to Meet Applicable Vesting Conditions During Covered Year |
|
|
|
|
|
|
| Pay vs Performance Disclosure |
|
|
|
|
|
|
| Adjustment to Compensation, Amount |
|
0
|
0
|
0
|
(5,926,653)
|
0
|
| Non-PEO NEO | Dividends or Other Earnings Paid on Equity Awards not Otherwise Reflected in Total Compensation for Covered Year |
|
|
|
|
|
|
| Pay vs Performance Disclosure |
|
|
|
|
|
|
| Adjustment to Compensation, Amount |
|
$ 0
|
$ 0
|
$ 0
|
$ 0
|
$ 0
|