Shareholder Report
Feb. 28, 2026
USD ($)
$ / shares
WHAT WERE THE FUND COSTS FOR THE PAST YEAR? (based on a hypothetical $10,000 investment)
|
Class Name
|
Costs of a $10,000 investment
|
Costs paid as a percentage of a $10,000 investment
|
|
Class A
|
$120
|
1.20%
|
HOW DID THE FUND PERFORM LAST YEAR AND WHAT AFFECTED ITS PERFORMANCE?
During much of the period from March 1, 2025, to February 28, 2026, the Dearborn Partners Rising Dividend Fund’s performance underperformed that of the benchmark (S&P 500 Total Return Index) because stocks with high momentum outperformed stocks with low momentum. Many high momentum stocks do not meet the stringent criteria for the Dearborn Partners Rising Dividend strategy.
The Fund outperformed the benchmark in two of the eleven sectors into which Standard & Poor’s divides the marketplace: Consumer Staples and Real Estate. The Fund underperformed the benchmark in the remaining sectors. During the fiscal year, 49 of the Fund’s positions increased their dividend at an average rate of 8.9%, well ahead of the average rate of inflation, as measured by the Core Consumer Price Index, of 2.43% during this fiscal year. A primary objective of our Rising Dividend strategy is to try to help investors keep ahead of the rising costs of living through above average dividend growth.
|
Top Contributors
|
|
|
↑
|
Casey’s General Stores, Inc.
|
|
↑
|
Amphenol Corp. - Class A
|
|
↑
|
Exxon Mobil Corp.
|
|
↑
|
Corteva, Inc.
|
|
↑
|
Atmos Energy Corp.
|
|
Top Detractors
|
|
|
↓
|
Thomson Reuters Corp.
|
|
↓
|
Arthur J Gallagher & Co.
|
|
↓
|
Automatic Data Processing, Inc.
|
|
↓
|
Accenture PLC - Class A
|
|
↓
|
Intuit, Inc.
|
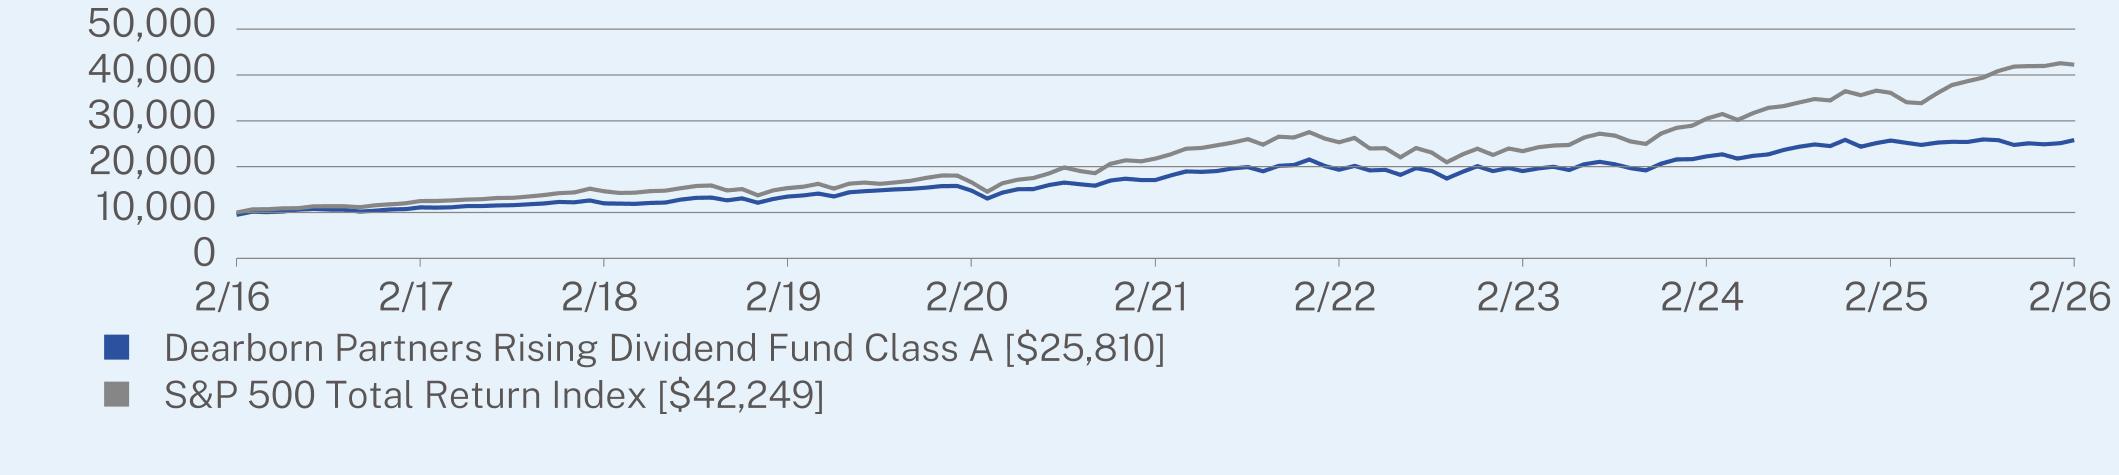
ANNUAL AVERAGE TOTAL RETURN (%)
|
|
1 Year
|
5 Year
|
10 Year
|
|
Class A (without sales charge)
|
0.44
|
8.60
|
10.51
|
|
Class A (with sales charge)
|
-4.57
|
7.49
|
9.95
|
|
S&P 500 Total Return Index
|
16.99
|
14.19
|
15.50
|
Visit https://www.dearbornfunds.com/literature.html for more recent performance information.
KEY FUND STATISTICS (as of February 28, 2026)
|
Net Assets
|
$564,822,148
|
|
Number of Holdings
|
50
|
|
Net Advisory Fee
|
$4,706,938
|
|
Portfolio Turnover
|
11%
|
WHAT DID THE FUND INVEST IN? (% of net assets as of February 28, 2026)
|
Top 10 Issuers
|
(%)
|
|
Apple, Inc.
|
6.2%
|
|
Casey’s General Stores, Inc.
|
4.4%
|
|
Microsoft Corp.
|
3.4%
|
|
Atmos Energy Corp.
|
3.2%
|
|
Corteva, Inc.
|
2.8%
|
|
Snap-on, Inc.
|
2.6%
|
|
Exxon Mobil Corp.
|
2.5%
|
|
Motorola Solutions, Inc.
|
2.5%
|
|
Stryker Corp.
|
2.4%
|
|
Republic Services, Inc.
|
2.4%
|
|
Top Sectors*
|
(%)
|
|
Information Technology
|
20.6%
|
|
Industrials
|
18.2%
|
|
Consumer Staples
|
13.2%
|
|
Financials
|
11.6%
|
|
Health Care
|
10.0%
|
|
Utilities
|
6.0%
|
|
Materials
|
5.0%
|
|
Consumer Discretionary
|
4.9%
|
|
Communication Services
|
3.8%
|
|
Cash & Other
|
6.7%
|
WHAT WERE THE FUND COSTS FOR THE PAST YEAR? (based on a hypothetical $10,000 investment)
|
Class Name
|
Costs of a $10,000 investment
|
Costs paid as a percentage of a $10,000 investment
|
|
Class C
|
$195
|
1.95%
|
HOW DID THE FUND PERFORM LAST YEAR AND WHAT AFFECTED ITS PERFORMANCE?
During much of the period from March 1, 2025, to February 28, 2026, the Dearborn Partners Rising Dividend Fund’s performance underperformed that of the benchmark (S&P 500 Total Return Index) because stocks with high momentum outperformed stocks with low momentum. Many high momentum stocks do not meet the stringent criteria for the Dearborn Partners Rising Dividend strategy.
The Fund outperformed the benchmark in two of the eleven sectors into which Standard & Poor’s divides the marketplace: Consumer Staples and Real Estate. The Fund underperformed the benchmark in the remaining sectors. During the fiscal year, 49 of the Fund’s positions increased their dividend at an average rate of 8.9%, well ahead of the average rate of inflation, as measured by the Core Consumer Price Index, of 2.43% during this fiscal year. A primary objective of our Rising Dividend strategy is to try to help investors keep ahead of the rising costs of living through above average dividend growth.
|
Top Contributors
|
|
|
↑
|
Casey’s General Stores, Inc.
|
|
↑
|
Amphenol Corp. - Class A
|
|
↑
|
Exxon Mobil Corp.
|
|
↑
|
Corteva, Inc.
|
|
↑
|
Atmos Energy Corp.
|
|
Top Detractors
|
|
|
↓
|
Thomson Reuters Corp.
|
|
↓
|
Arthur J Gallagher & Co.
|
|
↓
|
Automatic Data Processing, Inc.
|
|
↓
|
Accenture PLC - Class A
|
|
↓
|
Intuit, Inc.
|
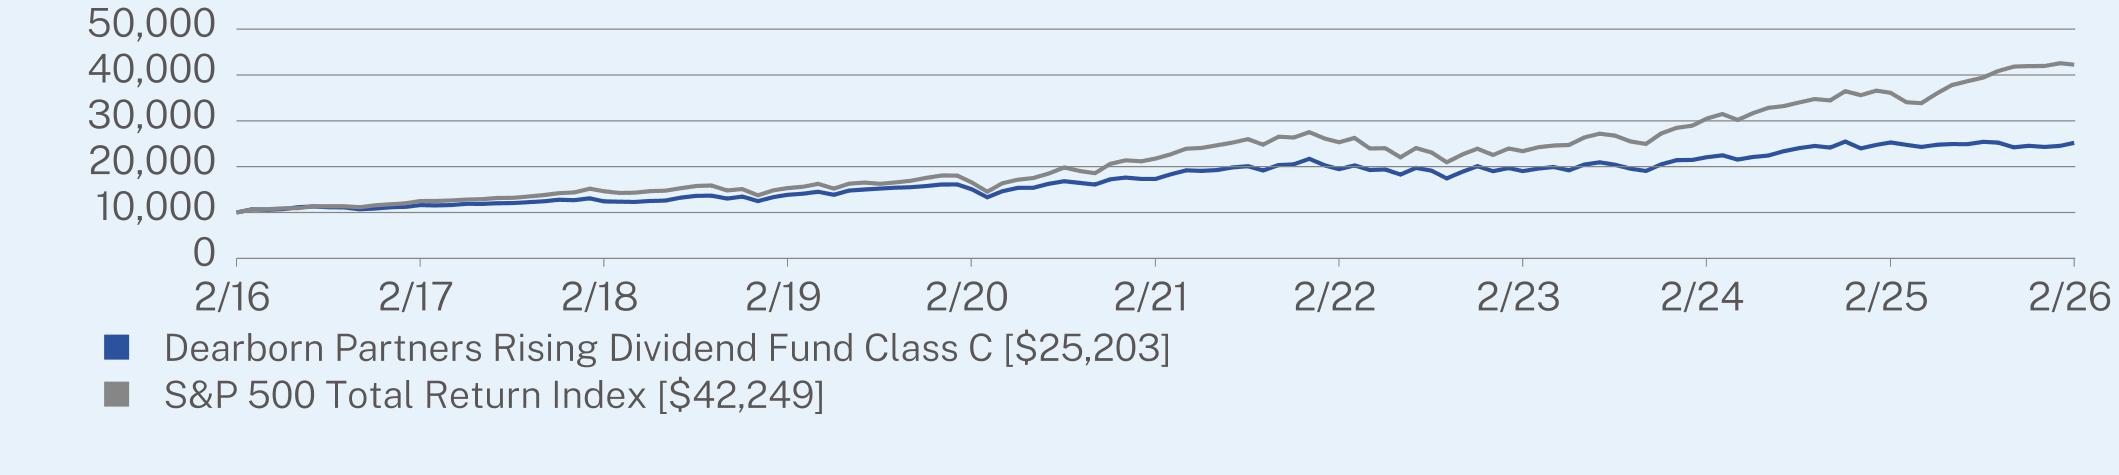
ANNUAL AVERAGE TOTAL RETURN (%)
|
|
1 Year
|
5 Year
|
10 Year
|
|
Class C (without sales charge)
|
-0.29
|
7.79
|
9.68
|
|
Class C (with sales charge)
|
-1.26
|
7.79
|
9.68
|
|
S&P 500 Total Return Index
|
16.99
|
14.19
|
15.50
|
Visit https://www.dearbornfunds.com/literature.html for more recent performance information.
KEY FUND STATISTICS (as of February 28, 2026)
|
Net Assets
|
$564,822,148
|
|
Number of Holdings
|
50
|
|
Net Advisory Fee
|
$4,706,938
|
|
Portfolio Turnover
|
11%
|
WHAT DID THE FUND INVEST IN? (% of net assets as of February 28, 2026)
|
Top 10 Issuers
|
(%)
|
|
Apple, Inc.
|
6.2%
|
|
Casey’s General Stores, Inc.
|
4.4%
|
|
Microsoft Corp.
|
3.4%
|
|
Atmos Energy Corp.
|
3.2%
|
|
Corteva, Inc.
|
2.8%
|
|
Snap-on, Inc.
|
2.6%
|
|
Exxon Mobil Corp.
|
2.5%
|
|
Motorola Solutions, Inc.
|
2.5%
|
|
Stryker Corp.
|
2.4%
|
|
Republic Services, Inc.
|
2.4%
|
|
Top Sectors*
|
(%)
|
|
Information Technology
|
20.6%
|
|
Industrials
|
18.2%
|
|
Consumer Staples
|
13.2%
|
|
Financials
|
11.6%
|
|
Health Care
|
10.0%
|
|
Utilities
|
6.0%
|
|
Materials
|
5.0%
|
|
Consumer Discretionary
|
4.9%
|
|
Communication Services
|
3.8%
|
|
Cash & Other
|
6.7%
|
WHAT WERE THE FUND COSTS FOR THE PAST YEAR? (based on a hypothetical $10,000 investment)
|
Class Name
|
Costs of a $10,000 investment
|
Costs paid as a percentage of a $10,000 investment
|
|
Class I
|
$95
|
0.95%
|
HOW DID THE FUND PERFORM LAST YEAR AND WHAT AFFECTED ITS PERFORMANCE?
During much of the period from March 1, 2025, to February 28, 2026, the Dearborn Partners Rising Dividend Fund’s performance underperformed that of the benchmark (S&P 500 Total Return Index) because stocks with high momentum outperformed stocks with low momentum. Many high momentum stocks do not meet the stringent criteria for the Dearborn Partners Rising Dividend strategy.
The Fund outperformed the benchmark in two of the eleven sectors into which Standard & Poor’s divides the marketplace: Consumer Staples and Real Estate. The Fund underperformed the benchmark in the remaining sectors. During the fiscal year, 49 of the Fund’s positions increased their dividend at an average rate of 8.9%, well ahead of the average rate of inflation, as measured by the Core Consumer Price Index, of 2.43% during this fiscal year. A primary objective of our Rising Dividend strategy is to try to help investors keep ahead of the rising costs of living through above average dividend growth.
|
Top Contributors
|
|
|
↑
|
Casey’s General Stores, Inc.
|
|
↑
|
Amphenol Corp. - Class A
|
|
↑
|
Exxon Mobil Corp.
|
|
↑
|
Corteva, Inc.
|
|
↑
|
Atmos Energy Corp.
|
|
Top Detractors
|
|
|
↓
|
Thomson Reuters Corp.
|
|
↓
|
Arthur J Gallagher & Co.
|
|
↓
|
Automatic Data Processing, Inc.
|
|
↓
|
Accenture PLC - Class A
|
|
↓
|
Intuit, Inc.
|
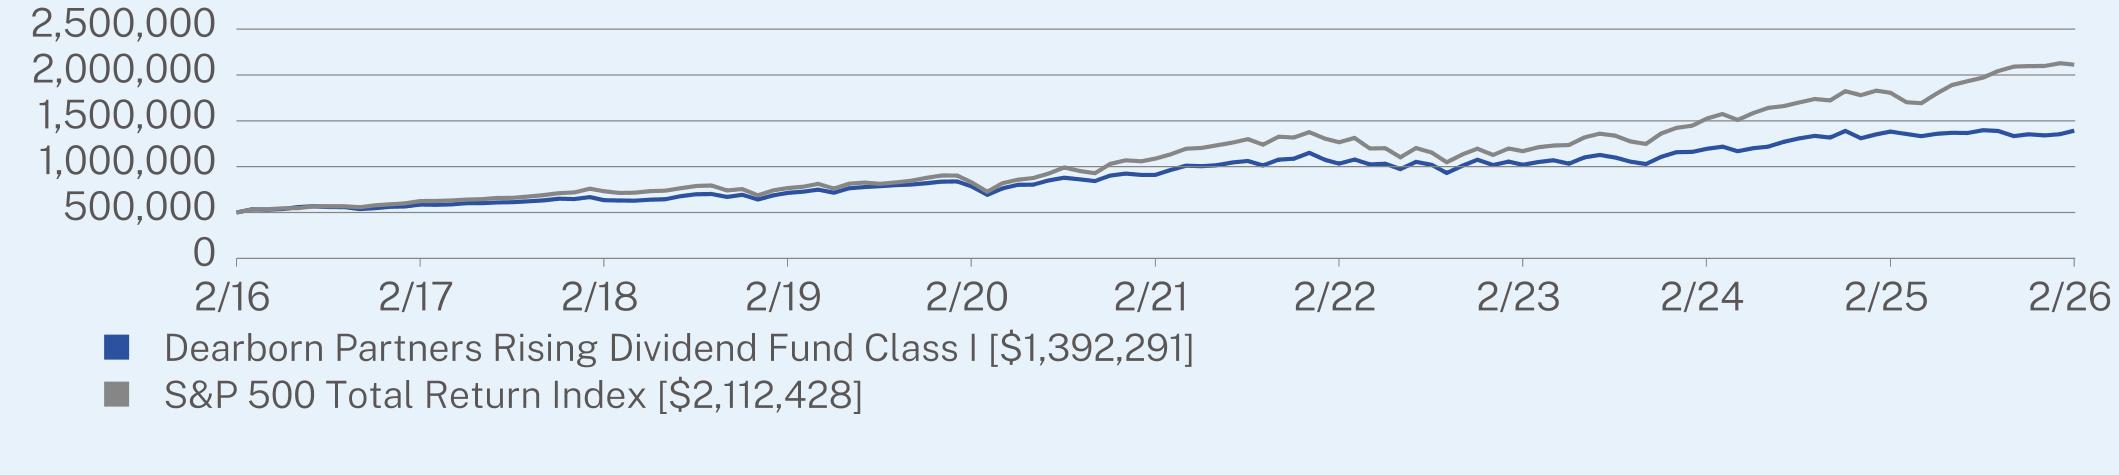
ANNUAL AVERAGE TOTAL RETURN (%)
|
|
1 Year
|
5 Year
|
10 Year
|
|
Class I
|
0.70
|
8.87
|
10.78
|
|
S&P 500 Total Return Index
|
16.99
|
14.19
|
15.50
|
Visit https://www.dearbornfunds.com/literature.html for more recent performance information.
KEY FUND STATISTICS (as of February 28, 2026)
|
Net Assets
|
$564,822,148
|
|
Number of Holdings
|
50
|
|
Net Advisory Fee
|
$4,706,938
|
|
Portfolio Turnover
|
11%
|
WHAT DID THE FUND INVEST IN? (% of net assets as of February 28, 2026)
|
Top 10 Issuers
|
(%)
|
|
Apple, Inc.
|
6.2%
|
|
Casey’s General Stores, Inc.
|
4.4%
|
|
Microsoft Corp.
|
3.4%
|
|
Atmos Energy Corp.
|
3.2%
|
|
Corteva, Inc.
|
2.8%
|
|
Snap-on, Inc.
|
2.6%
|
|
Exxon Mobil Corp.
|
2.5%
|
|
Motorola Solutions, Inc.
|
2.5%
|
|
Stryker Corp.
|
2.4%
|
|
Republic Services, Inc.
|
2.4%
|
|
Top Sectors*
|
(%)
|
|
Information Technology
|
20.6%
|
|
Industrials
|
18.2%
|
|
Consumer Staples
|
13.2%
|
|
Financials
|
11.6%
|
|
Health Care
|
10.0%
|
|
Utilities
|
6.0%
|
|
Materials
|
5.0%
|
|
Consumer Discretionary
|
4.9%
|
|
Communication Services
|
3.8%
|
|
Cash & Other
|
6.7%
|
| [1] |
|
||
| [2] |
|
||
| [3] |
|