
Exhibit 99.3
Positioned for Growth Inaugural SHOP Acquisitions & Strategic Capital Update May 2026
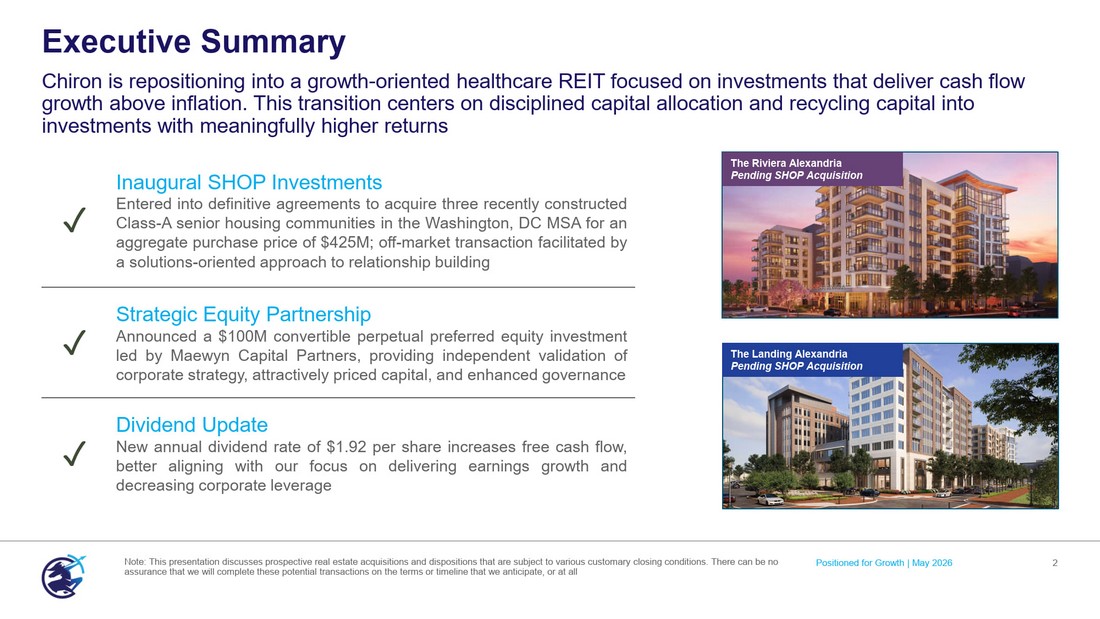
Executive Summary Chiron is repositioning into a growth - oriented healthcare REIT focused on investments that deliver cash flow growth above inflation. This transition centers on disciplined capital allocation and recycling capital into investments with meaningfully higher returns Positioned for Growth | May 2026 2 Note: This presentation discusses prospective real estate acquisitions and dispositions that are subject to various customary cl osing conditions. There can be no assurance that we will complete these potential transactions on the terms or timeline that we anticipate, or at all Inaugural SHOP Investments Entered into definitive agreements to acquire three recently constructed Class - A senior housing communities in the Washington, DC MSA for an aggregate purchase price of $ 425 M ; off - market transaction facilitated by a solutions - oriented approach to relationship building ✓ Strategic Equity Partnership Announced a $ 100 M convertible perpetual preferred equity investment led by Maewyn Capital Partners, providing independent validation of corporate strategy, attractively priced capital, and enhanced governance ✓ Dividend Update New annual dividend rate of $ 1 . 92 per share increases free cash flow, better aligning with our focus on delivering earnings growth and decreasing corporate leverage ✓ The Landing Alexandria Pending SHOP Acquisition The Riviera Alexandria Pending SHOP Acquisition

3 Inaugural SHOP Investments Positioned for Growth | May 2026 The Pinnacle North Bethesda Pending SHOP Acquisition
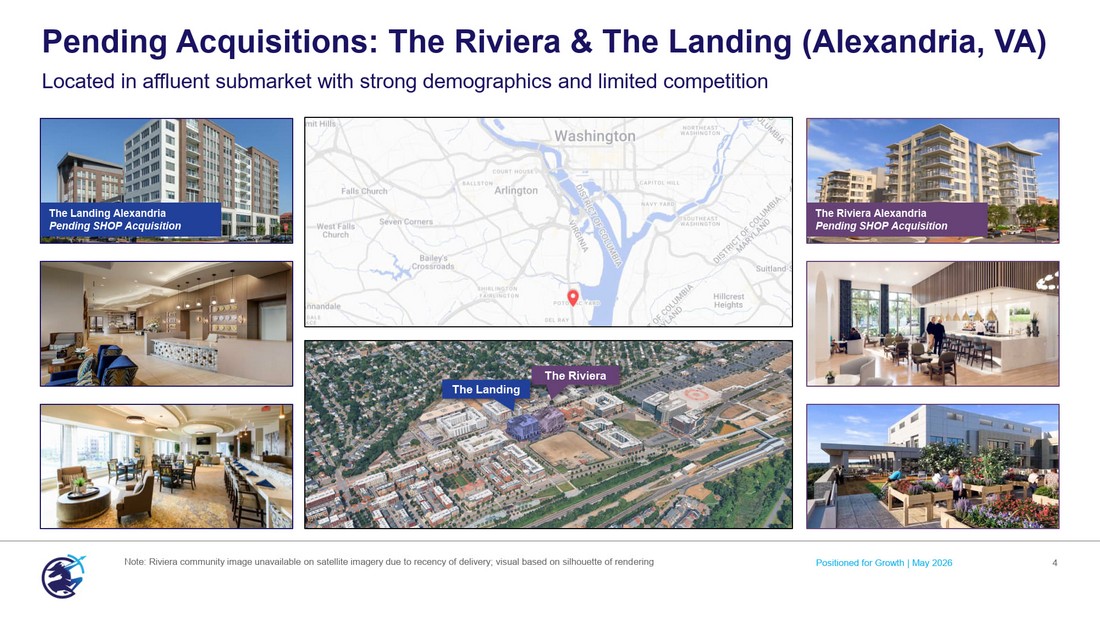
Pending Acquisitions: The Riviera & The Landing (Alexandria, VA) Located in affluent submarket with strong demographics and limited competition 4 Note: Riviera community image unavailable on satellite imagery due to recency of delivery; visual based on silhouette of rend eri ng The Landing Alexandria Pending SHOP Acquisition The Riviera Alexandria Pending SHOP Acquisition The Riviera The Landing Positioned for Growth | May 2026
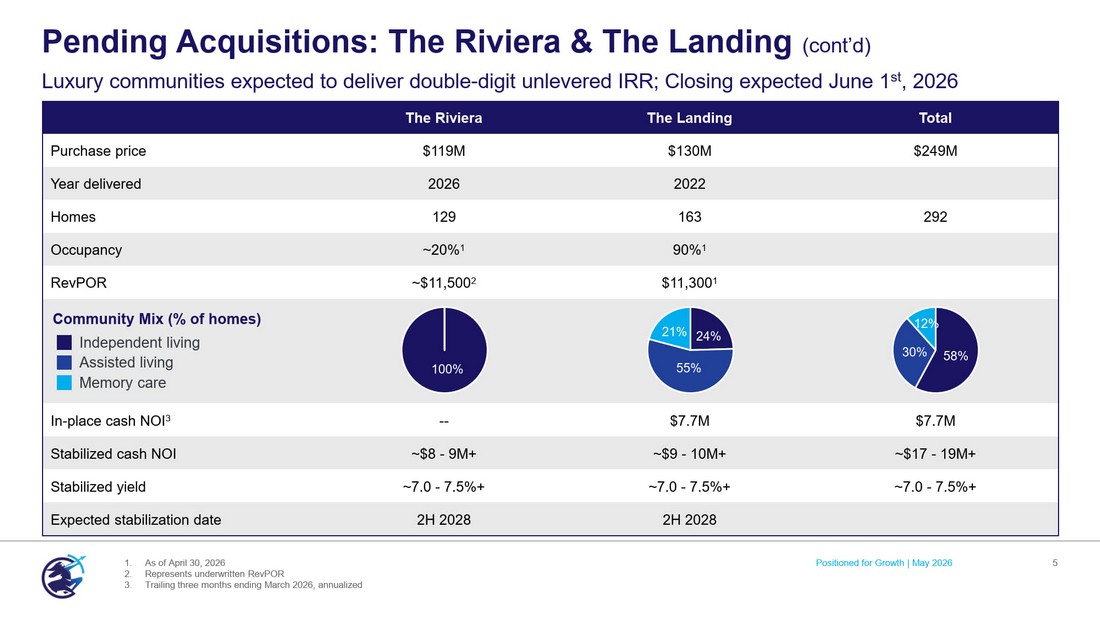
Pending Acquisitions: The Riviera & The Landing (cont’d) Luxury communities expected to deliver double - digit unlevered IRR; Closing expected June 1 st , 2026 5 1. As of April 30, 2026 2. Represents underwritten RevPOR 3. Trailing three months ending March 2026, annualized Total The Landing The Riviera $249M $130M $119M Purchase price 2022 2026 Year delivered 292 163 129 Homes 90% 1 ~20% 1 Occupancy $11,300 1 ~$11,500 2 RevPOR $7.7M $7.7M -- In - place cash NOI 3 ~$17 - 19M+ ~$9 - 10M+ ~$8 - 9M+ Stabilized cash NOI ~7.0 - 7.5%+ ~7.0 - 7.5%+ ~7.0 - 7.5%+ Stabilized yield 2H 2028 2H 2028 Expected stabilization date 100% 24% 55% 21% Community Mix (% of homes) Independent living Assisted living Memory care 58% 30% 12% Positioned for Growth | May 2026
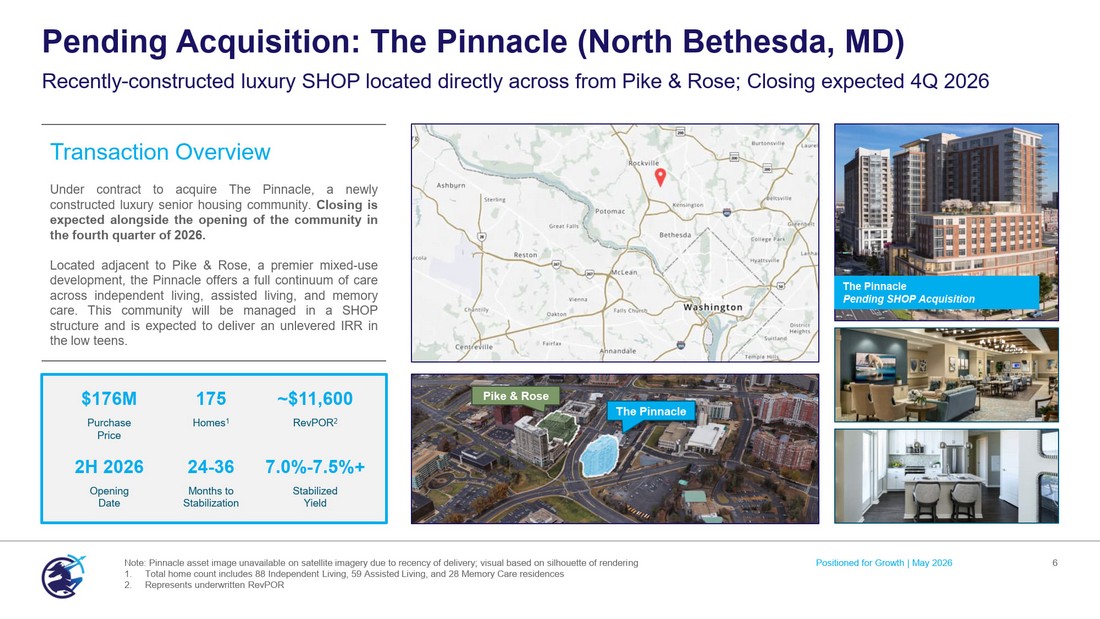
Pending Acquisition: The Pinnacle (North Bethesda, MD) 6 Note: Pinnacle asset image unavailable on satellite imagery due to recency of delivery; visual based on silhouette of renderi ng 1. Total home count includes 88 Independent Living, 59 Assisted Living, and 28 Memory Care residences 2. Represents underwritten RevPOR Recently - constructed luxury SHOP located directly across from Pike & Rose; Closing expected 4Q 2026 Transaction Overview Under contract to acquire The Pinnacle, a newly constructed luxury senior housing community . Closing is expected alongside the opening of the community in the fourth quarter of 2026 . Located adjacent to Pike & Rose, a premier mixed - use development, the Pinnacle offers a full continuum of care across independent living, assisted living, and memory care . This community will be managed in a SHOP structure and is expected to deliver an unlevered IRR in the low teens . Positioned for Growth | May 2026 The Pinnacle The Pinnacle Pending SHOP Acquisition ~$11,600 175 $176M RevPOR 2 Homes 1 Purchase Price 7.0% - 7.5%+ 24 - 36 2H 2026 Stabilized Yield Months to Stabilization Opening Date Pike & Rose
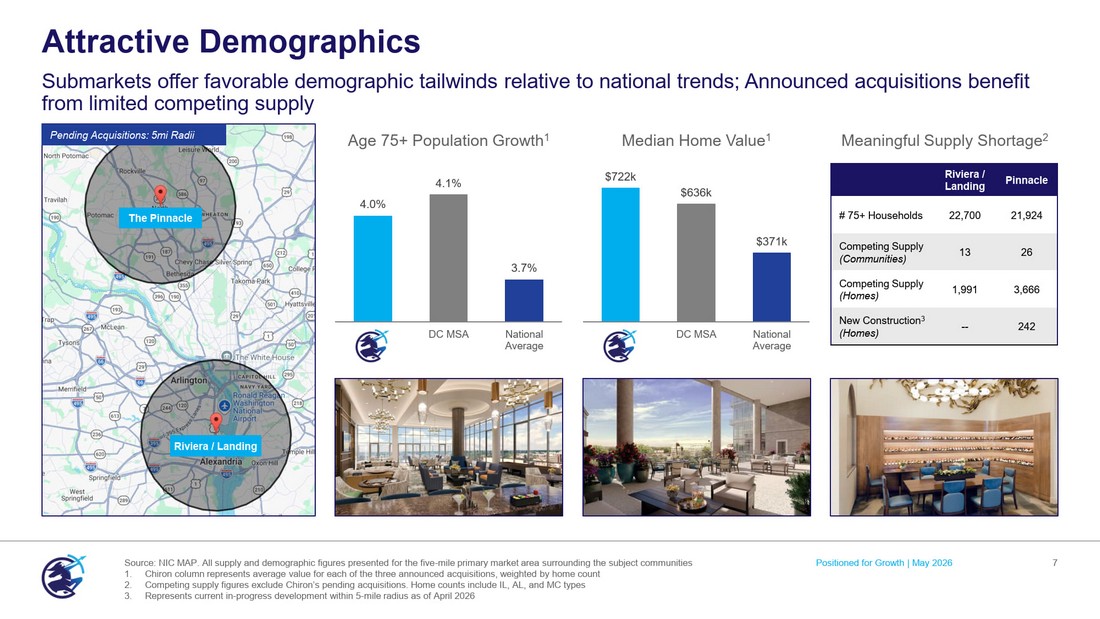
Attractive Demographics 7 Submarkets offer favorable demographic tailwinds relative to national trends; Announced acquisitions benefit from limited competing supply Positioned for Growth | May 2026 Pending Acquisitions: 5mi Radii $722k $636k $371k DC MSA National Average Median Home Value 1 4.0% 4.1% 3.7% DC MSA National Average Age 75+ Population Growth 1 Pinnacle Riviera / Landing 21,924 22,700 # 75+ Households 26 13 Competing Supply (Communities) 3,666 1,991 Competing Supply (Homes) 242 -- New Construction 3 (Homes) Meaningful Supply Shortage 2 Source: NIC MAP. All supply and demographic figures presented for the five - mile primary market area surrounding the subject comm unities 1. Chiron column represents average value for each of the three announced acquisitions, weighted by home count 2. Competing supply figures exclude Chiron’s pending acquisitions. Home counts include IL, AL, and MC types 3. Represents current in - progress development within 5 - mile radius as of April 2026 The Pinnacle Riviera / Landing
• Experienced developer and asset manager with a track record of delivering high - quality senior housing communities, with 12 completed projects concentrated in Virginia, Maryland, Florida, and Texas • Silverstone is expected to maintain an active oversight role in the operations of the Riviera, Landing, and Pinnacle post - acquisition to ensure execution of our business plan • Longstanding relationship with Chiron leadership is expected to provide further opportunity Silverstone Senior Living Asset Management & Strategic Partner • Established regional operator with over 40 years of experience managing high - end senior living communities; currently manages >5,000 homes across 36 communities and operates a consulting business that has advised over 500 senior housing providers • Specialized expertise in the sophisticated marketing and rapid lease - up strategies required for luxury communities with 40,000+ homes marketed since inception • Currently negotiating a new management agreement that structurally aligns Greystone’s incentives with Chiron’s long - term goals of rapid lease - up and NOI margin expansion Greystone Communities Operational Partner Operating and Strategic Senior Housing Partnerships 8 Highly aligned oversight and operator expertise position Chiron for long - term success Positioned for Growth | May 2026
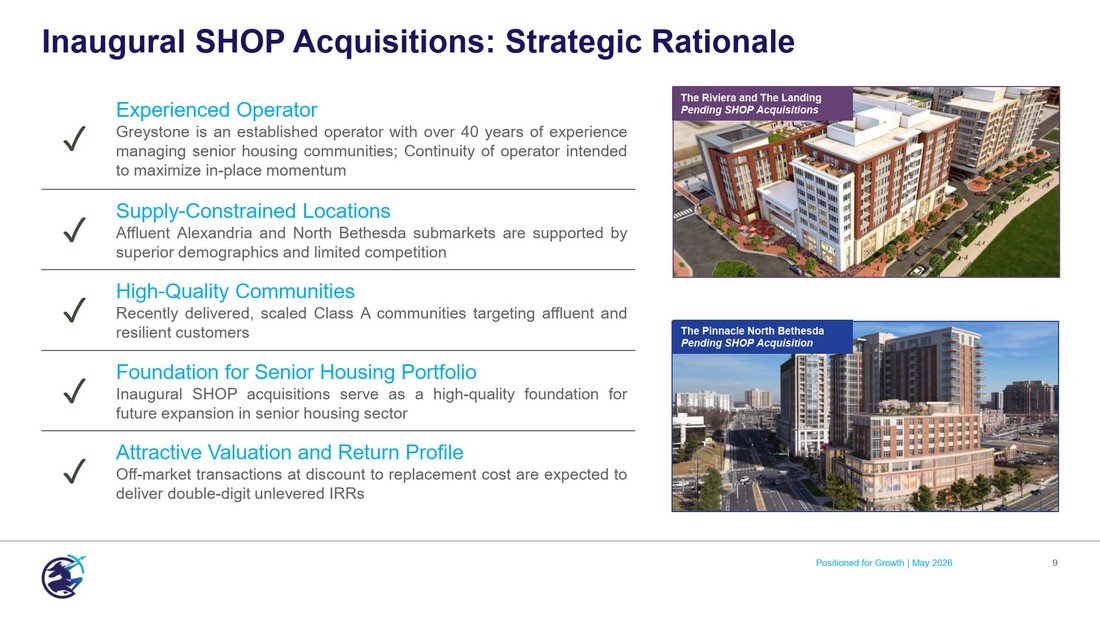
Inaugural SHOP Acquisitions: Strategic Rationale 9 Experienced Operator Greystone is an established operator with over 40 years of experience managing senior housing communities ; Continuity of operator intended to maximize in - place momentum ✓ Supply - Constrained Locations Affluent Alexandria and North Bethesda submarkets are supported by superior demographics and limited competition ✓ High - Quality Communities Recently delivered, scaled Class A communities targeting affluent and resilient customers ✓ Foundation for Senior Housing Portfolio Inaugural SHOP acquisitions serve as a high - quality foundation for future expansion in senior housing sector ✓ Attractive Valuation and Return Profile Off - market transactions at discount to replacement cost are expected to deliver double - digit unlevered IRRs ✓ Positioned for Growth | May 2026 The Pinnacle North Bethesda Pending SHOP Acquisition The Riviera and The Landing Pending SHOP Acquisitions

10 Capital Allocation The Landing Alexandria Pending SHOP Acquisition Positioned for Growth | May 2026
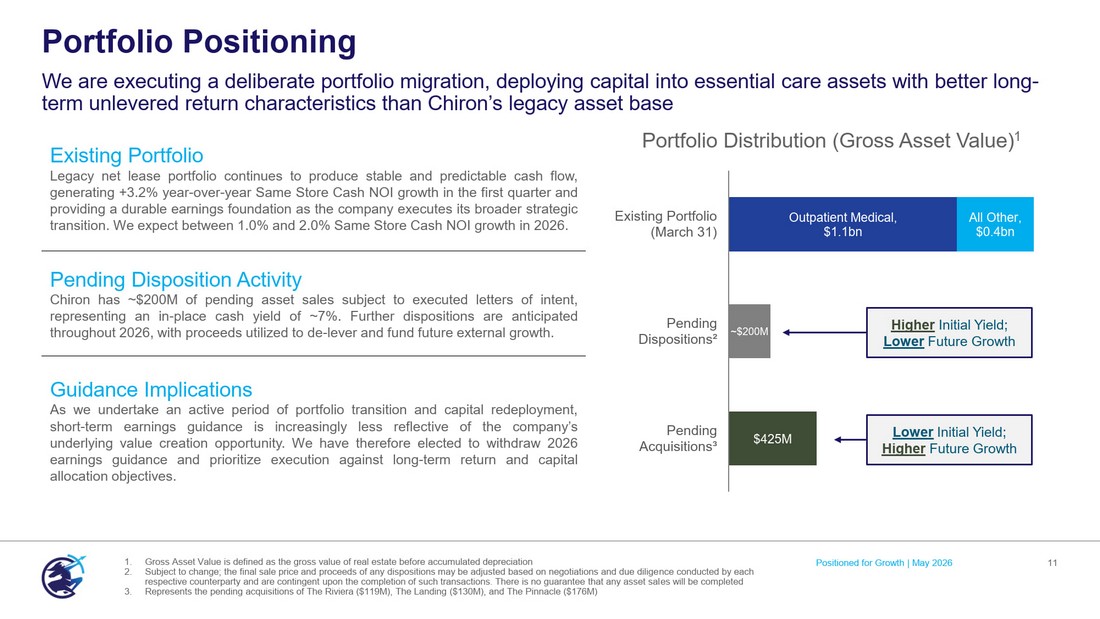
Portfolio Positioning 11 We are executing a deliberate portfolio migration, deploying capital into essential care assets with better long - term unlevered return characteristics than Chiron’s legacy asset base Outpatient Medical , $1.1 bn All Other , $0.4 bn ~$200M $425M Existing Portfolio (March 31) Pending Dispositions² Pending Acquisitions³ Existing Portfolio Legacy net lease portfolio continues to produce stable and predictable cash flow, generating + 3 . 2 % year - over - year Same Store Cash NOI growth in the first quarter and providing a durable earnings foundation as the company executes its broader strategic transition . We expect between 1 . 0 % and 2 . 0 % Same Store Cash NOI growth in 2026 . Pending Disposition Activity Chiron has ~ $ 200 M of pending asset sales subject to executed letters of intent, representing an in - place cash yield of ~ 7 % . Further dispositions are anticipated throughout 2026 , with proceeds utilized to de - lever and fund future external growth . Guidance Implications As we undertake an active period of portfolio transition and capital redeployment, short - term earnings guidance is increasingly less reflective of the company’s underlying value creation opportunity . We have therefore elected to withdraw 2026 earnings guidance and prioritize execution against long - term return and capital allocation objectives . Higher Initial Yield; Lower Future Growth Lower Initial Yield; Higher Future Growth Portfolio Distribution (Gross Asset Value) 1 1. Gross Asset Value is defined as the gross value of real estate before accumulated depreciation 2. Subject to change; the final sale price and proceeds of any dispositions may be adjusted based on negotiations and due dilige nce conducted by each respective counterparty and are contingent upon the completion of such transactions. There is no guarantee that any asset sal es will be completed 3. Represents the pending acquisitions of The Riviera ($119M), The Landing ($130M), and The Pinnacle ($176M) Positioned for Growth | May 2026
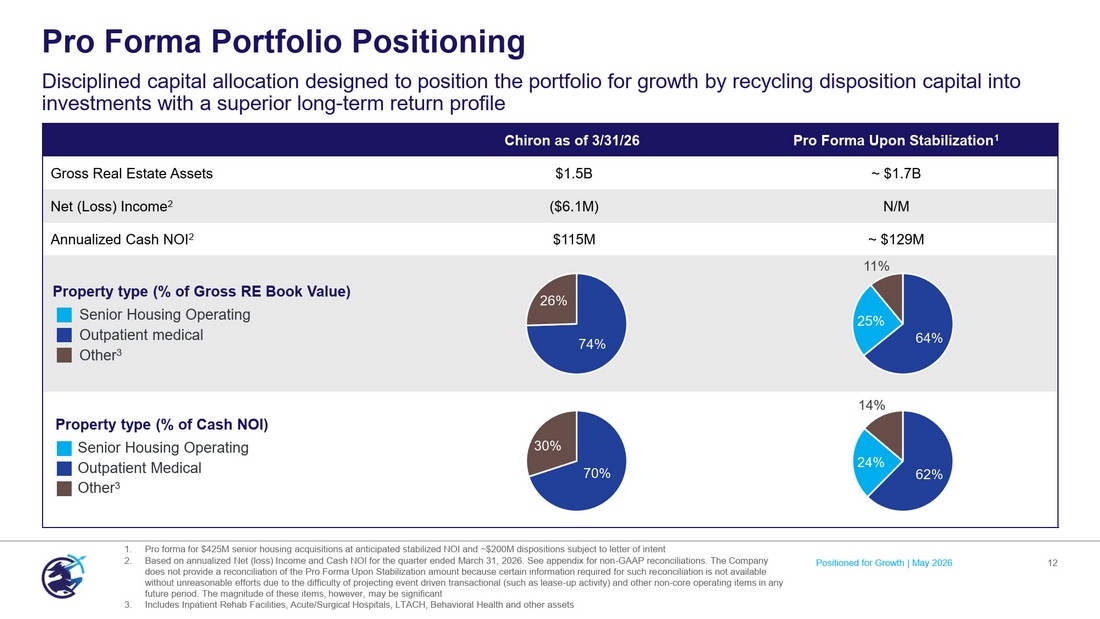
Pro Forma Portfolio Positioning Disciplined capital allocation designed to position the portfolio for growth by recycling disposition capital into investments with a superior long - term return profile 12 Pro Forma Upon Stabilization 1 Chiron as of 3/31/26 ~ $1.7B $1.5B Gross Real Estate Assets N/M ($6.1M) Net (Loss) Income 2 ~ $129M $115M Annualized Cash NOI 2 Property type (% of Gross RE Book Value) Property type (% of Cash NOI) Senior Housing Operating Outpatient medical Other 3 Senior Housing Operating Outpatient Medical Other 3 1. Pro forma for $425M senior housing acquisitions at anticipated stabilized NOI and ~$200M dispositions subject to letter of in ten t 2. Based on annualized Net (loss) Income and Cash NOI for the quarter ended March 31, 2026. See appendix for non - GAAP reconciliatio ns. The Company does not provide a reconciliation of the Pro Forma Upon Stabilization amount because certain information required for such re con ciliation is not available without unreasonable efforts due to the difficulty of projecting event driven transactional (such as lease - up activity) and othe r non - core operating items in any future period. The magnitude of these items, however, may be significant 3. Includes Inpatient Rehab Facilities, Acute/Surgical Hospitals, LTACH, Behavioral Health and other assets 70% 30% 62% 24% 14% 74% 26% 64% 25% 11% Positioned for Growth | May 2026
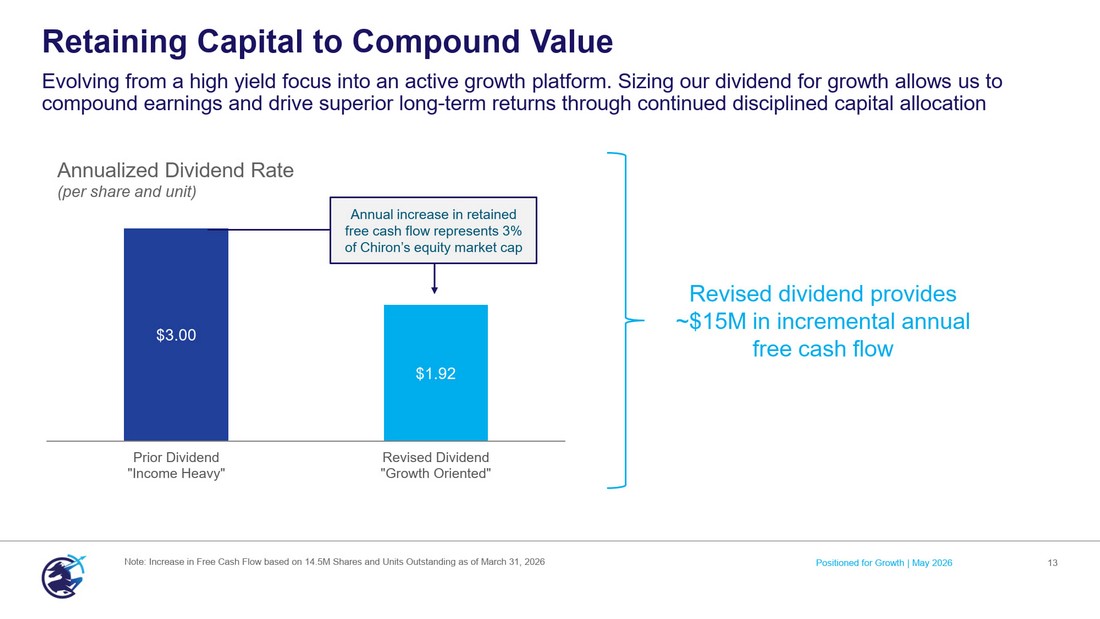
Annualized Dividend Rate (per share and unit) Retaining Capital to Compound Value Evolving from a high yield focus into an active growth platform. Sizing our dividend for growth allows us to compound earnings and drive superior long - term returns through continued disciplined capital allocation 13 $3.00 $1.92 Prior Dividend "Income Heavy" Revised Dividend "Growth Oriented" Annual increase in retained free cash flow represents 3% of Chiron’s equity market cap Positioned for Growth | May 2026 Note: Increase in Free Cash Flow based on 14.5M Shares and Units Outstanding as of March 31, 2026 Revised dividend provides ~$15M in incremental annual free cash flow
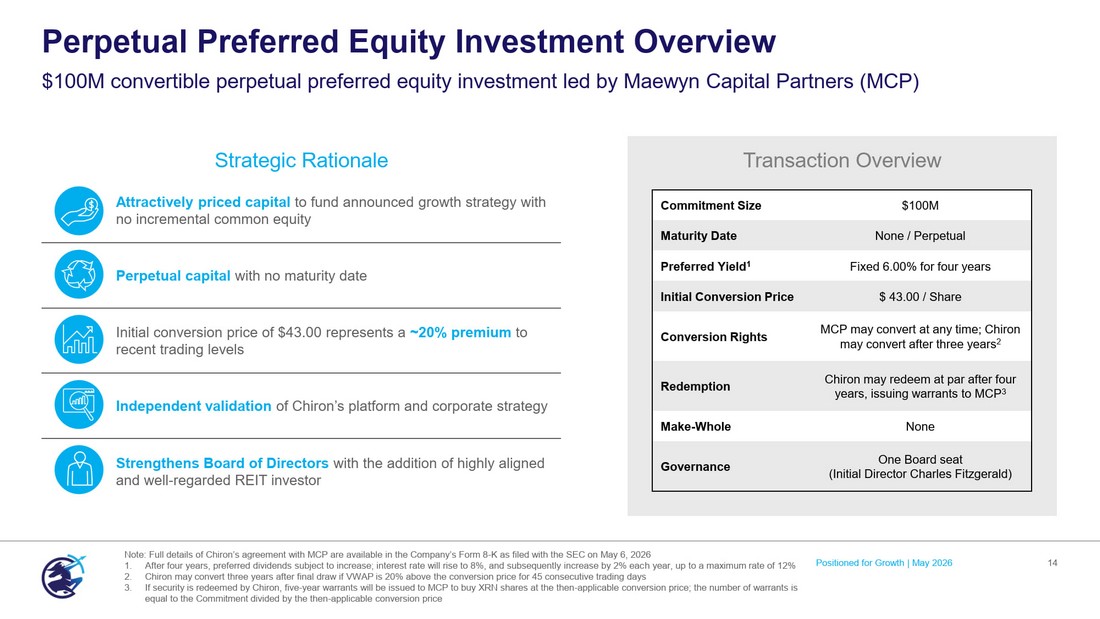
Attractively priced capital to fund announced growth strategy with no incremental common equity Perpetual capital with no maturity date Initial conversion price of $43.00 represents a ~20% premium to recent trading levels Independent validation of Chiron’s platform and corporate strategy Strengthens Board of Directors with the addition of highly aligned and well - regarded REIT investor ` Transaction Overview Perpetual Preferred Equity Investment Overview 14 $100M convertible perpetual preferred equity investment led by Maewyn Capital Partners (MCP) Note: Full details of Chiron’s agreement with MCP are available in the Company’s Form 8 - K as filed with the SEC on May 6, 2026 1. After four years, preferred dividends subject to increase; interest rate will rise to 8%, and subsequently increase by 2% eac h y ear, up to a maximum rate of 12% 2. Chiron may convert three years after final draw if VWAP is 20% above the conversion price for 45 consecutive trading days 3. If security is redeemed by Chiron, five - year warrants will be issued to MCP to buy XRN shares at the then - applicable conversion price; the number of warrants is equal to the Commitment divided by the then - applicable conversion price $100M Commitment Size None / Perpetual Maturity Date Fixed 6.00% for four years Preferred Yield 1 $ 43.00 / Share Initial Conversion Price MCP may convert at any time; Chiron may convert after three years 2 Conversion Rights Chiron may redeem at par after four years, issuing warrants to MCP 3 Redemption None Make - Whole One Board seat (Initial Director Charles Fitzgerald) Governance Strategic Rationale Positioned for Growth | May 2026
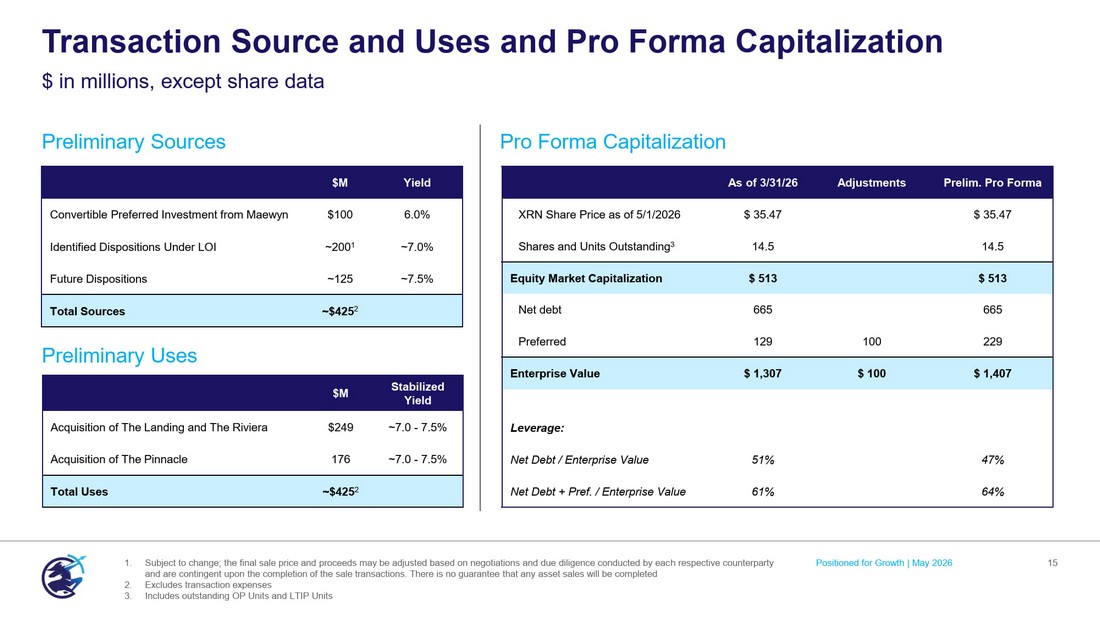
Pro Forma Capitalization Preliminary Sources Preliminary Uses Transaction Source and Uses and Pro Forma Capitalization 15 1. Subject to change; the final sale price and proceeds may be adjusted based on negotiations and due diligence conducted by eac h r espective counterparty and are contingent upon the completion of the sale transactions. There is no guarantee that any asset sales will be completed 2. Excludes transaction expenses 3. Includes outstanding OP Units and LTIP Units $ in millions, except share data Positioned for Growth | May 2026 Stabilized Yield $M ~7.0 - 7.5% $249 Acquisition of The Landing and The Riviera ~7.0 - 7.5% 176 Acquisition of The Pinnacle ~$425 2 Total Uses Prelim. Pro Forma Adjustments As of 3/31/26 $ 35.47 $ 35.47 XRN Share Price as of 5/1/2026 14.5 14.5 Shares and Units Outstanding 3 $ 513 $ 513 Equity Market Capitalization 665 665 Net debt 229 100 129 Preferred $ 1,407 $ 100 $ 1,307 Enterprise Value Leverage: 47% 51% Net Debt / Enterprise Value 64% 61% Net Debt + Pref. / Enterprise Value Yield $M 6.0% $100 Convertible Preferred Investment from Maewyn ~7.0% ~200 1 Identified Dispositions Under LOI ~7.5% ~125 Future Dispositions ~$425 2 Total Sources
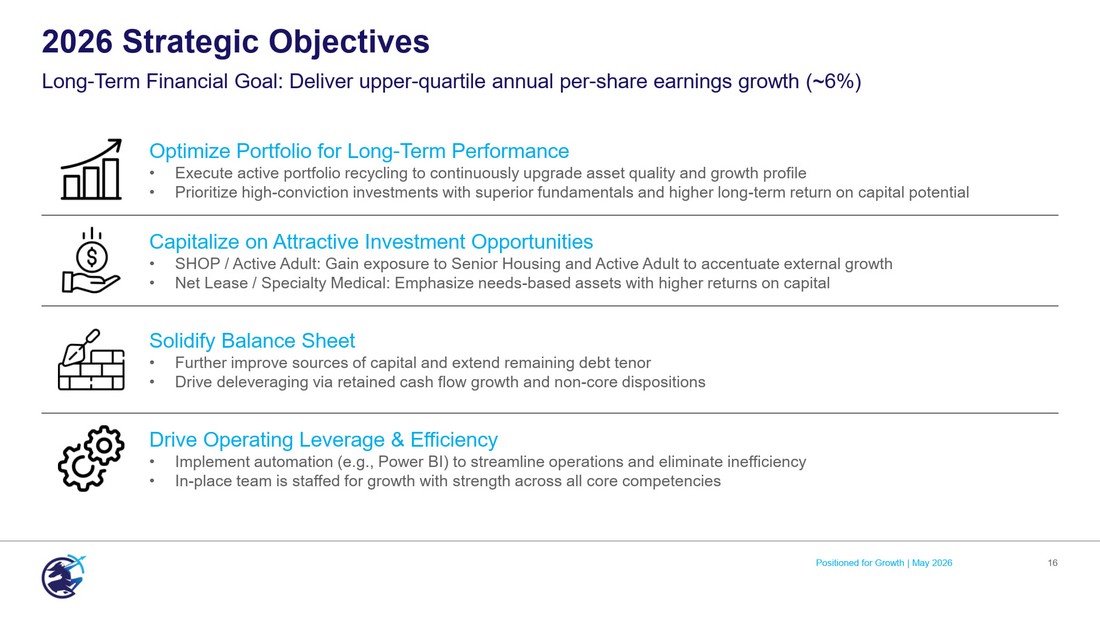
Optimize Portfolio for Long - Term Performance • Execute active portfolio recycling to continuously upgrade asset quality and growth profile • Prioritize high - conviction investments with superior fundamentals and higher long - term return on capital potential Capitalize on Attractive Investment Opportunities • SHOP / Active Adult: Gain exposure to Senior Housing and Active Adult to accentuate external growth • Net Lease / Specialty Medical: Emphasize needs - based assets with higher returns on capital Solidify Balance Sheet • Further improve sources of capital and extend remaining debt tenor • Drive deleveraging via retained cash flow growth and non - core dispositions Drive Operating Leverage & Efficiency • Implement automation (e.g., Power BI) to streamline operations and eliminate inefficiency • In - place team is staffed for growth with strength across all core competencies 2026 Strategic Objectives Long - Term Financial Goal: Deliver upper - quartile annual per - share earnings growth (~6%) 16 Positioned for Growth | May 2026

17 Opportunity in Our Stock Positioned for Growth | May 2026 Dumfries Health Center Dumfries, VA
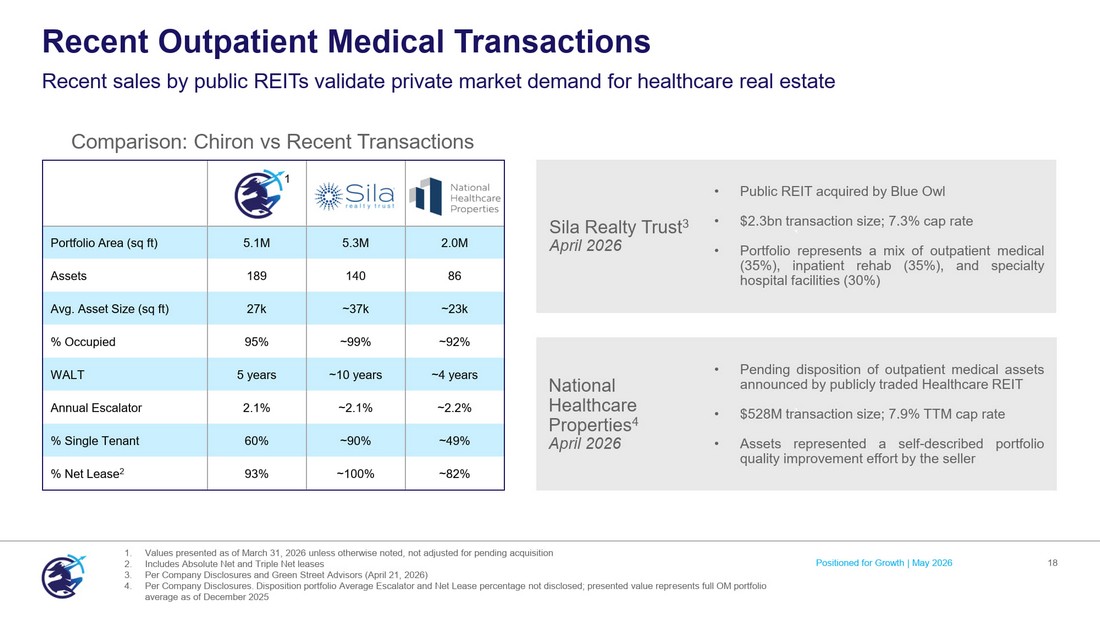
Recent Outpatient Medical Transactions 18 Recent sales by public REITs validate private market demand for healthcare real estate 1. Values presented as of March 31, 2026 unless otherwise noted, not adjusted for pending acquisition 2. Includes Absolute Net and Triple Net leases 3. Per Company Disclosures and Green Street Advisors (April 21, 2026) 4. Per Company Disclosures. Disposition portfolio Average Escalator and Net Lease percentage not disclosed; presented value repr ese nts full OM portfolio average as of December 2025 ` ` Sila Realty Trust 3 April 2026 National Healthcare Properties 4 April 2026 2.0M 5.3M 5.1M Portfolio Area (sq ft) 86 140 189 Assets ~23k ~37k 27k Avg. Asset Size (sq ft) ~92% ~99% 95% % Occupied ~4 years ~10 years 5 years WALT ~2.2% ~2.1% 2.1% Annual Escalator ~49% ~90% 60% % Single Tenant ~82% ~100% 93% % Net Lease 2 • Public REIT acquired by Blue Owl • $ 2 . 3 bn transaction size ; 7 . 3 % cap rate • Portfolio represents a mix of outpatient medical ( 35 % ), inpatient rehab ( 35 % ), and specialty hospital facilities ( 30 % ) • Pending disposition of outpatient medical assets announced by publicly traded Healthcare REIT • $ 528 M transaction size ; 7 . 9 % TTM cap rate • Assets represented a self - described portfolio quality improvement effort by the seller Comparison: Chiron vs Recent Transactions 1 Positioned for Growth | May 2026
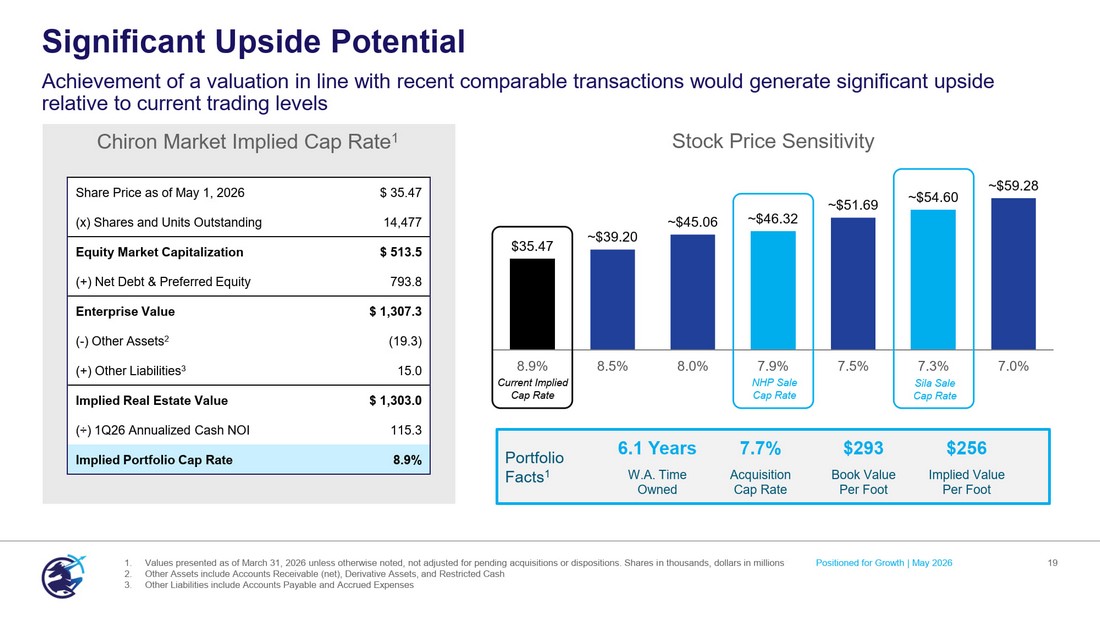
Significant Upside Potential 19 Achievement of a valuation in line with recent comparable transactions would generate significant upside relative to current trading levels 1. Values presented as of March 31, 2026 unless otherwise noted, not adjusted for pending acquisitions or dispositions. Shares i n t housands, dollars in millions 2. Other Assets include Accounts Receivable (net), Derivative Assets, and Restricted Cash 3. Other Liabilities include Accounts Payable and Accrued Expenses ` $ 35.47 Share Price as of May 1, 2026 14,477 (x) Shares and Units Outstanding $ 513.5 Equity Market Capitalization 793.8 (+) Net Debt & Preferred Equity $ 1,307.3 Enterprise Value (19.3) ( - ) Other Assets 2 15.0 (+) Other Liabilities 3 $ 1,303.0 Implied Real Estate Value 115.3 ( ÷ ) 1Q26 Annualized Cash NOI 8.9% Implied Portfolio Cap Rate Chiron Market Implied Cap Rate 1 $35.47 ~ $39.20 ~ $45.06 ~ $46.32 ~ $51.69 ~ $54.60 ~ $59.28 8.9% 8.5% 8.0% 7.9% 7.5% 7.3% 7.0% Stock Price Sensitivity NHP Sale Cap Rate Sila Sale Cap Rate Current Implied Cap Rate Portfolio Facts 1 $256 $293 7.7% 6.1 Years Implied Value Per Foot Book Value Per Foot Acquisition Cap Rate W.A. Time Owned Positioned for Growth | May 2026
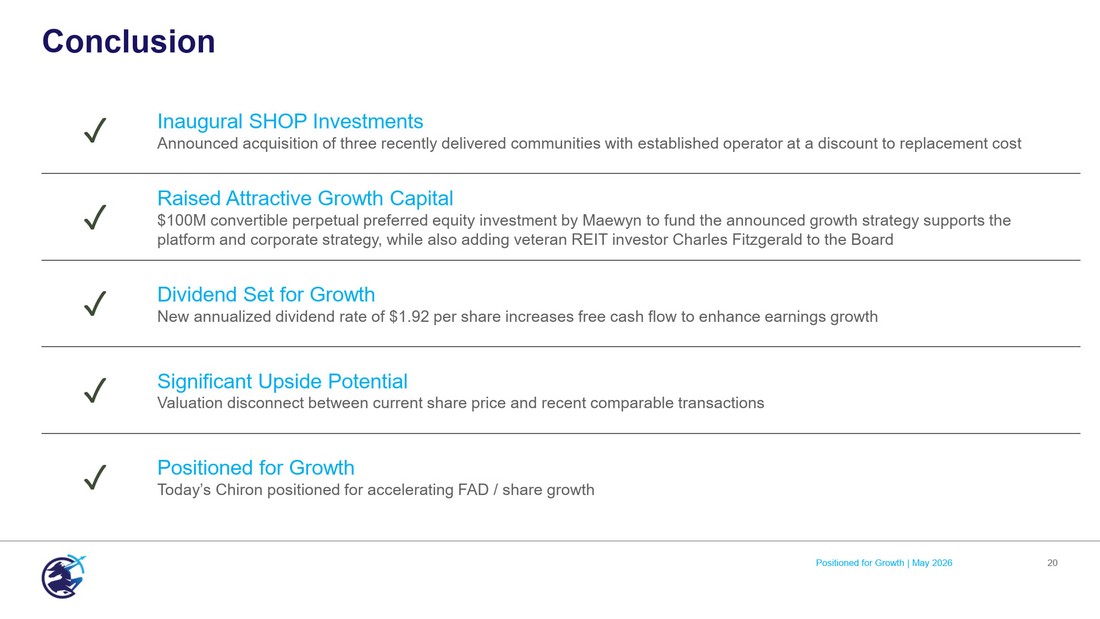
Conclusion 20 Inaugural SHOP Investments Announced acquisition of three recently delivered communities with established operator at a discount to replacement cost ✓ Raised Attractive Growth Capital $100M convertible perpetual preferred equity investment by Maewyn to fund the announced growth strategy supports the platform and corporate strategy, while also adding veteran REIT investor Charles Fitzgerald to the Board ✓ Dividend Set for Growth New annualized dividend rate of $1.92 per share increases free cash flow to enhance earnings growth ✓ Significant Upside Potential Valuation disconnect between current share price and recent comparable transactions ✓ Positioned for Growth Today’s Chiron positioned for accelerating FAD / share growth ✓ Positioned for Growth | May 2026

21 Reconciliations & Legal The Landing Alexandria Pending SHOP Acquisition Positioned for Growth | May 2026
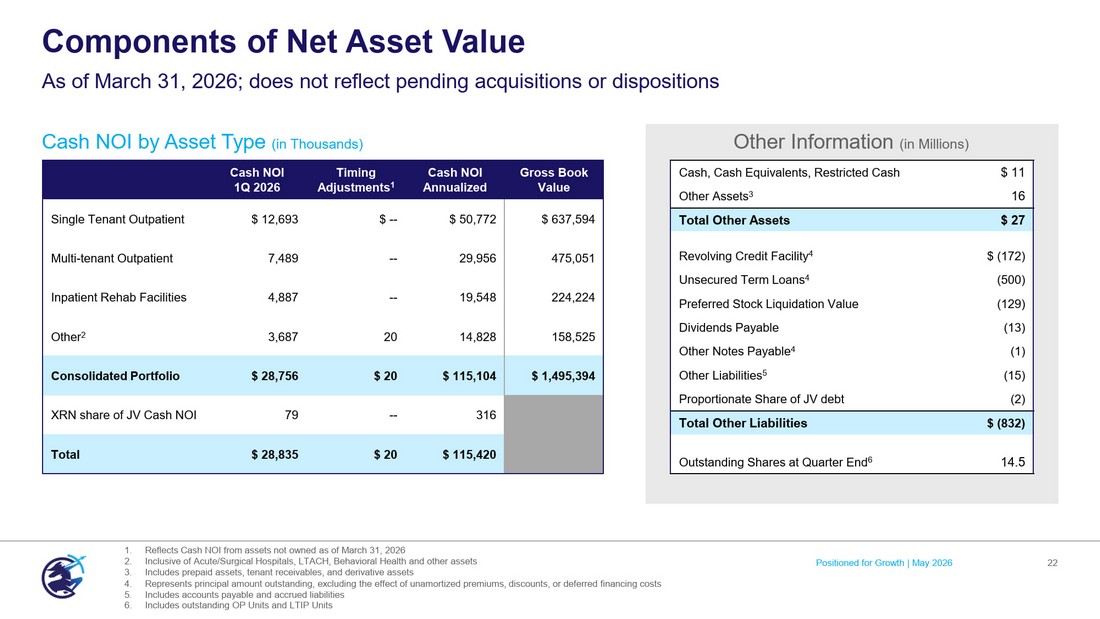
Positioned for Growth | May 2026 22 Cash NOI by Asset Type (in Thousands) Components of Net Asset Value As of March 31, 2026; does not reflect pending acquisitions or dispositions ` $ 11 Cash, Cash Equivalents, Restricted Cash 16 Other Assets 3 $ 27 Total Other Assets $ (172) Revolving Credit Facility 4 (500) Unsecured Term Loans 4 (129) Preferred Stock Liquidation Value (13) Dividends Payable (1) Other Notes Payable 4 (15) Other Liabilities 5 (2) Proportionate Share of JV debt $ (832) Total Other Liabilities 14.5 Outstanding Shares at Quarter End 6 Other Information (in Millions) 1. Reflects Cash NOI from assets not owned as of March 31, 2026 2. Inclusive of Acute/Surgical Hospitals, LTACH, Behavioral Health and other assets 3. Includes prepaid assets, tenant receivables, and derivative assets 4. Represents principal amount outstanding, excluding the effect of unamortized premiums, discounts, or deferred financing costs 5. Includes accounts payable and accrued liabilities 6. Includes outstanding OP Units and LTIP Units Gross Book Value Cash NOI Annualized Timing Adjustments 1 Cash NOI 1Q 2026 $ 637,594 $ 50,772 $ -- $ 12,693 Single Tenant Outpatient 475,051 29,956 -- 7,489 Multi - tenant Outpatient 224,224 19,548 -- 4,887 Inpatient Rehab Facilities 158,525 14,828 20 3,687 Other 2 $ 1,495,394 $ 115,104 $ 20 $ 28,756 Consolidated Portfolio 316 -- 79 XRN share of JV Cash NOI $ 115,420 $ 20 $ 28,835 Total
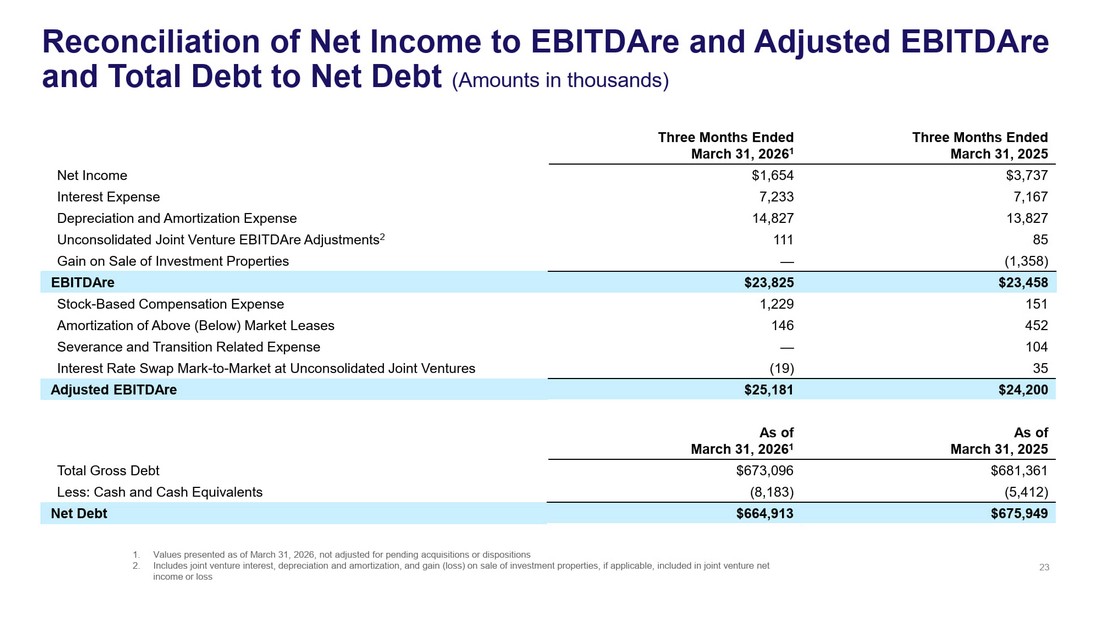
As of March 3 1 , 2025 As of March 3 1 , 202 6 1 $ 6 81 ,3 61 $ 6 73 , 096 Total Gross Debt ( 5 , 412 ) ( 8 , 183 ) Less: Cash and C ash E quivalents $ 6 75,949 $ 6 64,913 Net Debt Reconciliation of Net Income to EBITDAre and Adjusted EBITDAre and Total Debt to Net Debt (Amounts in thousands) 23 Three Months Ended March 3 1 , 2025 Three Months Ended March 3 1 , 202 6 1 $3,737 $1 , 654 Net I ncome 7 , 167 7 , 233 Interest E xpense 13 , 827 14, 827 Depreciation and A mortization Expense 85 1 11 Unconsolidated J oint V enture EBITDAre A djustments 2 (1, 3 58) — Gain on S ale of I nvestment P roperties $23,458 $23,825 EBITDAre 151 1,229 Stock - Based Compensation Expense 452 146 Amortization of Above (Below) Market Leases 104 — Severance and Transition Related Expense 35 (19) Interest Rate Swap Mark - to - Market at Unconsolidated Joint Ventures $24,200 $25,181 Adjusted EBITDAre 1. Values presented as of March 31, 2026, not adjusted for pending acquisitions or dispositions 2. Includes joint venture interest, depreciation and amortization, and gain (loss) on sale of investment properties, if applicab le, included in joint venture net income or loss
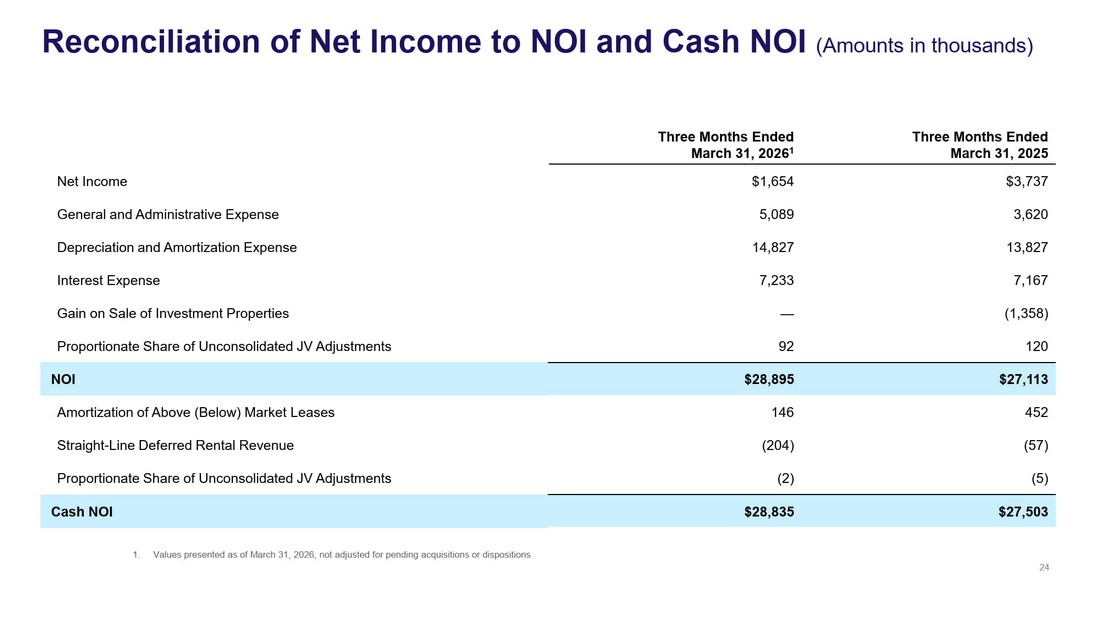
Three Months Ended March 3 1 , 202 5 Three Months Ended March 3 1 , 202 6 1 $3,737 $1, 6 54 Net Income 3 , 620 5, 089 General and A dministrative Expense 13 , 827 14, 827 Depreciation and A mortization Expense 7 , 167 7 , 233 Interest E xpense (1,358) — Gain on S ale of I nvestment P roperties 120 92 Proportionate Share of Unconsolidated JV Adjustments $27 , 113 $28 , 895 NOI 452 14 6 Amortization of A bove (Below) M arket L eases ( 57 ) (2 04 ) Straight - L ine D eferred R ental R evenue ( 5 ) ( 2 ) Proportionate Share of Unconsolidated JV Adjustments $ 2 7 , 503 $ 2 8 , 835 Cash NOI 24 Reconciliation of Net Income to NOI and Cash NOI (Amounts in thousands) 1. Values presented as of March 31, 2026, not adjusted for pending acquisitions or dispositions
Certain statements contained in this presentation may be considered "forward - looking statements" within the meaning of the Private Securities Litigation Reform Act of 1995 and are intended to be protected by the safe harbor provisions thereof. Forward - looking statements are generally identifiable by the use of words such as ‘anticipate,’ ‘believe,’ ‘could,’ ‘estimate,’ ‘expect,’ ‘intend,’ ‘may,’ ‘plan,’ ‘project,’ ‘should,’ ‘will,’ or similar expressions. These statements include, without limitation, statements regarding future financial performance, cash flows, dividends, portfolio performance, capital allocation, pending acquisitions and dispositions , the expected performance of pending acquisitions , balance sheet strategy, investment pipeline, and strategic initiatives. Forward - looking statements are based on current expectations, estimates, and assumptions and are subject to risks and uncertainties that could cause actual results to differ materially. These risks include those described in the Company’s filings with the Securities and Exchange Commission. Readers are cautioned not to place undue reliance on forward - looking statements, which speak only as of the date of this presentation. The Company undertakes no obligation to update or revise any forward - looking statements. Forward - Looking Statements 25
Management believes certain non - GAAP financial measures provide useful supplemental information regarding the Company’s operating performance and financial condition. These measures are commonly used by management, investors, and industry analysts to evaluate REIT performance and facilitate period - over - period and peer comparisons. Chiron’s non - GAAP financial measures included in this presentation are EBITDAre , Adjusted EBITDAre , Net Operating Income (NOI) and Cash NOI. Non - GAAP financial measures are not intended to be alternatives to net income, cash flows from operating activities, or other measures prepared in accordance with GAAP. These measures may not be comparable to similarly titled measures reported by other companies and should be evaluated in conjunction with the Company’s consolidated financial statements. Non - GAAP Financial Measures 26
EBITDAre is calculated in accordance with standards established by NAREIT and is defined as net income or loss computed in accordance with GAAP, plus depreciation and amortization, interest expense, gains or losses on the sale of investment properties, property impairments, and adjustments for unconsolidated joint ventures. The Company defines Adjusted EBITDAre as EBITDAre plus loss on extinguishment of debt, non - cash stock compensation expense, non - cash intangible amortization related to above and below market leases, severance and transition related expense, expenses related to our reverse stock split, transaction expense, adjustments related to our investments in unconsolidated joint ventures, and other normalizing items. Management considers EBITDAre and Adjusted EBITDAre important measures because they provide additional information to allow management, investors, and our current and potential creditors to evaluate and compare our core operating results and our ability to service debt. NOI and Cash NOI Net Operating Income (NOI) is a supplemental measure used to evaluate the operating performance of the Company’s real estate portfolio. NOI is calculated as net income or loss, plus depreciation and amortization, general and administrative expenses, transaction costs, impairments, gains or losses on the sale of investment properties, interest expense, and other non - operating items. Cash NOI excludes non - cash items such as straight - line rent and amortization of above - and below - market leases and is intended to measure unlevered, property - level cash operating performance. EBITDAre and Adjusted EBITDAre 27

NYSE: XRN 7373 Wisconsin Avenue Suite 800 Bethesda, MD 20814