Exhibit 99.2
Q1 2026 Earnings Supplemental March 31, 2026
3 About Chiron 4 - 5 Quarterly Highlights and Recent Events 6 Consolidated Balance Sheets 7 Consolidated Statements of Operations Reconciliations of Non - GAAP Measures 8 Funds From Operations, Core FFO, and Funds Available for Distribution 9 Net Operating Income, Cash Net Operating Income, and Adjusted EBITDA re 10 Capitalization Summary 11 Leverage Statistics and Selected Debt Covenant Performance Portfolio Information 12 Portfolio Overview 13 Same Property Performance and Reconciliations 14 Lease Expiration Schedule and Leasing Rollforward 15 Portfolio Concentrations 16 Investment Activity and Capital Expenditures 17 Components of Net Asset Value 18 - 20 Definitions *All per share, per share and unit, and weighted average share and unit amounts have been adjusted to reflect the impact of the Reverse Stock Split. Table of Contents 2 First Quarter 2026 Supplemental Reporting Certain statements contained herein may be considered “forward - looking statements” within the meaning of the Private Securities Litigation Reform Act of 1995, and it is the Company’s intent that any such statements be protected by the safe harbor created thereby. These forwa rd - looking statements are identified by their use of terms and phrases such as “anticipate,” “believe,” “could,” “estimate,” “expect,” “intend,” “may,” “s hould,” “plan,” “predict,” “project,” “will,” “continue” and other similar terms and phrases, including references to assumptions and forecasts of futur e r esults. Except for historical information, the statements set forth herein including, but not limited to, any statements regarding the investmen t i n our Series C Preferred Stock or the terms of the investment agreement by Maewyn Capital Partners and its affiliates and future Board composition, ou r e arnings, our liquidity, our tenants’ ability to pay rent to us, our ability to refinance our indebtedness, expected financial performance (including fut ure cash flows associated with our joint ventures, new tenants or the expansion of current properties), 2026 Core FFO guidance, future dividends, inter est rates or other financial items; any other statements concerning our plans, strategies, objectives and expectations for future operations and future po rtf olio occupancy rates, our pipeline of acquisition opportunities and expected acquisition activity, including the timing and/or successful completion of an y acquisitions or the future performance of any such acquisitions, and expected rent receipts on these properties, our expected disposition activit y, including the timing and/or successful completion of any dispositions and the expected use of proceeds therefrom; and any statements regarding fut ure economic conditions or performance are forward - looking statements. These forward - looking statements are based on our current expectations , estimates and assumptions and are subject to certain risks and uncertainties. Although the Company believes that the expectations, estimate s a nd assumptions reflected in its forward - looking statements are reasonable, actual results could differ materially from those projected or assum ed in any of the Company’s forward - looking statements. Additional information concerning us and our business, including additional factors that c ould materially and adversely affect our financial results, include, without limitation, the risks described under Part I, Item 1A - Risk Factors, i n our Annual Report on Form 10 - K, our Quarterly Reports on Form 10 - Q, and in our other filings with the SEC. You are cautioned not to place undue reliance on f orward - looking statements. The Company does not intend, and undertakes no obligation, to update any forward - looking statement. FORWARD - LOOKING STATEMENTS
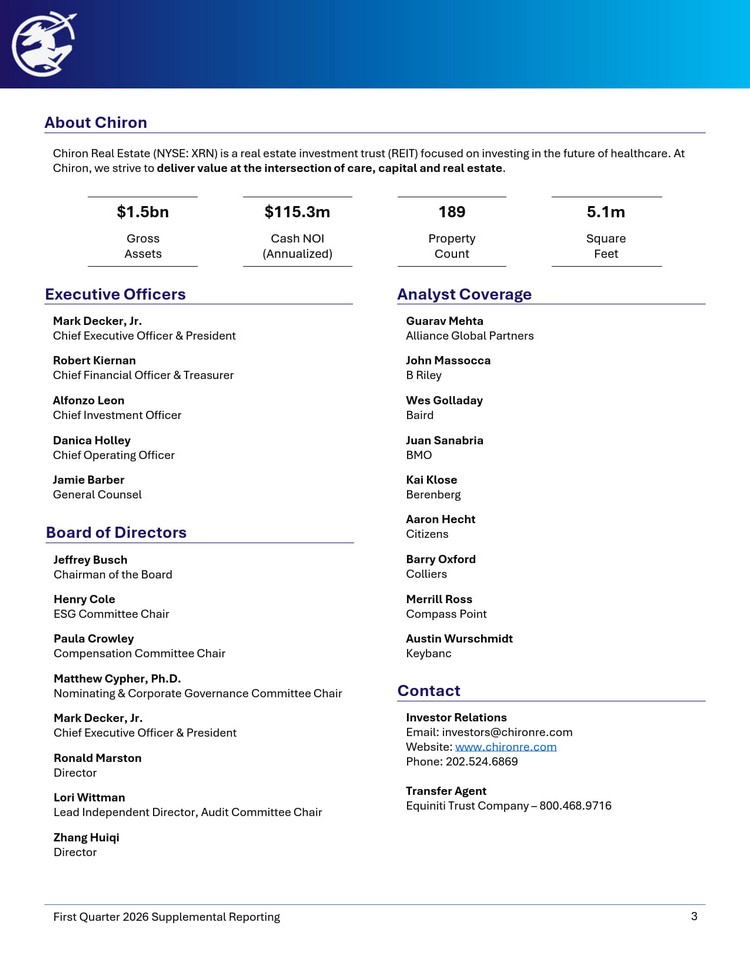
About Chiron 3 First Quarter 2026 Supplemental Reporting Chiron Real Estate (NYSE: XRN) is a real estate investment trust (REIT) focused on investing in the future of healthcare. At Chiron, we strive to deliver value at the intersection of care, capital and real estate . 5.1m 189 $115.3m $1.5bn Square Feet Property Count Cash NOI (Annualized) Gross Assets Mark Decker, Jr. Chief Executive Officer & President Robert Kiernan Chief Financial Officer & Treasurer Alfonzo Leon Chief Investment Officer Danica Holley Chief Operating Officer Jamie Barber General Counsel Executive Officers Guarav Mehta Alliance Global Partners John Massocca B Riley Wes Golladay Baird Juan Sanabria BMO Kai Klose Berenberg Aaron Hecht Citizens Barry Oxford Colliers Merrill Ross Compass Point Austin Wurschmidt Keybanc Analyst Coverage Jeffrey Busch Chairman of the Board Henry Cole ESG Committee Chair Paula Crowley Compensation Committee Chair Matthew Cypher, Ph.D. Nominating & Corporate Governance Committee Chair Mark Decker, Jr. Chief Executive Officer & President Ronald Marston Director Lori Wittman Lead Independent Director, Audit Committee Chair Zhang Huiqi Director Board of Directors Contact Investor Relations Email: investors@chironre.com Website: www.chironre.com Phone: 202.524.6869 Transfer Agent Equiniti Trust Company – 800.468.9716
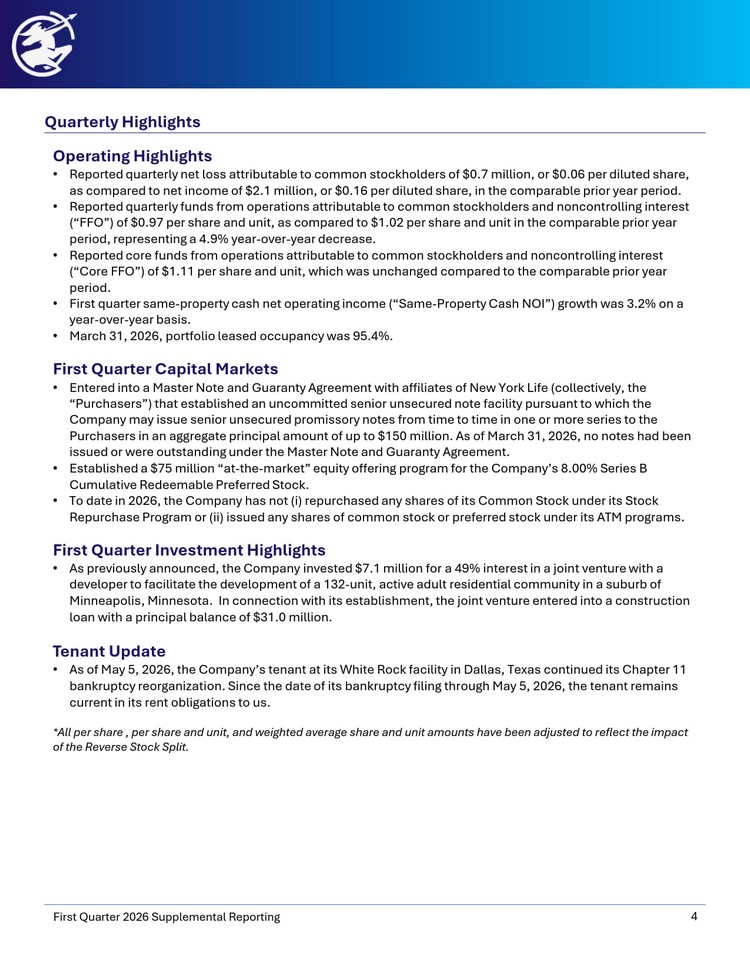
Quarterly Highlights 4 First Quarter 2026 Supplemental Reporting Operating Highlights • Reported quarterly net loss attributable to common stockholders of $0.7 million, or $0.06 per diluted share, as compared to net income of $2.1 million, or $0.16 per diluted share, in the comparable prior year period. • Reported quarterly funds from operations attributable to common stockholders and noncontrolling interest (“FFO”) of $0.97 per share and unit, as compared to $1.02 per share and unit in the comparable prior year period, representing a 4.9% year - over - year decrease. • Reported core funds from operations attributable to common stockholders and noncontrolling interest (“Core FFO”) of $1.11 per share and unit, which was unchanged compared to the comparable prior year period. • First quarter same - property cash net operating income (“Same - Property Cash NOI”) growth was 3.2% on a year - over - year basis. • March 31, 2026, portfolio leased occupancy was 95.4%. First Quarter Capital Markets • Entered into a Master Note and Guaranty Agreement with affiliates of New York Life (collectively, the “Purchasers”) that established an uncommitted senior unsecured note facility pursuant to which the Company may issue senior unsecured promissory notes from time to time in one or more series to the Purchasers in an aggregate principal amount of up to $150 million. As of March 31, 2026, no notes had been issued or were outstanding under the Master Note and Guaranty Agreement. • Established a $75 million “at - the - market” equity offering program for the Company’s 8.00% Series B Cumulative Redeemable Preferred Stock. • To date in 2026, the Company has not ( i ) repurchased any shares of its Common Stock under its Stock Repurchase Program or (ii) issued any shares of common stock or preferred stock under its ATM programs. First Quarter Investment Highlights • As previously announced, the Company invested $7.1 million for a 49% interest in a joint venture with a developer to facilitate the development of a 132 - unit, active adult residential community in a suburb of Minneapolis, Minnesota. In connection with its establishment, the joint venture entered into a construction loan with a principal balance of $31.0 million. Tenant Update • As of May 5, 2026, the Company’s tenant at its White Rock facility in Dallas, Texas continued its Chapter 11 bankruptcy reorganization. Since the date of its bankruptcy filing through May 5, 2026, the tenant remains current in its rent obligations to us. *All per share , per share and unit, and weighted average share and unit amounts have been adjusted to reflect the impact of the Reverse Stock Split.
Recent Events 5 First Quarter 2026 Supplemental Reporting Inaugural SHOP Investments • On May 1, 2026, the Company signed purchase agreements (subject to customary closing conditions) for two newly constructed luxury seniors housing communities located within the affluent Potomac Yard submarket of Alexandria, Virginia for an aggregate purchase price of $249 million. The assets will be operated as a unified campus offering a full continuum of care spanning independent living, assisted living, and memory care – driving meaningful operating synergies and a superior resident experience. It is anticipated that these acquisitions will close in the second quarter. Both communities will be managed as seniors housing operating properties (SHOP) and are expected to deliver a double - digit unlevered IRR. • On May 6, 2026, the Company signed a purchase agreement (subject to customary closing conditions) for a newly constructed luxury senior housing community located in North Bethesda, Maryland for a purchase price of approximately $176 million. This luxury asset, located adjacent to Pike & Rose, a premier mixed - use development, offers residents a full continuum of care across a mix of independent living, assisted living, and memory care housing. It is anticipated that this acquisition will close in the fourth quarter. This community will be managed as a SHOP and is expected to deliver a double - digit unlevered IRR. For additional information regarding these acquisitions, please refer to the Company’s separate press release. Growth Capital Infusion • On May 6, 2026, the Company entered into a $100 million delayed - draw, convertible preferred equity facility with affiliates of Maewyn Capital Partners (“Maewyn”), pursuant to which Maewyn will invest up to $100 million in the Company’s new 6.00% Series C Convertible Preferred Stock (subject to certain closing conditions), with an initial conversion price of $43.00 per share of common stock. In connection with this investment, Mr. Charles Fitzgerald, managing partner of Maewyn, will be appointed to our Board of Directors following the Company’s 2026 annual stockholders’ meeting on May 20, 2026. For additional information regarding this investment, please refer to the Company’s separate press release. Common Dividends • On May 5, 2026, the Board of Directors (the “Board”) declared a monthly common stock cash dividend of $0.16 per share for each of July, August and September of 2026, representing quarterly cash dividends totaling $0.48 per share. This compares to a monthly common stock cash dividend of $0.25 per share for April, May and June 2026, representing an approximate 36% reduction. The Company is evolving from a yield - focused REIT into an active growth platform. Given the transformation we are resizing our dividend to focus on retaining cash flow and to accelerate the Company’s acquisition strategy and accelerate the ramp of its SHOP portfolio. Mezzanine Loan • On April 1, 2026, the Company closed a $3.0 million mezzanine loan secured by an under development medical facility located in Fort Myers, Florida. The medical facility is an on - campus outpatient surgical facility that is 100% pre - leased to an investment grade tenant under a 15 - year lease with no termination rights. The loan bears interest at a rate of 12.0% per annum, has an initial term of 24 months, and represents approximately 10% of the total project cost. In connection with the loan, the Company holds a right of first offer and right of first refusal with respect to a sale of the property, which are subject to the pre - leased tenant’s corresponding rights.
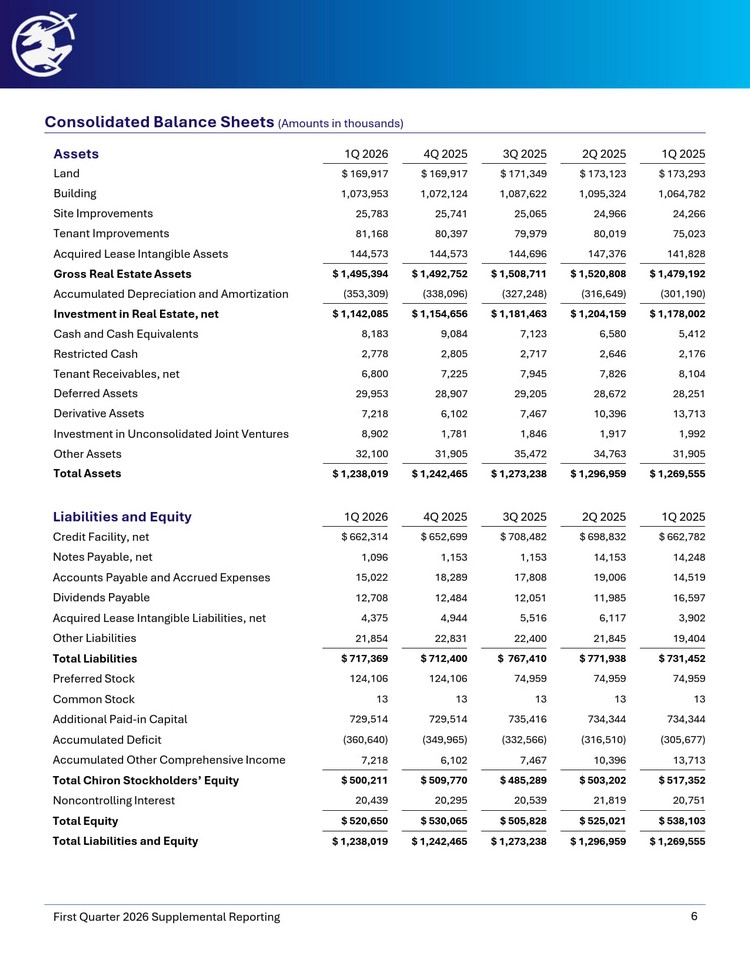
1Q 2025 2Q 2025 3Q 2025 4Q 2025 1Q 2026 Liabilities and Equity $ 662,782 $ 698,832 $ 708,482 $ 652,699 $ 662,314 Credit Facility, net 14,248 14,153 1,153 1,153 1,096 Notes Payable, net 14,519 19,006 17,808 18,289 15,022 Accounts Payable and Accrued Expenses 16,597 11,985 12,051 12,484 12,708 Dividends Payable 3,902 6,117 5,516 4,944 4,375 Acquired Lease Intangible Liabilities, net 19,404 21,845 22,400 22,831 21,854 Other Liabilities $ 731,452 $ 771,938 $ 767,410 $ 712,400 $ 717,369 Total Liabilities 74,959 74,959 74,959 124,106 124,106 Preferred Stock 13 13 13 13 13 Common Stock 734,344 734,344 735,416 729,514 729,514 Additional Paid - in Capital (305,677) (316,510) (332,566) (349,965) (360,640) Accumulated Deficit 13,713 10,396 7,467 6,102 7,218 Accumulated Other Comprehensive Income $ 517,352 $ 503,202 $ 485,289 $ 509,770 $ 500,211 Total Chiron Stockholders’ Equity 20,751 21,819 20,539 20,295 20,439 Noncontrolling Interest $ 538,103 $ 525,021 $ 505,828 $ 530,065 $ 520,650 Total Equity $ 1,269,555 $ 1,296,959 $ 1,273,238 $ 1,242,465 $ 1,238,019 Total Liabilities and Equity 1Q 2025 2Q 2025 3Q 2025 4Q 2025 1Q 2026 Assets $ 173,293 $ 173,123 $ 171,349 $ 169,917 $ 169,917 Land 1,064,782 1,095,324 1,087,622 1,072,124 1,073,953 Building 24,266 24,966 25,065 25,741 25,783 Site Improvements 75,023 80,019 79,979 80,397 81,168 Tenant Improvements 141,828 147,376 144,696 144,573 144,573 Acquired Lease Intangible Assets $ 1,479,192 $ 1,520,808 $ 1,508,711 $ 1,492,752 $ 1,495,394 Gross Real Estate Assets (301,190) (316,649) (327,248) (338,096) (353,309) Accumulated Depreciation and Amortization $ 1,178,002 $ 1,204,159 $ 1,181,463 $ 1,154,656 $ 1,142,085 Investment in Real Estate, net 5,412 6,580 7,123 9,084 8,183 Cash and Cash Equivalents 2,176 2,646 2,717 2,805 2,778 Restricted Cash 8,104 7,826 7,945 7,225 6,800 Tenant Receivables, net 28,251 28,672 29,205 28,907 29,953 Deferred Assets 13,713 10,396 7,467 6,102 7,218 Derivative Assets 1,992 1,917 1,846 1,781 8,902 Investment in Unconsolidated Joint Ventures 31,905 34,763 35,472 31,905 32,100 Other Assets $ 1,269,555 $ 1,296,959 $ 1,273,238 $ 1,242,465 $ 1,238,019 Total Assets Consolidated Balance Sheets (Amounts in thousands) 6 First Quarter 2026 Supplemental Reporting
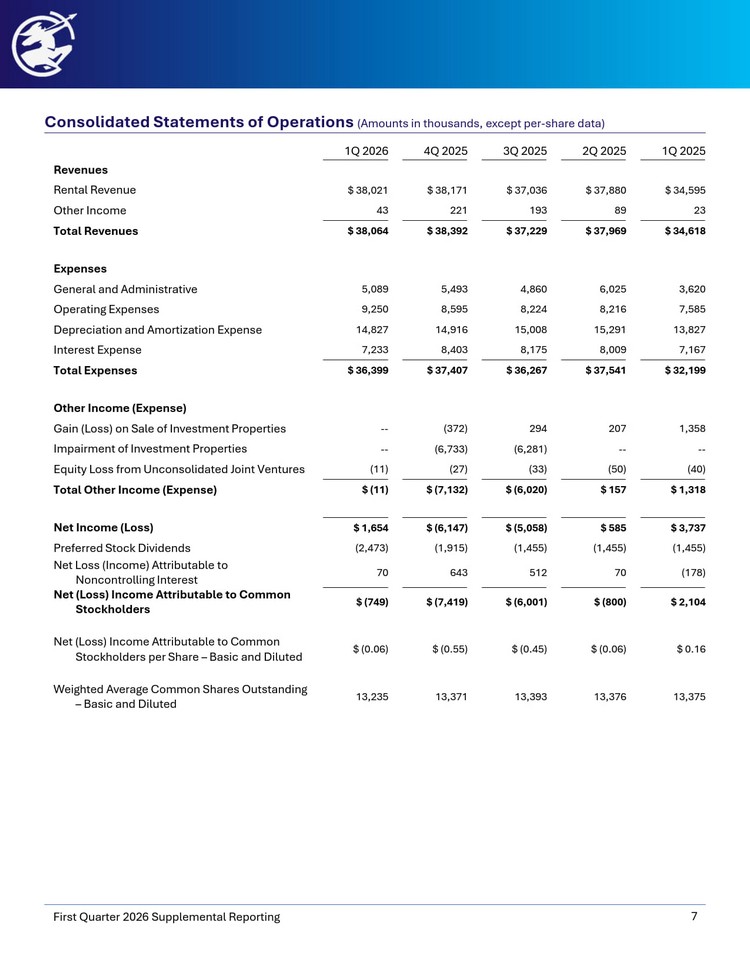
Consolidated Statements of Operations (Amounts in thousands, except per - share data) 7 First Quarter 2026 Supplemental Reporting 1Q 2025 2Q 2025 3Q 2025 4Q 2025 1Q 2026 Revenues $ 34,595 $ 37,880 $ 37,036 $ 38,171 $ 38,021 Rental Revenue 23 89 193 221 43 Other Income $ 34,618 $ 37,969 $ 37,229 $ 38,392 $ 38,064 Total Revenues Expenses 3,620 6,025 4,860 5,493 5,089 General and Administrative 7,585 8,216 8,224 8,595 9,250 Operating Expenses 13,827 15,291 15,008 14,916 14,827 Depreciation and Amortization Expense 7,167 8,009 8,175 8,403 7,233 Interest Expense $ 32,199 $ 37,541 $ 36,267 $ 37,407 $ 36,399 Total Expenses Other Income (Expense) 1,358 207 294 (372) -- Gain (Loss) on Sale of Investment Properties -- -- (6,281) (6,733) -- Impairment of Investment Properties (40) (50) (33) (27) (11) Equity Loss from Unconsolidated Joint Ventures $ 1,318 $ 157 $ (6,020) $ (7,132) $ (11) Total Other Income (Expense) $ 3,737 $ 585 $ (5,058) $ (6,147) $ 1,654 Net Income (Loss) (1,455) (1,455) (1,455) (1,915) (2,473) Preferred Stock Dividends (178) 70 512 643 70 Net Loss (Income) Attributable to Noncontrolling Interest $ 2,104 $ (800) $ (6,001) $ (7,419) $ (749) Net (Loss) Income Attributable to Common Stockholders $ 0.16 $ (0.06) $ (0.45) $ (0.55) $ (0.06) Net (Loss) Income Attributable to Common Stockholders per Share – Basic and Diluted 13,375 13,376 13,393 13,371 13,235 Weighted Average Common Shares Outstanding – Basic and Diluted
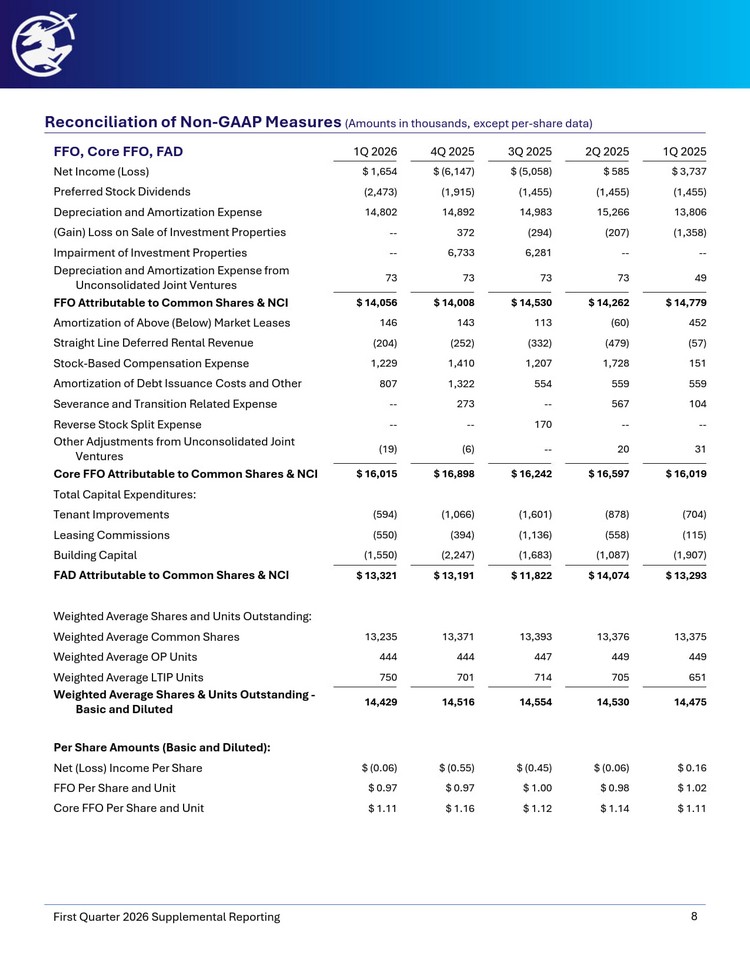
1Q 2025 2Q 2025 3Q 2025 4Q 2025 1Q 2026 FFO, Core FFO, FAD $ 3,737 $ 585 $ (5,058) $ (6,147) $ 1,654 Net Income (Loss) (1,455) (1,455) (1,455) (1,915) (2,473) Preferred Stock Dividends 13,806 15,266 14,983 14,892 14,802 Depreciation and Amortization Expense (1,358) (207) (294) 372 -- (Gain) Loss on Sale of Investment Properties -- -- 6,281 6,733 -- Impairment of Investment Properties 49 73 73 73 73 Depreciation and Amortization Expense from Unconsolidated Joint Ventures $ 14,779 $ 14,262 $ 14,530 $ 14,008 $ 14,056 FFO Attributable to Common Shares & NCI 452 (60) 113 143 146 Amortization of Above (Below) Market Leases (57) (479) (332) (252) (204) Straight Line Deferred Rental Revenue 151 1,728 1,207 1,410 1,229 Stock - Based Compensation Expense 559 559 554 1,322 807 Amortization of Debt Issuance Costs and Other 104 567 -- 273 -- Severance and Transition Related Expense -- -- 170 -- -- Reverse Stock Split Expense 31 20 -- (6) (19) Other Adjustments from Unconsolidated Joint Ventures $ 16,019 $ 16,597 $ 16,242 $ 16,898 $ 16,015 Core FFO Attributable to Common Shares & NCI Total Capital Expenditures: (704) (878) (1,601) (1,066) (594) Tenant Improvements (115) (558) (1,136) (394) (550) Leasing Commissions (1,907) (1,087) (1,683) (2,247) (1,550) Building Capital $ 13,293 $ 14,074 $ 11,822 $ 13,191 $ 13,321 FAD Attributable to Common Shares & NCI Weighted Average Shares and Units Outstanding: 13,375 13,376 13,393 13,371 13,235 Weighted Average Common Shares 449 449 447 444 444 Weighted Average OP Units 651 705 714 701 750 Weighted Average LTIP Units 14,475 14,530 14,554 14,516 14,429 Weighted Average Shares & Units Outstanding - Basic and Diluted Per Share Amounts (Basic and Diluted): $ 0.16 $ (0.06) $ (0.45) $ (0.55) $ (0.06) Net (Loss) Income Per Share $ 1.02 $ 0.98 $ 1.00 $ 0.97 $ 0.97 FFO Per Share and Unit $ 1.11 $ 1.14 $ 1.12 $ 1.16 $ 1.11 Core FFO Per Share and Unit Reconciliation of Non - GAAP Measures (Amounts in thousands, except per - share data) 8 First Quarter 2026 Supplemental Reporting
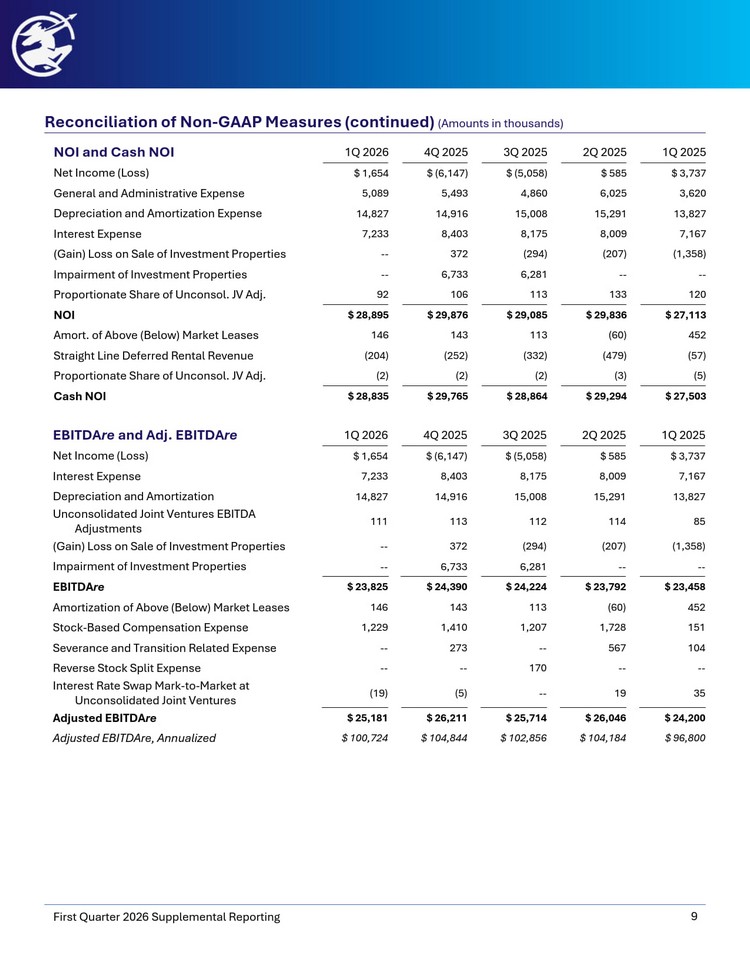
1Q 2025 2Q 2025 3Q 2025 4Q 2025 1Q 2026 EBITDA re and Adj. EBITDA re $ 3,737 $ 585 $ (5,058) $ (6,147) $ 1,654 Net Income (Loss) 7,167 8,009 8,175 8,403 7,233 Interest Expense 13,827 15,291 15,008 14,916 14,827 Depreciation and Amortization 85 114 112 113 111 Unconsolidated Joint Ventures EBITDA Adjustments (1,358) (207) (294) 372 -- (Gain) Loss on Sale of Investment Properties -- -- 6,281 6,733 -- Impairment of Investment Properties $ 23,458 $ 23,792 $ 24,224 $ 24,390 $ 23,825 EBITDA re 452 (60) 113 143 146 Amortization of Above (Below) Market Leases 151 1,728 1,207 1,410 1,229 Stock - Based Compensation Expense 104 567 -- 273 -- Severance and Transition Related Expense -- -- 170 -- -- Reverse Stock Split Expense 35 19 -- (5) (19) Interest Rate Swap Mark - to - Market at Unconsolidated Joint Ventures $ 24,200 $ 26,046 $ 25,714 $ 26,211 $ 25,181 Adjusted EBITDA re $ 96,800 $ 104,184 $ 102,856 $ 104,844 $ 100,724 Adjusted EBITDAre , Annualized 1Q 2025 2Q 2025 3Q 2025 4Q 2025 1Q 2026 NOI and Cash NOI $ 3,737 $ 585 $ (5,058) $ (6,147) $ 1,654 Net Income (Loss) 3,620 6,025 4,860 5,493 5,089 General and Administrative Expense 13,827 15,291 15,008 14,916 14,827 Depreciation and Amortization Expense 7,167 8,009 8,175 8,403 7,233 Interest Expense (1,358) (207) (294) 372 -- (Gain) Loss on Sale of Investment Properties -- -- 6,281 6,733 -- Impairment of Investment Properties 120 133 113 106 92 Proportionate Share of Unconsol . JV Adj. $ 27,113 $ 29,836 $ 29,085 $ 29,876 $ 28,895 NOI 452 (60) 113 143 146 Amort. of Above (Below) Market Leases (57) (479) (332) (252) (204) Straight Line Deferred Rental Revenue (5) (3) (2) (2) (2) Proportionate Share of Unconsol . JV Adj. $ 27,503 $ 29,294 $ 28,864 $ 29,765 $ 28,835 Cash NOI Reconciliation of Non - GAAP Measures (continued) (Amounts in thousands) 9 First Quarter 2026 Supplemental Reporting
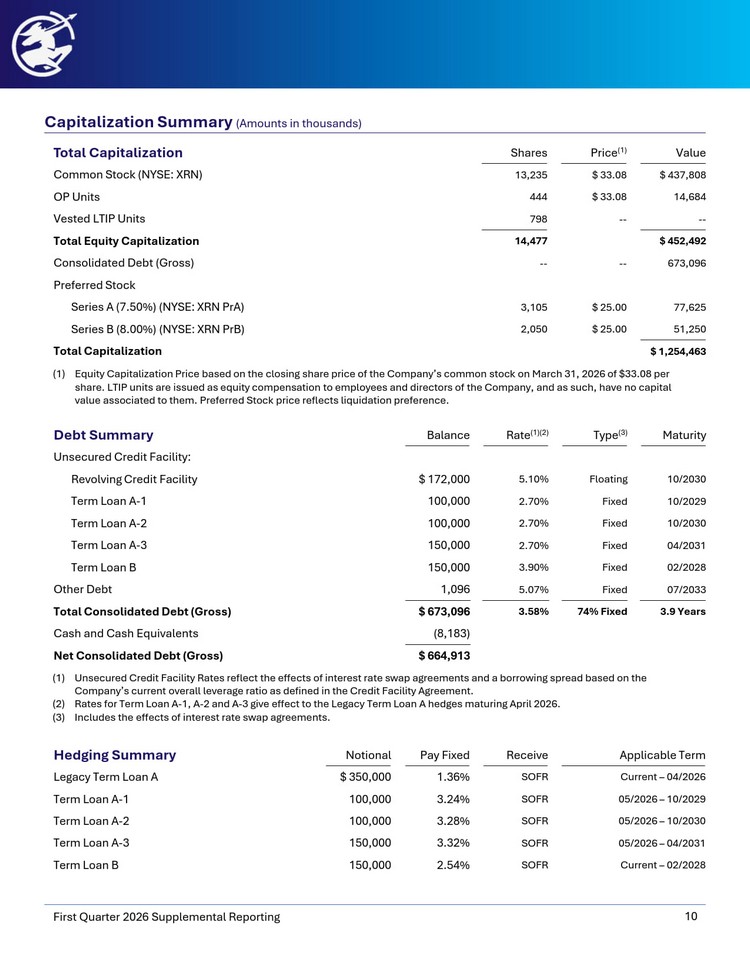
Capitalization Summary (Amounts in thousands) 10 First Quarter 2026 Supplemental Reporting Value Price (1) Shares Total Capitalization $ 437,808 $ 33.08 13,235 Common Stock (NYSE: XRN) 14,684 $ 33.08 444 OP Units -- -- 798 Vested LTIP Units $ 452,492 14,477 Total Equity Capitalization 673,096 -- -- Consolidated Debt (Gross) Preferred Stock 77,625 $ 25.00 3,105 Series A (7.50%) (NYSE: XRN PrA ) 51,250 $ 25.00 2,050 Series B (8.00%) (NYSE: XRN PrB ) $ 1,254,463 Total Capitalization (1) Equity Capitalization Price based on the closing share price of the Company’s common stock on March 31, 2026 of $33.08 per share. LTIP units are issued as equity compensation to employees and directors of the Company, and as such, have no capital value associated to them. Preferred Stock price reflects liquidation preference. Maturity Type (3) Rate (1)(2) Balance Debt Summary Unsecured Credit Facility: 10/2030 Floating 5.10% $ 172,000 Revolving Credit Facility 10/2029 Fixed 2.70% 100,000 Term Loan A - 1 10/2030 Fixed 2.70% 100,000 Term Loan A - 2 04/2031 Fixed 2.70% 150,000 Term Loan A - 3 02/2028 Fixed 3.90% 150,000 Term Loan B 07/2033 Fixed 5.07% 1,096 Other Debt 3.9 Years 74% Fixed 3.58% $ 673,096 Total Consolidated Debt (Gross) (8,183) Cash and Cash Equivalents $ 664,913 Net Consolidated Debt (Gross) (1) Unsecured Credit Facility Rates reflect the effects of interest rate swap agreements and a borrowing spread based on the Company’s current overall leverage ratio as defined in the Credit Facility Agreement. (2) Rates for Term Loan A - 1, A - 2 and A - 3 give effect to the Legacy Term Loan A hedges maturing April 2026. (3) Includes the effects of interest rate swap agreements. Applicable Term Receive Pay Fixed Notional Hedging Summary Current – 04/2026 SOFR 1.36% $ 350,000 Legacy Term Loan A 05/2026 – 10/2029 SOFR 3.24% 100,000 Term Loan A - 1 05/2026 – 10/2030 SOFR 3.28% 100,000 Term Loan A - 2 05/2026 – 04/2031 SOFR 3.32% 150,000 Term Loan A - 3 Current – 02/2028 SOFR 2.54% 150,000 Term Loan B
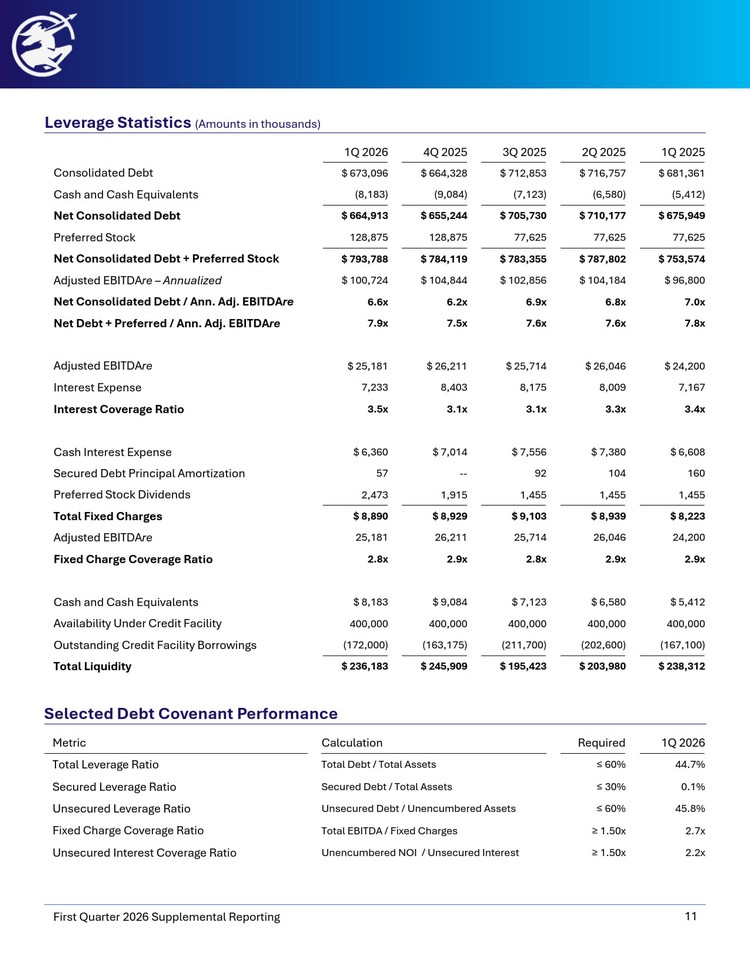
Leverage Statistics (Amounts in thousands) 11 First Quarter 2026 Supplemental Reporting 1Q 2025 2Q 2025 3Q 2025 4Q 2025 1Q 2026 $ 681,361 $ 716,757 $ 712,853 $ 664,328 $ 673,096 Consolidated Debt (5,412) (6,580) (7,123) (9,084) (8,183) Cash and Cash Equivalents $ 675,949 $ 710,177 $ 705,730 $ 655,244 $ 664,913 Net Consolidated Debt 77,625 77,625 77,625 128,875 128,875 Preferred Stock $ 753,574 $ 787,802 $ 783,355 $ 784,119 $ 793,788 Net Consolidated Debt + Preferred Stock $ 96,800 $ 104,184 $ 102,856 $ 104,844 $ 100,724 Adjusted EBITDA re – Annualized 7.0x 6.8x 6.9x 6.2x 6.6x Net Consolidated Debt / Ann. Adj. EBITDA re 7.8x 7.6x 7.6x 7.5x 7.9x Net Debt + Preferred / Ann. Adj. EBITDA re $ 24,200 $ 26,046 $ 25,714 $ 26,211 $ 25,181 Adjusted EBITDA re 7,167 8,009 8,175 8,403 7,233 Interest Expense 3.4x 3.3x 3.1x 3.1x 3.5x Interest Coverage Ratio $ 6,608 $ 7,380 $ 7,556 $ 7,014 $ 6,360 Cash Interest Expense 160 104 92 -- 57 Secured Debt Principal Amortization 1,455 1,455 1,455 1,915 2,473 Preferred Stock Dividends $ 8,223 $ 8,939 $ 9,103 $ 8,929 $ 8,890 Total Fixed Charges 24,200 26,046 25,714 26,211 25,181 Adjusted EBITDA re 2.9x 2.9x 2.8x 2.9x 2.8x Fixed Charge Coverage Ratio $ 5,412 $ 6,580 $ 7,123 $ 9,084 $ 8,183 Cash and Cash Equivalents 400,000 400,000 400,000 400,000 400,000 Availability Under Credit Facility (167,100) (202,600) (211,700) (163,175) (172,000) Outstanding Credit Facility Borrowings $ 238,312 $ 203,980 $ 195,423 $ 245,909 $ 236,183 Total Liquidity Selected Debt Covenant Performance 1Q 2026 Required Calculation Metric 44.7% ≤ 60% Total Debt / Total Assets Total Leverage Ratio 0.1% ≤ 30% Secured Debt / Total Assets Secured Leverage Ratio 45.8% ≤ 60% Unsecured Debt / Unencumbered Assets Unsecured Leverage Ratio 2.7x ≥ 1.50x Total EBITDA / Fixed Charges Fixed Charge Coverage Ratio 2.2x ≥ 1.50x Unencumbered NOI / Unsecured Interest Unsecured Interest Coverage Ratio
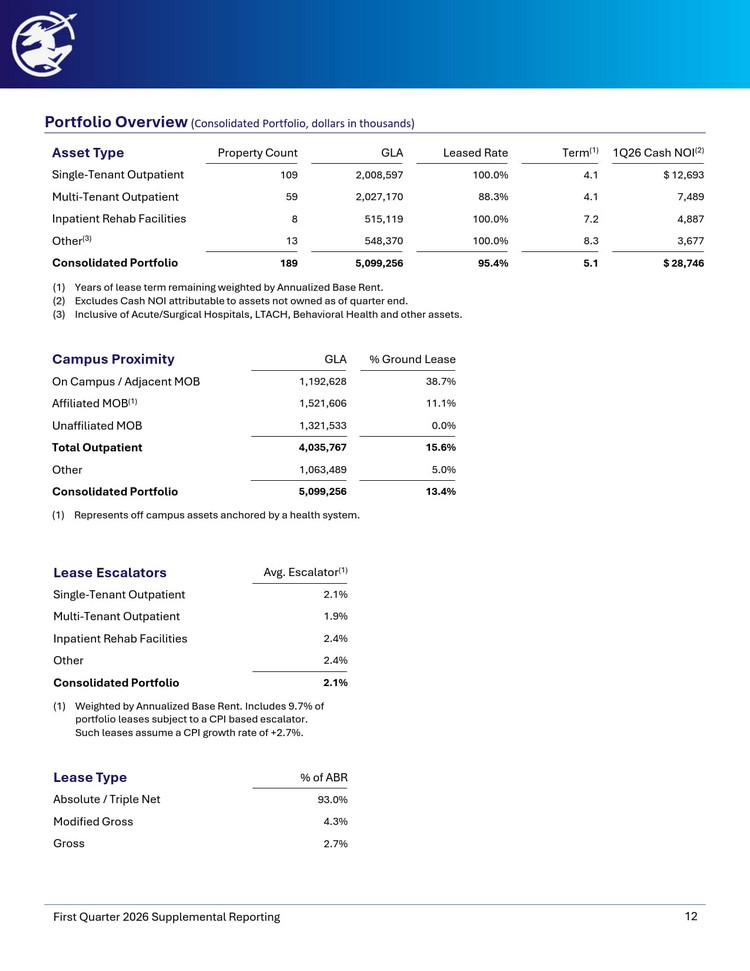
Portfolio Overview (Consolidated Portfolio, dollars in thousands) 12 First Quarter 2026 Supplemental Reporting 1Q26 Cash NOI (2) Term (1) Leased Rate GLA Property Count Asset Type $ 12,693 4.1 100.0% 2,008,597 109 Single - Tenant Outpatient 7,489 4.1 88.3% 2,027,170 59 Multi - Tenant Outpatient 4,887 7.2 100.0% 515,119 8 Inpatient Rehab Facilities 3,677 8.3 100.0% 548,370 13 Other (3) $ 28,746 5.1 95.4% 5,099,256 189 Consolidated Portfolio % Ground Lease GLA Campus Proximity 38.7% 1,192,628 On Campus / Adjacent MOB 11.1% 1,521,606 Affiliated MOB (1) 0.0% 1,321,533 Unaffiliated MOB 15.6% 4,035,767 Total Outpatient 5.0% 1,063,489 Other 13.4% 5,099,256 Consolidated Portfolio Avg. Escalator (1) Lease Escalators 2.1% Single - Tenant Outpatient 1.9% Multi - Tenant Outpatient 2.4% Inpatient Rehab Facilities 2.4% Other 2.1% Consolidated Portfolio (1) Represents off campus assets anchored by a health system. (1) Years of lease term remaining weighted by Annualized Base Rent. (2) Excludes Cash NOI attributable to assets not owned as of quarter end. (3) Inclusive of Acute/Surgical Hospitals, LTACH, Behavioral Health and other assets. (1) Weighted by Annualized Base Rent. Includes 9.7% of portfolio leases subject to a CPI based escalator. Such leases assume a CPI growth rate of +2.7%. % of ABR Lease Type 93.0% Absolute / Triple Net 4.3% Modified Gross 2.7% Gross
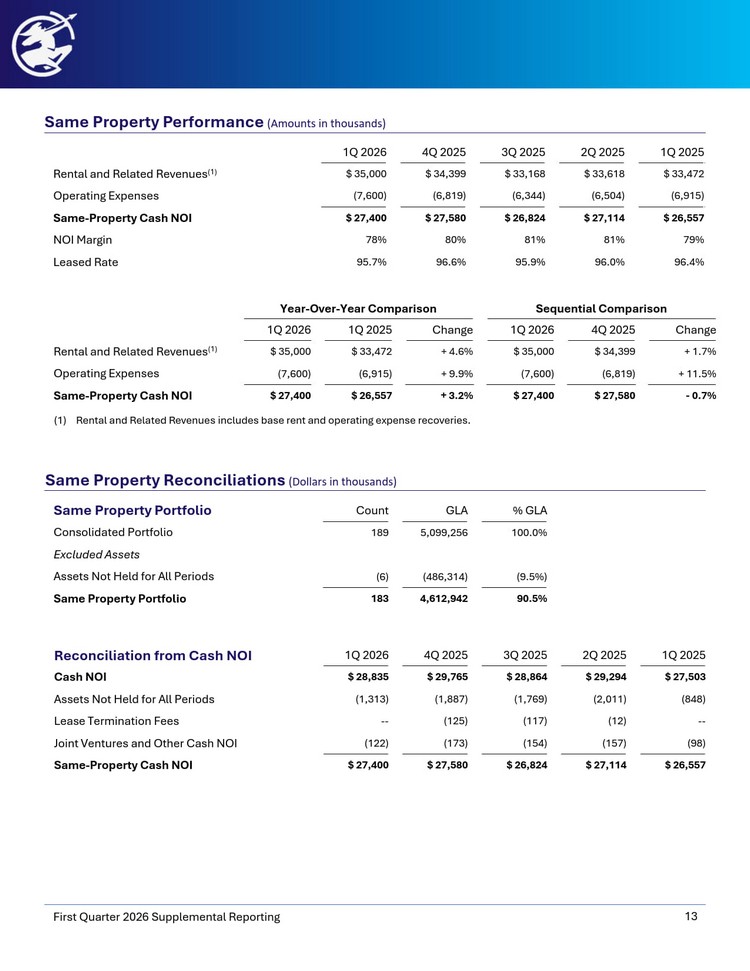
1Q 2025 2Q 2025 3Q 2025 4Q 2025 1Q 2026 $ 33,472 $ 33,618 $ 33,168 $ 34,399 $ 35,000 Rental and Related Revenues (1) (6,915) (6,504) (6,344) (6,819) (7,600) Operating Expenses $ 26,557 $ 27,114 $ 26,824 $ 27,580 $ 27,400 Same - Property Cash NOI 79% 81% 81% 80% 78% NOI Margin 96.4% 96.0% 95.9% 96.6% 95.7% Leased Rate Same Property Performance (Amounts in thousands) 13 First Quarter 2026 Supplemental Reporting % GLA GLA Count Same Property Portfolio 100.0% 5,099,256 189 Consolidated Portfolio Excluded Assets (9.5%) (486,314) (6) Assets Not Held for All Periods 90.5% 4,612,942 183 Same Property Portfolio 1Q 2025 2Q 2025 3Q 2025 4Q 2025 1Q 2026 Reconciliation from Cash NOI $ 27,503 $ 29,294 $ 28,864 $ 29,765 $ 28,835 Cash NOI (848) (2,011) (1,769) (1,887) (1,313) Assets Not Held for All Periods -- (12) (117) (125) -- Lease Termination Fees (98) (157) (154) (173) (122) Joint Ventures and Other Cash NOI $ 26,557 $ 27,114 $ 26,824 $ 27,580 $ 27,400 Same - Property Cash NOI Same Property Reconciliations (Dollars in thousands) Sequential Comparison Year - Over - Year Comparison Change 4Q 2025 1Q 2026 Change 1Q 2025 1Q 2026 + 1.7% $ 34,399 $ 35,000 + 4.6% $ 33,472 $ 35,000 Rental and Related Revenues (1) + 11.5% (6,819) (7,600) + 9.9% (6,915) (7,600) Operating Expenses - 0.7% $ 27,580 $ 27,400 + 3.2% $ 26,557 $ 27,400 Same - Property Cash NOI (1) Rental and Related Revenues includes base rent and operating expense recoveries.
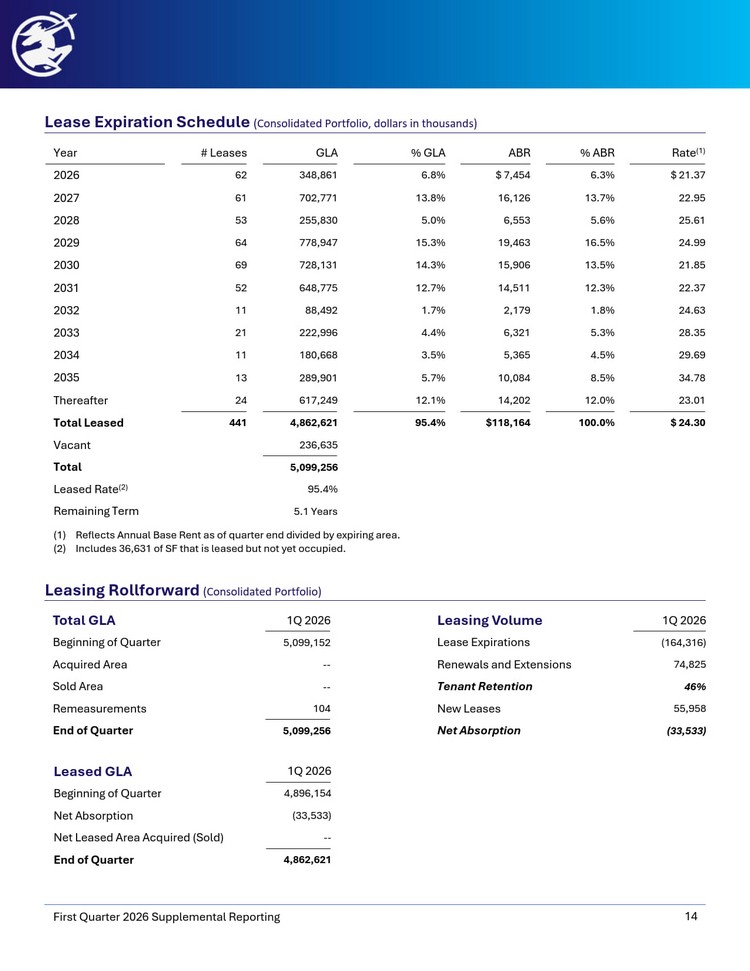
Lease Expiration Schedule (Consolidated Portfolio, dollars in thousands ) 14 First Quarter 2026 Supplemental Reporting Rate (1) % ABR ABR % GLA GLA # Leases Year $ 21.37 6.3% $ 7,454 6.8% 348,861 62 2026 22.95 13.7% 16,126 13.8% 702,771 61 2027 25.61 5.6% 6,553 5.0% 255,830 53 2028 24.99 16.5% 19,463 15.3% 778,947 64 2029 21.85 13.5% 15,906 14.3% 728,131 69 2030 22.37 12.3% 14,511 12.7% 648,775 52 2031 24.63 1.8% 2,179 1.7% 88,492 11 2032 28.35 5.3% 6,321 4.4% 222,996 21 2033 29.69 4.5% 5,365 3.5% 180,668 11 2034 34.78 8.5% 10,084 5.7% 289,901 13 2035 23.01 12.0% 14,202 12.1% 617,249 24 Thereafter $ 24.30 100.0% $118,164 95.4% 4,862,621 441 Total Leased 236,635 Vacant 5,099,256 Total 95.4% Leased Rate (2) 5.1 Years Remaining Term Leasing Rollforward (Consolidated Portfolio) (1) Reflects Annual Base Rent as of quarter end divided by expiring area. (2) Includes 36,631 of SF that is leased but not yet occupied. 1Q 2026 Total GLA 5,099,152 Beginning of Quarter -- Acquired Area -- Sold Area 104 Remeasurements 5,099,256 End of Quarter 1Q 2026 Leasing Volume (164,316) Lease Expirations 74,825 Renewals and Extensions 46% Tenant Retention 55,958 New Leases (33,533) Net Absorption 1Q 2026 Leased GLA 4,896,154 Beginning of Quarter (33,533) Net Absorption -- Net Leased Area Acquired (Sold) 4,862,621 End of Quarter
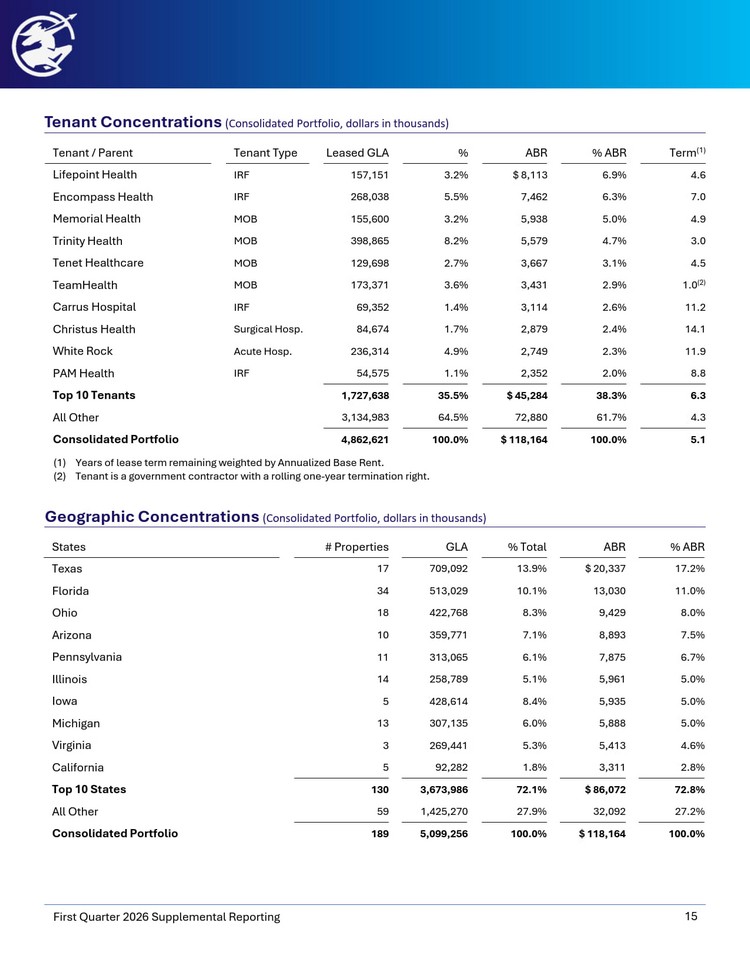
Tenant Concentrations (Consolidated Portfolio, dollars in thousands) 15 First Quarter 2026 Supplemental Reporting Geographic Concentrations (Consolidated Portfolio , dollars in thousands ) % ABR ABR % Total GLA # Properties States 17.2% $ 20,337 13.9% 709,092 17 Texas 11.0% 13,030 10.1% 513,029 34 Florida 8.0% 9,429 8.3% 422,768 18 Ohio 7.5% 8,893 7.1% 359,771 10 Arizona 6.7% 7,875 6.1% 313,065 11 Pennsylvania 5.0% 5,961 5.1% 258,789 14 Illinois 5.0% 5,935 8.4% 428,614 5 Iowa 5.0% 5,888 6.0% 307,135 13 Michigan 4.6% 5,413 5.3% 269,441 3 Virginia 2.8% 3,311 1.8% 92,282 5 California 72.8% $ 86,072 72.1% 3,673,986 130 Top 10 States 27.2% 32,092 27.9% 1,425,270 59 All Other 100.0% $ 118,164 100.0% 5,099,256 189 Consolidated Portfolio Term (1) % ABR ABR % Leased GLA Tenant Type Tenant / Parent 4.6 6.9% $ 8,113 3.2% 157,151 IRF Lifepoint Health 7.0 6.3% 7,462 5.5% 268,038 IRF Encompass Health 4.9 5.0% 5,938 3.2% 155,600 MOB Memorial Health 3.0 4.7% 5,579 8.2% 398,865 MOB Trinity Health 4.5 3.1% 3,667 2.7% 129,698 MOB Tenet Healthcare 1.0 (2) 2.9% 3,431 3.6% 173,371 MOB TeamHealth 11.2 2.6% 3,114 1.4% 69,352 IRF Carrus Hospital 14.1 2.4% 2,879 1.7% 84,674 Surgical Hosp. Christus Health 11.9 2.3% 2,749 4.9% 236,314 Acute Hosp. White Rock 8.8 2.0% 2,352 1.1% 54,575 IRF PAM Health 6.3 38.3% $ 45,284 35.5% 1,727,638 Top 10 Tenants 4.3 61.7% 72,880 64.5% 3,134,983 All Other 5.1 100.0% $ 118,164 100.0% 4,862,621 Consolidated Portfolio (1) Years of lease term remaining weighted by Annualized Base Rent. (2) Tenant is a government contractor with a rolling one - year termination right.
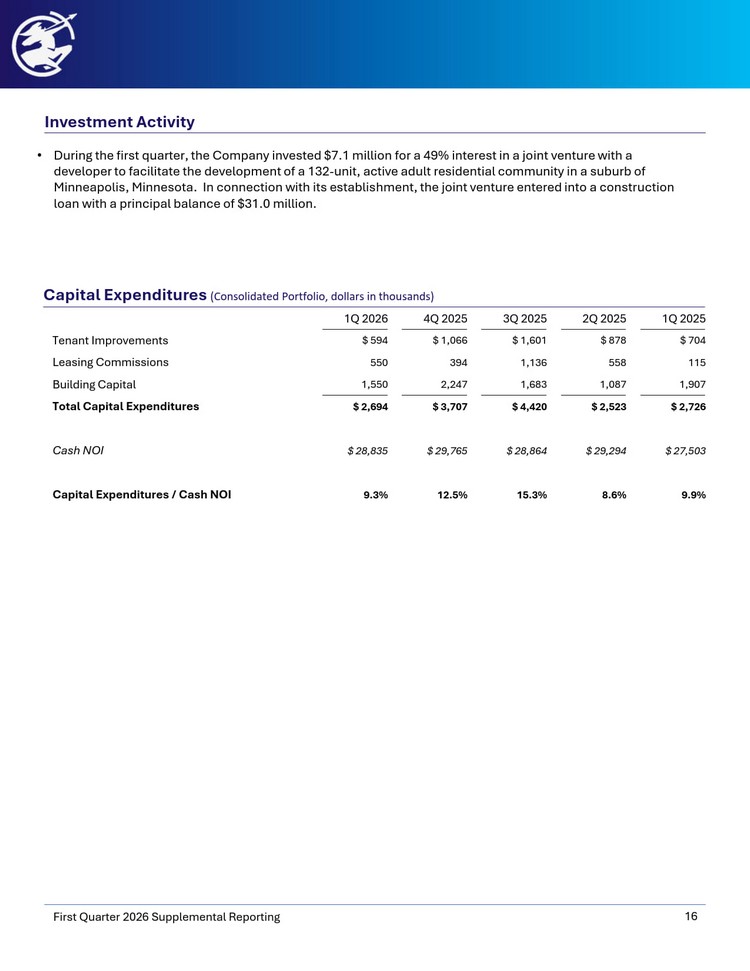
16 First Quarter 2026 Supplemental Reporting Capital Expenditures (Consolidated Portfolio, dollars in thousands) 1Q 2025 2Q 2025 3Q 2025 4Q 2025 1Q 2026 $ 704 $ 878 $ 1,601 $ 1,066 $ 594 Tenant Improvements 115 558 1,136 394 550 Leasing Commissions 1,907 1,087 1,683 2,247 1,550 Building Capital $ 2,726 $ 2,523 $ 4,420 $ 3,707 $ 2,694 Total Capital Expenditures $ 27,503 $ 29,294 $ 28,864 $ 29,765 $ 28,835 Cash NOI 9.9% 8.6% 15.3% 12.5% 9.3% Capital Expenditures / Cash NOI Investment Activity • During the first quarter, the Company invested $7.1 million for a 49% interest in a joint venture with a developer to facilitate the development of a 132 - unit, active adult residential community in a suburb of Minneapolis, Minnesota. In connection with its establishment, the joint venture entered into a construction loan with a principal balance of $31.0 million.
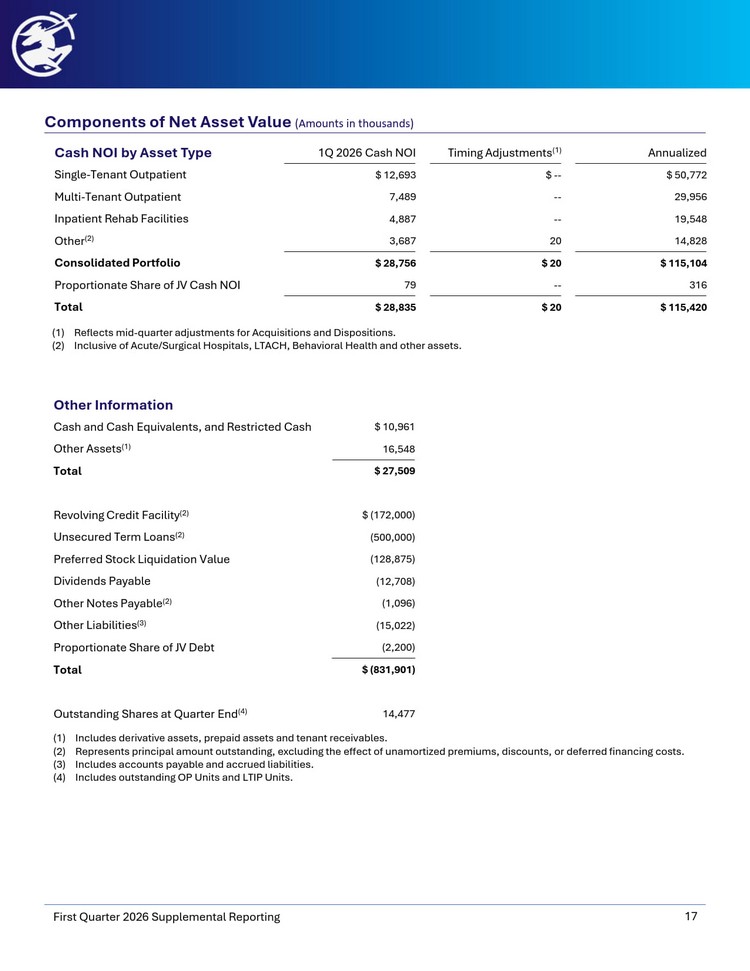
Components of Net Asset Value (Amounts in thousands) 17 First Quarter 2026 Supplemental Reporting Annualized Timing Adjustments (1) 1Q 2026 Cash NOI Cash NOI by Asset Type $ 50,772 $ -- $ 12,693 Single - Tenant Outpatient 29,956 -- 7,489 Multi - Tenant Outpatient 19,548 -- 4,887 Inpatient Rehab Facilities 14,828 20 3,687 Other (2) $ 115,104 $ 20 $ 28,756 Consolidated Portfolio 316 -- 79 Proportionate Share of JV Cash NOI $ 115,420 $ 20 $ 28,835 Total (1) Reflects mid - quarter adjustments for Acquisitions and Dispositions. (2) Inclusive of Acute/Surgical Hospitals, LTACH, Behavioral Health and other assets. Other Information $ 10,961 Cash and Cash Equivalents, and Restricted Cash 16,548 Other Assets (1) $ 27,509 Total $ (172,000) Revolving Credit Facility (2) (500,000) Unsecured Term Loans (2) (128,875) Preferred Stock Liquidation Value (12,708) Dividends Payable (1,096) Other Notes Payable (2) (15,022) Other Liabilities (3) (2,200) Proportionate Share of JV Debt $ (831,901) Total 14,477 Outstanding Shares at Quarter End (4) (1) Includes derivative assets, prepaid assets and tenant receivables. (2) Represents principal amount outstanding, excluding the effect of unamortized premiums, discounts, or deferred financing costs . (3) Includes accounts payable and accrued liabilities. (4) Includes outstanding OP Units and LTIP Units.
Reporting Definitions and Other Disclosures 18 First Quarter 2026 Supplemental Reporting Annualized Base Rent : Annualized base rent represents monthly base rent for March 2026 (or, for recent acquisitions, monthly base rent for the month of acquisition), multiplied by 12 (or base rent net of annualized expenses for properties with gross leases). Accordingly, this methodology produces an annualized amount as of a point in time but does not take into account future (i) contractual rental rate increases, (ii) leasing activity or (iii) lease expirations. Additionally, le ase s that are accounted for on a cash - collected basis, or that are in a free rent period, are not included in annualized base rent. Capitalization Rate : The capitalization rate (“Cap Rate”) for an acquisition is calculated by dividing current Annualized Base Rent by contractual purchase price. For the portfolio cap rate, certain adjustments, including for subsequent capital invested, are made to the contractual purchase price. Funds from Operations Attributable to Common Stockholders and Noncontrolling Interest and Core Funds from Operations Attributable to Common Stockholders and Noncontrolling Interest : Funds from operations attributable to common stockholders and noncontrolling interest (“FFO”) and core funds from operations attributable to common stockholders and noncontrolling interest (“Core FFO”), formerly referred to as “Adjusted funds from operations attributable to common stockholders and noncontrolling interest, or (AFFO)” are non - GAAP financial measures within the meaning of the rules of the SEC. The Company considers FFO and Core FFO to be important supplemental measures of its operating performance and believes FFO is frequently used by securities analysts, investors, and other interested parties in the evaluation of REITs, many of which present FFO when reporting their results. In accordance with the National Association of Real Estate Investment Trusts’ (“NAREIT”) definition, FFO means net income or loss computed in accordance with GAAP before noncontrolling interests of holders of OP units and LTIP units, excluding gains (or losses) from sales of property and extraordinary items, property impairment losses, less preferred stock dividends, plus real estate - related depreciation and amortization (excluding amortization of debt issuance costs and the amortization of above and below market leases), and after adjustments for unconsolidated partnerships and joint ventures calculated to reflect FFO on the same basis. Because FFO excludes real estate - related depreciation and amortization (other than amortization of debt issuance costs and above and below market lease amortization expense), the Company believes FFO provides a complete picture of its performance that is more informative than GAAP net income or loss. FFO provides perspective on trends in occupancy rates, rental rates, operating costs, development activities and interest costs, and helps the Company more immediately compare the most recent GAAP measurement, net income or loss. Core FFO, formerly referred to as “Adjusted funds from operations attributable to common stockholders and noncontrolling interest, or (AFFO)”, is a non - GAAP measure used by many investors and analysts to measure a real estate company’s operating performance by removing nonrecurring and non - cash items that do not reflect ongoing operations. Management calculates Core FFO by modifying the NAREIT definition of FFO by ( i ) removing certain non - recurring expenses, as well as other certain non - cash and non - recurring IT costs, (ii) removing amortization related to capitalized leasing and acquisition costs, (iii) removing amortization of above and below market leases and amounts associated with the write - off of above and below market leases for certain early lease terminations (iv) adding back straight - line rent adjustments, (v) recurring amortization of debt issuance costs, (vi) severance and executive transition costs, (vii) share - based compensation expense and (viii) other items related to unconsolidated partnerships and joint ventures. Management believes that reporting Core FFO in addition to FFO is a useful supplemental measure for the investment community when evaluating the operating performance of the Company on a comparative basis. Funds Available for Distribution Attributable to Common Stockholders and Noncontrolling Interest : We calculate funds available for distribution attributable to common stockholders and noncontrolling interest (“FAD”) by deducting capital expenditures for property improvements made to maintain the condition of properties from Core FFO. The Company believes FAD is useful in analyzing the amount of cash available for distribution to stockholders and unitholders. Investors, analysts and the Company utilize FAD as an indicator of common dividend sustainability.
Reporting Definitions and Other Disclosures (continued) 19 First Quarter 2026 Supplemental Reporting Earnings Before Interest, Taxes, Depreciation and Amortization for Real Estate (“ EBITDAre ” and “Adjusted EBITDAre ”) : We calculate EBITDAre in accordance with standards established by NAREIT and define EBITDAre as net income or loss computed in accordance with GAAP plus depreciation and amortization, interest expense, gain or loss on the sale of investment properties, property impairment losses, and adjustments for unconsolidated partnerships and joint ventures, to reflect EBITDAre on the same basis, as applicable. We define Adjusted EBITDAre as EBITDAre plus loss on extinguishment of debt, non - cash stock compensation expense, non - cash intangible amortization related to above and below market leases, severance and transition related expense, reverse stock split expense, adjustments related to our investment in unconsolidated joint ventures, and other normalizing items. Management considers EBITDAre and Adjusted EBITDAre important measures because they provide additional information to allow management, investors, and our current and potential creditors to evaluate and compare our core operating results and our ability to service debt. NOI, Cash NOI and Same - Property Cash NOI : We consider net operating income, or NOI, to be an appropriate supplemental measure to net income because it helps both investors and management understand the core operations of our properties. We define NOI as total net (loss) income, plus depreciation and amortization expense, general and administrative expense, impairments, gain or loss on sale of investment properties, interest expense, and other non - operating items. Cash NOI and Same - Property Cash NOI are key performance indicators. Management considers these to be supplemental measures that allow investors, analysts and Company management to measure improved property - level cash operating results. The Company defines Cash NOI as NOI excluding non - cash items such as above and below market lease intangibles and straight - line rent. Cash NOI is historical and not necessarily indicative of future results. Same - Property Cash NOI compares Cash NOI for stabilized properties. Stabilized properties are properties that have been included in operations for the duration of the year - over - year comparison period presented. Accordingly, stabilized properties exclude properties that were recently acquired or disposed of, properties classified as held for sale, properties undergoing redevelopment, and newly redeveloped or developed properties. Same - Property Cash NOI also excludes lease terminations fees and joint ventures and other income in order to remove non - recurring items and joint venture - related income from our NOI. Other Disclosures Non - GAAP Financial Measures : Management considers certain non - GAAP financial measures to be useful supplemental measures of the Company’s operating performance. For the Company, non - GAAP measures consist of FFO attributable to common stockholders and noncontrolling interest, Core FFO attributable to common stockholders and noncontrolling interest, FAD attributable to common stockholders and noncontrolling interest, EBITDAre and Adjusted EBITDAre , Net Operating Income (“NOI”), cash NOI and same - property cash NOI. A non - GAAP measure is generally defined as one that departs from traditional GAAP financial performance, financial position or cash flows, but excludes or includes amounts that would not be so adjusted in the most comparable measure determined in accordance with GAAP. The Company reports non - GAAP financial measures because these measures are observed by management and they also may be used by the predominant REIT research analysts, as well as by industry analysts to evaluate REITs. For these reasons, management deems it appropriate to disclose and discuss these non - GAAP financial measures. The non - GAAP financial measures presented herein are not necessarily identical to those presented by other real estate companies due to the fact that not all real estate companies use the same definitions. These measures should not be considered alternatives to net income as measures of the Company’s operating performance, or as alternatives to cash flow as measures of the Company’s liquidity. Moreover, these non - GAAP measures necessarily indicate why the Company utilizes these measures, they should be considered supplemental in nature and not superior to comparable GAAP measures. To facilitate a clear understanding of these non - GAAP financial measures, quantitative reconciliations of these non - GAAP measures to the most directly comparable GAAP measures of net income and cash flows from operations as presented elsewhere herein.
Reporting Definitions and Other Disclosures (continued) 20 First Quarter 2026 Supplemental Reporting Additional Information : The information in this document should be read in conjunction with the Company’s Annual Report on Form 10 - K, Quarterly Reports on Form 10 - Q, Current Reports on Form 8 - K, and other information filed with, or furnished to, the SEC. You can access the Company’s reports and amendments to those reports filed or furnished to the SEC pursuant to Section 13(a) or 15(d) of the Exchange Act in the “Investor Relations” section on the Company’s website (www.chironre.com) under “SEC Filings” as soon as reasonably practicable after they are filed with, or furnished to, the SEC. The information on or connected to the Company’s website is not, and shall not be deemed to be, a part of, or incorporated into, this Earnings Supplemental. You also can review these SEC filings and other information by accessing the SEC’s website at http://www.sec.gov . Certain information contained in this package, including, but not limited to, information contained in our key tenants profiles is derived from publicly - available third - party sources. The Company has not independently verified this information and there can be no assurance that such information is accurate or complete.