Shareholder Report
|
12 Months Ended |
|
Feb. 28, 2026
USD ($)
Holding
|
|---|
| Shareholder Report [Line Items] |
|
| Document Type |
N-CSR
|
| Amendment Flag |
false
|
| Registrant Name |
Columbia Funds Series Trust II
|
| Entity Central Index Key |
0001352280
|
| Entity Investment Company Type |
N-1A
|
| Document Period End Date |
Feb. 28, 2026
|
| Shareholder Report Annual or Semi-Annual |
Annual Shareholder Report
|
| C000097532 |
|
| Shareholder Report [Line Items] |
|
| Fund Name |
Columbia Global Value Fund
|
| Class Name |
Class A
|
| Trading Symbol |
IEVAX
|
| Annual or Semi-Annual Statement [Text Block] |
This annual shareholder report contains important information about Columbia Global Value Fund (the Fund) for the period of March 1, 2025 to February 28, 2026.
|
| Additional Information [Text Block] |
You can find additional information about the Fund at columbiathreadneedleus.com/resources/literature. You can also request more information by contacting us at 1-800-345-6611.
|
| Additional Information Phone Number |
1-800-345-6611
|
| Additional Information Website |
columbiathreadneedleus.com/resources/literature
|
| Expenses [Text Block] |
What were the Fund costs for the reporting period? (Based on a hypothetical $10,000 investment)
Table Summary
Class |
Cost of a $10,000 investment |
Cost paid as a percentage of a $10,000 investment |
Class A |
$125 |
1.12% | |
| Expenses Paid, Amount |
$ 125
|
| Expense Ratio, Percent |
1.12%
|
| Factors Affecting Performance [Text Block] |
Management's Discussion of Fund Performance The performance of Class A shares for the period presented is shown in the Average Annual Total Returns table. Top Performance ContributorsStock selection | Selections in the financials, consumer discretionary and materials sectors boosted the Fund’s relative performance during the annual period. Allocations | Smaller allocations to the health care, consumer staples and real estate sectors buoyed Fund relative performance during the annual period. Individual holdings | Positions in Northern Star Resources, an Australian gold miner; Cameco, a Canadian uranium miner; Youngone, a Korean outerwear company; and Paladin Energy, an Australian uranium miner, were top contributors to the Fund’s relative performance during the period. Not owning UnitedHealth Group, an American health insurer, also added to the Fund’s relative performance during the period. Top Performance DetractorsStock selection | Selections in the industrials, information technology and utilities sectors hurt the Fund’s relative performance during the annual period. Allocations | A larger weighting in the consumer discretionary sector and smaller weightings in the materials and industrials sectors detracted from relative Fund performance during the annual period. Individual holdings | Fund underweights in Micron Technology, an American semiconductor company, and Oracle, an American technology company, were top detractors from the Fund’s relative performance during the period. An overweight in Boston Scientific, an American medical technology company, as well as positions in Mastercard, an American payments company and Primo Brands, an American-Canadian beverage company, also detracted from the Fund’s relative performance during the period. |
| Performance Past Does Not Indicate Future [Text] |
The Fund's past performance is not a good predictor of the Fund's future performance.
|
| Line Graph [Table Text Block] |
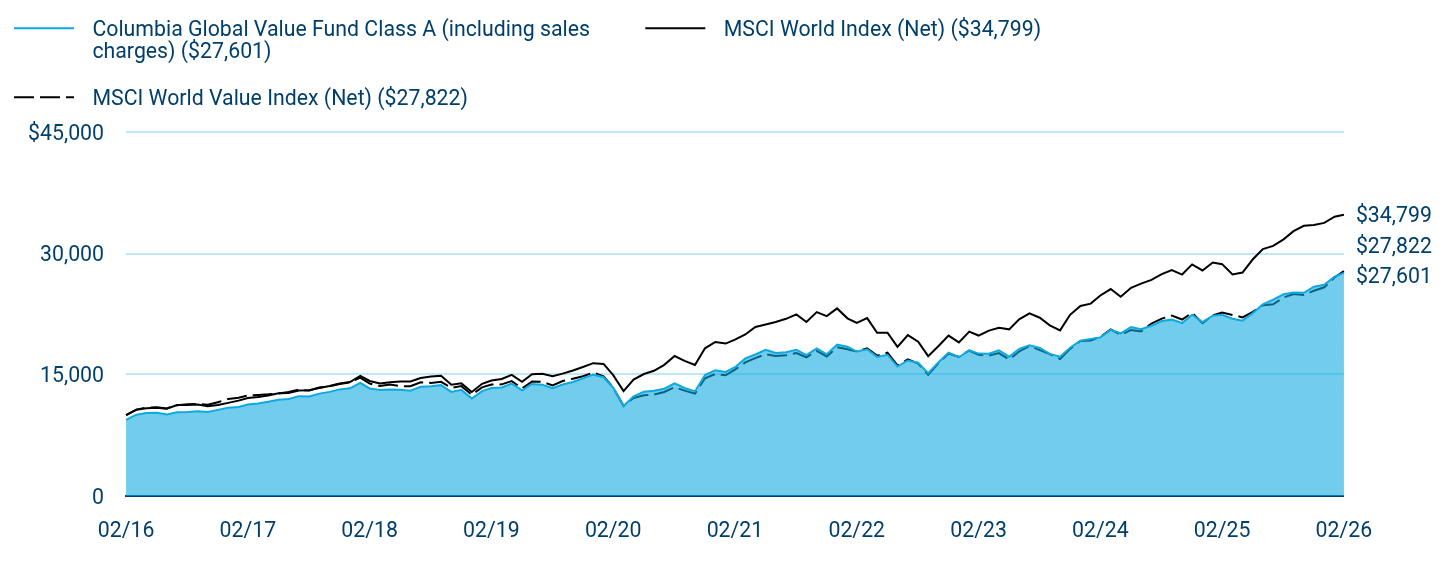
Table Summary
|
Columbia Global Value Fund Class A (including sales charges) ($27,601) |
MSCI World Index (Net) ($34,799) |
MSCI World Value Index (Net) ($27,822) |
02/16 |
$9,424 |
$10,000 |
$10,000 |
03/16 |
$10,054 |
$10,679 |
$10,685 |
04/16 |
$10,261 |
$10,848 |
$10,950 |
05/16 |
$10,297 |
$10,908 |
$10,969 |
06/16 |
$10,075 |
$10,786 |
$10,836 |
07/16 |
$10,357 |
$11,242 |
$11,241 |
08/16 |
$10,393 |
$11,251 |
$11,346 |
09/16 |
$10,498 |
$11,311 |
$11,376 |
10/16 |
$10,379 |
$11,092 |
$11,288 |
11/16 |
$10,653 |
$11,252 |
$11,601 |
12/16 |
$10,930 |
$11,521 |
$11,999 |
01/17 |
$11,004 |
$11,799 |
$12,159 |
02/17 |
$11,317 |
$12,126 |
$12,442 |
03/17 |
$11,452 |
$12,255 |
$12,508 |
04/17 |
$11,665 |
$12,437 |
$12,577 |
05/17 |
$11,914 |
$12,700 |
$12,687 |
06/17 |
$12,001 |
$12,749 |
$12,860 |
07/17 |
$12,353 |
$13,054 |
$13,150 |
08/17 |
$12,307 |
$13,072 |
$13,042 |
09/17 |
$12,666 |
$13,366 |
$13,436 |
10/17 |
$12,880 |
$13,618 |
$13,572 |
11/17 |
$13,188 |
$13,913 |
$13,855 |
12/17 |
$13,326 |
$14,102 |
$14,051 |
01/18 |
$13,991 |
$14,846 |
$14,650 |
02/18 |
$13,307 |
$14,231 |
$13,906 |
03/18 |
$13,103 |
$13,921 |
$13,602 |
04/18 |
$13,179 |
$14,081 |
$13,784 |
05/18 |
$13,141 |
$14,169 |
$13,595 |
06/18 |
$13,035 |
$14,162 |
$13,575 |
07/18 |
$13,521 |
$14,605 |
$14,072 |
08/18 |
$13,570 |
$14,785 |
$13,993 |
09/18 |
$13,713 |
$14,868 |
$14,125 |
10/18 |
$12,873 |
$13,776 |
$13,377 |
11/18 |
$13,127 |
$13,933 |
$13,594 |
12/18 |
$12,055 |
$12,873 |
$12,536 |
01/19 |
$12,980 |
$13,875 |
$13,437 |
02/19 |
$13,360 |
$14,292 |
$13,782 |
03/19 |
$13,422 |
$14,480 |
$13,811 |
04/19 |
$13,907 |
$14,993 |
$14,211 |
05/19 |
$13,072 |
$14,128 |
$13,317 |
06/19 |
$13,855 |
$15,059 |
$14,151 |
07/19 |
$13,758 |
$15,134 |
$14,127 |
08/19 |
$13,338 |
$14,824 |
$13,684 |
09/19 |
$13,786 |
$15,139 |
$14,222 |
10/19 |
$14,112 |
$15,525 |
$14,516 |
11/19 |
$14,557 |
$15,957 |
$14,811 |
12/19 |
$15,010 |
$16,435 |
$15,262 |
01/20 |
$14,694 |
$16,335 |
$14,815 |
02/20 |
$13,409 |
$14,954 |
$13,392 |
03/20 |
$11,126 |
$12,975 |
$11,147 |
04/20 |
$12,340 |
$14,393 |
$12,123 |
05/20 |
$12,908 |
$15,088 |
$12,462 |
06/20 |
$13,013 |
$15,487 |
$12,549 |
07/20 |
$13,274 |
$16,228 |
$12,868 |
08/20 |
$13,939 |
$17,312 |
$13,465 |
09/20 |
$13,366 |
$16,715 |
$13,034 |
10/20 |
$12,937 |
$16,202 |
$12,665 |
11/20 |
$14,950 |
$18,274 |
$14,566 |
12/20 |
$15,563 |
$19,049 |
$15,084 |
01/21 |
$15,340 |
$18,859 |
$14,932 |
02/21 |
$15,935 |
$19,343 |
$15,634 |
03/21 |
$17,022 |
$19,986 |
$16,527 |
04/21 |
$17,507 |
$20,916 |
$17,048 |
05/21 |
$18,091 |
$21,218 |
$17,549 |
06/21 |
$17,693 |
$21,534 |
$17,306 |
07/21 |
$17,772 |
$21,920 |
$17,411 |
08/21 |
$18,088 |
$22,465 |
$17,694 |
09/21 |
$17,423 |
$21,533 |
$17,160 |
10/21 |
$18,257 |
$22,752 |
$17,940 |
11/21 |
$17,529 |
$22,254 |
$17,260 |
12/21 |
$18,739 |
$23,205 |
$18,395 |
01/22 |
$18,462 |
$21,977 |
$18,163 |
02/22 |
$17,867 |
$21,421 |
$17,866 |
03/22 |
$18,156 |
$22,009 |
$18,275 |
04/22 |
$17,212 |
$20,181 |
$17,365 |
05/22 |
$17,476 |
$20,196 |
$17,725 |
06/22 |
$16,016 |
$18,446 |
$16,158 |
07/22 |
$16,769 |
$19,911 |
$16,896 |
08/22 |
$16,488 |
$19,079 |
$16,376 |
09/22 |
$15,190 |
$17,305 |
$14,987 |
10/22 |
$16,555 |
$18,548 |
$16,440 |
11/22 |
$17,741 |
$19,837 |
$17,629 |
12/22 |
$17,167 |
$18,995 |
$17,195 |
01/23 |
$18,020 |
$20,339 |
$17,998 |
02/23 |
$17,616 |
$19,850 |
$17,472 |
03/23 |
$17,592 |
$20,463 |
$17,353 |
04/23 |
$18,027 |
$20,822 |
$17,685 |
05/23 |
$17,231 |
$20,614 |
$16,873 |
06/23 |
$18,208 |
$21,861 |
$17,879 |
07/23 |
$18,656 |
$22,595 |
$18,566 |
08/23 |
$18,317 |
$22,056 |
$18,053 |
09/23 |
$17,574 |
$21,104 |
$17,543 |
10/23 |
$17,232 |
$20,492 |
$16,944 |
11/23 |
$18,334 |
$22,413 |
$18,195 |
12/23 |
$19,224 |
$23,513 |
$19,175 |
01/24 |
$19,432 |
$23,796 |
$19,224 |
02/24 |
$19,623 |
$24,804 |
$19,689 |
03/24 |
$20,545 |
$25,601 |
$20,611 |
04/24 |
$20,128 |
$24,651 |
$19,911 |
05/24 |
$20,897 |
$25,751 |
$20,543 |
06/24 |
$20,625 |
$26,275 |
$20,363 |
07/24 |
$21,062 |
$26,738 |
$21,335 |
08/24 |
$21,649 |
$27,445 |
$21,940 |
09/24 |
$21,817 |
$27,948 |
$22,312 |
10/24 |
$21,395 |
$27,393 |
$21,830 |
11/24 |
$22,425 |
$28,650 |
$22,670 |
12/24 |
$21,505 |
$27,903 |
$21,374 |
01/25 |
$22,316 |
$28,888 |
$22,337 |
02/25 |
$22,421 |
$28,680 |
$22,687 |
03/25 |
$21,921 |
$27,403 |
$22,403 |
04/25 |
$21,691 |
$27,647 |
$22,097 |
05/25 |
$22,645 |
$29,283 |
$22,773 |
06/25 |
$23,698 |
$30,547 |
$23,608 |
07/25 |
$24,291 |
$30,940 |
$23,708 |
08/25 |
$24,956 |
$31,747 |
$24,558 |
09/25 |
$25,166 |
$32,768 |
$24,984 |
10/25 |
$25,129 |
$33,424 |
$24,862 |
11/25 |
$25,888 |
$33,519 |
$25,387 |
12/25 |
$26,122 |
$33,789 |
$25,818 |
01/26 |
$27,134 |
$34,546 |
$27,030 |
02/26 |
$27,601 |
$34,799 |
$27,822 |
|
| Average Annual Return [Table Text Block] |
Table Summary
Average Annual Total Returns (%) |
1 year |
5 years |
10 years |
Class A (excluding sales charges) |
23.10 |
11.61 |
11.34 |
Class A (including sales charges) |
15.99 |
10.29 |
10.69 |
MSCI World Index (Net) |
21.33 |
12.46 |
13.28 |
MSCI World Value Index (Net) |
22.63 |
12.22 |
10.77 | |
| No Deduction of Taxes [Text Block] |
Performance does not reflect the deduction of taxes that a shareholder may pay on fund distributions or on the redemptions of fund shares.
|
| Updated Performance Information Location [Text Block] |
columbiathreadneedleus.com/investment-products/mutual-funds
|
| AssetsNet |
$ 885,794,888
|
| Holdings Count | Holding |
84
|
| Advisory Fees Paid, Amount |
$ 5,788,406
|
| InvestmentCompanyPortfolioTurnover |
63.00%
|
| Additional Fund Statistics [Text Block] |
Table Summary
Fund net assets |
$885,794,888 |
Total number of portfolio holdings |
84 |
Management services fees (represents 0.70% of Fund average net assets) |
$5,788,406 |
Portfolio turnover for the reporting period |
63% | |
| Holdings [Text Block] |
Table Summary
United States |
72.6% |
|
Japan |
6.8% |
|
Australia |
3.1% |
|
Switzerland |
2.4% |
|
United Kingdom |
2.3% |
|
France |
2.2% |
|
Hong Kong |
1.7% |
|
United Arab Emirates |
1.5% |
|
Greece |
1.4% |
|
Singapore |
1.4% |
|
Other |
4.4% |
|
Table Summary
Financials |
24.7% |
Communication Services |
11.1% |
Consumer Discretionary |
10.2% |
Health Care |
9.4% |
Industrials |
8.9% |
Information Technology |
8.8% |
Consumer Staples |
8.5% |
Energy |
7.2% |
Utilities |
4.2% |
Real Estate |
3.3% |
Other |
2.9% | |
| Largest Holdings [Text Block] |
Table Summary
Alphabet, Inc., Class C |
5.0% |
Meta Platforms, Inc., Class A |
4.2% |
JPMorgan Chase & Co. |
3.8% |
Shell PLC |
2.7% |
Bank of America Corp. |
2.5% |
Goldman Sachs Group, Inc. (The) |
2.5% |
Citigroup, Inc. |
2.5% |
Walmart, Inc. |
2.2% |
BNP Paribas SA |
2.2% |
Hartford Insurance Group, Inc. (The) |
2.1% | |
| Material Fund Change [Text Block] |
|
| C000097534 |
|
| Shareholder Report [Line Items] |
|
| Fund Name |
Columbia Global Value Fund
|
| Class Name |
Class C
|
| Trading Symbol |
REVCX
|
| Annual or Semi-Annual Statement [Text Block] |
This annual shareholder report contains important information about Columbia Global Value Fund (the Fund) for the period of March 1, 2025 to February 28, 2026.
|
| Additional Information [Text Block] |
You can find additional information about the Fund at columbiathreadneedleus.com/resources/literature. You can also request more information by contacting us at 1-800-345-6611.
|
| Additional Information Phone Number |
1-800-345-6611
|
| Additional Information Website |
columbiathreadneedleus.com/resources/literature
|
| Expenses [Text Block] |
What were the Fund costs for the reporting period? (Based on a hypothetical $10,000 investment)
Table Summary
Class |
Cost of a $10,000 investment |
Cost paid as a percentage of a $10,000 investment |
Class C |
$208 |
1.87% | |
| Expenses Paid, Amount |
$ 208
|
| Expense Ratio, Percent |
1.87%
|
| Factors Affecting Performance [Text Block] |
Management's Discussion of Fund Performance The performance of Class C shares for the period presented is shown in the Average Annual Total Returns table. Top Performance ContributorsStock selection | Selections in the financials, consumer discretionary and materials sectors boosted the Fund’s relative performance during the annual period. Allocations | Smaller allocations to the health care, consumer staples and real estate sectors buoyed Fund relative performance during the annual period. Individual holdings | Positions in Northern Star Resources, an Australian gold miner; Cameco, a Canadian uranium miner; Youngone, a Korean outerwear company; and Paladin Energy, an Australian uranium miner, were top contributors to the Fund’s relative performance during the period. Not owning UnitedHealth Group, an American health insurer, also added to the Fund’s relative performance during the period. Top Performance DetractorsStock selection | Selections in the industrials, information technology and utilities sectors hurt the Fund’s relative performance during the annual period. Allocations | A larger weighting in the consumer discretionary sector and smaller weightings in the materials and industrials sectors detracted from relative Fund performance during the annual period. Individual holdings | Fund underweights in Micron Technology, an American semiconductor company, and Oracle, an American technology company, were top detractors from the Fund’s relative performance during the period. An overweight in Boston Scientific, an American medical technology company, as well as positions in Mastercard, an American payments company and Primo Brands, an American-Canadian beverage company, also detracted from the Fund’s relative performance during the period. |
| Performance Past Does Not Indicate Future [Text] |
The Fund's past performance is not a good predictor of the Fund's future performance.
|
| Line Graph [Table Text Block] |
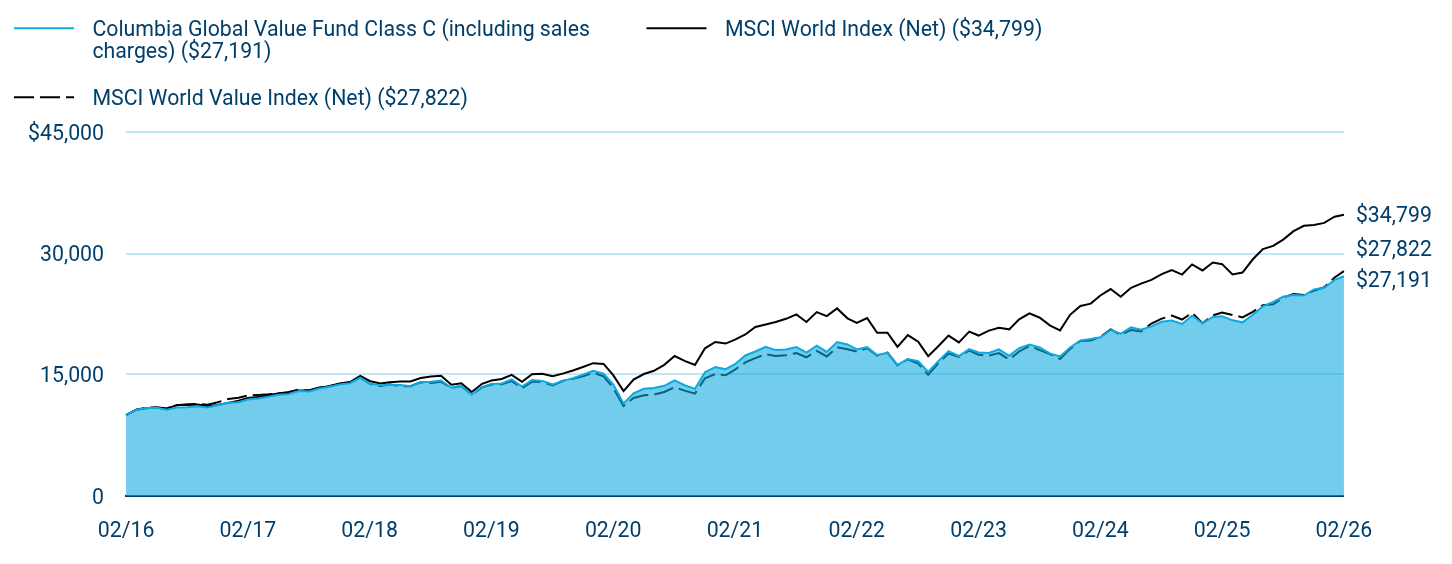
Table Summary
|
Columbia Global Value Fund Class C (including sales charges) ($27,191) |
MSCI World Index (Net) ($34,799) |
MSCI World Value Index (Net) ($27,822) |
02/16 |
$10,000 |
$10,000 |
$10,000 |
03/16 |
$10,666 |
$10,679 |
$10,685 |
04/16 |
$10,879 |
$10,848 |
$10,950 |
05/16 |
$10,908 |
$10,908 |
$10,969 |
06/16 |
$10,668 |
$10,786 |
$10,836 |
07/16 |
$10,960 |
$11,242 |
$11,241 |
08/16 |
$10,989 |
$11,251 |
$11,346 |
09/16 |
$11,090 |
$11,311 |
$11,376 |
10/16 |
$10,963 |
$11,092 |
$11,288 |
11/16 |
$11,246 |
$11,252 |
$11,601 |
12/16 |
$11,539 |
$11,521 |
$11,999 |
01/17 |
$11,598 |
$11,799 |
$12,159 |
02/17 |
$11,932 |
$12,126 |
$12,442 |
03/17 |
$12,064 |
$12,255 |
$12,508 |
04/17 |
$12,270 |
$12,437 |
$12,577 |
05/17 |
$12,526 |
$12,700 |
$12,687 |
06/17 |
$12,615 |
$12,749 |
$12,860 |
07/17 |
$12,979 |
$13,054 |
$13,150 |
08/17 |
$12,920 |
$13,072 |
$13,042 |
09/17 |
$13,287 |
$13,366 |
$13,436 |
10/17 |
$13,504 |
$13,618 |
$13,572 |
11/17 |
$13,810 |
$13,913 |
$13,855 |
12/17 |
$13,950 |
$14,102 |
$14,051 |
01/18 |
$14,634 |
$14,846 |
$14,650 |
02/18 |
$13,920 |
$14,231 |
$13,906 |
03/18 |
$13,699 |
$13,921 |
$13,602 |
04/18 |
$13,768 |
$14,081 |
$13,784 |
05/18 |
$13,718 |
$14,169 |
$13,595 |
06/18 |
$13,590 |
$14,162 |
$13,575 |
07/18 |
$14,092 |
$14,605 |
$14,072 |
08/18 |
$14,133 |
$14,785 |
$13,993 |
09/18 |
$14,279 |
$14,868 |
$14,125 |
10/18 |
$13,395 |
$13,776 |
$13,377 |
11/18 |
$13,652 |
$13,933 |
$13,594 |
12/18 |
$12,524 |
$12,873 |
$12,536 |
01/19 |
$13,476 |
$13,875 |
$13,437 |
02/19 |
$13,866 |
$14,292 |
$13,782 |
03/19 |
$13,918 |
$14,480 |
$13,811 |
04/19 |
$14,417 |
$14,993 |
$14,211 |
05/19 |
$13,538 |
$14,128 |
$13,317 |
06/19 |
$14,345 |
$15,059 |
$14,151 |
07/19 |
$14,243 |
$15,134 |
$14,127 |
08/19 |
$13,791 |
$14,824 |
$13,684 |
09/19 |
$14,246 |
$15,139 |
$14,222 |
10/19 |
$14,564 |
$15,525 |
$14,516 |
11/19 |
$15,019 |
$15,957 |
$14,811 |
12/19 |
$15,476 |
$16,435 |
$15,262 |
01/20 |
$15,146 |
$16,335 |
$14,815 |
02/20 |
$13,812 |
$14,954 |
$13,392 |
03/20 |
$11,451 |
$12,975 |
$11,147 |
04/20 |
$12,695 |
$14,393 |
$12,123 |
05/20 |
$13,264 |
$15,088 |
$12,462 |
06/20 |
$13,374 |
$15,487 |
$12,549 |
07/20 |
$13,634 |
$16,228 |
$12,868 |
08/20 |
$14,302 |
$17,312 |
$13,465 |
09/20 |
$13,703 |
$16,715 |
$13,034 |
10/20 |
$13,257 |
$16,202 |
$12,665 |
11/20 |
$15,315 |
$18,274 |
$14,566 |
12/20 |
$15,939 |
$19,049 |
$15,084 |
01/21 |
$15,694 |
$18,859 |
$14,932 |
02/21 |
$16,300 |
$19,343 |
$15,634 |
03/21 |
$17,387 |
$19,986 |
$16,527 |
04/21 |
$17,877 |
$20,916 |
$17,048 |
05/21 |
$18,457 |
$21,218 |
$17,549 |
06/21 |
$18,051 |
$21,534 |
$17,306 |
07/21 |
$18,119 |
$21,920 |
$17,411 |
08/21 |
$18,419 |
$22,465 |
$17,694 |
09/21 |
$17,736 |
$21,533 |
$17,160 |
10/21 |
$18,586 |
$22,752 |
$17,940 |
11/21 |
$17,819 |
$22,254 |
$17,260 |
12/21 |
$19,034 |
$23,205 |
$18,395 |
01/22 |
$18,747 |
$21,977 |
$18,163 |
02/22 |
$18,132 |
$21,421 |
$17,866 |
03/22 |
$18,410 |
$22,009 |
$18,275 |
04/22 |
$17,435 |
$20,181 |
$17,365 |
05/22 |
$17,708 |
$20,196 |
$17,725 |
06/22 |
$16,224 |
$18,446 |
$16,158 |
07/22 |
$16,955 |
$19,911 |
$16,896 |
08/22 |
$16,666 |
$19,079 |
$16,376 |
09/22 |
$15,343 |
$17,305 |
$14,987 |
10/22 |
$16,717 |
$18,548 |
$16,440 |
11/22 |
$17,908 |
$19,837 |
$17,629 |
12/22 |
$17,315 |
$18,995 |
$17,195 |
01/23 |
$18,161 |
$20,339 |
$17,998 |
02/23 |
$17,746 |
$19,850 |
$17,472 |
03/23 |
$17,702 |
$20,463 |
$17,353 |
04/23 |
$18,133 |
$20,822 |
$17,685 |
05/23 |
$17,332 |
$20,614 |
$16,873 |
06/23 |
$18,300 |
$21,861 |
$17,879 |
07/23 |
$18,727 |
$22,595 |
$18,566 |
08/23 |
$18,379 |
$22,056 |
$18,053 |
09/23 |
$17,631 |
$21,104 |
$17,543 |
10/23 |
$17,266 |
$20,492 |
$16,944 |
11/23 |
$18,377 |
$22,413 |
$18,195 |
12/23 |
$19,236 |
$23,513 |
$19,175 |
01/24 |
$19,432 |
$23,796 |
$19,224 |
02/24 |
$19,627 |
$24,804 |
$19,689 |
03/24 |
$20,530 |
$25,601 |
$20,611 |
04/24 |
$20,089 |
$24,651 |
$19,911 |
05/24 |
$20,857 |
$25,751 |
$20,543 |
06/24 |
$20,574 |
$26,275 |
$20,363 |
07/24 |
$20,984 |
$26,738 |
$21,335 |
08/24 |
$21,548 |
$27,445 |
$21,940 |
09/24 |
$21,712 |
$27,948 |
$22,312 |
10/24 |
$21,283 |
$27,393 |
$21,830 |
11/24 |
$22,295 |
$28,650 |
$22,670 |
12/24 |
$21,351 |
$27,903 |
$21,374 |
01/25 |
$22,156 |
$28,888 |
$22,337 |
02/25 |
$22,246 |
$28,680 |
$22,687 |
03/25 |
$21,732 |
$27,403 |
$22,403 |
04/25 |
$21,482 |
$27,647 |
$22,097 |
05/25 |
$22,413 |
$29,283 |
$22,773 |
06/25 |
$23,455 |
$30,547 |
$23,608 |
07/25 |
$24,019 |
$30,940 |
$23,708 |
08/25 |
$24,674 |
$31,747 |
$24,558 |
09/25 |
$24,876 |
$32,768 |
$24,984 |
10/25 |
$24,803 |
$33,424 |
$24,862 |
11/25 |
$25,551 |
$33,519 |
$25,387 |
12/25 |
$25,756 |
$33,789 |
$25,818 |
01/26 |
$26,739 |
$34,546 |
$27,030 |
02/26 |
$27,191 |
$34,799 |
$27,822 |
|
| Average Annual Return [Table Text Block] |
Table Summary
Average Annual Total Returns (%) |
1 year |
5 years |
10 years |
Class C (excluding sales charges) |
22.23 |
10.78 |
10.52 |
Class C (including sales charges) |
21.23 |
10.78 |
10.52 |
MSCI World Index (Net) |
21.33 |
12.46 |
13.28 |
MSCI World Value Index (Net) |
22.63 |
12.22 |
10.77 | |
| No Deduction of Taxes [Text Block] |
Performance does not reflect the deduction of taxes that a shareholder may pay on fund distributions or on the redemptions of fund shares.
|
| Updated Performance Information Location [Text Block] |
columbiathreadneedleus.com/investment-products/mutual-funds
|
| AssetsNet |
$ 885,794,888
|
| Holdings Count | Holding |
84
|
| Advisory Fees Paid, Amount |
$ 5,788,406
|
| InvestmentCompanyPortfolioTurnover |
63.00%
|
| Additional Fund Statistics [Text Block] |
Table Summary
Fund net assets |
$885,794,888 |
Total number of portfolio holdings |
84 |
Management services fees (represents 0.70% of Fund average net assets) |
$5,788,406 |
Portfolio turnover for the reporting period |
63% | |
| Holdings [Text Block] |
Table Summary
United States |
72.6% |
|
Japan |
6.8% |
|
Australia |
3.1% |
|
Switzerland |
2.4% |
|
United Kingdom |
2.3% |
|
France |
2.2% |
|
Hong Kong |
1.7% |
|
United Arab Emirates |
1.5% |
|
Greece |
1.4% |
|
Singapore |
1.4% |
|
Other |
4.4% |
|
Table Summary
Financials |
24.7% |
Communication Services |
11.1% |
Consumer Discretionary |
10.2% |
Health Care |
9.4% |
Industrials |
8.9% |
Information Technology |
8.8% |
Consumer Staples |
8.5% |
Energy |
7.2% |
Utilities |
4.2% |
Real Estate |
3.3% |
Other |
2.9% | |
| Largest Holdings [Text Block] |
Table Summary
Alphabet, Inc., Class C |
5.0% |
Meta Platforms, Inc., Class A |
4.2% |
JPMorgan Chase & Co. |
3.8% |
Shell PLC |
2.7% |
Bank of America Corp. |
2.5% |
Goldman Sachs Group, Inc. (The) |
2.5% |
Citigroup, Inc. |
2.5% |
Walmart, Inc. |
2.2% |
BNP Paribas SA |
2.2% |
Hartford Insurance Group, Inc. (The) |
2.1% | |
| Material Fund Change [Text Block] |
|
| C000097536 |
|
| Shareholder Report [Line Items] |
|
| Fund Name |
Columbia Global Value Fund
|
| Class Name |
Class R
|
| Trading Symbol |
REVRX
|
| Annual or Semi-Annual Statement [Text Block] |
This annual shareholder report contains important information about Columbia Global Value Fund (the Fund) for the period of March 1, 2025 to February 28, 2026.
|
| Additional Information [Text Block] |
You can find additional information about the Fund at columbiathreadneedleus.com/resources/literature. You can also request more information by contacting us at 1-800-345-6611.
|
| Additional Information Phone Number |
1-800-345-6611
|
| Additional Information Website |
columbiathreadneedleus.com/resources/literature
|
| Expenses [Text Block] |
What were the Fund costs for the reporting period? (Based on a hypothetical $10,000 investment)
Table Summary
Class |
Cost of a $10,000 investment |
Cost paid as a percentage of a $10,000 investment |
Class R |
$153 |
1.37% | |
| Expenses Paid, Amount |
$ 153
|
| Expense Ratio, Percent |
1.37%
|
| Factors Affecting Performance [Text Block] |
Management's Discussion of Fund Performance The performance of Class R shares for the period presented is shown in the Average Annual Total Returns table. Top Performance ContributorsStock selection | Selections in the financials, consumer discretionary and materials sectors boosted the Fund’s relative performance during the annual period. Allocations | Smaller allocations to the health care, consumer staples and real estate sectors buoyed Fund relative performance during the annual period. Individual holdings | Positions in Northern Star Resources, an Australian gold miner; Cameco, a Canadian uranium miner; Youngone, a Korean outerwear company; and Paladin Energy, an Australian uranium miner, were top contributors to the Fund’s relative performance during the period. Not owning UnitedHealth Group, an American health insurer, also added to the Fund’s relative performance during the period. Top Performance DetractorsStock selection | Selections in the industrials, information technology and utilities sectors hurt the Fund’s relative performance during the annual period. Allocations | A larger weighting in the consumer discretionary sector and smaller weightings in the materials and industrials sectors detracted from relative Fund performance during the annual period. Individual holdings | Fund underweights in Micron Technology, an American semiconductor company, and Oracle, an American technology company, were top detractors from the Fund’s relative performance during the period. An overweight in Boston Scientific, an American medical technology company, as well as positions in Mastercard, an American payments company and Primo Brands, an American-Canadian beverage company, also detracted from the Fund’s relative performance during the period. |
| Performance Past Does Not Indicate Future [Text] |
The Fund's past performance is not a good predictor of the Fund's future performance.
|
| Line Graph [Table Text Block] |
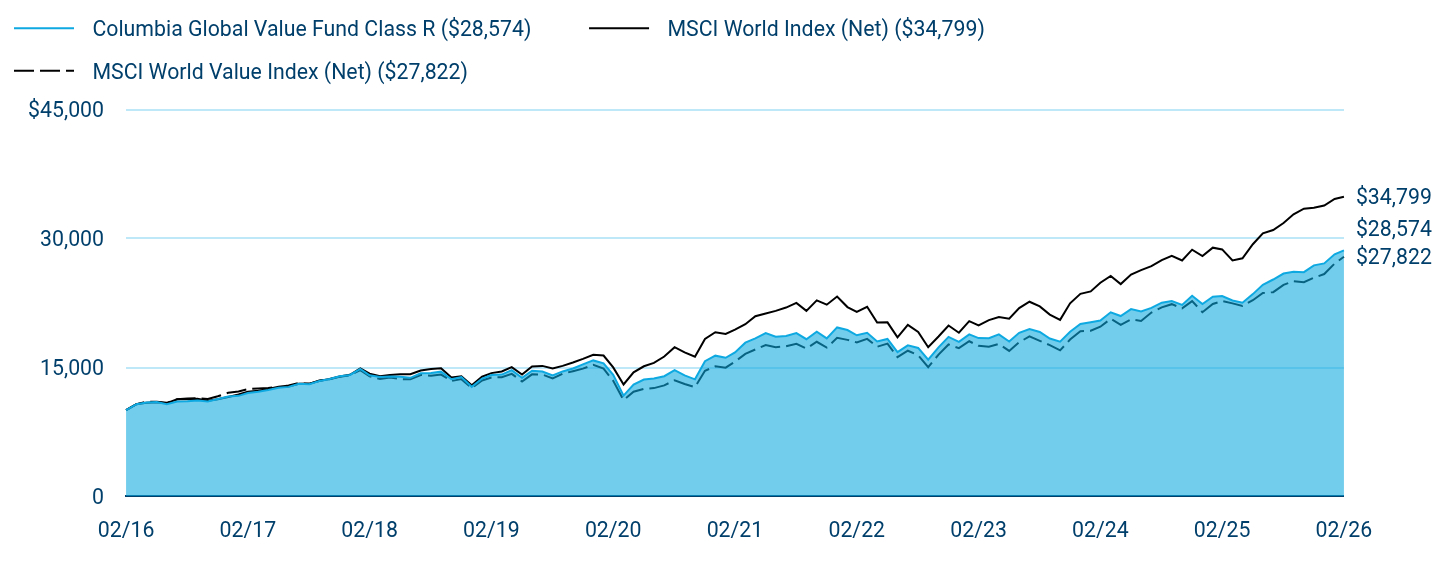
Table Summary
|
Columbia Global Value Fund Class R ($28,574) |
MSCI World Index (Net) ($34,799) |
MSCI World Value Index (Net) ($27,822) |
02/16 |
$10,000 |
$10,000 |
$10,000 |
03/16 |
$10,672 |
$10,679 |
$10,685 |
04/16 |
$10,883 |
$10,848 |
$10,950 |
05/16 |
$10,921 |
$10,908 |
$10,969 |
06/16 |
$10,678 |
$10,786 |
$10,836 |
07/16 |
$10,978 |
$11,242 |
$11,241 |
08/16 |
$11,016 |
$11,251 |
$11,346 |
09/16 |
$11,121 |
$11,311 |
$11,376 |
10/16 |
$10,995 |
$11,092 |
$11,288 |
11/16 |
$11,285 |
$11,252 |
$11,601 |
12/16 |
$11,582 |
$11,521 |
$11,999 |
01/17 |
$11,650 |
$11,799 |
$12,159 |
02/17 |
$11,982 |
$12,126 |
$12,442 |
03/17 |
$12,118 |
$12,255 |
$12,508 |
04/17 |
$12,334 |
$12,437 |
$12,577 |
05/17 |
$12,598 |
$12,700 |
$12,687 |
06/17 |
$12,693 |
$12,749 |
$12,860 |
07/17 |
$13,065 |
$13,054 |
$13,150 |
08/17 |
$13,007 |
$13,072 |
$13,042 |
09/17 |
$13,379 |
$13,366 |
$13,436 |
10/17 |
$13,606 |
$13,618 |
$13,572 |
11/17 |
$13,931 |
$13,913 |
$13,855 |
12/17 |
$14,079 |
$14,102 |
$14,051 |
01/18 |
$14,773 |
$14,846 |
$14,650 |
02/18 |
$14,049 |
$14,231 |
$13,906 |
03/18 |
$13,835 |
$13,921 |
$13,602 |
04/18 |
$13,914 |
$14,081 |
$13,784 |
05/18 |
$13,864 |
$14,169 |
$13,595 |
06/18 |
$13,744 |
$14,162 |
$13,575 |
07/18 |
$14,267 |
$14,605 |
$14,072 |
08/18 |
$14,309 |
$14,785 |
$13,993 |
09/18 |
$14,462 |
$14,868 |
$14,125 |
10/18 |
$13,575 |
$13,776 |
$13,377 |
11/18 |
$13,832 |
$13,933 |
$13,594 |
12/18 |
$12,700 |
$12,873 |
$12,536 |
01/19 |
$13,666 |
$13,875 |
$13,437 |
02/19 |
$14,068 |
$14,292 |
$13,782 |
03/19 |
$14,125 |
$14,480 |
$13,811 |
04/19 |
$14,637 |
$14,993 |
$14,211 |
05/19 |
$13,755 |
$14,128 |
$13,317 |
06/19 |
$14,573 |
$15,059 |
$14,151 |
07/19 |
$14,482 |
$15,134 |
$14,127 |
08/19 |
$14,027 |
$14,824 |
$13,684 |
09/19 |
$14,491 |
$15,139 |
$14,222 |
10/19 |
$14,834 |
$15,525 |
$14,516 |
11/19 |
$15,303 |
$15,957 |
$14,811 |
12/19 |
$15,771 |
$16,435 |
$15,262 |
01/20 |
$15,439 |
$16,335 |
$14,815 |
02/20 |
$14,084 |
$14,954 |
$13,392 |
03/20 |
$11,680 |
$12,975 |
$11,147 |
04/20 |
$12,959 |
$14,393 |
$12,123 |
05/20 |
$13,544 |
$15,088 |
$12,462 |
06/20 |
$13,659 |
$15,487 |
$12,549 |
07/20 |
$13,933 |
$16,228 |
$12,868 |
08/20 |
$14,633 |
$17,312 |
$13,465 |
09/20 |
$14,021 |
$16,715 |
$13,034 |
10/20 |
$13,570 |
$16,202 |
$12,665 |
11/20 |
$15,675 |
$18,274 |
$14,566 |
12/20 |
$16,324 |
$19,049 |
$15,084 |
01/21 |
$16,077 |
$18,859 |
$14,932 |
02/21 |
$16,702 |
$19,343 |
$15,634 |
03/21 |
$17,835 |
$19,986 |
$16,527 |
04/21 |
$18,344 |
$20,916 |
$17,048 |
05/21 |
$18,945 |
$21,218 |
$17,549 |
06/21 |
$18,531 |
$21,534 |
$17,306 |
07/21 |
$18,613 |
$21,920 |
$17,411 |
08/21 |
$18,945 |
$22,465 |
$17,694 |
09/21 |
$18,237 |
$21,533 |
$17,160 |
10/21 |
$19,113 |
$22,752 |
$17,940 |
11/21 |
$18,334 |
$22,254 |
$17,260 |
12/21 |
$19,607 |
$23,205 |
$18,395 |
01/22 |
$19,302 |
$21,977 |
$18,163 |
02/22 |
$18,692 |
$21,421 |
$17,866 |
03/22 |
$18,985 |
$22,009 |
$18,275 |
04/22 |
$17,981 |
$20,181 |
$17,365 |
05/22 |
$18,272 |
$20,196 |
$17,725 |
06/22 |
$16,744 |
$18,446 |
$16,158 |
07/22 |
$17,518 |
$19,911 |
$16,896 |
08/22 |
$17,224 |
$19,079 |
$16,376 |
09/22 |
$15,853 |
$17,305 |
$14,987 |
10/22 |
$17,283 |
$18,548 |
$16,440 |
11/22 |
$18,510 |
$19,837 |
$17,629 |
12/22 |
$17,929 |
$18,995 |
$17,195 |
01/23 |
$18,806 |
$20,339 |
$17,998 |
02/23 |
$18,368 |
$19,850 |
$17,472 |
03/23 |
$18,346 |
$20,463 |
$17,353 |
04/23 |
$18,802 |
$20,822 |
$17,685 |
05/23 |
$17,969 |
$20,614 |
$16,873 |
06/23 |
$18,980 |
$21,861 |
$17,879 |
07/23 |
$19,432 |
$22,595 |
$18,566 |
08/23 |
$19,077 |
$22,056 |
$18,053 |
09/23 |
$18,320 |
$21,104 |
$17,543 |
10/23 |
$17,947 |
$20,492 |
$16,944 |
11/23 |
$19,099 |
$22,413 |
$18,195 |
12/23 |
$20,001 |
$23,513 |
$19,175 |
01/24 |
$20,217 |
$23,796 |
$19,224 |
02/24 |
$20,417 |
$24,804 |
$19,689 |
03/24 |
$21,367 |
$25,601 |
$20,611 |
04/24 |
$20,932 |
$24,651 |
$19,911 |
05/24 |
$21,735 |
$25,751 |
$20,543 |
06/24 |
$21,455 |
$26,275 |
$20,363 |
07/24 |
$21,875 |
$26,738 |
$21,335 |
08/24 |
$22,488 |
$27,445 |
$21,940 |
09/24 |
$22,667 |
$27,948 |
$22,312 |
10/24 |
$22,227 |
$27,393 |
$21,830 |
11/24 |
$23,284 |
$28,650 |
$22,670 |
12/24 |
$22,327 |
$27,903 |
$21,374 |
01/25 |
$23,172 |
$28,888 |
$22,337 |
02/25 |
$23,264 |
$28,680 |
$22,687 |
03/25 |
$22,746 |
$27,403 |
$22,403 |
04/25 |
$22,488 |
$27,647 |
$22,097 |
05/25 |
$23,482 |
$29,283 |
$22,773 |
06/25 |
$24,565 |
$30,547 |
$23,608 |
07/25 |
$25,182 |
$30,940 |
$23,708 |
08/25 |
$25,874 |
$31,747 |
$24,558 |
09/25 |
$26,096 |
$32,768 |
$24,984 |
10/25 |
$26,039 |
$33,424 |
$24,862 |
11/25 |
$26,829 |
$33,519 |
$25,387 |
12/25 |
$27,056 |
$33,789 |
$25,818 |
01/26 |
$28,109 |
$34,546 |
$27,030 |
02/26 |
$28,574 |
$34,799 |
$27,822 |
|
| Average Annual Return [Table Text Block] |
Table Summary
Average Annual Total Returns (%) |
1 year |
5 years |
10 years |
Class R |
22.82 |
11.34 |
11.07 |
MSCI World Index (Net) |
21.33 |
12.46 |
13.28 |
MSCI World Value Index (Net) |
22.63 |
12.22 |
10.77 | |
| No Deduction of Taxes [Text Block] |
Performance does not reflect the deduction of taxes that a shareholder may pay on fund distributions or on the redemptions of fund shares.
|
| Updated Performance Information Location [Text Block] |
columbiathreadneedleus.com/investment-products/mutual-funds
|
| AssetsNet |
$ 885,794,888
|
| Holdings Count | Holding |
84
|
| Advisory Fees Paid, Amount |
$ 5,788,406
|
| InvestmentCompanyPortfolioTurnover |
63.00%
|
| Additional Fund Statistics [Text Block] |
Table Summary
Fund net assets |
$885,794,888 |
Total number of portfolio holdings |
84 |
Management services fees (represents 0.70% of Fund average net assets) |
$5,788,406 |
Portfolio turnover for the reporting period |
63% | |
| Holdings [Text Block] |
Table Summary
United States |
72.6% |
|
Japan |
6.8% |
|
Australia |
3.1% |
|
Switzerland |
2.4% |
|
United Kingdom |
2.3% |
|
France |
2.2% |
|
Hong Kong |
1.7% |
|
United Arab Emirates |
1.5% |
|
Greece |
1.4% |
|
Singapore |
1.4% |
|
Other |
4.4% |
|
Table Summary
Financials |
24.7% |
Communication Services |
11.1% |
Consumer Discretionary |
10.2% |
Health Care |
9.4% |
Industrials |
8.9% |
Information Technology |
8.8% |
Consumer Staples |
8.5% |
Energy |
7.2% |
Utilities |
4.2% |
Real Estate |
3.3% |
Other |
2.9% | |
| Largest Holdings [Text Block] |
Table Summary
Alphabet, Inc., Class C |
5.0% |
Meta Platforms, Inc., Class A |
4.2% |
JPMorgan Chase & Co. |
3.8% |
Shell PLC |
2.7% |
Bank of America Corp. |
2.5% |
Goldman Sachs Group, Inc. (The) |
2.5% |
Citigroup, Inc. |
2.5% |
Walmart, Inc. |
2.2% |
BNP Paribas SA |
2.2% |
Hartford Insurance Group, Inc. (The) |
2.1% | |
| Material Fund Change [Text Block] |
|
| C000253700 |
|
| Shareholder Report [Line Items] |
|
| Fund Name |
Columbia Global Value Fund
|
| Class Name |
Class S
|
| Trading Symbol |
CEVAX
|
| Annual or Semi-Annual Statement [Text Block] |
This annual shareholder report contains important information about Columbia Global Value Fund (the Fund) for the period of March 1, 2025 to February 28, 2026.
|
| Additional Information [Text Block] |
You can find additional information about the Fund at columbiathreadneedleus.com/resources/literature. You can also request more information by contacting us at 1-800-345-6611.
|
| Additional Information Phone Number |
1-800-345-6611
|
| Additional Information Website |
columbiathreadneedleus.com/resources/literature
|
| Expenses [Text Block] |
What were the Fund costs for the reporting period? (Based on a hypothetical $10,000 investment)
Table Summary
Class |
Cost of a $10,000 investment |
Cost paid as a percentage of a $10,000 investment |
Class S |
$97 |
0.87% | |
| Expenses Paid, Amount |
$ 97
|
| Expense Ratio, Percent |
0.87%
|
| Factors Affecting Performance [Text Block] |
Management's Discussion of Fund Performance The performance of Class S shares for the period presented is shown in the Average Annual Total Returns table. Top Performance ContributorsStock selection | Selections in the financials, consumer discretionary and materials sectors boosted the Fund’s relative performance during the annual period. Allocations | Smaller allocations to the health care, consumer staples and real estate sectors buoyed Fund relative performance during the annual period. Individual holdings | Positions in Northern Star Resources, an Australian gold miner; Cameco, a Canadian uranium miner; Youngone, a Korean outerwear company; and Paladin Energy, an Australian uranium miner, were top contributors to the Fund’s relative performance during the period. Not owning UnitedHealth Group, an American health insurer, also added to the Fund’s relative performance during the period. Top Performance DetractorsStock selection | Selections in the industrials, information technology and utilities sectors hurt the Fund’s relative performance during the annual period. Allocations | A larger weighting in the consumer discretionary sector and smaller weightings in the materials and industrials sectors detracted from relative Fund performance during the annual period. Individual holdings | Fund underweights in Micron Technology, an American semiconductor company, and Oracle, an American technology company, were top detractors from the Fund’s relative performance during the period. An overweight in Boston Scientific, an American medical technology company, as well as positions in Mastercard, an American payments company and Primo Brands, an American-Canadian beverage company, also detracted from the Fund’s relative performance during the period. |
| Performance Past Does Not Indicate Future [Text] |
The Fund's past performance is not a good predictor of the Fund's future performance.
|
| Line Graph [Table Text Block] |
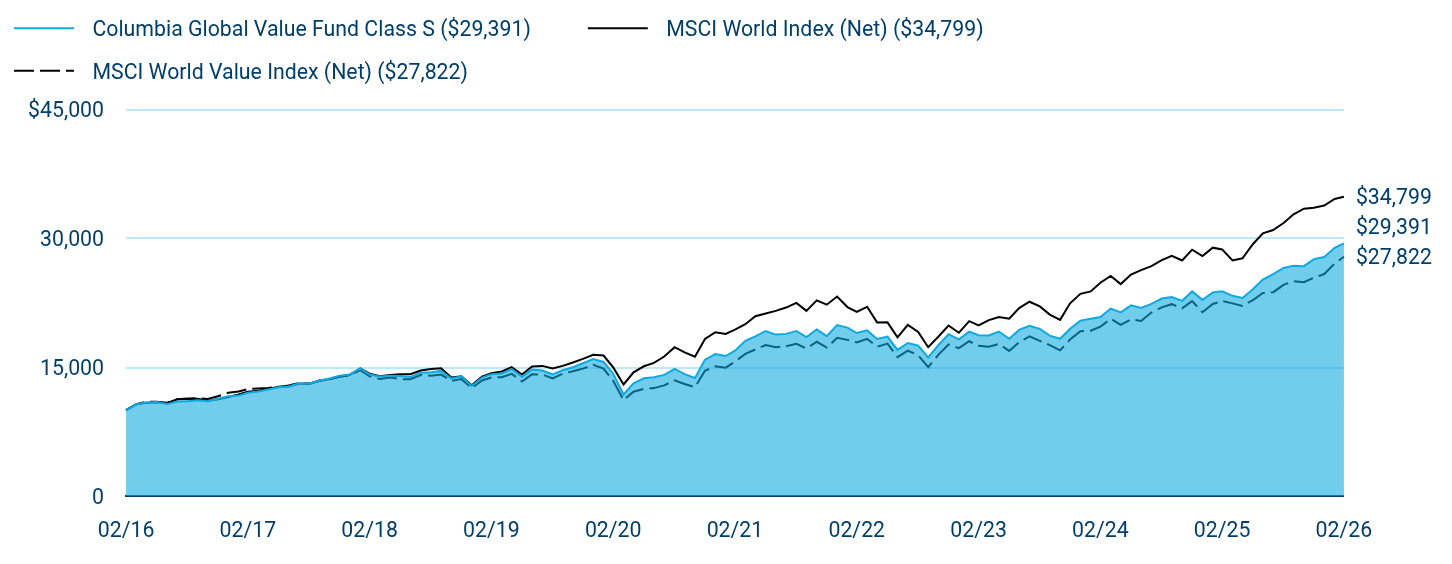
Table Summary
|
Columbia Global Value Fund Class S ($29,391) |
MSCI World Index (Net) ($34,799) |
MSCI World Value Index (Net) ($27,822) |
02/16 |
$10,000 |
$10,000 |
$10,000 |
03/16 |
$10,668 |
$10,679 |
$10,685 |
04/16 |
$10,888 |
$10,848 |
$10,950 |
05/16 |
$10,926 |
$10,908 |
$10,969 |
06/16 |
$10,690 |
$10,786 |
$10,836 |
07/16 |
$10,989 |
$11,242 |
$11,241 |
08/16 |
$11,028 |
$11,251 |
$11,346 |
09/16 |
$11,139 |
$11,311 |
$11,376 |
10/16 |
$11,013 |
$11,092 |
$11,288 |
11/16 |
$11,304 |
$11,252 |
$11,601 |
12/16 |
$11,598 |
$11,521 |
$11,999 |
01/17 |
$11,676 |
$11,799 |
$12,159 |
02/17 |
$12,008 |
$12,126 |
$12,442 |
03/17 |
$12,151 |
$12,255 |
$12,508 |
04/17 |
$12,377 |
$12,437 |
$12,577 |
05/17 |
$12,642 |
$12,700 |
$12,687 |
06/17 |
$12,734 |
$12,749 |
$12,860 |
07/17 |
$13,108 |
$13,054 |
$13,150 |
08/17 |
$13,059 |
$13,072 |
$13,042 |
09/17 |
$13,440 |
$13,366 |
$13,436 |
10/17 |
$13,667 |
$13,618 |
$13,572 |
11/17 |
$13,993 |
$13,913 |
$13,855 |
12/17 |
$14,140 |
$14,102 |
$14,051 |
01/18 |
$14,846 |
$14,846 |
$14,650 |
02/18 |
$14,120 |
$14,231 |
$13,906 |
03/18 |
$13,904 |
$13,921 |
$13,602 |
04/18 |
$13,983 |
$14,081 |
$13,784 |
05/18 |
$13,944 |
$14,169 |
$13,595 |
06/18 |
$13,831 |
$14,162 |
$13,575 |
07/18 |
$14,347 |
$14,605 |
$14,072 |
08/18 |
$14,398 |
$14,785 |
$13,993 |
09/18 |
$14,551 |
$14,868 |
$14,125 |
10/18 |
$13,659 |
$13,776 |
$13,377 |
11/18 |
$13,929 |
$13,933 |
$13,594 |
12/18 |
$12,791 |
$12,873 |
$12,536 |
01/19 |
$13,773 |
$13,875 |
$13,437 |
02/19 |
$14,176 |
$14,292 |
$13,782 |
03/19 |
$14,242 |
$14,480 |
$13,811 |
04/19 |
$14,757 |
$14,993 |
$14,211 |
05/19 |
$13,870 |
$14,128 |
$13,317 |
06/19 |
$14,701 |
$15,059 |
$14,151 |
07/19 |
$14,599 |
$15,134 |
$14,127 |
08/19 |
$14,153 |
$14,824 |
$13,684 |
09/19 |
$14,628 |
$15,139 |
$14,222 |
10/19 |
$14,974 |
$15,525 |
$14,516 |
11/19 |
$15,446 |
$15,957 |
$14,811 |
12/19 |
$15,927 |
$16,435 |
$15,262 |
01/20 |
$15,592 |
$16,335 |
$14,815 |
02/20 |
$14,227 |
$14,954 |
$13,392 |
03/20 |
$11,805 |
$12,975 |
$11,147 |
04/20 |
$13,094 |
$14,393 |
$12,123 |
05/20 |
$13,696 |
$15,088 |
$12,462 |
06/20 |
$13,807 |
$15,487 |
$12,549 |
07/20 |
$14,084 |
$16,228 |
$12,868 |
08/20 |
$14,790 |
$17,312 |
$13,465 |
09/20 |
$14,182 |
$16,715 |
$13,034 |
10/20 |
$13,727 |
$16,202 |
$12,665 |
11/20 |
$15,863 |
$18,274 |
$14,566 |
12/20 |
$16,514 |
$19,049 |
$15,084 |
01/21 |
$16,277 |
$18,859 |
$14,932 |
02/21 |
$16,908 |
$19,343 |
$15,634 |
03/21 |
$18,062 |
$19,986 |
$16,527 |
04/21 |
$18,576 |
$20,916 |
$17,048 |
05/21 |
$19,195 |
$21,218 |
$17,549 |
06/21 |
$18,774 |
$21,534 |
$17,306 |
07/21 |
$18,858 |
$21,920 |
$17,411 |
08/21 |
$19,192 |
$22,465 |
$17,694 |
09/21 |
$18,487 |
$21,533 |
$17,160 |
10/21 |
$19,372 |
$22,752 |
$17,940 |
11/21 |
$18,600 |
$22,254 |
$17,260 |
12/21 |
$19,883 |
$23,205 |
$18,395 |
01/22 |
$19,589 |
$21,977 |
$18,163 |
02/22 |
$18,958 |
$21,421 |
$17,866 |
03/22 |
$19,265 |
$22,009 |
$18,275 |
04/22 |
$18,263 |
$20,181 |
$17,365 |
05/22 |
$18,543 |
$20,196 |
$17,725 |
06/22 |
$16,994 |
$18,446 |
$16,158 |
07/22 |
$17,793 |
$19,911 |
$16,896 |
08/22 |
$17,495 |
$19,079 |
$16,376 |
09/22 |
$16,118 |
$17,305 |
$14,987 |
10/22 |
$17,566 |
$18,548 |
$16,440 |
11/22 |
$18,825 |
$19,837 |
$17,629 |
12/22 |
$18,215 |
$18,995 |
$17,195 |
01/23 |
$19,121 |
$20,339 |
$17,998 |
02/23 |
$18,692 |
$19,850 |
$17,472 |
03/23 |
$18,666 |
$20,463 |
$17,353 |
04/23 |
$19,128 |
$20,822 |
$17,685 |
05/23 |
$18,284 |
$20,614 |
$16,873 |
06/23 |
$19,320 |
$21,861 |
$17,879 |
07/23 |
$19,796 |
$22,595 |
$18,566 |
08/23 |
$19,435 |
$22,056 |
$18,053 |
09/23 |
$18,647 |
$21,104 |
$17,543 |
10/23 |
$18,285 |
$20,492 |
$16,944 |
11/23 |
$19,454 |
$22,413 |
$18,195 |
12/23 |
$20,399 |
$23,513 |
$19,175 |
01/24 |
$20,618 |
$23,796 |
$19,224 |
02/24 |
$20,821 |
$24,804 |
$19,689 |
03/24 |
$21,800 |
$25,601 |
$20,611 |
04/24 |
$21,357 |
$24,651 |
$19,911 |
05/24 |
$22,174 |
$25,751 |
$20,543 |
06/24 |
$21,885 |
$26,275 |
$20,363 |
07/24 |
$22,348 |
$26,738 |
$21,335 |
08/24 |
$22,971 |
$27,445 |
$21,940 |
09/24 |
$23,150 |
$27,948 |
$22,312 |
10/24 |
$22,703 |
$27,393 |
$21,830 |
11/24 |
$23,793 |
$28,650 |
$22,670 |
12/24 |
$22,813 |
$27,903 |
$21,374 |
01/25 |
$23,689 |
$28,888 |
$22,337 |
02/25 |
$23,801 |
$28,680 |
$22,687 |
03/25 |
$23,285 |
$27,403 |
$22,403 |
04/25 |
$23,042 |
$27,647 |
$22,097 |
05/25 |
$24,052 |
$29,283 |
$22,773 |
06/25 |
$25,181 |
$30,547 |
$23,608 |
07/25 |
$25,810 |
$30,940 |
$23,708 |
08/25 |
$26,533 |
$31,747 |
$24,558 |
09/25 |
$26,771 |
$32,768 |
$24,984 |
10/25 |
$26,733 |
$33,424 |
$24,862 |
11/25 |
$27,557 |
$33,519 |
$25,387 |
12/25 |
$27,802 |
$33,789 |
$25,818 |
01/26 |
$28,875 |
$34,546 |
$27,030 |
02/26 |
$29,391 |
$34,799 |
$27,822 |
|
| Average Annual Return [Table Text Block] |
Table Summary
Average Annual Total Returns (%) |
1 year |
5 years |
10 years |
Class SFootnote Reference(a) |
23.49 |
11.69 |
11.38 |
MSCI World Index (Net) |
21.33 |
12.46 |
13.28 |
MSCI World Value Index (Net) |
22.63 |
12.22 |
10.77 | |
| No Deduction of Taxes [Text Block] |
Performance does not reflect the deduction of taxes that a shareholder may pay on fund distributions or on the redemptions of fund shares.
|
| Updated Performance Information Location [Text Block] |
columbiathreadneedleus.com/investment-products/mutual-funds
|
| AssetsNet |
$ 885,794,888
|
| Holdings Count | Holding |
84
|
| Advisory Fees Paid, Amount |
$ 5,788,406
|
| InvestmentCompanyPortfolioTurnover |
63.00%
|
| Additional Fund Statistics [Text Block] |
Table Summary
Fund net assets |
$885,794,888 |
Total number of portfolio holdings |
84 |
Management services fees (represents 0.70% of Fund average net assets) |
$5,788,406 |
Portfolio turnover for the reporting period |
63% | |
| Holdings [Text Block] |
Table Summary
United States |
72.6% |
|
Japan |
6.8% |
|
Australia |
3.1% |
|
Switzerland |
2.4% |
|
United Kingdom |
2.3% |
|
France |
2.2% |
|
Hong Kong |
1.7% |
|
United Arab Emirates |
1.5% |
|
Greece |
1.4% |
|
Singapore |
1.4% |
|
Other |
4.4% |
|
Table Summary
Financials |
24.7% |
Communication Services |
11.1% |
Consumer Discretionary |
10.2% |
Health Care |
9.4% |
Industrials |
8.9% |
Information Technology |
8.8% |
Consumer Staples |
8.5% |
Energy |
7.2% |
Utilities |
4.2% |
Real Estate |
3.3% |
Other |
2.9% | |
| Largest Holdings [Text Block] |
Table Summary
Alphabet, Inc., Class C |
5.0% |
Meta Platforms, Inc., Class A |
4.2% |
JPMorgan Chase & Co. |
3.8% |
Shell PLC |
2.7% |
Bank of America Corp. |
2.5% |
Goldman Sachs Group, Inc. (The) |
2.5% |
Citigroup, Inc. |
2.5% |
Walmart, Inc. |
2.2% |
BNP Paribas SA |
2.2% |
Hartford Insurance Group, Inc. (The) |
2.1% | |
| Material Fund Change [Text Block] |
|
| C000097539 |
|
| Shareholder Report [Line Items] |
|
| Fund Name |
Columbia Global Value Fund
|
| Class Name |
Institutional 2 Class
|
| Trading Symbol |
RSEYX
|
| Annual or Semi-Annual Statement [Text Block] |
This annual shareholder report contains important information about Columbia Global Value Fund (the Fund) for the period of March 1, 2025 to February 28, 2026.
|
| Additional Information [Text Block] |
You can find additional information about the Fund at columbiathreadneedleus.com/resources/literature. You can also request more information by contacting us at 1-800-345-6611.
|
| Additional Information Phone Number |
1-800-345-6611
|
| Additional Information Website |
columbiathreadneedleus.com/resources/literature
|
| Expenses [Text Block] |
What were the Fund costs for the reporting period? (Based on a hypothetical $10,000 investment)
Table Summary
Class |
Cost of a $10,000 investment |
Cost paid as a percentage of a $10,000 investment |
Institutional 2 Class |
$91 |
0.81% | |
| Expenses Paid, Amount |
$ 91
|
| Expense Ratio, Percent |
0.81%
|
| Factors Affecting Performance [Text Block] |
Management's Discussion of Fund Performance The performance of Institutional 2 Class shares for the period presented is shown in the Average Annual Total Returns table. Top Performance ContributorsStock selection | Selections in the financials, consumer discretionary and materials sectors boosted the Fund’s relative performance during the annual period. Allocations | Smaller allocations to the health care, consumer staples and real estate sectors buoyed Fund relative performance during the annual period. Individual holdings | Positions in Northern Star Resources, an Australian gold miner; Cameco, a Canadian uranium miner; Youngone, a Korean outerwear company; and Paladin Energy, an Australian uranium miner, were top contributors to the Fund’s relative performance during the period. Not owning UnitedHealth Group, an American health insurer, also added to the Fund’s relative performance during the period. Top Performance DetractorsStock selection | Selections in the industrials, information technology and utilities sectors hurt the Fund’s relative performance during the annual period. Allocations | A larger weighting in the consumer discretionary sector and smaller weightings in the materials and industrials sectors detracted from relative Fund performance during the annual period. Individual holdings | Fund underweights in Micron Technology, an American semiconductor company, and Oracle, an American technology company, were top detractors from the Fund’s relative performance during the period. An overweight in Boston Scientific, an American medical technology company, as well as positions in Mastercard, an American payments company and Primo Brands, an American-Canadian beverage company, also detracted from the Fund’s relative performance during the period. |
| Performance Past Does Not Indicate Future [Text] |
The Fund's past performance is not a good predictor of the Fund's future performance.
|
| Line Graph [Table Text Block] |

Table Summary
|
Columbia Global Value Fund Institutional 2 Class ($30,260) |
MSCI World Index (Net) ($34,799) |
MSCI World Value Index (Net) ($27,822) |
02/16 |
$10,000 |
$10,000 |
$10,000 |
03/16 |
$10,678 |
$10,679 |
$10,685 |
04/16 |
$10,899 |
$10,848 |
$10,950 |
05/16 |
$10,937 |
$10,908 |
$10,969 |
06/16 |
$10,701 |
$10,786 |
$10,836 |
07/16 |
$11,001 |
$11,242 |
$11,241 |
08/16 |
$11,049 |
$11,251 |
$11,346 |
09/16 |
$11,162 |
$11,311 |
$11,376 |
10/16 |
$11,045 |
$11,092 |
$11,288 |
11/16 |
$11,346 |
$11,252 |
$11,601 |
12/16 |
$11,642 |
$11,521 |
$11,999 |
01/17 |
$11,721 |
$11,799 |
$12,159 |
02/17 |
$12,064 |
$12,126 |
$12,442 |
03/17 |
$12,210 |
$12,255 |
$12,508 |
04/17 |
$12,427 |
$12,437 |
$12,577 |
05/17 |
$12,703 |
$12,700 |
$12,687 |
06/17 |
$12,796 |
$12,749 |
$12,860 |
07/17 |
$13,182 |
$13,054 |
$13,150 |
08/17 |
$13,132 |
$13,072 |
$13,042 |
09/17 |
$13,517 |
$13,366 |
$13,436 |
10/17 |
$13,756 |
$13,618 |
$13,572 |
11/17 |
$14,084 |
$13,913 |
$13,855 |
12/17 |
$14,234 |
$14,102 |
$14,051 |
01/18 |
$14,945 |
$14,846 |
$14,650 |
02/18 |
$14,224 |
$14,231 |
$13,906 |
03/18 |
$14,007 |
$13,921 |
$13,602 |
04/18 |
$14,098 |
$14,081 |
$13,784 |
05/18 |
$14,057 |
$14,169 |
$13,595 |
06/18 |
$13,945 |
$14,162 |
$13,575 |
07/18 |
$14,476 |
$14,605 |
$14,072 |
08/18 |
$14,528 |
$14,785 |
$13,993 |
09/18 |
$14,684 |
$14,868 |
$14,125 |
10/18 |
$13,793 |
$13,776 |
$13,377 |
11/18 |
$14,066 |
$13,933 |
$13,594 |
12/18 |
$12,916 |
$12,873 |
$12,536 |
01/19 |
$13,908 |
$13,875 |
$13,437 |
02/19 |
$14,327 |
$14,292 |
$13,782 |
03/19 |
$14,393 |
$14,480 |
$13,811 |
04/19 |
$14,914 |
$14,993 |
$14,211 |
05/19 |
$14,028 |
$14,128 |
$13,317 |
06/19 |
$14,870 |
$15,059 |
$14,151 |
07/19 |
$14,777 |
$15,134 |
$14,127 |
08/19 |
$14,326 |
$14,824 |
$13,684 |
09/19 |
$14,808 |
$15,139 |
$14,222 |
10/19 |
$15,158 |
$15,525 |
$14,516 |
11/19 |
$15,647 |
$15,957 |
$14,811 |
12/19 |
$16,135 |
$16,435 |
$15,262 |
01/20 |
$15,795 |
$16,335 |
$14,815 |
02/20 |
$14,424 |
$14,954 |
$13,392 |
03/20 |
$11,970 |
$12,975 |
$11,147 |
04/20 |
$13,278 |
$14,393 |
$12,123 |
05/20 |
$13,889 |
$15,088 |
$12,462 |
06/20 |
$14,013 |
$15,487 |
$12,549 |
07/20 |
$14,295 |
$16,228 |
$12,868 |
08/20 |
$15,024 |
$17,312 |
$13,465 |
09/20 |
$14,405 |
$16,715 |
$13,034 |
10/20 |
$13,942 |
$16,202 |
$12,665 |
11/20 |
$16,127 |
$18,274 |
$14,566 |
12/20 |
$16,801 |
$19,049 |
$15,084 |
01/21 |
$16,547 |
$18,859 |
$14,932 |
02/21 |
$17,202 |
$19,343 |
$15,634 |
03/21 |
$18,389 |
$19,986 |
$16,527 |
04/21 |
$18,899 |
$20,916 |
$17,048 |
05/21 |
$19,544 |
$21,218 |
$17,549 |
06/21 |
$19,116 |
$21,534 |
$17,306 |
07/21 |
$19,216 |
$21,920 |
$17,411 |
08/21 |
$19,557 |
$22,465 |
$17,694 |
09/21 |
$18,839 |
$21,533 |
$17,160 |
10/21 |
$19,756 |
$22,752 |
$17,940 |
11/21 |
$18,968 |
$22,254 |
$17,260 |
12/21 |
$20,279 |
$23,205 |
$18,395 |
01/22 |
$19,994 |
$21,977 |
$18,163 |
02/22 |
$19,350 |
$21,421 |
$17,866 |
03/22 |
$19,664 |
$22,009 |
$18,275 |
04/22 |
$18,641 |
$20,181 |
$17,365 |
05/22 |
$18,942 |
$20,196 |
$17,725 |
06/22 |
$17,376 |
$18,446 |
$16,158 |
07/22 |
$18,177 |
$19,911 |
$16,896 |
08/22 |
$17,888 |
$19,079 |
$16,376 |
09/22 |
$16,478 |
$17,305 |
$14,987 |
10/22 |
$17,976 |
$18,548 |
$16,440 |
11/22 |
$19,265 |
$19,837 |
$17,629 |
12/22 |
$18,657 |
$18,995 |
$17,195 |
01/23 |
$19,567 |
$20,339 |
$17,998 |
02/23 |
$19,145 |
$19,850 |
$17,472 |
03/23 |
$19,119 |
$20,463 |
$17,353 |
04/23 |
$19,593 |
$20,822 |
$17,685 |
05/23 |
$18,743 |
$20,614 |
$16,873 |
06/23 |
$19,805 |
$21,861 |
$17,879 |
07/23 |
$20,293 |
$22,595 |
$18,566 |
08/23 |
$19,923 |
$22,056 |
$18,053 |
09/23 |
$19,129 |
$21,104 |
$17,543 |
10/23 |
$18,757 |
$20,492 |
$16,944 |
11/23 |
$19,975 |
$22,413 |
$18,195 |
12/23 |
$20,943 |
$23,513 |
$19,175 |
01/24 |
$21,169 |
$23,796 |
$19,224 |
02/24 |
$21,395 |
$24,804 |
$19,689 |
03/24 |
$22,399 |
$25,601 |
$20,611 |
04/24 |
$21,945 |
$24,651 |
$19,911 |
05/24 |
$22,802 |
$25,751 |
$20,543 |
06/24 |
$22,505 |
$26,275 |
$20,363 |
07/24 |
$22,981 |
$26,738 |
$21,335 |
08/24 |
$23,622 |
$27,445 |
$21,940 |
09/24 |
$23,823 |
$27,948 |
$22,312 |
10/24 |
$23,381 |
$27,393 |
$21,830 |
11/24 |
$24,488 |
$28,650 |
$22,670 |
12/24 |
$23,500 |
$27,903 |
$21,374 |
01/25 |
$24,387 |
$28,888 |
$22,337 |
02/25 |
$24,503 |
$28,680 |
$22,687 |
03/25 |
$23,974 |
$27,403 |
$22,403 |
04/25 |
$23,722 |
$27,647 |
$22,097 |
05/25 |
$24,766 |
$29,283 |
$22,773 |
06/25 |
$25,937 |
$30,547 |
$23,608 |
07/25 |
$26,587 |
$30,940 |
$23,708 |
08/25 |
$27,315 |
$31,747 |
$24,558 |
09/25 |
$27,566 |
$32,768 |
$24,984 |
10/25 |
$27,526 |
$33,424 |
$24,862 |
11/25 |
$28,378 |
$33,519 |
$25,387 |
12/25 |
$28,615 |
$33,789 |
$25,818 |
01/26 |
$29,747 |
$34,546 |
$27,030 |
02/26 |
$30,260 |
$34,799 |
$27,822 |
|
| Average Annual Return [Table Text Block] |
Table Summary
Average Annual Total Returns (%) |
1 year |
5 years |
10 years |
Institutional 2 Class |
23.49 |
11.96 |
11.71 |
MSCI World Index (Net) |
21.33 |
12.46 |
13.28 |
MSCI World Value Index (Net) |
22.63 |
12.22 |
10.77 | |
| No Deduction of Taxes [Text Block] |
Performance does not reflect the deduction of taxes that a shareholder may pay on fund distributions or on the redemptions of fund shares.
|
| Updated Performance Information Location [Text Block] |
columbiathreadneedleus.com/investment-products/mutual-funds
|
| AssetsNet |
$ 885,794,888
|
| Holdings Count | Holding |
84
|
| Advisory Fees Paid, Amount |
$ 5,788,406
|
| InvestmentCompanyPortfolioTurnover |
63.00%
|
| Additional Fund Statistics [Text Block] |
Table Summary
Fund net assets |
$885,794,888 |
Total number of portfolio holdings |
84 |
Management services fees (represents 0.70% of Fund average net assets) |
$5,788,406 |
Portfolio turnover for the reporting period |
63% | |
| Holdings [Text Block] |
Table Summary
United States |
72.6% |
|
Japan |
6.8% |
|
Australia |
3.1% |
|
Switzerland |
2.4% |
|
United Kingdom |
2.3% |
|
France |
2.2% |
|
Hong Kong |
1.7% |
|
United Arab Emirates |
1.5% |
|
Greece |
1.4% |
|
Singapore |
1.4% |
|
Other |
4.4% |
|
Table Summary
Financials |
24.7% |
Communication Services |
11.1% |
Consumer Discretionary |
10.2% |
Health Care |
9.4% |
Industrials |
8.9% |
Information Technology |
8.8% |
Consumer Staples |
8.5% |
Energy |
7.2% |
Utilities |
4.2% |
Real Estate |
3.3% |
Other |
2.9% | |
| Largest Holdings [Text Block] |
Table Summary
Alphabet, Inc., Class C |
5.0% |
Meta Platforms, Inc., Class A |
4.2% |
JPMorgan Chase & Co. |
3.8% |
Shell PLC |
2.7% |
Bank of America Corp. |
2.5% |
Goldman Sachs Group, Inc. (The) |
2.5% |
Citigroup, Inc. |
2.5% |
Walmart, Inc. |
2.2% |
BNP Paribas SA |
2.2% |
Hartford Insurance Group, Inc. (The) |
2.1% | |
| Material Fund Change [Text Block] |
|
| C000121787 |
|
| Shareholder Report [Line Items] |
|
| Fund Name |
Columbia Global Value Fund
|
| Class Name |
Institutional 3 Class
|
| Trading Symbol |
CEVYX
|
| Annual or Semi-Annual Statement [Text Block] |
This annual shareholder report contains important information about Columbia Global Value Fund (the Fund) for the period of March 1, 2025 to February 28, 2026.
|
| Additional Information [Text Block] |
You can find additional information about the Fund at columbiathreadneedleus.com/resources/literature. You can also request more information by contacting us at 1-800-345-6611.
|
| Additional Information Phone Number |
1-800-345-6611
|
| Additional Information Website |
columbiathreadneedleus.com/resources/literature
|
| Expenses [Text Block] |
What were the Fund costs for the reporting period? (Based on a hypothetical $10,000 investment)
Table Summary
Class |
Cost of a $10,000 investment |
Cost paid as a percentage of a $10,000 investment |
Institutional 3 Class |
$86 |
0.77% | |
| Expenses Paid, Amount |
$ 86
|
| Expense Ratio, Percent |
0.77%
|
| Factors Affecting Performance [Text Block] |
Management's Discussion of Fund Performance The performance of Institutional 3 Class shares for the period presented is shown in the Average Annual Total Returns table. Top Performance ContributorsStock selection | Selections in the financials, consumer discretionary and materials sectors boosted the Fund’s relative performance during the annual period. Allocations | Smaller allocations to the health care, consumer staples and real estate sectors buoyed Fund relative performance during the annual period. Individual holdings | Positions in Northern Star Resources, an Australian gold miner; Cameco, a Canadian uranium miner; Youngone, a Korean outerwear company; and Paladin Energy, an Australian uranium miner, were top contributors to the Fund’s relative performance during the period. Not owning UnitedHealth Group, an American health insurer, also added to the Fund’s relative performance during the period. Top Performance DetractorsStock selection | Selections in the industrials, information technology and utilities sectors hurt the Fund’s relative performance during the annual period. Allocations | A larger weighting in the consumer discretionary sector and smaller weightings in the materials and industrials sectors detracted from relative Fund performance during the annual period. Individual holdings | Fund underweights in Micron Technology, an American semiconductor company, and Oracle, an American technology company, were top detractors from the Fund’s relative performance during the period. An overweight in Boston Scientific, an American medical technology company, as well as positions in Mastercard, an American payments company and Primo Brands, an American-Canadian beverage company, also detracted from the Fund’s relative performance during the period. |
| Performance Past Does Not Indicate Future [Text] |
The Fund's past performance is not a good predictor of the Fund's future performance.
|
| Line Graph [Table Text Block] |
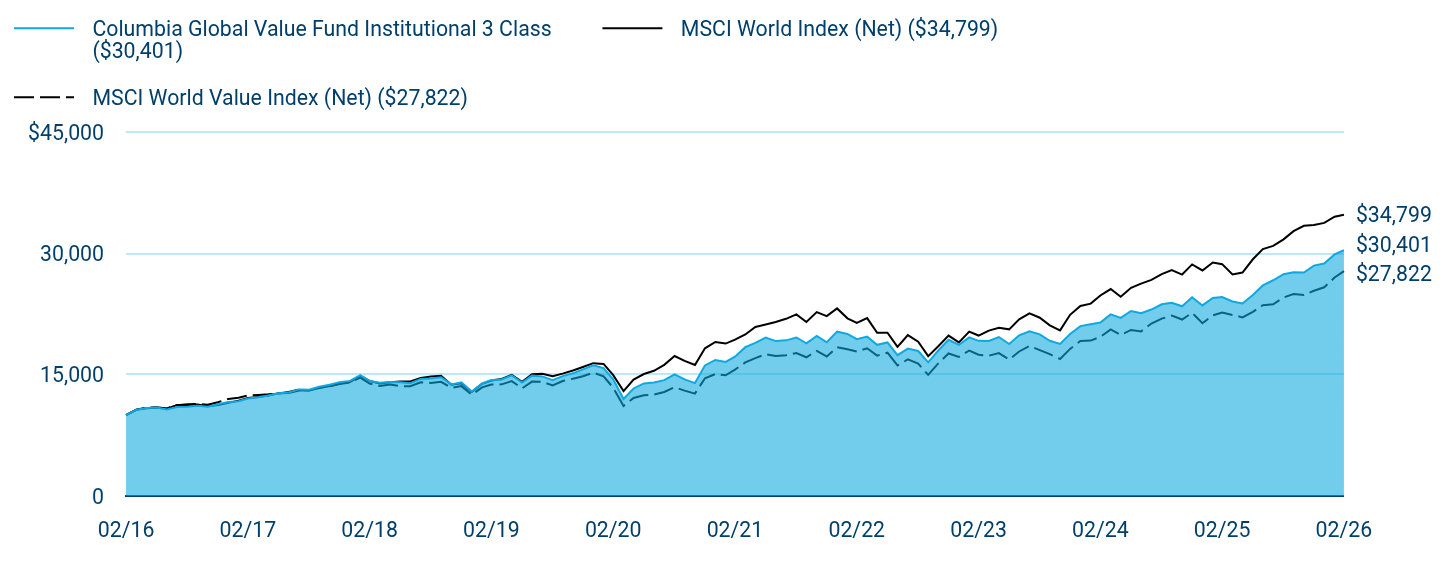
Table Summary
|
Columbia Global Value Fund Institutional 3 Class ($30,401) |
MSCI World Index (Net) ($34,799) |
MSCI World Value Index (Net) ($27,822) |
02/16 |
$10,000 |
$10,000 |
$10,000 |
03/16 |
$10,676 |
$10,679 |
$10,685 |
04/16 |
$10,892 |
$10,848 |
$10,950 |
05/16 |
$10,941 |
$10,908 |
$10,969 |
06/16 |
$10,702 |
$10,786 |
$10,836 |
07/16 |
$10,999 |
$11,242 |
$11,241 |
08/16 |
$11,048 |
$11,251 |
$11,346 |
09/16 |
$11,155 |
$11,311 |
$11,376 |
10/16 |
$11,036 |
$11,092 |
$11,288 |
11/16 |
$11,344 |
$11,252 |
$11,601 |
12/16 |
$11,639 |
$11,521 |
$11,999 |
01/17 |
$11,720 |
$11,799 |
$12,159 |
02/17 |
$12,061 |
$12,126 |
$12,442 |
03/17 |
$12,211 |
$12,255 |
$12,508 |
04/17 |
$12,433 |
$12,437 |
$12,577 |
05/17 |
$12,706 |
$12,700 |
$12,687 |
06/17 |
$12,803 |
$12,749 |
$12,860 |
07/17 |
$13,188 |
$13,054 |
$13,150 |
08/17 |
$13,137 |
$13,072 |
$13,042 |
09/17 |
$13,513 |
$13,366 |
$13,436 |
10/17 |
$13,757 |
$13,618 |
$13,572 |
11/17 |
$14,084 |
$13,913 |
$13,855 |
12/17 |
$14,238 |
$14,102 |
$14,051 |
01/18 |
$14,957 |
$14,846 |
$14,650 |
02/18 |
$14,228 |
$14,231 |
$13,906 |
03/18 |
$14,018 |
$13,921 |
$13,602 |
04/18 |
$14,100 |
$14,081 |
$13,784 |
05/18 |
$14,070 |
$14,169 |
$13,595 |
06/18 |
$13,956 |
$14,162 |
$13,575 |
07/18 |
$14,480 |
$14,605 |
$14,072 |
08/18 |
$14,533 |
$14,785 |
$13,993 |
09/18 |
$14,694 |
$14,868 |
$14,125 |
10/18 |
$13,802 |
$13,776 |
$13,377 |
11/18 |
$14,070 |
$13,933 |
$13,594 |
12/18 |
$12,923 |
$12,873 |
$12,536 |
01/19 |
$13,919 |
$13,875 |
$13,437 |
02/19 |
$14,338 |
$14,292 |
$13,782 |
03/19 |
$14,408 |
$14,480 |
$13,811 |
04/19 |
$14,932 |
$14,993 |
$14,211 |
05/19 |
$14,044 |
$14,128 |
$13,317 |
06/19 |
$14,889 |
$15,059 |
$14,151 |
07/19 |
$14,794 |
$15,134 |
$14,127 |
08/19 |
$14,341 |
$14,824 |
$13,684 |
09/19 |
$14,827 |
$15,139 |
$14,222 |
10/19 |
$15,175 |
$15,525 |
$14,516 |
11/19 |
$15,667 |
$15,957 |
$14,811 |
12/19 |
$16,160 |
$16,435 |
$15,262 |
01/20 |
$15,822 |
$16,335 |
$14,815 |
02/20 |
$14,446 |
$14,954 |
$13,392 |
03/20 |
$11,992 |
$12,975 |
$11,147 |
04/20 |
$13,304 |
$14,393 |
$12,123 |
05/20 |
$13,921 |
$15,088 |
$12,462 |
06/20 |
$14,038 |
$15,487 |
$12,549 |
07/20 |
$14,329 |
$16,228 |
$12,868 |
08/20 |
$15,056 |
$17,312 |
$13,465 |
09/20 |
$14,432 |
$16,715 |
$13,034 |
10/20 |
$13,967 |
$16,202 |
$12,665 |
11/20 |
$16,158 |
$18,274 |
$14,566 |
12/20 |
$16,831 |
$19,049 |
$15,084 |
01/21 |
$16,582 |
$18,859 |
$14,932 |
02/21 |
$17,232 |
$19,343 |
$15,634 |
03/21 |
$18,408 |
$19,986 |
$16,527 |
04/21 |
$18,950 |
$20,916 |
$17,048 |
05/21 |
$19,589 |
$21,218 |
$17,549 |
06/21 |
$19,165 |
$21,534 |
$17,306 |
07/21 |
$19,253 |
$21,920 |
$17,411 |
08/21 |
$19,607 |
$22,465 |
$17,694 |
09/21 |
$18,882 |
$21,533 |
$17,160 |
10/21 |
$19,804 |
$22,752 |
$17,940 |
11/21 |
$19,016 |
$22,254 |
$17,260 |
12/21 |
$20,337 |
$23,205 |
$18,395 |
01/22 |
$20,041 |
$21,977 |
$18,163 |
02/22 |
$19,402 |
$21,421 |
$17,866 |
03/22 |
$19,717 |
$22,009 |
$18,275 |
04/22 |
$18,700 |
$20,181 |
$17,365 |
05/22 |
$18,998 |
$20,196 |
$17,725 |
06/22 |
$17,418 |
$18,446 |
$16,158 |
07/22 |
$18,236 |
$19,911 |
$16,896 |
08/22 |
$17,935 |
$19,079 |
$16,376 |
09/22 |
$16,533 |
$17,305 |
$14,987 |
10/22 |
$18,028 |
$18,548 |
$16,440 |
11/22 |
$19,322 |
$19,837 |
$17,629 |
12/22 |
$18,705 |
$18,995 |
$17,195 |
01/23 |
$19,622 |
$20,339 |
$17,998 |
02/23 |
$19,197 |
$19,850 |
$17,472 |
03/23 |
$19,172 |
$20,463 |
$17,353 |
04/23 |
$19,667 |
$20,822 |
$17,685 |
05/23 |
$18,797 |
$20,614 |
$16,873 |
06/23 |
$19,874 |
$21,861 |
$17,879 |
07/23 |
$20,366 |
$22,595 |
$18,566 |
08/23 |
$19,997 |
$22,056 |
$18,053 |
09/23 |
$19,205 |
$21,104 |
$17,543 |
10/23 |
$18,816 |
$20,492 |
$16,944 |
11/23 |
$20,036 |
$22,413 |
$18,195 |
12/23 |
$21,015 |
$23,513 |
$19,175 |
01/24 |
$21,252 |
$23,796 |
$19,224 |
02/24 |
$21,470 |
$24,804 |
$19,689 |
03/24 |
$22,470 |
$25,601 |
$20,611 |
04/24 |
$22,031 |
$24,651 |
$19,911 |
05/24 |
$22,891 |
$25,751 |
$20,543 |
06/24 |
$22,602 |
$26,275 |
$20,363 |
07/24 |
$23,064 |
$26,738 |
$21,335 |
08/24 |
$23,718 |
$27,445 |
$21,940 |
09/24 |
$23,913 |
$27,948 |
$22,312 |
10/24 |
$23,467 |
$27,393 |
$21,830 |
11/24 |
$24,591 |
$28,650 |
$22,670 |
12/24 |
$23,576 |
$27,903 |
$21,374 |
01/25 |
$24,489 |
$28,888 |
$22,337 |
02/25 |
$24,611 |
$28,680 |
$22,687 |
03/25 |
$24,057 |
$27,403 |
$22,403 |
04/25 |
$23,813 |
$27,647 |
$22,097 |
05/25 |
$24,871 |
$29,283 |
$22,773 |
06/25 |
$26,046 |
$30,547 |
$23,608 |
07/25 |
$26,689 |
$30,940 |
$23,708 |
08/25 |
$27,436 |
$31,747 |
$24,558 |
09/25 |
$27,683 |
$32,768 |
$24,984 |
10/25 |
$27,641 |
$33,424 |
$24,862 |
11/25 |
$28,497 |
$33,519 |
$25,387 |
12/25 |
$28,751 |
$33,789 |
$25,818 |
01/26 |
$29,881 |
$34,546 |
$27,030 |
02/26 |
$30,401 |
$34,799 |
$27,822 |
|
| Average Annual Return [Table Text Block] |
Table Summary
Average Annual Total Returns (%) |
1 year |
5 years |
10 years |
Institutional 3 Class |
23.52 |
12.02 |
11.76 |
MSCI World Index (Net) |
21.33 |
12.46 |
13.28 |
MSCI World Value Index (Net) |
22.63 |
12.22 |
10.77 | |
| No Deduction of Taxes [Text Block] |
Performance does not reflect the deduction of taxes that a shareholder may pay on fund distributions or on the redemptions of fund shares.
|
| Updated Performance Information Location [Text Block] |
columbiathreadneedleus.com/investment-products/mutual-funds
|
| AssetsNet |
$ 885,794,888
|
| Holdings Count | Holding |
84
|
| Advisory Fees Paid, Amount |
$ 5,788,406
|
| InvestmentCompanyPortfolioTurnover |
63.00%
|
| Additional Fund Statistics [Text Block] |
Table Summary
Fund net assets |
$885,794,888 |
Total number of portfolio holdings |
84 |
Management services fees (represents 0.70% of Fund average net assets) |
$5,788,406 |
Portfolio turnover for the reporting period |
63% | |
| Holdings [Text Block] |
Table Summary
United States |
72.6% |
|
Japan |
6.8% |
|
Australia |
3.1% |
|
Switzerland |
2.4% |
|
United Kingdom |
2.3% |
|
France |
2.2% |
|
Hong Kong |
1.7% |
|
United Arab Emirates |
1.5% |
|
Greece |
1.4% |
|
Singapore |
1.4% |
|
Other |
4.4% |
|
Table Summary
Financials |
24.7% |
Communication Services |
11.1% |
Consumer Discretionary |
10.2% |
Health Care |
9.4% |
Industrials |
8.9% |
Information Technology |
8.8% |
Consumer Staples |
8.5% |
Energy |
7.2% |
Utilities |
4.2% |
Real Estate |
3.3% |
Other |
2.9% | |
| Largest Holdings [Text Block] |
Table Summary
Alphabet, Inc., Class C |
5.0% |
Meta Platforms, Inc., Class A |
4.2% |
JPMorgan Chase & Co. |
3.8% |
Shell PLC |
2.7% |
Bank of America Corp. |
2.5% |
Goldman Sachs Group, Inc. (The) |
2.5% |
Citigroup, Inc. |
2.5% |
Walmart, Inc. |
2.2% |
BNP Paribas SA |
2.2% |
Hartford Insurance Group, Inc. (The) |
2.1% | |
| Material Fund Change [Text Block] |
|
| C000097541 |
|
| Shareholder Report [Line Items] |
|
| Fund Name |
Columbia Global Value Fund
|
| Class Name |
Institutional Class
|
| Trading Symbol |
CEVZX
|
| Annual or Semi-Annual Statement [Text Block] |
This annual shareholder report contains important information about Columbia Global Value Fund (the Fund) for the period of March 1, 2025 to February 28, 2026.
|
| Additional Information [Text Block] |
You can find additional information about the Fund at columbiathreadneedleus.com/resources/literature. You can also request more information by contacting us at 1-800-345-6611.
|
| Additional Information Phone Number |
1-800-345-6611
|
| Additional Information Website |
columbiathreadneedleus.com/resources/literature
|
| Expenses [Text Block] |
What were the Fund costs for the reporting period? (Based on a hypothetical $10,000 investment)
Table Summary
Class |
Cost of a $10,000 investment |
Cost paid as a percentage of a $10,000 investment |
Institutional Class |
$97 |
0.87% | |
| Expenses Paid, Amount |
$ 97
|
| Expense Ratio, Percent |
0.87%
|
| Factors Affecting Performance [Text Block] |
Management's Discussion of Fund Performance The performance of Institutional Class shares for the period presented is shown in the Average Annual Total Returns table. Top Performance ContributorsStock selection | Selections in the financials, consumer discretionary and materials sectors boosted the Fund’s relative performance during the annual period. Allocations | Smaller allocations to the health care, consumer staples and real estate sectors buoyed Fund relative performance during the annual period. Individual holdings | Positions in Northern Star Resources, an Australian gold miner; Cameco, a Canadian uranium miner; Youngone, a Korean outerwear company; and Paladin Energy, an Australian uranium miner, were top contributors to the Fund’s relative performance during the period. Not owning UnitedHealth Group, an American health insurer, also added to the Fund’s relative performance during the period. Top Performance DetractorsStock selection | Selections in the industrials, information technology and utilities sectors hurt the Fund’s relative performance during the annual period. Allocations | A larger weighting in the consumer discretionary sector and smaller weightings in the materials and industrials sectors detracted from relative Fund performance during the annual period. Individual holdings | Fund underweights in Micron Technology, an American semiconductor company, and Oracle, an American technology company, were top detractors from the Fund’s relative performance during the period. An overweight in Boston Scientific, an American medical technology company, as well as positions in Mastercard, an American payments company and Primo Brands, an American-Canadian beverage company, also detracted from the Fund’s relative performance during the period. |
| Performance Past Does Not Indicate Future [Text] |
The Fund's past performance is not a good predictor of the Fund's future performance.
|
| Line Graph [Table Text Block] |

Table Summary
|
Columbia Global Value Fund Institutional Class ($30,054) |
MSCI World Index (Net) ($34,799) |
MSCI World Value Index (Net) ($27,822) |
02/16 |
$10,000 |
$10,000 |
$10,000 |
03/16 |
$10,673 |
$10,679 |
$10,685 |
04/16 |
$10,893 |
$10,848 |
$10,950 |
05/16 |
$10,932 |
$10,908 |
$10,969 |
06/16 |
$10,702 |
$10,786 |
$10,836 |
07/16 |
$11,002 |
$11,242 |
$11,241 |
08/16 |
$11,040 |
$11,251 |
$11,346 |
09/16 |
$11,149 |
$11,311 |
$11,376 |
10/16 |
$11,033 |
$11,092 |
$11,288 |
11/16 |
$11,333 |
$11,252 |
$11,601 |
12/16 |
$11,625 |
$11,521 |
$11,999 |
01/17 |
$11,703 |
$11,799 |
$12,159 |
02/17 |
$12,045 |
$12,126 |
$12,442 |
03/17 |
$12,187 |
$12,255 |
$12,508 |
04/17 |
$12,413 |
$12,437 |
$12,577 |
05/17 |
$12,688 |
$12,700 |
$12,687 |
06/17 |
$12,778 |
$12,749 |
$12,860 |
07/17 |
$13,162 |
$13,054 |
$13,150 |
08/17 |
$13,113 |
$13,072 |
$13,042 |
09/17 |
$13,494 |
$13,366 |
$13,436 |
10/17 |
$13,732 |
$13,618 |
$13,572 |
11/17 |
$14,059 |
$13,913 |
$13,855 |
12/17 |
$14,205 |
$14,102 |
$14,051 |
01/18 |
$14,923 |
$14,846 |
$14,650 |
02/18 |
$14,195 |
$14,231 |
$13,906 |
03/18 |
$13,987 |
$13,921 |
$13,602 |
04/18 |
$14,067 |
$14,081 |
$13,784 |
05/18 |
$14,027 |
$14,169 |
$13,595 |
06/18 |
$13,912 |
$14,162 |
$13,575 |
07/18 |
$14,441 |
$14,605 |
$14,072 |
08/18 |
$14,493 |
$14,785 |
$13,993 |
09/18 |
$14,644 |
$14,868 |
$14,125 |
10/18 |
$13,758 |
$13,776 |
$13,377 |
11/18 |
$14,029 |
$13,933 |
$13,594 |
12/18 |
$12,885 |
$12,873 |
$12,536 |
01/19 |
$13,872 |
$13,875 |
$13,437 |
02/19 |
$14,289 |
$14,292 |
$13,782 |
03/19 |
$14,353 |
$14,480 |
$13,811 |
04/19 |
$14,870 |
$14,993 |
$14,211 |
05/19 |
$13,989 |
$14,128 |
$13,317 |
06/19 |
$14,824 |
$15,059 |
$14,151 |
07/19 |
$14,732 |
$15,134 |
$14,127 |
08/19 |
$14,283 |
$14,824 |
$13,684 |
09/19 |
$14,759 |
$15,139 |
$14,222 |
10/19 |
$15,107 |
$15,525 |
$14,516 |
11/19 |
$15,594 |
$15,957 |
$14,811 |
12/19 |
$16,089 |
$16,435 |
$15,262 |
01/20 |
$15,751 |
$16,335 |
$14,815 |
02/20 |
$14,376 |
$14,954 |
$13,392 |
03/20 |
$11,933 |
$12,975 |
$11,147 |
04/20 |
$13,233 |
$14,393 |
$12,123 |
05/20 |
$13,840 |
$15,088 |
$12,462 |
06/20 |
$13,960 |
$15,487 |
$12,549 |
07/20 |
$14,253 |
$16,228 |
$12,868 |
08/20 |
$14,965 |
$17,312 |
$13,465 |
09/20 |
$14,347 |
$16,715 |
$13,034 |
10/20 |
$13,888 |
$16,202 |
$12,665 |
11/20 |
$16,058 |
$18,274 |
$14,566 |
12/20 |
$16,725 |
$19,049 |
$15,084 |
01/21 |
$16,473 |
$18,859 |
$14,932 |
02/21 |
$17,123 |
$19,343 |
$15,634 |
03/21 |
$18,300 |
$19,986 |
$16,527 |
04/21 |
$18,820 |
$20,916 |
$17,048 |
05/21 |
$19,446 |
$21,218 |
$17,549 |
06/21 |
$19,032 |
$21,534 |
$17,306 |
07/21 |
$19,131 |
$21,920 |
$17,411 |
08/21 |
$19,470 |
$22,465 |
$17,694 |
09/21 |
$18,754 |
$21,533 |
$17,160 |
10/21 |
$19,664 |
$22,752 |
$17,940 |
11/21 |
$18,868 |
$22,254 |
$17,260 |
12/21 |
$20,181 |
$23,205 |
$18,395 |
01/22 |
$19,883 |
$21,977 |
$18,163 |
02/22 |
$19,259 |
$21,421 |
$17,866 |
03/22 |
$19,567 |
$22,009 |
$18,275 |
04/22 |
$18,552 |
$20,181 |
$17,365 |
05/22 |
$18,851 |
$20,196 |
$17,725 |
06/22 |
$17,278 |
$18,446 |
$16,158 |
07/22 |
$18,088 |
$19,911 |
$16,896 |
08/22 |
$17,786 |
$19,079 |
$16,376 |
09/22 |
$16,384 |
$17,305 |
$14,987 |
10/22 |
$17,869 |
$18,548 |
$16,440 |
11/22 |
$19,147 |
$19,837 |
$17,629 |
12/22 |
$18,540 |
$18,995 |
$17,195 |
01/23 |
$19,459 |
$20,339 |
$17,998 |
02/23 |
$19,023 |
$19,850 |
$17,472 |
03/23 |
$19,010 |
$20,463 |
$17,353 |
04/23 |
$19,479 |
$20,822 |
$17,685 |
05/23 |
$18,637 |
$20,614 |
$16,873 |
06/23 |
$19,686 |
$21,861 |
$17,879 |
07/23 |
$20,169 |
$22,595 |
$18,566 |
08/23 |
$19,803 |
$22,056 |
$18,053 |
09/23 |
$19,014 |
$21,104 |
$17,543 |
10/23 |
$18,645 |
$20,492 |
$16,944 |
11/23 |
$19,851 |
$22,413 |
$18,195 |
12/23 |
$20,807 |
$23,513 |
$19,175 |
01/24 |
$21,031 |
$23,796 |
$19,224 |
02/24 |
$21,254 |
$24,804 |
$19,689 |
03/24 |
$22,246 |
$25,601 |
$20,611 |
04/24 |
$21,796 |
$24,651 |
$19,911 |
05/24 |
$22,644 |
$25,751 |
$20,543 |
06/24 |
$22,364 |
$26,275 |
$20,363 |
07/24 |
$22,817 |
$26,738 |
$21,335 |
08/24 |
$23,470 |
$27,445 |
$21,940 |
09/24 |
$23,648 |
$27,948 |
$22,312 |
10/24 |
$23,210 |
$27,393 |
$21,830 |
11/24 |
$24,323 |
$28,650 |
$22,670 |
12/24 |
$23,324 |
$27,903 |
$21,374 |
01/25 |
$24,221 |
$28,888 |
$22,337 |
02/25 |
$24,335 |
$28,680 |
$22,687 |
03/25 |
$23,808 |
$27,403 |
$22,403 |
04/25 |
$23,540 |
$27,647 |
$22,097 |
05/25 |
$24,592 |
$29,283 |
$22,773 |
06/25 |
$25,747 |
$30,547 |
$23,608 |
07/25 |
$26,389 |
$30,940 |
$23,708 |
08/25 |
$27,129 |
$31,747 |
$24,558 |
09/25 |
$27,373 |
$32,768 |
$24,984 |
10/25 |
$27,334 |
$33,424 |
$24,862 |
11/25 |
$28,156 |
$33,519 |
$25,387 |
12/25 |
$28,407 |
$33,789 |
$25,818 |
01/26 |
$29,526 |
$34,546 |
$27,030 |
02/26 |
$30,054 |
$34,799 |
$27,822 |
|
| Average Annual Return [Table Text Block] |
Table Summary
Average Annual Total Returns (%) |
1 year |
5 years |
10 years |
Institutional Class |
23.50 |
11.91 |
11.63 |
MSCI World Index (Net) |
21.33 |
12.46 |
13.28 |
MSCI World Value Index (Net) |
22.63 |
12.22 |
10.77 | |
| No Deduction of Taxes [Text Block] |
Performance does not reflect the deduction of taxes that a shareholder may pay on fund distributions or on the redemptions of fund shares.
|
| Updated Performance Information Location [Text Block] |
columbiathreadneedleus.com/investment-products/mutual-funds
|
| AssetsNet |
$ 885,794,888
|
| Holdings Count | Holding |
84
|
| Advisory Fees Paid, Amount |
$ 5,788,406
|
| InvestmentCompanyPortfolioTurnover |
63.00%
|
| Additional Fund Statistics [Text Block] |
Table Summary
Fund net assets |
$885,794,888 |
Total number of portfolio holdings |
84 |
Management services fees (represents 0.70% of Fund average net assets) |
$5,788,406 |
Portfolio turnover for the reporting period |
63% | |
| Holdings [Text Block] |
Table Summary
United States |
72.6% |
|
Japan |
6.8% |
|
Australia |
3.1% |
|
Switzerland |
2.4% |
|
United Kingdom |
2.3% |
|
France |
2.2% |
|
Hong Kong |
1.7% |
|
United Arab Emirates |
1.5% |
|
Greece |
1.4% |
|
Singapore |
1.4% |
|
Other |
4.4% |
|
Table Summary
Financials |
24.7% |
Communication Services |
11.1% |
Consumer Discretionary |
10.2% |
Health Care |
9.4% |
Industrials |
8.9% |
Information Technology |
8.8% |
Consumer Staples |
8.5% |
Energy |
7.2% |
Utilities |
4.2% |
Real Estate |
3.3% |
Other |
2.9% | |
| Largest Holdings [Text Block] |
Table Summary
Alphabet, Inc., Class C |
5.0% |
Meta Platforms, Inc., Class A |
4.2% |
JPMorgan Chase & Co. |
3.8% |
Shell PLC |
2.7% |
Bank of America Corp. |
2.5% |
Goldman Sachs Group, Inc. (The) |
2.5% |
Citigroup, Inc. |
2.5% |
Walmart, Inc. |
2.2% |
BNP Paribas SA |
2.2% |
Hartford Insurance Group, Inc. (The) |
2.1% | |
| Material Fund Change [Text Block] |
|
| C000198586 |
|
| Shareholder Report [Line Items] |
|
| Fund Name |
Columbia Overseas Core Fund
|
| Class Name |
Class A
|
| Trading Symbol |
COSAX
|
| Annual or Semi-Annual Statement [Text Block] |
This annual shareholder report contains important information about Columbia Overseas Core Fund (the Fund) for the period of March 1, 2025 to February 28, 2026.
|
| Additional Information [Text Block] |
You can find additional information about the Fund at columbiathreadneedleus.com/resources/literature. You can also request more information by contacting us at 1-800-345-6611.
|
| Additional Information Phone Number |
1-800-345-6611
|
| Additional Information Website |
columbiathreadneedleus.com/resources/literature
|
| Expenses [Text Block] |
What were the Fund costs for the reporting period? (Based on a hypothetical $10,000 investment)
Table Summary
Class |
Cost of a $10,000 investment |
Cost paid as a percentage of a $10,000 investment |
Class A |
$142 |
1.17% | |
| Expenses Paid, Amount |
$ 142
|
| Expense Ratio, Percent |
1.17%
|
| Factors Affecting Performance [Text Block] |
Management's Discussion of Fund Performance The performance of Class A shares for the period presented is shown in the Average Annual Total Returns table. Top Performance ContributorsStock selection | Selections in the materials, energy and financials sectors boosted the Fund’s relative performance during the annual period. Allocations | A smaller allocation to the communication services sector and larger allocations to the energy and information technology sectors buoyed the Fund’s relative performance during the annual period. Individual holdings | Positions in Samsung Electronics, a Korean technology company; Energy Fuels, an American rare earths and uranium company; Impala Platinum, a South African platinum miner; and an overweight in Northern Star Resources, an Australian gold miner, contributed to the Fund’s relative performance during the annual period. Not owning SAP, a German software company, was also a top contributor to the Fund’s relative performance during the annual period. Top Performance DetractorsStock selection | Selections in the consumer staples, real estate and communication services sectors hurt the Fund’s relative performance most during the annual period. Allocations | Smaller weightings in the industrials and utilities sectors and a larger weighting in the consumer discretionary sector detracted from the Fund’s relative performance during the annual period. Individual holdings | Positions in Flutter Entertainment, an Irish-American gambling company; Primo Brands, a Canadian-American beverage company; and Burford Capital, a litigation finance company, were top detractors from the Fund’s relative performance during the annual period. An overweight in Check Point Software Technologies, an Israeli cybersecurity company, and a zero weight in ASML, a Dutch semiconductor company, were also top detractors from the Fund’s relative performance during the annual period. |
| Performance Past Does Not Indicate Future [Text] |
The Fund's past performance is not a good predictor of the Fund's future performance.
|
| Line Graph [Table Text Block] |
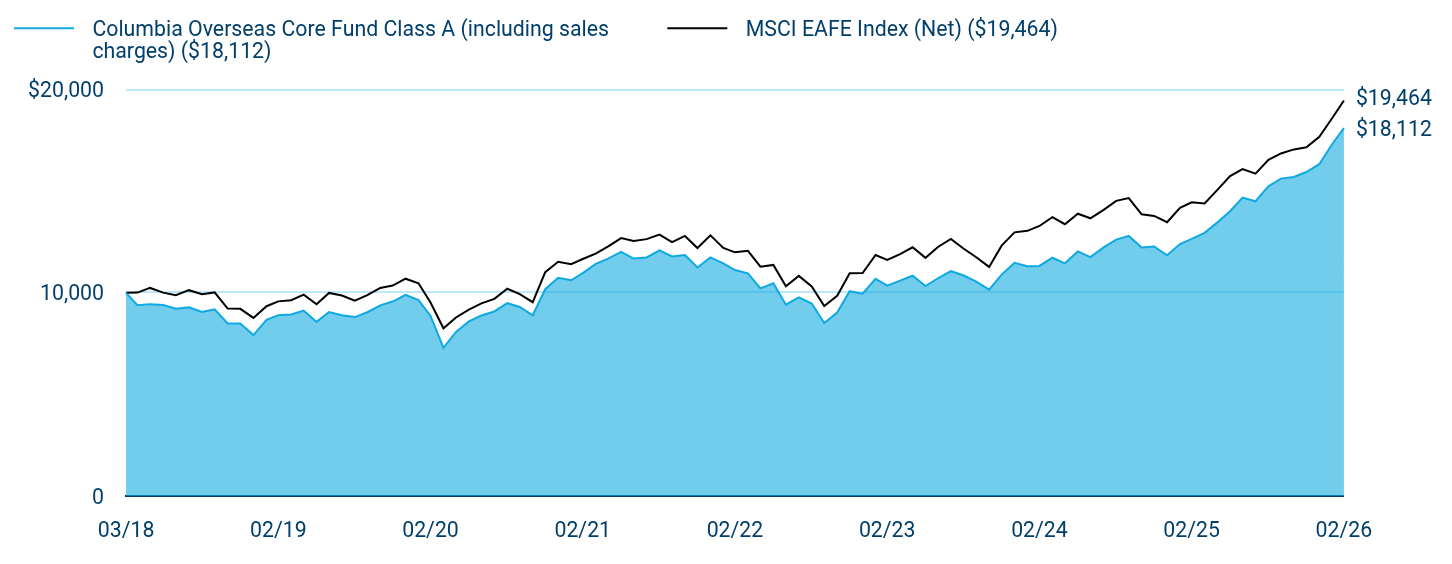
Table Summary
|
Columbia Overseas Core Fund Class A (including sales charges) ($18,112) |
MSCI EAFE Index (Net) ($19,464) |
03/18 |
$10,000 |
$10,000 |
03/18 |
$9,387 |
$10,012 |
04/18 |
$9,444 |
$10,241 |
05/18 |
$9,397 |
$10,010 |
06/18 |
$9,218 |
$9,888 |
07/18 |
$9,284 |
$10,131 |
08/18 |
$9,057 |
$9,936 |
09/18 |
$9,189 |
$10,022 |
10/18 |
$8,492 |
$9,224 |
11/18 |
$8,492 |
$9,213 |
12/18 |
$7,923 |
$8,765 |
01/19 |
$8,674 |
$9,342 |
02/19 |
$8,902 |
$9,580 |
03/19 |
$8,931 |
$9,640 |
04/19 |
$9,130 |
$9,911 |
05/19 |
$8,569 |
$9,435 |
06/19 |
$9,056 |
$9,995 |
07/19 |
$8,893 |
$9,868 |
08/19 |
$8,807 |
$9,612 |
09/19 |
$9,046 |
$9,888 |
10/19 |
$9,381 |
$10,243 |
11/19 |
$9,572 |
$10,359 |
12/19 |
$9,906 |
$10,695 |
01/20 |
$9,639 |
$10,472 |
02/20 |
$8,861 |
$9,525 |
03/20 |
$7,294 |
$8,254 |
04/20 |
$8,072 |
$8,787 |
05/20 |
$8,595 |
$9,170 |
06/20 |
$8,884 |
$9,482 |
07/20 |
$9,083 |
$9,703 |
08/20 |
$9,491 |
$10,202 |
09/20 |
$9,302 |
$9,937 |
10/20 |
$8,894 |
$9,540 |
11/20 |
$10,177 |
$11,019 |
12/20 |
$10,738 |
$11,531 |
01/21 |
$10,617 |
$11,408 |
02/21 |
$10,970 |
$11,664 |
03/21 |
$11,423 |
$11,932 |
04/21 |
$11,685 |
$12,291 |
05/21 |
$12,018 |
$12,692 |
06/21 |
$11,689 |
$12,549 |
07/21 |
$11,741 |
$12,644 |
08/21 |
$12,091 |
$12,867 |
09/21 |
$11,792 |
$12,493 |
10/21 |
$11,864 |
$12,801 |
11/21 |
$11,245 |
$12,205 |
12/21 |
$11,741 |
$12,830 |
01/22 |
$11,447 |
$12,210 |
02/22 |
$11,121 |
$11,994 |
03/22 |
$10,958 |
$12,071 |
04/22 |
$10,219 |
$11,290 |
05/22 |
$10,469 |
$11,375 |
06/22 |
$9,417 |
$10,319 |
07/22 |
$9,781 |
$10,834 |
08/22 |
$9,472 |
$10,319 |
09/22 |
$8,512 |
$9,354 |
10/22 |
$9,030 |
$9,857 |
11/22 |
$10,079 |
$10,967 |
12/22 |
$9,958 |
$10,976 |
01/23 |
$10,686 |
$11,864 |
02/23 |
$10,355 |
$11,617 |
03/23 |
$10,598 |
$11,905 |
04/23 |
$10,841 |
$12,241 |
05/23 |
$10,333 |
$11,723 |
06/23 |
$10,717 |
$12,256 |
07/23 |
$11,065 |
$12,653 |
08/23 |
$10,852 |
$12,168 |
09/23 |
$10,549 |
$11,753 |
10/23 |
$10,156 |
$11,276 |
11/23 |
$10,897 |
$12,323 |
12/23 |
$11,474 |
$12,977 |
01/24 |
$11,313 |
$13,052 |
02/24 |
$11,324 |
$13,291 |
03/24 |
$11,727 |
$13,728 |
04/24 |
$11,451 |
$13,377 |
05/24 |
$12,038 |
$13,895 |
06/24 |
$11,758 |
$13,670 |
07/24 |
$12,222 |
$14,071 |
08/24 |
$12,617 |
$14,529 |
09/24 |
$12,803 |
$14,663 |
10/24 |
$12,234 |
$13,866 |
11/24 |
$12,280 |
$13,787 |
12/24 |
$11,852 |
$13,474 |
01/25 |
$12,403 |
$14,182 |
02/25 |
$12,654 |
$14,457 |
03/25 |
$12,953 |
$14,398 |
04/25 |
$13,456 |
$15,058 |
05/25 |
$14,019 |
$15,747 |
06/25 |
$14,687 |
$16,094 |
07/25 |
$14,508 |
$15,868 |
08/25 |
$15,250 |
$16,544 |
09/25 |
$15,622 |
$16,861 |
10/25 |
$15,706 |
$17,059 |
11/25 |
$15,945 |
$17,165 |
12/25 |
$16,331 |
$17,680 |
01/26 |
$17,326 |
$18,603 |
02/26 |
$18,112 |
$19,464 |
|
| Average Annual Return [Table Text Block] |
Table Summary
Average Annual Total Returns (%) |
1 year |
5 years |
Since Fund Inception |
Class A (excluding sales charges) |
43.13 |
10.55 |
8.52 |
Class A (including sales charges) |
34.96 |
9.25 |
7.72 |
MSCI EAFE Index (Net) |
34.63 |
10.78 |
8.70 | |
| No Deduction of Taxes [Text Block] |
Performance does not reflect the deduction of taxes that a shareholder may pay on fund distributions or on the redemptions of fund shares.
|
| Updated Performance Information Location [Text Block] |
columbiathreadneedleus.com/investment-products/mutual-funds
|
| AssetsNet |
$ 1,021,194,322
|
| Holdings Count | Holding |
128
|
| Advisory Fees Paid, Amount |
$ 7,992,678
|
| InvestmentCompanyPortfolioTurnover |
57.00%
|
| Additional Fund Statistics [Text Block] |
Table Summary
Fund net assets |
$1,021,194,322 |
Total number of portfolio holdings |
128 |
Management services fees (represents 0.84% of Fund average net assets) |
$7,992,678 |
Portfolio turnover for the reporting period |
57% | |
| Holdings [Text Block] |
Table Summary
Japan |
23.3% |
|
United States |
9.8% |
|
Netherlands |
8.0% |
|
United Kingdom |
6.6% |
|
France |
6.6% |
|
Australia |
5.1% |
|
Canada |
4.9% |
|
Italy |
3.1% |
|
Greece |
2.7% |
|
Taiwan |
2.6% |
|
Other |
27.0% |
|
Table Summary
Financials |
19.3% |
Industrials |
14.4% |
Information Technology |
13.9% |
Consumer Discretionary |
9.7% |
Consumer Staples |
9.6% |
Health Care |
9.5% |
Energy |
8.6% |
Materials |
8.1% |
Communication Services |
2.1% |
Utilities |
1.4% |
Other |
1.3% | |
| Largest Holdings [Text Block] |
Table Summary
AstraZeneca PLC |
2.5% |
Northern Star Resources Ltd. |
2.3% |
ING Groep NV |
2.2% |
Taiwan Semiconductor Manufacturing Co., Ltd. |
2.0% |
Primo Brands Corp., Class A |
2.0% |
Powszechna Kasa Oszczednosci Bank Polski SA |
1.9% |
AXA SA |
1.9% |
Shell PLC |
1.8% |
Ping An Insurance Group Co. of China Ltd., Class H |
1.8% |
ASM International NV |
1.8% | |
| Material Fund Change [Text Block] |
|
| C000198590 |
|
| Shareholder Report [Line Items] |
|
| Fund Name |
Columbia Overseas Core Fund
|
| Class Name |
Institutional 2 Class
|
| Trading Symbol |
COSTX
|
| Annual or Semi-Annual Statement [Text Block] |
This annual shareholder report contains important information about Columbia Overseas Core Fund (the Fund) for the period of March 1, 2025 to February 28, 2026.
|
| Additional Information [Text Block] |
You can find additional information about the Fund at columbiathreadneedleus.com/resources/literature. You can also request more information by contacting us at 1-800-345-6611.
|
| Additional Information Phone Number |
1-800-345-6611
|
| Additional Information Website |
columbiathreadneedleus.com/resources/literature
|
| Expenses [Text Block] |
What were the Fund costs for the reporting period? (Based on a hypothetical $10,000 investment)
Table Summary
Class |
Cost of a $10,000 investment |
Cost paid as a percentage of a $10,000 investment |
Institutional 2 Class |
$104 |
0.85% | |
| Expenses Paid, Amount |
$ 104
|
| Expense Ratio, Percent |
0.85%
|
| Factors Affecting Performance [Text Block] |
Management's Discussion of Fund Performance The performance of Institutional 2 Class shares for the period presented is shown in the Average Annual Total Returns table. Top Performance ContributorsStock selection | Selections in the materials, energy and financials sectors boosted the Fund’s relative performance during the annual period. Allocations | A smaller allocation to the communication services sector and larger allocations to the energy and information technology sectors buoyed the Fund’s relative performance during the annual period. Individual holdings | Positions in Samsung Electronics, a Korean technology company; Energy Fuels, an American rare earths and uranium company; Impala Platinum, a South African platinum miner; and an overweight in Northern Star Resources, an Australian gold miner, contributed to the Fund’s relative performance during the annual period. Not owning SAP, a German software company, was also a top contributor to the Fund’s relative performance during the annual period. Top Performance DetractorsStock selection | Selections in the consumer staples, real estate and communication services sectors hurt the Fund’s relative performance most during the annual period. Allocations | Smaller weightings in the industrials and utilities sectors and a larger weighting in the consumer discretionary sector detracted from the Fund’s relative performance during the annual period. Individual holdings | Positions in Flutter Entertainment, an Irish-American gambling company; Primo Brands, a Canadian-American beverage company; and Burford Capital, a litigation finance company, were top detractors from the Fund’s relative performance during the annual period. An overweight in Check Point Software Technologies, an Israeli cybersecurity company, and a zero weight in ASML, a Dutch semiconductor company, were also top detractors from the Fund’s relative performance during the annual period. |
| Performance Past Does Not Indicate Future [Text] |
The Fund's past performance is not a good predictor of the Fund's future performance.
|
| Line Graph [Table Text Block] |

Table Summary
|
Columbia Overseas Core Fund Institutional 2 Class ($19,733) |
MSCI EAFE Index (Net) ($19,464) |
03/05/18 |
$10,000 |
$10,000 |
03/31/18 |
$9,960 |
$10,012 |
04/30/18 |
$10,030 |
$10,241 |
05/31/18 |
$9,980 |
$10,010 |
06/30/18 |
$9,790 |
$9,888 |
07/31/18 |
$9,870 |
$10,131 |
08/31/18 |
$9,630 |
$9,936 |
09/30/18 |
$9,770 |
$10,022 |
10/31/18 |
$9,040 |
$9,224 |
11/30/18 |
$9,030 |
$9,213 |
12/31/18 |
$8,432 |
$8,765 |
01/31/19 |
$9,230 |
$9,342 |
02/28/19 |
$9,483 |
$9,580 |
03/31/19 |
$9,503 |
$9,640 |
04/30/19 |
$9,726 |
$9,911 |
05/31/19 |
$9,129 |
$9,435 |
06/30/19 |
$9,652 |
$9,995 |
07/31/19 |
$9,489 |
$9,868 |
08/31/19 |
$9,387 |
$9,612 |
09/30/19 |
$9,652 |
$9,888 |
10/31/19 |
$10,018 |
$10,243 |
11/30/19 |
$10,221 |
$10,359 |
12/31/19 |
$10,581 |
$10,695 |
01/31/20 |
$10,297 |
$10,472 |
02/29/20 |
$9,466 |
$9,525 |
03/31/20 |
$7,794 |
$8,254 |
04/30/20 |
$8,635 |
$8,787 |
05/31/20 |
$9,193 |
$9,170 |
06/30/20 |
$9,501 |
$9,482 |
07/31/20 |
$9,724 |
$9,703 |
08/31/20 |
$10,159 |
$10,202 |
09/30/20 |
$9,958 |
$9,937 |
10/31/20 |
$9,523 |
$9,540 |
11/30/20 |
$10,903 |
$11,019 |
12/31/20 |
$11,505 |
$11,531 |
01/31/21 |
$11,376 |
$11,408 |
02/28/21 |
$11,753 |
$11,664 |
03/31/21 |
$12,249 |
$11,932 |
04/30/21 |
$12,529 |
$12,291 |
05/31/21 |
$12,885 |
$12,692 |
06/30/21 |
$12,540 |
$12,549 |
07/31/21 |
$12,606 |
$12,644 |
08/31/21 |
$12,982 |
$12,867 |
09/30/21 |
$12,661 |
$12,493 |
10/31/21 |
$12,750 |
$12,801 |
11/30/21 |
$12,087 |
$12,205 |
12/31/21 |
$12,619 |
$12,830 |
01/31/22 |
$12,304 |
$12,210 |
02/28/22 |
$11,966 |
$11,994 |
03/31/22 |
$11,790 |
$12,071 |
04/30/22 |
$10,997 |
$11,290 |
05/31/22 |
$11,265 |
$11,375 |
06/30/22 |
$10,147 |
$10,319 |
07/31/22 |
$10,538 |
$10,834 |
08/31/22 |
$10,206 |
$10,319 |
09/30/22 |
$9,175 |
$9,354 |
10/31/22 |
$9,732 |
$9,857 |
11/30/22 |
$10,870 |
$10,967 |
12/31/22 |
$10,740 |
$10,976 |
01/31/23 |
$11,534 |
$11,864 |
02/28/23 |
$11,178 |
$11,617 |
03/31/23 |
$11,439 |
$11,905 |
04/30/23 |
$11,712 |
$12,241 |
05/31/23 |
$11,155 |
$11,723 |
06/30/23 |
$11,577 |
$12,256 |
07/31/23 |
$11,964 |
$12,653 |
08/31/23 |
$11,735 |
$12,168 |
09/30/23 |
$11,408 |
$11,753 |
10/31/23 |
$10,985 |
$11,276 |
11/30/23 |
$11,795 |
$12,323 |
12/31/23 |
$12,425 |
$12,977 |
01/31/24 |
$12,251 |
$13,052 |
02/29/24 |
$12,251 |
$13,291 |
03/31/24 |
$12,698 |
$13,728 |
04/30/24 |
$12,400 |
$13,377 |
05/31/24 |
$13,047 |
$13,895 |
06/30/24 |
$12,750 |
$13,670 |
07/31/24 |
$13,252 |
$14,071 |
08/31/24 |
$13,679 |
$14,529 |
09/30/24 |
$13,892 |
$14,663 |
10/31/24 |
$13,264 |
$13,866 |
11/30/24 |
$13,327 |
$13,787 |
12/31/24 |
$12,860 |
$13,474 |
01/31/25 |
$13,469 |
$14,182 |
02/28/25 |
$13,741 |
$14,457 |
03/31/25 |
$14,065 |
$14,398 |
04/30/25 |
$14,623 |
$15,058 |
05/31/25 |
$15,232 |
$15,747 |
06/30/25 |
$15,963 |
$16,094 |
07/31/25 |
$15,781 |
$15,868 |
08/31/25 |
$16,586 |
$16,544 |
09/30/25 |
$17,001 |
$16,861 |
10/31/25 |
$17,092 |
$17,059 |
11/30/25 |
$17,351 |
$17,165 |
12/31/25 |
$17,785 |
$17,680 |
01/31/26 |
$18,866 |
$18,603 |
02/28/26 |
$19,733 |
$19,464 |
|
| Average Annual Return [Table Text Block] |
Table Summary
Average Annual Total Returns (%) |
1 year |
5 years |
Since Fund Inception |
Institutional 2 Class |
43.61 |
10.92 |
8.88 |
MSCI EAFE Index (Net) |
34.63 |
10.78 |
8.70 | |
| No Deduction of Taxes [Text Block] |
Performance does not reflect the deduction of taxes that a shareholder may pay on fund distributions or on the redemptions of fund shares.
|
| Updated Performance Information Location [Text Block] |
columbiathreadneedleus.com/investment-products/mutual-funds
|
| AssetsNet |
$ 1,021,194,322
|
| Holdings Count | Holding |
128
|
| Advisory Fees Paid, Amount |
$ 7,992,678
|
| InvestmentCompanyPortfolioTurnover |
57.00%
|
| Additional Fund Statistics [Text Block] |
Table Summary
Fund net assets |
$1,021,194,322 |
Total number of portfolio holdings |
128 |
Management services fees (represents 0.84% of Fund average net assets) |
$7,992,678 |
Portfolio turnover for the reporting period |
57% | |
| Holdings [Text Block] |
Table Summary
Japan |
23.3% |
|
United States |
9.8% |
|
Netherlands |
8.0% |
|
United Kingdom |
6.6% |
|
France |
6.6% |
|
Australia |
5.1% |
|
Canada |
4.9% |
|
Italy |
3.1% |
|
Greece |
2.7% |
|
Taiwan |
2.6% |
|
Other |
27.0% |
|
Table Summary
Financials |
19.3% |
Industrials |
14.4% |
Information Technology |
13.9% |
Consumer Discretionary |
9.7% |
Consumer Staples |
9.6% |
Health Care |
9.5% |
Energy |
8.6% |
Materials |
8.1% |
Communication Services |
2.1% |
Utilities |
1.4% |
Other |
1.3% | |
| Largest Holdings [Text Block] |
Table Summary
AstraZeneca PLC |
2.5% |
Northern Star Resources Ltd. |
2.3% |
ING Groep NV |
2.2% |
Taiwan Semiconductor Manufacturing Co., Ltd. |
2.0% |
Primo Brands Corp., Class A |
2.0% |
Powszechna Kasa Oszczednosci Bank Polski SA |
1.9% |
AXA SA |
1.9% |
Shell PLC |
1.8% |
Ping An Insurance Group Co. of China Ltd., Class H |
1.8% |
ASM International NV |
1.8% | |
| Material Fund Change [Text Block] |
|
| C000198591 |
|
| Shareholder Report [Line Items] |
|
| Fund Name |
Columbia Overseas Core Fund
|
| Class Name |
Institutional 3 Class
|
| Trading Symbol |
COSOX
|
| Annual or Semi-Annual Statement [Text Block] |
This annual shareholder report contains important information about Columbia Overseas Core Fund (the Fund) for the period of March 1, 2025 to February 28, 2026.
|
| Additional Information [Text Block] |
You can find additional information about the Fund at columbiathreadneedleus.com/resources/literature. You can also request more information by contacting us at 1-800-345-6611.
|
| Additional Information Phone Number |
1-800-345-6611
|
| Additional Information Website |
columbiathreadneedleus.com/resources/literature
|
| Expenses [Text Block] |
What were the Fund costs for the reporting period? (Based on a hypothetical $10,000 investment)
Table Summary
Class |
Cost of a $10,000 investment |
Cost paid as a percentage of a $10,000 investment |
Institutional 3 Class |
$97 |
0.80% | |
| Expenses Paid, Amount |
$ 97
|
| Expense Ratio, Percent |
0.80%
|
| Factors Affecting Performance [Text Block] |
Management's Discussion of Fund Performance The performance of Institutional 3 Class shares for the period presented is shown in the Average Annual Total Returns table. Top Performance ContributorsStock selection | Selections in the materials, energy and financials sectors boosted the Fund’s relative performance during the annual period. Allocations | A smaller allocation to the communication services sector and larger allocations to the energy and information technology sectors buoyed the Fund’s relative performance during the annual period. Individual holdings | Positions in Samsung Electronics, a Korean technology company; Energy Fuels, an American rare earths and uranium company; Impala Platinum, a South African platinum miner; and an overweight in Northern Star Resources, an Australian gold miner, contributed to the Fund’s relative performance during the annual period. Not owning SAP, a German software company, was also a top contributor to the Fund’s relative performance during the annual period. Top Performance DetractorsStock selection | Selections in the consumer staples, real estate and communication services sectors hurt the Fund’s relative performance most during the annual period. Allocations | Smaller weightings in the industrials and utilities sectors and a larger weighting in the consumer discretionary sector detracted from the Fund’s relative performance during the annual period. Individual holdings | Positions in Flutter Entertainment, an Irish-American gambling company; Primo Brands, a Canadian-American beverage company; and Burford Capital, a litigation finance company, were top detractors from the Fund’s relative performance during the annual period. An overweight in Check Point Software Technologies, an Israeli cybersecurity company, and a zero weight in ASML, a Dutch semiconductor company, were also top detractors from the Fund’s relative performance during the annual period. |
| Performance Past Does Not Indicate Future [Text] |
The Fund's past performance is not a good predictor of the Fund's future performance.
|
| Line Graph [Table Text Block] |
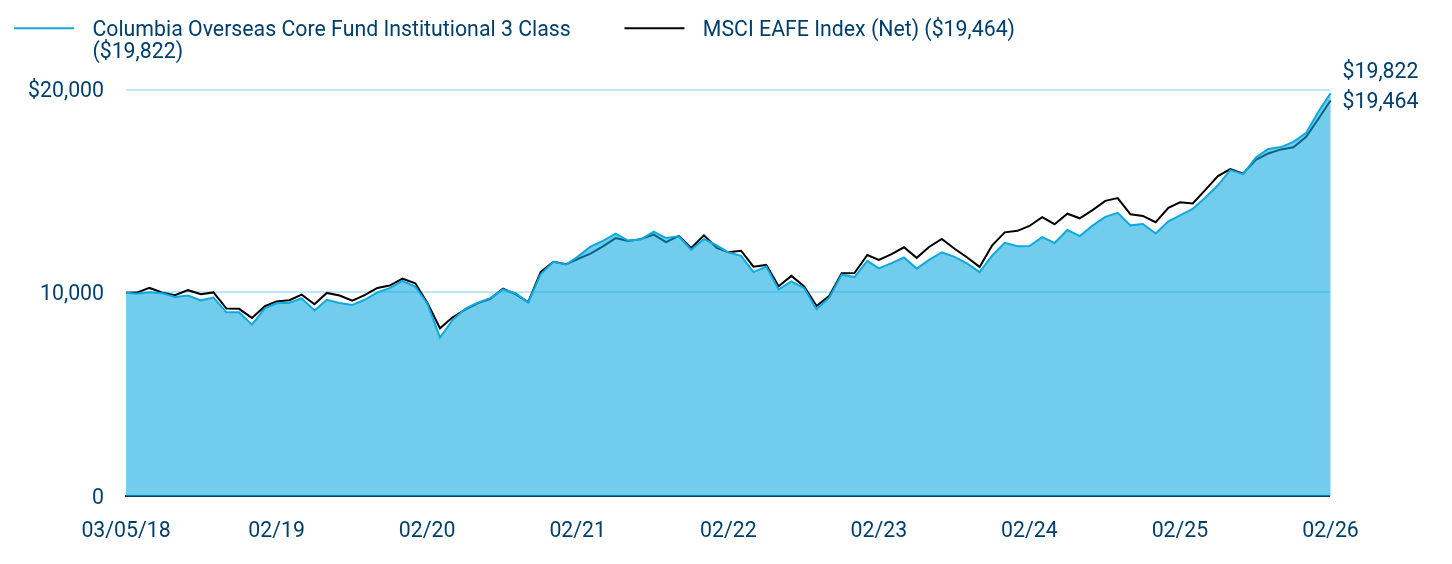
Table Summary
|
Columbia Overseas Core Fund Institutional 3 Class ($19,822) |
MSCI EAFE Index (Net) ($19,464) |
03/05/18 |
$10,000 |
$10,000 |
03/31/18 |
$9,960 |
$10,012 |
04/30/18 |
$10,030 |
$10,241 |
05/31/18 |
$9,980 |
$10,010 |
06/30/18 |
$9,800 |
$9,888 |
07/31/18 |
$9,870 |
$10,131 |
08/31/18 |
$9,630 |
$9,936 |
09/30/18 |
$9,770 |
$10,022 |
10/31/18 |
$9,040 |
$9,224 |
11/30/18 |
$9,040 |
$9,213 |
12/31/18 |
$8,436 |
$8,765 |
01/31/19 |
$9,236 |
$9,342 |
02/28/19 |
$9,489 |
$9,580 |
03/31/19 |
$9,509 |
$9,640 |
04/30/19 |
$9,731 |
$9,911 |
05/31/19 |
$9,134 |
$9,435 |
06/30/19 |
$9,658 |
$9,995 |
07/31/19 |
$9,495 |
$9,868 |
08/31/19 |
$9,404 |
$9,612 |
09/30/19 |
$9,658 |
$9,888 |
10/31/19 |
$10,025 |
$10,243 |
11/30/19 |
$10,228 |
$10,359 |
12/31/19 |
$10,583 |
$10,695 |
01/31/20 |
$10,310 |
$10,472 |
02/29/20 |
$9,478 |
$9,525 |
03/31/20 |
$7,803 |
$8,254 |
04/30/20 |
$8,646 |
$8,787 |
05/31/20 |
$9,214 |
$9,170 |
06/30/20 |
$9,513 |
$9,482 |
07/31/20 |
$9,736 |
$9,703 |
08/31/20 |
$10,172 |
$10,202 |
09/30/20 |
$9,981 |
$9,937 |
10/31/20 |
$9,534 |
$9,540 |
11/30/20 |
$10,916 |
$11,019 |
12/31/20 |
$11,525 |
$11,531 |
01/31/21 |
$11,395 |
$11,408 |
02/28/21 |
$11,784 |
$11,664 |
03/31/21 |
$12,270 |
$11,932 |
04/30/21 |
$12,562 |
$12,291 |
05/31/21 |
$12,918 |
$12,692 |
06/30/21 |
$12,573 |
$12,549 |
07/31/21 |
$12,629 |
$12,644 |
08/31/21 |
$13,016 |
$12,867 |
09/30/21 |
$12,695 |
$12,493 |
10/31/21 |
$12,784 |
$12,801 |
11/30/21 |
$12,120 |
$12,205 |
12/31/21 |
$12,649 |
$12,830 |
01/31/22 |
$12,333 |
$12,210 |
02/28/22 |
$11,993 |
$11,994 |
03/31/22 |
$11,818 |
$12,071 |
04/30/22 |
$11,022 |
$11,290 |
05/31/22 |
$11,291 |
$11,375 |
06/30/22 |
$10,171 |
$10,319 |
07/31/22 |
$10,563 |
$10,834 |
08/31/22 |
$10,230 |
$10,319 |
09/30/22 |
$9,196 |
$9,354 |
10/31/22 |
$9,767 |
$9,857 |
11/30/22 |
$10,895 |
$10,967 |
12/31/22 |
$10,777 |
$10,976 |
01/31/23 |
$11,573 |
$11,864 |
02/28/23 |
$11,204 |
$11,617 |
03/31/23 |
$11,466 |
$11,905 |
04/30/23 |
$11,739 |
$12,241 |
05/31/23 |
$11,192 |
$11,723 |
06/30/23 |
$11,622 |
$12,256 |
07/31/23 |
$11,997 |
$12,653 |
08/31/23 |
$11,767 |
$12,168 |
09/30/23 |
$11,452 |
$11,753 |
10/31/23 |
$11,016 |
$11,276 |
11/30/23 |
$11,828 |
$12,323 |
12/31/23 |
$12,465 |
$12,977 |
01/31/24 |
$12,291 |
$13,052 |
02/29/24 |
$12,303 |
$13,291 |
03/31/24 |
$12,740 |
$13,728 |
04/30/24 |
$12,453 |
$13,377 |
05/31/24 |
$13,089 |
$13,895 |
06/30/24 |
$12,793 |
$13,670 |
07/31/24 |
$13,309 |
$14,071 |
08/31/24 |
$13,737 |
$14,529 |
09/30/24 |
$13,939 |
$14,663 |
10/31/24 |
$13,322 |
$13,866 |
11/30/24 |
$13,385 |
$13,787 |
12/31/24 |
$12,923 |
$13,474 |
01/31/25 |
$13,522 |
$14,182 |
02/28/25 |
$13,808 |
$14,457 |
03/31/25 |
$14,134 |
$14,398 |
04/30/25 |
$14,680 |
$15,058 |
05/31/25 |
$15,292 |
$15,747 |
06/30/25 |
$16,040 |
$16,094 |
07/31/25 |
$15,845 |
$15,868 |
08/31/25 |
$16,666 |
$16,544 |
09/30/25 |
$17,083 |
$16,861 |
10/31/25 |
$17,174 |
$17,059 |
11/30/25 |
$17,434 |
$17,165 |
12/31/25 |
$17,880 |
$17,680 |
01/31/26 |
$18,965 |
$18,603 |
02/28/26 |
$19,822 |
$19,464 |
|
| Average Annual Return [Table Text Block] |
Table Summary
Average Annual Total Returns (%) |
1 year |
5 years |
Since Fund Inception |
Institutional 3 Class |
43.55 |
10.96 |
8.94 |
MSCI EAFE Index (Net) |
34.63 |
10.78 |
8.70 | |
| No Deduction of Taxes [Text Block] |
Performance does not reflect the deduction of taxes that a shareholder may pay on fund distributions or on the redemptions of fund shares.
|
| Updated Performance Information Location [Text Block] |
columbiathreadneedleus.com/investment-products/mutual-funds
|
| AssetsNet |
$ 1,021,194,322
|
| Holdings Count | Holding |
128
|
| Advisory Fees Paid, Amount |
$ 7,992,678
|
| InvestmentCompanyPortfolioTurnover |
57.00%
|
| Additional Fund Statistics [Text Block] |
Table Summary
Fund net assets |
$1,021,194,322 |
Total number of portfolio holdings |
128 |
Management services fees (represents 0.84% of Fund average net assets) |
$7,992,678 |
Portfolio turnover for the reporting period |
57% | |
| Holdings [Text Block] |
Table Summary
Japan |
23.3% |
|
United States |
9.8% |
|
Netherlands |
8.0% |
|
United Kingdom |
6.6% |
|
France |
6.6% |
|
Australia |
5.1% |
|
Canada |
4.9% |
|
Italy |
3.1% |
|
Greece |
2.7% |
|
Taiwan |
2.6% |
|
Other |
27.0% |
|
Table Summary
Financials |
19.3% |
Industrials |
14.4% |
Information Technology |
13.9% |
Consumer Discretionary |
9.7% |
Consumer Staples |
9.6% |
Health Care |
9.5% |
Energy |
8.6% |
Materials |
8.1% |
Communication Services |
2.1% |
Utilities |
1.4% |
Other |
1.3% | |
| Largest Holdings [Text Block] |
Table Summary
AstraZeneca PLC |
2.5% |
Northern Star Resources Ltd. |
2.3% |
ING Groep NV |
2.2% |
Taiwan Semiconductor Manufacturing Co., Ltd. |
2.0% |
Primo Brands Corp., Class A |
2.0% |
Powszechna Kasa Oszczednosci Bank Polski SA |
1.9% |
AXA SA |
1.9% |
Shell PLC |
1.8% |
Ping An Insurance Group Co. of China Ltd., Class H |
1.8% |
ASM International NV |
1.8% | |
| Material Fund Change [Text Block] |
|
| C000198589 |
|
| Shareholder Report [Line Items] |
|
| Fund Name |
Columbia Overseas Core Fund
|
| Class Name |
Institutional Class
|
| Trading Symbol |
COSNX
|
| Annual or Semi-Annual Statement [Text Block] |
This annual shareholder report contains important information about Columbia Overseas Core Fund (the Fund) for the period of March 1, 2025 to February 28, 2026.
|
| Additional Information [Text Block] |
You can find additional information about the Fund at columbiathreadneedleus.com/resources/literature. You can also request more information by contacting us at 1-800-345-6611.
|
| Additional Information Phone Number |
1-800-345-6611
|
| Additional Information Website |
columbiathreadneedleus.com/resources/literature
|
| Expenses [Text Block] |
What were the Fund costs for the reporting period? (Based on a hypothetical $10,000 investment)
Table Summary
Class |
Cost of a $10,000 investment |
Cost paid as a percentage of a $10,000 investment |
Institutional Class |
$113 |
0.93% | |
| Expenses Paid, Amount |
$ 113
|
| Expense Ratio, Percent |
0.93%
|
| Factors Affecting Performance [Text Block] |
Management's Discussion of Fund Performance The performance of Institutional Class shares for the period presented is shown in the Average Annual Total Returns table. Top Performance ContributorsStock selection | Selections in the materials, energy and financials sectors boosted the Fund’s relative performance during the annual period. Allocations | A smaller allocation to the communication services sector and larger allocations to the energy and information technology sectors buoyed the Fund’s relative performance during the annual period. Individual holdings | Positions in Samsung Electronics, a Korean technology company; Energy Fuels, an American rare earths and uranium company; Impala Platinum, a South African platinum miner; and an overweight in Northern Star Resources, an Australian gold miner, contributed to the Fund’s relative performance during the annual period. Not owning SAP, a German software company, was also a top contributor to the Fund’s relative performance during the annual period. Top Performance DetractorsStock selection | Selections in the consumer staples, real estate and communication services sectors hurt the Fund’s relative performance most during the annual period. Allocations | Smaller weightings in the industrials and utilities sectors and a larger weighting in the consumer discretionary sector detracted from the Fund’s relative performance during the annual period. Individual holdings | Positions in Flutter Entertainment, an Irish-American gambling company; Primo Brands, a Canadian-American beverage company; and Burford Capital, a litigation finance company, were top detractors from the Fund’s relative performance during the annual period. An overweight in Check Point Software Technologies, an Israeli cybersecurity company, and a zero weight in ASML, a Dutch semiconductor company, were also top detractors from the Fund’s relative performance during the annual period. |
| Performance Past Does Not Indicate Future [Text] |
The Fund's past performance is not a good predictor of the Fund's future performance.
|
| Line Graph [Table Text Block] |
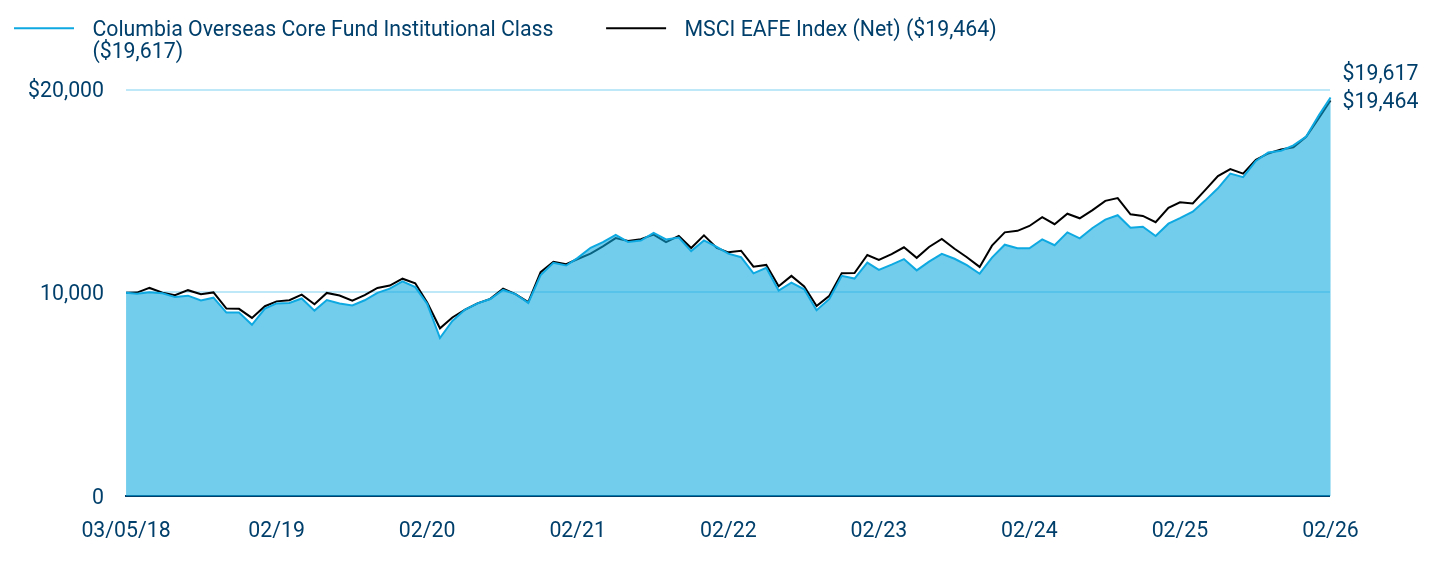
Table Summary
|
Columbia Overseas Core Fund Institutional Class ($19,617) |
MSCI EAFE Index (Net) ($19,464) |
03/05/18 |
$10,000 |
$10,000 |
03/31/18 |
$9,960 |
$10,012 |
04/30/18 |
$10,030 |
$10,241 |
05/31/18 |
$9,980 |
$10,010 |
06/30/18 |
$9,790 |
$9,888 |
07/31/18 |
$9,860 |
$10,131 |
08/31/18 |
$9,620 |
$9,936 |
09/30/18 |
$9,760 |
$10,022 |
10/31/18 |
$9,030 |
$9,224 |
11/30/18 |
$9,030 |
$9,213 |
12/31/18 |
$8,426 |
$8,765 |
01/31/19 |
$9,225 |
$9,342 |
02/28/19 |
$9,478 |
$9,580 |
03/31/19 |
$9,498 |
$9,640 |
04/30/19 |
$9,720 |
$9,911 |
05/31/19 |
$9,124 |
$9,435 |
06/30/19 |
$9,645 |
$9,995 |
07/31/19 |
$9,472 |
$9,868 |
08/31/19 |
$9,380 |
$9,612 |
09/30/19 |
$9,635 |
$9,888 |
10/31/19 |
$10,001 |
$10,243 |
11/30/19 |
$10,205 |
$10,359 |
12/31/19 |
$10,563 |
$10,695 |
01/31/20 |
$10,279 |
$10,472 |
02/29/20 |
$9,460 |
$9,525 |
03/31/20 |
$7,778 |
$8,254 |
04/30/20 |
$8,619 |
$8,787 |
05/31/20 |
$9,176 |
$9,170 |
06/30/20 |
$9,484 |
$9,482 |
07/31/20 |
$9,696 |
$9,703 |
08/31/20 |
$10,142 |
$10,202 |
09/30/20 |
$9,940 |
$9,937 |
10/31/20 |
$9,505 |
$9,540 |
11/30/20 |
$10,874 |
$11,019 |
12/31/20 |
$11,476 |
$11,531 |
01/31/21 |
$11,347 |
$11,408 |
02/28/21 |
$11,723 |
$11,664 |
03/31/21 |
$12,219 |
$11,932 |
04/30/21 |
$12,498 |
$12,291 |
05/31/21 |
$12,854 |
$12,692 |
06/30/21 |
$12,507 |
$12,549 |
07/31/21 |
$12,573 |
$12,644 |
08/31/21 |
$12,948 |
$12,867 |
09/30/21 |
$12,628 |
$12,493 |
10/31/21 |
$12,717 |
$12,801 |
11/30/21 |
$12,055 |
$12,205 |
12/31/21 |
$12,579 |
$12,830 |
01/31/22 |
$12,264 |
$12,210 |
02/28/22 |
$11,927 |
$11,994 |
03/31/22 |
$11,752 |
$12,071 |
04/30/22 |
$10,960 |
$11,290 |
05/31/22 |
$11,228 |
$11,375 |
06/30/22 |
$10,112 |
$10,319 |
07/31/22 |
$10,502 |
$10,834 |
08/31/22 |
$10,171 |
$10,319 |
09/30/22 |
$9,142 |
$9,354 |
10/31/22 |
$9,698 |
$9,857 |
11/30/22 |
$10,834 |
$10,967 |
12/31/22 |
$10,704 |
$10,976 |
01/31/23 |
$11,484 |
$11,864 |
02/28/23 |
$11,129 |
$11,617 |
03/31/23 |
$11,389 |
$11,905 |
04/30/23 |
$11,662 |
$12,241 |
05/31/23 |
$11,106 |
$11,723 |
06/30/23 |
$11,532 |
$12,256 |
07/31/23 |
$11,917 |
$12,653 |
08/31/23 |
$11,676 |
$12,168 |
09/30/23 |
$11,363 |
$11,753 |
10/31/23 |
$10,941 |
$11,276 |
11/30/23 |
$11,737 |
$12,323 |
12/31/23 |
$12,370 |
$12,977 |
01/31/24 |
$12,196 |
$13,052 |
02/29/24 |
$12,196 |
$13,291 |
03/31/24 |
$12,630 |
$13,728 |
04/30/24 |
$12,345 |
$13,377 |
05/31/24 |
$12,977 |
$13,895 |
06/30/24 |
$12,680 |
$13,670 |
07/31/24 |
$13,193 |
$14,071 |
08/31/24 |
$13,605 |
$14,529 |
09/30/24 |
$13,818 |
$14,663 |
10/31/24 |
$13,205 |
$13,866 |
11/30/24 |
$13,255 |
$13,787 |
12/31/24 |
$12,796 |
$13,474 |
01/31/25 |
$13,403 |
$14,182 |
02/28/25 |
$13,674 |
$14,457 |
03/31/25 |
$13,997 |
$14,398 |
04/30/25 |
$14,539 |
$15,058 |
05/31/25 |
$15,146 |
$15,747 |
06/30/25 |
$15,872 |
$16,094 |
07/31/25 |
$15,691 |
$15,868 |
08/31/25 |
$16,493 |
$16,544 |
09/30/25 |
$16,906 |
$16,861 |
10/31/25 |
$16,997 |
$17,059 |
11/30/25 |
$17,255 |
$17,165 |
12/31/25 |
$17,692 |
$17,680 |
01/31/26 |
$18,754 |
$18,603 |
02/28/26 |
$19,617 |
$19,464 |
|
| Average Annual Return [Table Text Block] |
Table Summary
Average Annual Total Returns (%) |
1 year |
5 years |
Since Fund Inception |
Institutional Class |
43.47 |
10.85 |
8.80 |
MSCI EAFE Index (Net) |
34.63 |
10.78 |
8.70 | |
| No Deduction of Taxes [Text Block] |
Performance does not reflect the deduction of taxes that a shareholder may pay on fund distributions or on the redemptions of fund shares.
|
| Updated Performance Information Location [Text Block] |
columbiathreadneedleus.com/investment-products/mutual-funds
|
| AssetsNet |
$ 1,021,194,322
|
| Holdings Count | Holding |
128
|
| Advisory Fees Paid, Amount |
$ 7,992,678
|
| InvestmentCompanyPortfolioTurnover |
57.00%
|
| Additional Fund Statistics [Text Block] |
Table Summary
Fund net assets |
$1,021,194,322 |
Total number of portfolio holdings |
128 |
Management services fees (represents 0.84% of Fund average net assets) |
$7,992,678 |
Portfolio turnover for the reporting period |
57% | |
| Holdings [Text Block] |
Table Summary
Japan |
23.3% |
|
United States |
9.8% |
|
Netherlands |
8.0% |
|
United Kingdom |
6.6% |
|
France |
6.6% |
|
Australia |
5.1% |
|
Canada |
4.9% |
|
Italy |
3.1% |
|
Greece |
2.7% |
|
Taiwan |
2.6% |
|
Other |
27.0% |
|
Table Summary
Financials |
19.3% |
Industrials |
14.4% |
Information Technology |
13.9% |
Consumer Discretionary |
9.7% |
Consumer Staples |
9.6% |
Health Care |
9.5% |
Energy |
8.6% |
Materials |
8.1% |
Communication Services |
2.1% |
Utilities |
1.4% |
Other |
1.3% | |
| Largest Holdings [Text Block] |
Table Summary
AstraZeneca PLC |
2.5% |
Northern Star Resources Ltd. |
2.3% |
ING Groep NV |
2.2% |
Taiwan Semiconductor Manufacturing Co., Ltd. |
2.0% |
Primo Brands Corp., Class A |
2.0% |
Powszechna Kasa Oszczednosci Bank Polski SA |
1.9% |
AXA SA |
1.9% |
Shell PLC |
1.8% |
Ping An Insurance Group Co. of China Ltd., Class H |
1.8% |
ASM International NV |
1.8% | |
| Material Fund Change [Text Block] |
|