Shareholder Report
Feb. 28, 2026
USD ($)
Holding
Shareholder Report |
12 Months Ended |
|---|---|
|
Feb. 28, 2026
USD ($)
Holding
| |
| Shareholder Report [Line Items] | |
| Document Type | N-CSR |
| Amendment Flag | false |
| Registrant Name | Northern Lights Fund Trust IV |
| Entity Central Index Key | 0001644419 |
| Entity Investment Company Type | N-1A |
| Document Period End Date | Feb. 28, 2026 |
| Shareholder Report Annual or Semi-Annual | Annual Shareholder Report |
| C000226137 | |
| Shareholder Report [Line Items] | |
| Fund Name | Monarch Ambassador Income Index ETF |
| Trading Symbol | MAMB |
| Security Exchange Name | CboeBZX |
| Annual or Semi-Annual Statement [Text Block] | This annual shareholder report contains important information about Monarch Ambassador Income Index ETF for the period of March 1, 2025 to February 28, 2026. |
| Additional Information [Text Block] | You can find additional information about the Fund at https://www.monarchfunds.com/resources. You can also request this information by contacting us at 1-541-291-4405. |
| Additional Information Phone Number | 1-541-291-4405 |
| Additional Information Website | https://www.monarchfunds.com/resources |
| Expenses [Text Block] | |
| Expenses Paid, Amount | $ 107 |
| Expense Ratio, Percent | 1.01% |
| Performance Past Does Not Indicate Future [Text] | The Fund's past performance is not a good predictor of how the Fund will perform in the future. |
| Performance Inception Date | Mar. 23, 2021 |
| No Deduction of Taxes [Text Block] | The graph and table do not reflect the deduction of taxes that a shareholder would pay on fund distributions or redemption of fund shares. |
| AssetsNet | $ 173,148,502 |
| Holdings Count | Holding | 10 |
| Advisory Fees Paid, Amount | $ 1,176,779 |
| InvestmentCompanyPortfolioTurnover | 46.00% |
| Additional Fund Statistics [Text Block] | |
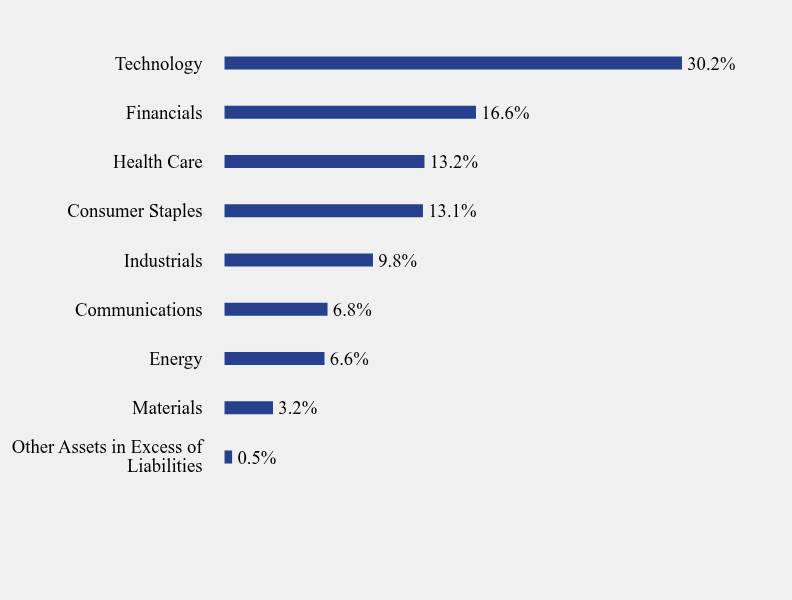
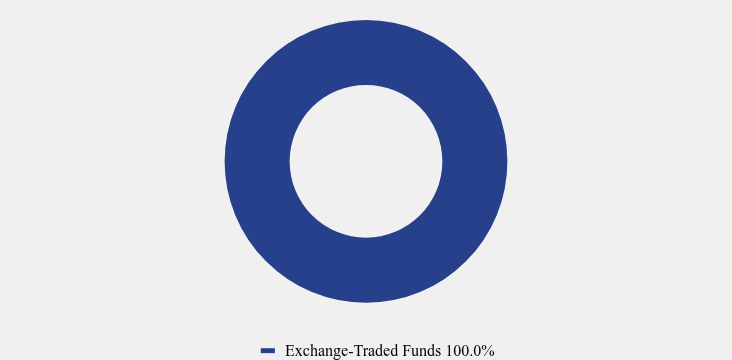
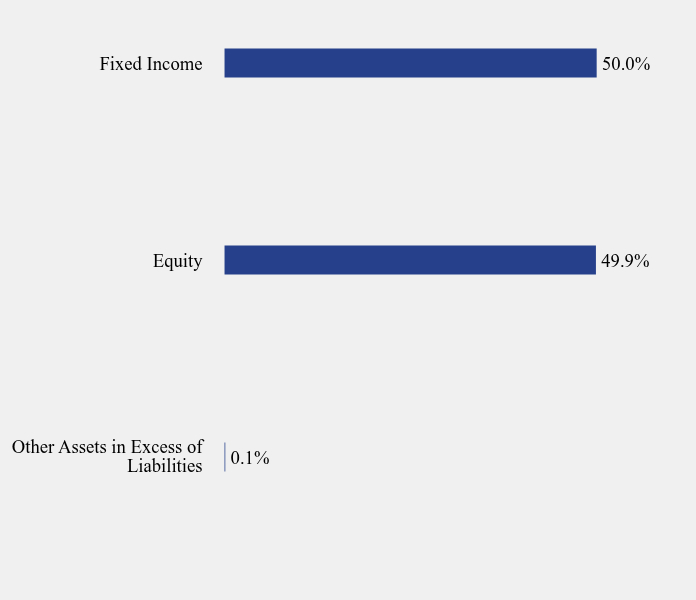
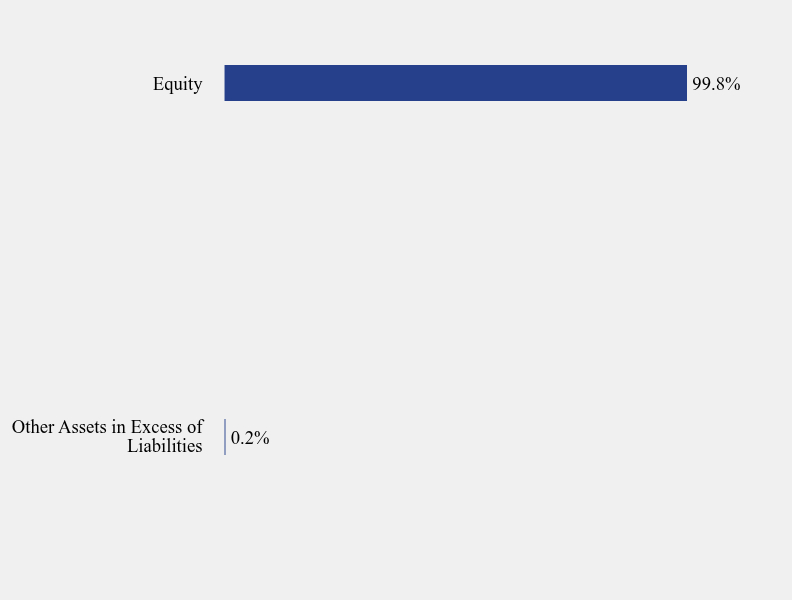
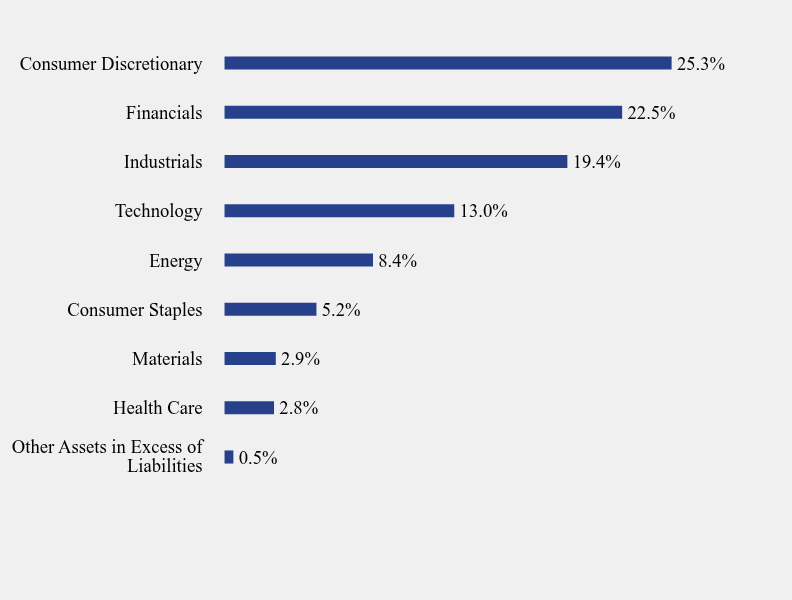
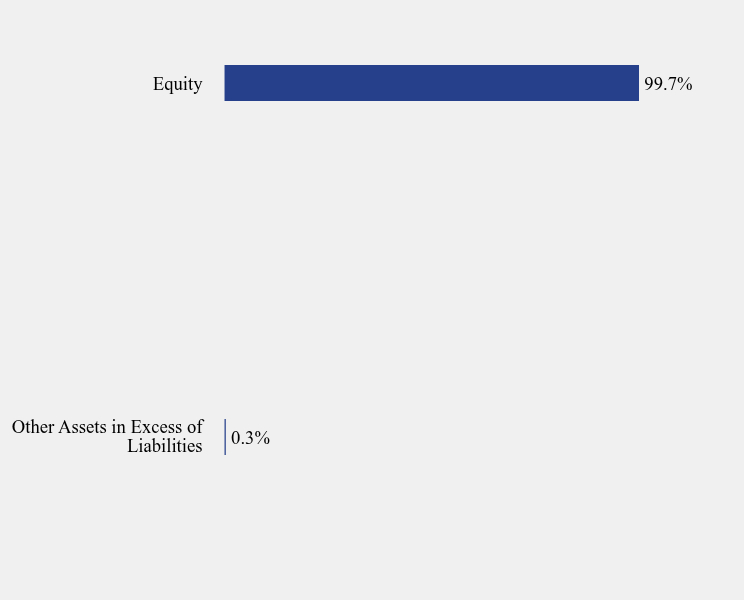
| Holdings [Text Block] | |
| C000226138 | |
| Shareholder Report [Line Items] | |
| Fund Name | Monarch Blue Chips Core Index ETF |
| Trading Symbol | MBCC |
| Security Exchange Name | CboeBZX |
| Annual or Semi-Annual Statement [Text Block] | This annual shareholder report contains important information about Monarch Blue Chips Core Index ETF for the period of March 1, 2025 to February 28, 2026. |
| Additional Information [Text Block] | You can find additional information about the Fund at https://www.monarchfunds.com/resources. You can also request this information by contacting us at 1-541-291-4405. |
| Additional Information Phone Number | 1-541-291-4405 |
| Additional Information Website | https://www.monarchfunds.com/resources |
| Expenses [Text Block] | |
| Expenses Paid, Amount | $ 103 |
| Expense Ratio, Percent | 1.01% |
| Performance Past Does Not Indicate Future [Text] | The Fund's past performance is not a good predictor of how the Fund will perform in the future. |
| Performance Inception Date | Mar. 23, 2021 |
| No Deduction of Taxes [Text Block] | The graph and table do not reflect the deduction of taxes that a shareholder would pay on fund distributions or redemption of fund shares. |
| AssetsNet | $ 152,543,031 |
| Holdings Count | Holding | 24 |
| Advisory Fees Paid, Amount | $ 1,121,163 |
| InvestmentCompanyPortfolioTurnover | 73.00% |
| Additional Fund Statistics [Text Block] | |
| Holdings [Text Block] | |
| S000246990 | |
| Shareholder Report [Line Items] | |
| Fund Name | Monarch Dividend Plus Index ETF |
| Trading Symbol | MDPL |
| Security Exchange Name | CboeBZX |
| Annual or Semi-Annual Statement [Text Block] | This annual shareholder report contains important information about Monarch Dividend Plus Index ETF for the period of March 1, 2025 to February 28, 2026. |
| Additional Information [Text Block] | You can find additional information about the Fund at https://www.monarchfunds.com/resources. You can also request this information by contacting us at 1-541-291-4405. |
| Additional Information Phone Number | 1-541-291-4405 |
| Additional Information Website | https://www.monarchfunds.com/resources |
| Expenses [Text Block] | |
| Expenses Paid, Amount | $ 122 |
| Expense Ratio, Percent | 1.19% |
| Performance Past Does Not Indicate Future [Text] | The Fund's past performance is not a good predictor of how the Fund will perform in the future. |
| Performance Inception Date | Mar. 06, 2024 |
| No Deduction of Taxes [Text Block] | The graph and table do not reflect the deduction of taxes that a shareholder would pay on fund distributions or redemption of fund shares. |
| AssetsNet | $ 58,817,902 |
| Holdings Count | Holding | 30 |
| Advisory Fees Paid, Amount | $ 473,707 |
| InvestmentCompanyPortfolioTurnover | 89.00% |
| Additional Fund Statistics [Text Block] | |
| Holdings [Text Block] | |
| C000226139 | |
| Shareholder Report [Line Items] | |
| Fund Name | Monarch ProCap Index ETF |
| Trading Symbol | MPRO |
| Security Exchange Name | CboeBZX |
| Annual or Semi-Annual Statement [Text Block] | This annual shareholder report contains important information about Monarch ProCap Index ETF for the period of March 1, 2025 to February 28, 2026. |
| Additional Information [Text Block] | You can find additional information about the Fund at https://www.monarchfunds.com/resources. You can also request this information by contacting us at 1-541-291-4405. |
| Additional Information Phone Number | 1-541-291-4405 |
| Additional Information Website | https://www.monarchfunds.com/resources |
| Expenses [Text Block] | |
| Expenses Paid, Amount | $ 104 |
| Expense Ratio, Percent | 0.97% |
| Performance Past Does Not Indicate Future [Text] | The Fund's past performance is not a good predictor of how the Fund will perform in the future. |
| Performance Inception Date | Mar. 23, 2021 |
| No Deduction of Taxes [Text Block] | The graph and table do not reflect the deduction of taxes that a shareholder would pay on fund distributions or redemption of fund shares. |
| AssetsNet | $ 250,492,723 |
| Holdings Count | Holding | 9 |
| Advisory Fees Paid, Amount | $ 1,899,326 |
| InvestmentCompanyPortfolioTurnover | 75.00% |
| Additional Fund Statistics [Text Block] | |
| Holdings [Text Block] | |
| C000246991 | |
| Shareholder Report [Line Items] | |
| Fund Name | Monarch Select Subsector Index ETF |
| Trading Symbol | MSSS |
| Security Exchange Name | CboeBZX |
| Annual or Semi-Annual Statement [Text Block] | This annual shareholder report contains important information about Monarch Select Subsector Index ETF for the period of March 1, 2025 to February 28, 2026. |
| Additional Information [Text Block] | You can find additional information about the Fund at https://www.monarchfunds.com/resources. You can also request this information by contacting us at 1-541-291-4405. |
| Additional Information Phone Number | 1-541-291-4405 |
| Additional Information Website | https://www.monarchfunds.com/resources |
| Expenses [Text Block] | |
| Expenses Paid, Amount | $ 116 |
| Expense Ratio, Percent | 1.08% |
| Performance Past Does Not Indicate Future [Text] | The Fund's past performance is not a good predictor of how the Fund will perform in the future. |
| Performance Inception Date | Mar. 06, 2024 |
| No Deduction of Taxes [Text Block] | The graph and table do not reflect the deduction of taxes that a shareholder would pay on fund distributions or redemption of fund shares. |
| AssetsNet | $ 125,113,913 |
| Holdings Count | Holding | 10 |
| Advisory Fees Paid, Amount | $ 892,900 |
| InvestmentCompanyPortfolioTurnover | 127.00% |
| Additional Fund Statistics [Text Block] | |
| Holdings [Text Block] | |
| C000246992 | |
| Shareholder Report [Line Items] | |
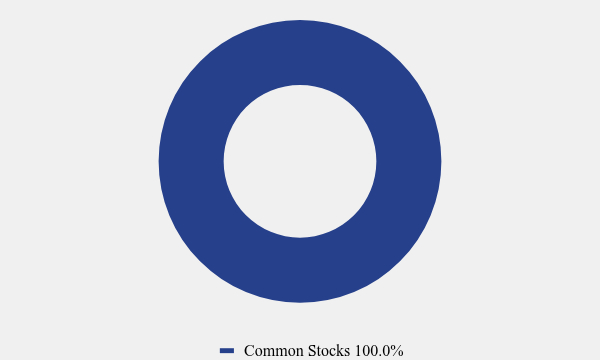
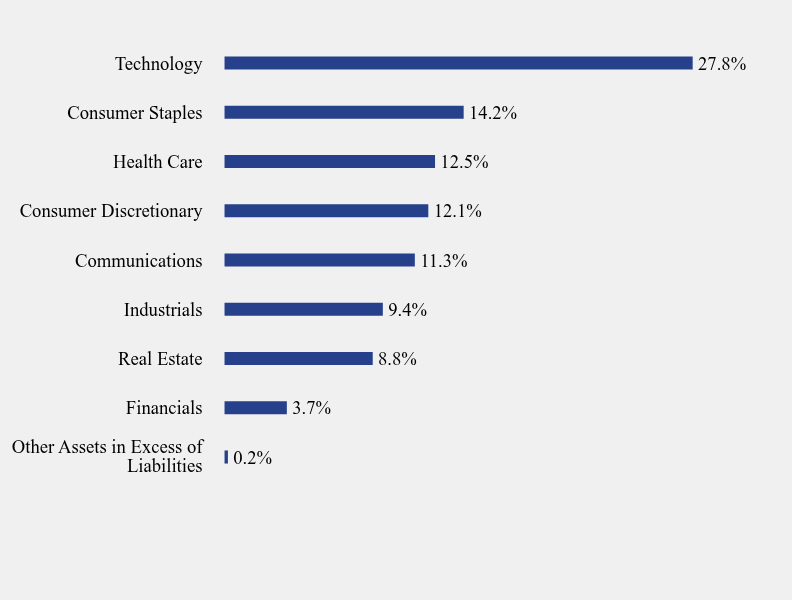
| Fund Name | Monarch Volume Factor Dividend Tree Index ETF |
| Trading Symbol | MVFD |
| Security Exchange Name | CboeBZX |
| Annual or Semi-Annual Statement [Text Block] | This annual shareholder report contains important information about Monarch Volume Factor Dividend Tree Index ETF for the period of March 1, 2025 to February 28, 2026. |
| Additional Information [Text Block] | You can find additional information about the Fund at https://www.monarchfunds.com/resources. You can also request this information by contacting us at 1-541-291-4405. |
| Additional Information Phone Number | 1-541-291-4405 |
| Additional Information Website | https://www.monarchfunds.com/resources |
| Expenses [Text Block] | |
| Expenses Paid, Amount | $ 119 |
| Expense Ratio, Percent | 1.10% |
| Performance Past Does Not Indicate Future [Text] | The Fund's past performance is not a good predictor of how the Fund will perform in the future. |
| Performance Inception Date | Mar. 06, 2024 |
| No Deduction of Taxes [Text Block] | The graph and table do not reflect the deduction of taxes that a shareholder would pay on fund distributions or redemption of fund shares. |
| AssetsNet | $ 99,079,890 |
| Holdings Count | Holding | 39 |
| Advisory Fees Paid, Amount | $ 647,675 |
| InvestmentCompanyPortfolioTurnover | 321.00% |
| Additional Fund Statistics [Text Block] | |
| Holdings [Text Block] | |
| C000246993 | |
| Shareholder Report [Line Items] | |
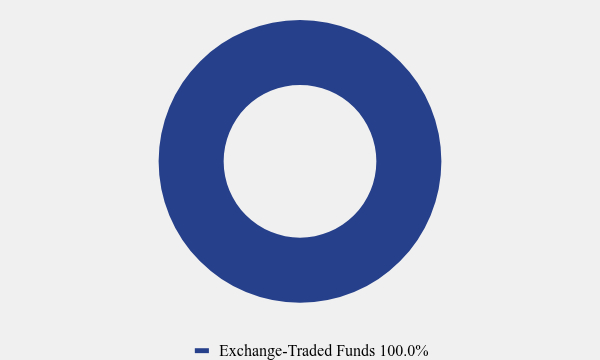
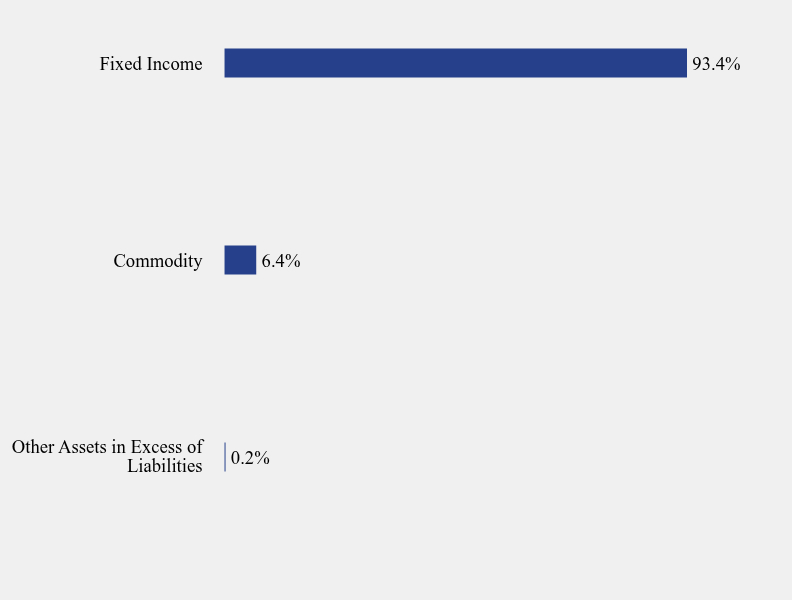
| Fund Name | Monarch Volume Factor Global Unconstrained Index ETF |
| Trading Symbol | MVFG |
| Security Exchange Name | CboeBZX |
| Annual or Semi-Annual Statement [Text Block] | This annual shareholder report contains important information about Monarch Volume Factor Global Unconstrained Index ETF for the period of March 1, 2025 to February 28, 2026. |
| Additional Information [Text Block] | You can find additional information about the Fund at https://www.monarchfunds.com/resources. You can also request this information by contacting us at 1-541-291-4405. |
| Additional Information Phone Number | 1-541-291-4405 |
| Additional Information Website | https://www.monarchfunds.com/resources |
| Expenses [Text Block] | |
| Expenses Paid, Amount | $ 121 |
| Expense Ratio, Percent | 1.03% |
| Performance Past Does Not Indicate Future [Text] | The Fund's past performance is not a good predictor of how the Fund will perform in the future. |
| Performance Inception Date | Mar. 06, 2024 |
| No Deduction of Taxes [Text Block] | The graph and table do not reflect the deduction of taxes that a shareholder would pay on fund distributions or redemption of fund shares. |
| AssetsNet | $ 147,976,181 |
| Holdings Count | Holding | 25 |
| Advisory Fees Paid, Amount | $ 939,734 |
| InvestmentCompanyPortfolioTurnover | 419.00% |
| Additional Fund Statistics [Text Block] | |
| Holdings [Text Block] |