Shareholder Report
|
6 Months Ended |
|
Feb. 28, 2026
USD ($)
Holding
|
|---|
| Shareholder Report [Line Items] |
|
|
| Document Type |
N-CSRS
|
|
| Amendment Flag |
false
|
|
| Registrant Name |
AMERICAN BEACON FUNDS
|
|
| Entity Central Index Key |
0000809593
|
|
| Entity Investment Company Type |
N-1A
|
|
| Document Period End Date |
Feb. 28, 2026
|
|
| Shareholder Report Annual or Semi-Annual |
Semi-Annual Shareholder Report
|
|
| C000254859 |
|
|
| Shareholder Report [Line Items] |
|
|
| Fund Name |
Ninety One Emerging Markets Equity Fund
|
|
| Class Name |
R5
|
|
| Trading Symbol |
ZEMIX
|
|
| Annual or Semi-Annual Statement [Text Block] |
This semi-annual shareholder report contains important information about American Beacon Ninety One Emerging Markets Equity Fund for the period of September 1, 2025 to February 28, 2026.
|
|
| Additional Information [Text Block] |
You can find additional information about the Fund at www.americanbeaconfunds.com/fund-resources/. You can request this information by contacting us at 800-658-5811.
|
|
| Additional Information Phone Number |
800-658-5811
|
|
| Additional Information Website |
www.americanbeaconfunds.com/fund-resources/
|
|
| Expenses [Text Block] |
What were the Fund costs for the last six months?(based on a hypothetical $10,000 investment)
Table Summary
Class Name |
Costs of a $10,000 investment |
Costs paid as a percentage of a $10,000 investment |
R5 |
$49 |
0.86%Footnote Reference* |
| Footnote |
Description |
Footnote* |
Annualized. | |
|
| Expenses Paid, Amount |
$ 49
|
|
| Expense Ratio, Percent |
0.86%
|
[1] |
| AssetsNet |
$ 303,754,525
|
|
| Holdings Count | Holding |
80
|
|
| Advisory Fees Paid, Amount |
$ 617,660
|
|
| InvestmentCompanyPortfolioTurnover |
22.00%
|
|
| Additional Fund Statistics [Text Block] |
Table Summary
Total Net Assets |
$303,754,525 |
# of Portfolio Holdings |
80 |
Portfolio Turnover Rate |
22% |
Total Management Fees Paid |
$617,660 | |
|
| Holdings [Text Block] |
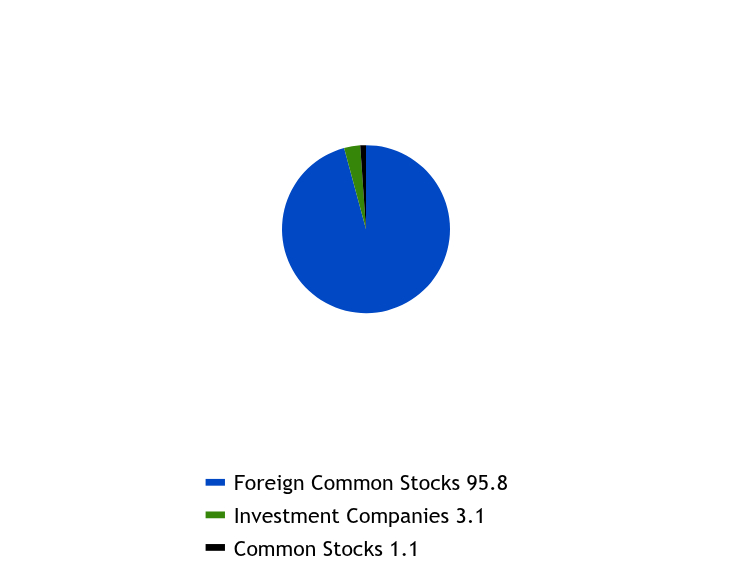
Asset Allocation - % Investments
Table Summary
Value |
Value |
Foreign Common Stocks |
95.8 |
Investment Companies |
3.1 |
Common Stocks |
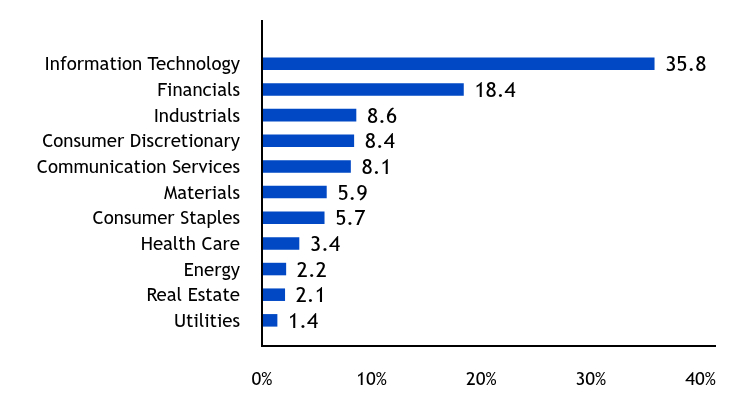
1.1 | Sector Allocation - % Equities
Table Summary
Value |
Value |
Utilities |
1.4 |
Real Estate |
2.1 |
Energy |
2.2 |
Health Care |
3.4 |
Consumer Staples |
5.7 |
Materials |
5.9 |
Communication Services |
8.1 |
Consumer Discretionary |
8.4 |
Industrials |
8.6 |
Financials |
18.4 |
Information Technology |
35.8 | Excludes cash equivalents. |
|
| Largest Holdings [Text Block] |
Top Ten Holdings - % Net Assets
Table Summary
Taiwan Semiconductor Manufacturing Co. Ltd. |
14.2 |
Samsung Electronics Co. Ltd. |
8.5 |
SK Hynix, Inc. |
5.0 |
Tencent Holdings Ltd. |
4.2 |
Alibaba Group Holding Ltd. |
2.7 |
Grupo Mexico SAB de CV, Series B |
1.6 |
Delta Electronics, Inc. |
1.6 |
Aselsan Elektronik Sanayi Ve Ticaret AS |
1.6 |
Reliance Industries Ltd. |
1.5 |
Kia Corp. |
1.4 | Excludes cash equivalents. |
|
| Material Fund Change [Text Block] |
|
|
| C000254857 |
|
|
| Shareholder Report [Line Items] |
|
|
| Fund Name |
Ninety One Emerging Markets Equity Fund
|
|
| Class Name |
R6
|
|
| Trading Symbol |
ZEMRX
|
|
| Annual or Semi-Annual Statement [Text Block] |
This semi-annual shareholder report contains important information about American Beacon Ninety One Emerging Markets Equity Fund for the period of September 1, 2025 to February 28, 2026.
|
|
| Additional Information [Text Block] |
You can find additional information about the Fund at www.americanbeaconfunds.com/fund-resources/. You can request this information by contacting us at 800-658-5811.
|
|
| Additional Information Phone Number |
800-658-5811
|
|
| Additional Information Website |
www.americanbeaconfunds.com/fund-resources/
|
|
| Expenses [Text Block] |
What were the Fund costs for the last six months?(based on a hypothetical $10,000 investment)
Table Summary
Class Name |
Costs of a $10,000 investment |
Costs paid as a percentage of a $10,000 investment |
R6 |
$48 |
0.83%Footnote Reference* |
| Footnote |
Description |
Footnote* |
Annualized. | |
|
| Expenses Paid, Amount |
$ 48
|
|
| Expense Ratio, Percent |
0.83%
|
[2] |
| AssetsNet |
$ 303,754,525
|
|
| Holdings Count | Holding |
80
|
|
| Advisory Fees Paid, Amount |
$ 617,660
|
|
| InvestmentCompanyPortfolioTurnover |
22.00%
|
|
| Additional Fund Statistics [Text Block] |
Table Summary
Total Net Assets |
$303,754,525 |
# of Portfolio Holdings |
80 |
Portfolio Turnover Rate |
22% |
Total Management Fees Paid |
$617,660 | |
|
| Holdings [Text Block] |
Asset Allocation - % Investments
Table Summary
Value |
Value |
Foreign Common Stocks |
95.8 |
Investment Companies |
3.1 |
Common Stocks |
1.1 | Sector Allocation - % Equities
Table Summary
Value |
Value |
Utilities |
1.4 |
Real Estate |
2.1 |
Energy |
2.2 |
Health Care |
3.4 |
Consumer Staples |
5.7 |
Materials |
5.9 |
Communication Services |
8.1 |
Consumer Discretionary |
8.4 |
Industrials |
8.6 |
Financials |
18.4 |
Information Technology |
35.8 | Excludes cash equivalents. |
|
| Largest Holdings [Text Block] |
Top Ten Holdings - % Net Assets
Table Summary
Taiwan Semiconductor Manufacturing Co. Ltd. |
14.2 |
Samsung Electronics Co. Ltd. |
8.5 |
SK Hynix, Inc. |
5.0 |
Tencent Holdings Ltd. |
4.2 |
Alibaba Group Holding Ltd. |
2.7 |
Grupo Mexico SAB de CV, Series B |
1.6 |
Delta Electronics, Inc. |
1.6 |
Aselsan Elektronik Sanayi Ve Ticaret AS |
1.6 |
Reliance Industries Ltd. |
1.5 |
Kia Corp. |
1.4 | Excludes cash equivalents. |
|
| Material Fund Change [Text Block] |
|
|
| C000254858 |
|
|
| Shareholder Report [Line Items] |
|
|
| Fund Name |
Ninety One Emerging Markets Equity Fund
|
|
| Class Name |
Y
|
|
| Trading Symbol |
ZEMAX
|
|
| Annual or Semi-Annual Statement [Text Block] |
This semi-annual shareholder report contains important information about American Beacon Ninety One Emerging Markets Equity Fund for the period of September 1, 2025 to February 28, 2026.
|
|
| Additional Information [Text Block] |
You can find additional information about the Fund at www.americanbeaconfunds.com/fund-resources/. You can request this information by contacting us at 800-658-5811.
|
|
| Additional Information Phone Number |
800-658-5811
|
|
| Additional Information Website |
www.americanbeaconfunds.com/fund-resources/
|
|
| Expenses [Text Block] |
What were the Fund costs for the last six months?(based on a hypothetical $10,000 investment)
Table Summary
Class Name |
Costs of a $10,000 investment |
Costs paid as a percentage of a $10,000 investment |
Y |
$53 |
0.92%Footnote Reference* |
| Footnote |
Description |
Footnote* |
Annualized. | |
|
| Expenses Paid, Amount |
$ 53
|
|
| Expense Ratio, Percent |
0.92%
|
[3] |
| AssetsNet |
$ 303,754,525
|
|
| Holdings Count | Holding |
80
|
|
| Advisory Fees Paid, Amount |
$ 617,660
|
|
| InvestmentCompanyPortfolioTurnover |
22.00%
|
|
| Additional Fund Statistics [Text Block] |
Table Summary
Total Net Assets |
$303,754,525 |
# of Portfolio Holdings |
80 |
Portfolio Turnover Rate |
22% |
Total Management Fees Paid |
$617,660 | |
|
| Holdings [Text Block] |
Asset Allocation - % Investments
Table Summary
Value |
Value |
Foreign Common Stocks |
95.8 |
Investment Companies |
3.1 |
Common Stocks |
1.1 | Sector Allocation - % Equities
Table Summary
Value |
Value |
Utilities |
1.4 |
Real Estate |
2.1 |
Energy |
2.2 |
Health Care |
3.4 |
Consumer Staples |
5.7 |
Materials |
5.9 |
Communication Services |
8.1 |
Consumer Discretionary |
8.4 |
Industrials |
8.6 |
Financials |
18.4 |
Information Technology |
35.8 | Excludes cash equivalents. |
|
| Largest Holdings [Text Block] |
Top Ten Holdings - % Net Assets
Table Summary
Taiwan Semiconductor Manufacturing Co. Ltd. |
14.2 |
Samsung Electronics Co. Ltd. |
8.5 |
SK Hynix, Inc. |
5.0 |
Tencent Holdings Ltd. |
4.2 |
Alibaba Group Holding Ltd. |
2.7 |
Grupo Mexico SAB de CV, Series B |
1.6 |
Delta Electronics, Inc. |
1.6 |
Aselsan Elektronik Sanayi Ve Ticaret AS |
1.6 |
Reliance Industries Ltd. |
1.5 |
Kia Corp. |
1.4 | Excludes cash equivalents. |
|
| Material Fund Change [Text Block] |
|
|
| C000254865 |
|
|
| Shareholder Report [Line Items] |
|
|
| Fund Name |
Ninety One International Franchise Fund
|
|
| Class Name |
R5
|
|
| Trading Symbol |
ZIFIX
|
|
| Annual or Semi-Annual Statement [Text Block] |
This semi-annual shareholder report contains important information about American Beacon Ninety One International Franchise Fund for the period of September 1, 2025 to February 28, 2026.
|
|
| Additional Information [Text Block] |
You can find additional information about the Fund at www.americanbeaconfunds.com/fund-resources/. You can request this information by contacting us at 800-658-5811.
|
|
| Additional Information Phone Number |
800-658-5811
|
|
| Additional Information Website |
www.americanbeaconfunds.com/fund-resources/
|
|
| Expenses [Text Block] |
What were the Fund costs for the last six months?(based on a hypothetical $10,000 investment)
Table Summary
Class Name |
Costs of a $10,000 investment |
Costs paid as a percentage of a $10,000 investment |
R5 |
$42 |
0.87%Footnote Reference* |
| Footnote |
Description |
Footnote* |
Annualized. | |
|
| Expenses Paid, Amount |
$ 42
|
|
| Expense Ratio, Percent |
0.87%
|
[4] |
| AssetsNet |
$ 4,044,841
|
|
| Holdings Count | Holding |
33
|
|
| Advisory Fees Paid, Amount |
$ 0
|
|
| InvestmentCompanyPortfolioTurnover |
16.00%
|
|
| Additional Fund Statistics [Text Block] |
Table Summary
Total Net Assets |
$4,044,841 |
# of Portfolio Holdings |
33 |
Portfolio Turnover Rate |
16% |
Total Management Fees Paid |
$0 | |
|
| Holdings [Text Block] |
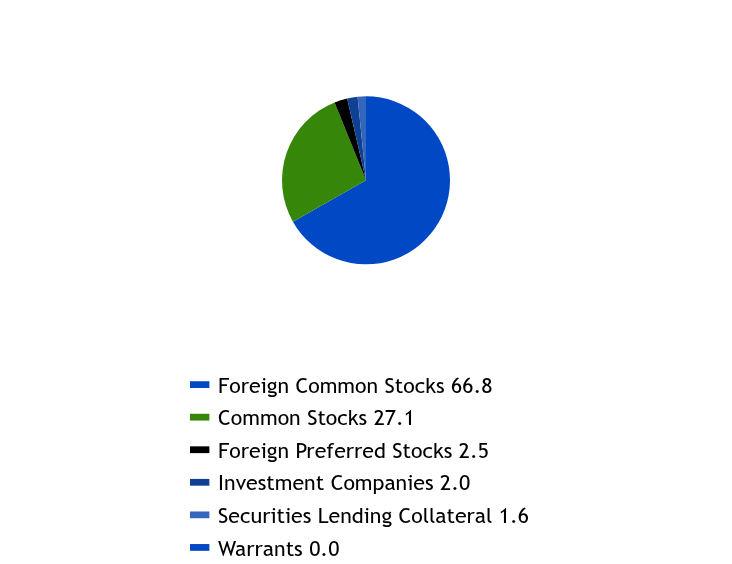
Asset Allocation - % Investments
Table Summary
Value |
Value |
Foreign Common Stocks |
66.8 |
Common Stocks |
27.1 |
Foreign Preferred Stocks |
2.5 |
Investment Companies |
2.0 |
Securities Lending Collateral |
1.6 |
Warrants |
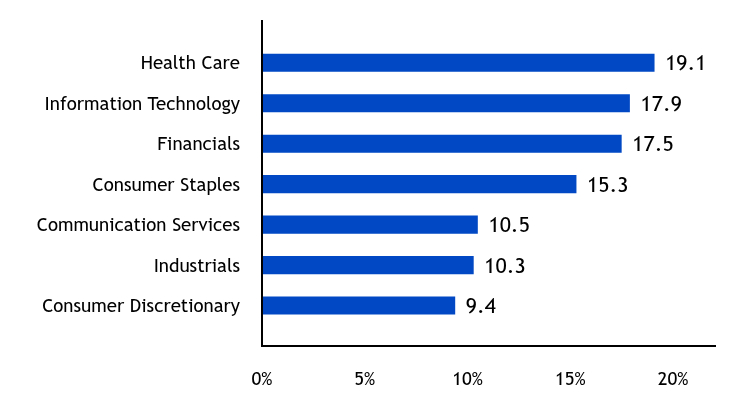
0.0 | Sector Allocation - % Equities
Table Summary
Value |
Value |
Consumer Discretionary |
9.4 |
Industrials |
10.3 |
Communication Services |
10.5 |
Consumer Staples |
15.3 |
Financials |
17.5 |
Information Technology |
17.9 |
Health Care |
19.1 | Excludes cash equivalents. |
|
| Largest Holdings [Text Block] |
Top Ten Holdings - % Net Assets
Table Summary
Taiwan Semiconductor Manufacturing Co. Ltd., ADR |
6.3 |
Mastercard, Inc., Class A |
5.9 |
SAP SE |
5.1 |
ASML Holding NV |
4.7 |
London Stock Exchange Group PLC |
4.6 |
Philip Morris International, Inc. |
4.6 |
Alcon AG |
4.5 |
Novartis AG |
4.3 |
L'Oreal SA |
4.2 |
Hermes International SCA |
4.1 | Excludes cash equivalents. |
|
| Material Fund Change [Text Block] |
|
|
| C000254863 |
|
|
| Shareholder Report [Line Items] |
|
|
| Fund Name |
Ninety One International Franchise Fund
|
|
| Class Name |
R6
|
|
| Trading Symbol |
ZIFRX
|
|
| Annual or Semi-Annual Statement [Text Block] |
This semi-annual shareholder report contains important information about American Beacon Ninety One International Franchise Fund for the period of September 1, 2025 to February 28, 2026.
|
|
| Additional Information [Text Block] |
You can find additional information about the Fund at www.americanbeaconfunds.com/fund-resources/. You can request this information by contacting us at 800-658-5811.
|
|
| Additional Information Phone Number |
800-658-5811
|
|
| Additional Information Website |
www.americanbeaconfunds.com/fund-resources/
|
|
| Expenses [Text Block] |
What were the Fund costs for the last six months?(based on a hypothetical $10,000 investment)
Table Summary
Class Name |
Costs of a $10,000 investment |
Costs paid as a percentage of a $10,000 investment |
R6 |
$40 |
0.84%Footnote Reference* |
| Footnote |
Description |
Footnote* |
Annualized. | |
|
| Expenses Paid, Amount |
$ 40
|
|
| Expense Ratio, Percent |
0.84%
|
[5] |
| AssetsNet |
$ 4,044,841
|
|
| Holdings Count | Holding |
33
|
|
| Advisory Fees Paid, Amount |
$ 0
|
|
| InvestmentCompanyPortfolioTurnover |
16.00%
|
|
| Additional Fund Statistics [Text Block] |
Table Summary
Total Net Assets |
$4,044,841 |
# of Portfolio Holdings |
33 |
Portfolio Turnover Rate |
16% |
Total Management Fees Paid |
$0 | |
|
| Holdings [Text Block] |
Asset Allocation - % Investments
Table Summary
Value |
Value |
Foreign Common Stocks |
66.8 |
Common Stocks |
27.1 |
Foreign Preferred Stocks |
2.5 |
Investment Companies |
2.0 |
Securities Lending Collateral |
1.6 |
Warrants |
0.0 | Sector Allocation - % Equities
Table Summary
Value |
Value |
Consumer Discretionary |
9.4 |
Industrials |
10.3 |
Communication Services |
10.5 |
Consumer Staples |
15.3 |
Financials |
17.5 |
Information Technology |
17.9 |
Health Care |
19.1 | Excludes cash equivalents. |
|
| Largest Holdings [Text Block] |
Top Ten Holdings - % Net Assets
Table Summary
Taiwan Semiconductor Manufacturing Co. Ltd., ADR |
6.3 |
Mastercard, Inc., Class A |
5.9 |
SAP SE |
5.1 |
ASML Holding NV |
4.7 |
London Stock Exchange Group PLC |
4.6 |
Philip Morris International, Inc. |
4.6 |
Alcon AG |
4.5 |
Novartis AG |
4.3 |
L'Oreal SA |
4.2 |
Hermes International SCA |
4.1 | Excludes cash equivalents. |
|
| Material Fund Change [Text Block] |
|
|
| C000254864 |
|
|
| Shareholder Report [Line Items] |
|
|
| Fund Name |
Ninety One International Franchise Fund
|
|
| Class Name |
Y
|
|
| Trading Symbol |
ZIFAX
|
|
| Annual or Semi-Annual Statement [Text Block] |
This semi-annual shareholder report contains important information about American Beacon Ninety One International Franchise Fund for the period of September 1, 2025 to February 28, 2026.
|
|
| Additional Information [Text Block] |
You can find additional information about the Fund at www.americanbeaconfunds.com/fund-resources/. You can request this information by contacting us at 800-658-5811.
|
|
| Additional Information Phone Number |
800-658-5811
|
|
| Additional Information Website |
www.americanbeaconfunds.com/fund-resources/
|
|
| Expenses [Text Block] |
What were the Fund costs for the last six months?(based on a hypothetical $10,000 investment)
Table Summary
Class Name |
Costs of a $10,000 investment |
Costs paid as a percentage of a $10,000 investment |
Y |
$45 |
0.94%Footnote Reference* |
| Footnote |
Description |
Footnote* |
Annualized. | |
|
| Expenses Paid, Amount |
$ 45
|
|
| Expense Ratio, Percent |
0.94%
|
[6] |
| AssetsNet |
$ 4,044,841
|
|
| Holdings Count | Holding |
33
|
|
| Advisory Fees Paid, Amount |
$ 0
|
|
| InvestmentCompanyPortfolioTurnover |
16.00%
|
|
| Additional Fund Statistics [Text Block] |
Table Summary
Total Net Assets |
$4,044,841 |
# of Portfolio Holdings |
33 |
Portfolio Turnover Rate |
16% |
Total Management Fees Paid |
$0 | |
|
| Holdings [Text Block] |
Asset Allocation - % Investments
Table Summary
Value |
Value |
Foreign Common Stocks |
66.8 |
Common Stocks |
27.1 |
Foreign Preferred Stocks |
2.5 |
Investment Companies |
2.0 |
Securities Lending Collateral |
1.6 |
Warrants |
0.0 | Sector Allocation - % Equities
Table Summary
Value |
Value |
Consumer Discretionary |
9.4 |
Industrials |
10.3 |
Communication Services |
10.5 |
Consumer Staples |
15.3 |
Financials |
17.5 |
Information Technology |
17.9 |
Health Care |
19.1 | Excludes cash equivalents. |
|
| Largest Holdings [Text Block] |
Top Ten Holdings - % Net Assets
Table Summary
Taiwan Semiconductor Manufacturing Co. Ltd., ADR |
6.3 |
Mastercard, Inc., Class A |
5.9 |
SAP SE |
5.1 |
ASML Holding NV |
4.7 |
London Stock Exchange Group PLC |
4.6 |
Philip Morris International, Inc. |
4.6 |
Alcon AG |
4.5 |
Novartis AG |
4.3 |
L'Oreal SA |
4.2 |
Hermes International SCA |
4.1 | Excludes cash equivalents. |
|
| Material Fund Change [Text Block] |
|
|
| C000254862 |
|
|
| Shareholder Report [Line Items] |
|
|
| Fund Name |
Ninety One Global Franchise Fund
|
|
| Class Name |
R5
|
|
| Trading Symbol |
ZGFIX
|
|
| Annual or Semi-Annual Statement [Text Block] |
This semi-annual shareholder report contains important information about American Beacon Ninety One Global Franchise Fund for the period of September 1, 2025 to February 28, 2026.
|
|
| Additional Information [Text Block] |
You can find additional information about the Fund at www.americanbeaconfunds.com/fund-resources/. You can request this information by contacting us at 800-658-5811.
|
|
| Additional Information Phone Number |
800-658-5811
|
|
| Additional Information Website |
www.americanbeaconfunds.com/fund-resources/
|
|
| Expenses [Text Block] |
What were the Fund costs for the last six months?(based on a hypothetical $10,000 investment)
Table Summary
Class Name |
Costs of a $10,000 investment |
Costs paid as a percentage of a $10,000 investment |
R5 |
$43 |
0.86%Footnote Reference* |
| Footnote |
Description |
Footnote* |
Annualized. | |
|
| Expenses Paid, Amount |
$ 43
|
|
| Expense Ratio, Percent |
0.86%
|
[7] |
| AssetsNet |
$ 459,555,794
|
|
| Holdings Count | Holding |
29
|
|
| Advisory Fees Paid, Amount |
$ 1,472,684
|
|
| InvestmentCompanyPortfolioTurnover |
7.00%
|
|
| Additional Fund Statistics [Text Block] |
Table Summary
Total Net Assets |
$459,555,794 |
# of Portfolio Holdings |
29 |
Portfolio Turnover Rate |
7% |
Total Management Fees Paid |
$1,472,684 | |
|
| Holdings [Text Block] |
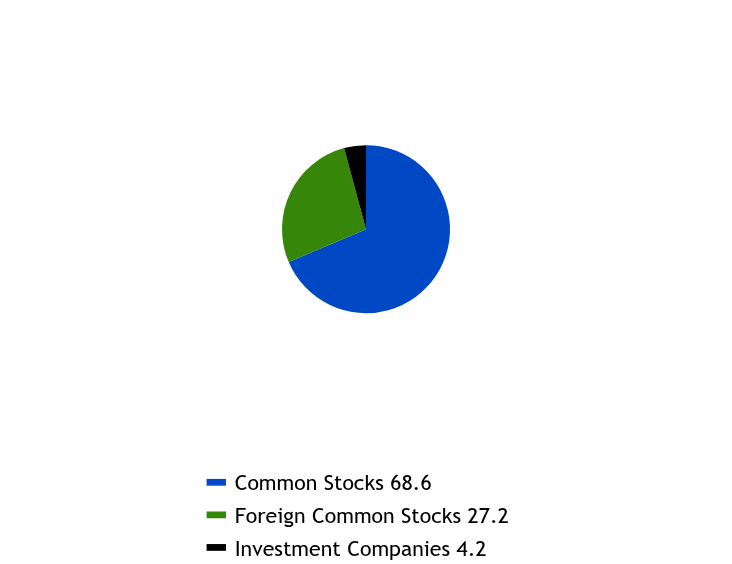
Asset Allocation - % Investments
Table Summary
Value |
Value |
Common Stocks |
68.6 |
Foreign Common Stocks |
27.2 |
Investment Companies |
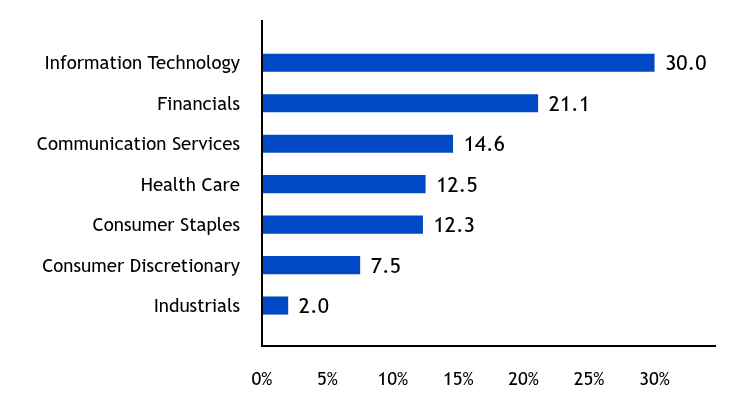
4.2 | Sector Allocation - % Equities
Table Summary
Value |
Value |
Industrials |
2.0 |
Consumer Discretionary |
7.5 |
Consumer Staples |
12.3 |
Health Care |
12.5 |
Communication Services |
14.6 |
Financials |
21.1 |
Information Technology |
30.0 | Excludes cash equivalents. |
|
| Largest Holdings [Text Block] |
Top Ten Holdings - % Net Assets
Table Summary
ASML Holding NV |
8.9 |
Visa, Inc., Class A |
7.9 |
Alphabet, Inc., Class A |
6.8 |
Philip Morris International, Inc. |
6.0 |
Microsoft Corp. |
4.6 |
Booking Holdings, Inc. |
4.3 |
Roche Holding AG |
3.8 |
Electronic Arts, Inc. |
3.7 |
London Stock Exchange Group PLC |
3.7 |
Johnson & Johnson |
3.5 | Excludes cash equivalents. |
|
| Material Fund Change [Text Block] |
|
|
| C000254861 |
|
|
| Shareholder Report [Line Items] |
|
|
| Fund Name |
Ninety One Global Franchise Fund
|
|
| Class Name |
R6
|
|
| Trading Symbol |
ZGFRX
|
|
| Annual or Semi-Annual Statement [Text Block] |
This semi-annual shareholder report contains important information about American Beacon Ninety One Global Franchise Fund for the period of September 1, 2025 to February 28, 2026.
|
|
| Additional Information [Text Block] |
You can find additional information about the Fund at www.americanbeaconfunds.com/fund-resources/. You can request this information by contacting us at 800-658-5811.
|
|
| Additional Information Phone Number |
800-658-5811
|
|
| Additional Information Website |
www.americanbeaconfunds.com/fund-resources/
|
|
| Expenses [Text Block] |
What were the Fund costs for the last six months?(based on a hypothetical $10,000 investment)
Table Summary
Class Name |
Costs of a $10,000 investment |
Costs paid as a percentage of a $10,000 investment |
R6 |
$42 |
0.83%Footnote Reference* |
| Footnote |
Description |
Footnote* |
Annualized. | |
|
| Expenses Paid, Amount |
$ 42
|
|
| Expense Ratio, Percent |
0.83%
|
[8] |
| AssetsNet |
$ 459,555,794
|
|
| Holdings Count | Holding |
29
|
|
| Advisory Fees Paid, Amount |
$ 1,472,684
|
|
| InvestmentCompanyPortfolioTurnover |
7.00%
|
|
| Additional Fund Statistics [Text Block] |
Table Summary
Total Net Assets |
$459,555,794 |
# of Portfolio Holdings |
29 |
Portfolio Turnover Rate |
7% |
Total Management Fees Paid |
$1,472,684 | |
|
| Holdings [Text Block] |
Asset Allocation - % Investments
Table Summary
Value |
Value |
Common Stocks |
68.6 |
Foreign Common Stocks |
27.2 |
Investment Companies |
4.2 | Sector Allocation - % Equities
Table Summary
Value |
Value |
Industrials |
2.0 |
Consumer Discretionary |
7.5 |
Consumer Staples |
12.3 |
Health Care |
12.5 |
Communication Services |
14.6 |
Financials |
21.1 |
Information Technology |
30.0 | Excludes cash equivalents. |
|
| Largest Holdings [Text Block] |
Top Ten Holdings - % Net Assets
Table Summary
ASML Holding NV |
8.9 |
Visa, Inc., Class A |
7.9 |
Alphabet, Inc., Class A |
6.8 |
Philip Morris International, Inc. |
6.0 |
Microsoft Corp. |
4.6 |
Booking Holdings, Inc. |
4.3 |
Roche Holding AG |
3.8 |
Electronic Arts, Inc. |
3.7 |
London Stock Exchange Group PLC |
3.7 |
Johnson & Johnson |
3.5 | Excludes cash equivalents. |
|
| Material Fund Change [Text Block] |
|
|
| C000254860 |
|
|
| Shareholder Report [Line Items] |
|
|
| Fund Name |
Ninety One Global Franchise Fund
|
|
| Class Name |
Y
|
|
| Trading Symbol |
ZGFAX
|
|
| Annual or Semi-Annual Statement [Text Block] |
This semi-annual shareholder report contains important information about American Beacon Ninety One Global Franchise Fund for the period of September 1, 2025 to February 28, 2026.
|
|
| Additional Information [Text Block] |
You can find additional information about the Fund at www.americanbeaconfunds.com/fund-resources/. You can request this information by contacting us at 800-658-5811.
|
|
| Additional Information Phone Number |
800-658-5811
|
|
| Additional Information Website |
www.americanbeaconfunds.com/fund-resources/
|
|
| Expenses [Text Block] |
What were the Fund costs for the last six months?(based on a hypothetical $10,000 investment)
Table Summary
Class Name |
Costs of a $10,000 investment |
Costs paid as a percentage of a $10,000 investment |
Y |
$43 |
0.86%Footnote Reference* |
| Footnote |
Description |
Footnote* |
Annualized. | |
|
| Expenses Paid, Amount |
$ 43
|
|
| Expense Ratio, Percent |
0.86%
|
[9] |
| AssetsNet |
$ 459,555,794
|
|
| Holdings Count | Holding |
29
|
|
| Advisory Fees Paid, Amount |
$ 1,472,684
|
|
| InvestmentCompanyPortfolioTurnover |
7.00%
|
|
| Additional Fund Statistics [Text Block] |
Table Summary
Total Net Assets |
$459,555,794 |
# of Portfolio Holdings |
29 |
Portfolio Turnover Rate |
7% |
Total Management Fees Paid |
$1,472,684 | |
|
| Holdings [Text Block] |
Asset Allocation - % Investments
Table Summary
Value |
Value |
Common Stocks |
68.6 |
Foreign Common Stocks |
27.2 |
Investment Companies |
4.2 | Sector Allocation - % Equities
Table Summary
Value |
Value |
Industrials |
2.0 |
Consumer Discretionary |
7.5 |
Consumer Staples |
12.3 |
Health Care |
12.5 |
Communication Services |
14.6 |
Financials |
21.1 |
Information Technology |
30.0 | Excludes cash equivalents. |
|
| Largest Holdings [Text Block] |
Top Ten Holdings - % Net Assets
Table Summary
ASML Holding NV |
8.9 |
Visa, Inc., Class A |
7.9 |
Alphabet, Inc., Class A |
6.8 |
Philip Morris International, Inc. |
6.0 |
Microsoft Corp. |
4.6 |
Booking Holdings, Inc. |
4.3 |
Roche Holding AG |
3.8 |
Electronic Arts, Inc. |
3.7 |
London Stock Exchange Group PLC |
3.7 |
Johnson & Johnson |
3.5 | Excludes cash equivalents. |
|
| Material Fund Change [Text Block] |
|
|
| C000096903 |
|
|
| Shareholder Report [Line Items] |
|
|
| Fund Name |
SiM High Yield Opportunities Fund
|
|
| Class Name |
A
|
|
| Trading Symbol |
SHOAX
|
|
| Annual or Semi-Annual Statement [Text Block] |
This semi-annual shareholder report contains important information about American Beacon SiM High Yield Opportunities Fund for the period of September 1, 2025 to February 28, 2026.
|
|
| Additional Information [Text Block] |
You can find additional information about the Fund at www.americanbeaconfunds.com/fund-resources/. You can request this information by contacting us at 800-658-5811.
|
|
| Additional Information Phone Number |
800-658-5811
|
|
| Additional Information Website |
www.americanbeaconfunds.com/fund-resources/
|
|
| Expenses [Text Block] |
What were the Fund costs for the last six months?(based on a hypothetical $10,000 investment)
Table Summary
Class Name |
Costs of a $10,000 investment |
Costs paid as a percentage of a $10,000 investment |
Class A |
$55 |
1.08%Footnote Reference* |
| Footnote |
Description |
Footnote* |
Annualized. | |
|
| Expenses Paid, Amount |
$ 55
|
|
| Expense Ratio, Percent |
1.08%
|
[10] |
| AssetsNet |
$ 2,213,932,522
|
|
| Holdings Count | Holding |
120
|
|
| Advisory Fees Paid, Amount |
$ 6,126,430
|
|
| InvestmentCompanyPortfolioTurnover |
17.00%
|
|
| Additional Fund Statistics [Text Block] |
Table Summary
Total Net Assets |
$2,213,932,522 |
# of Portfolio Holdings |
120 |
Portfolio Turnover Rate |
17% |
Total Management Fees Paid |
$6,126,430 | |
|
| Holdings [Text Block] |
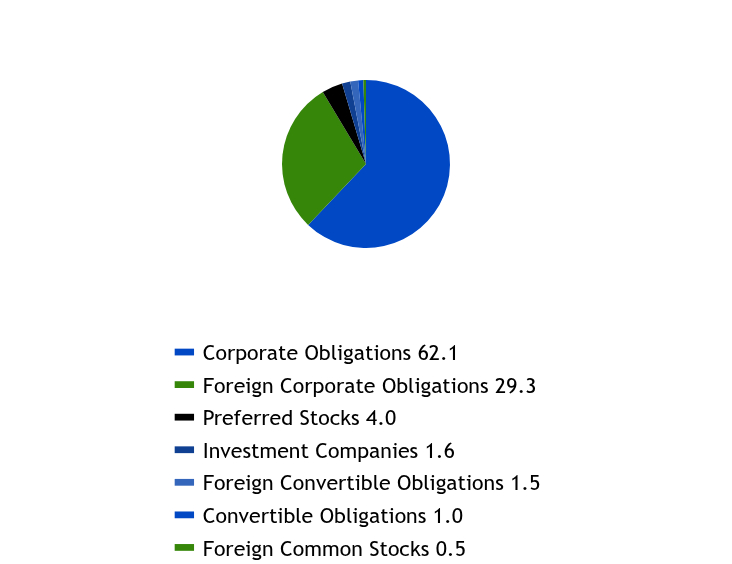
Asset Allocation - % Investments
Table Summary
Value |
Value |
Corporate Obligations |
62.1 |
Foreign Corporate Obligations |
29.3 |
Preferred Stocks |
4.0 |
Investment Companies |
1.6 |
Foreign Convertible Obligations |
1.5 |
Convertible Obligations |
1.0 |
Foreign Common Stocks |
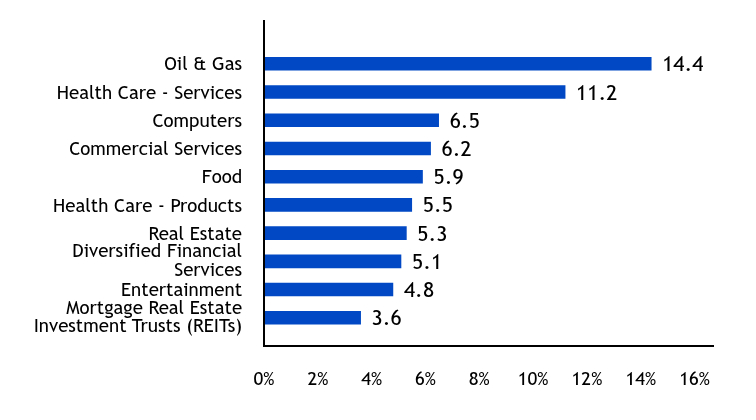
0.5 | Excludes foreign exchange holdings. Top Ten Industry Allocations - % Investments
Table Summary
Value |
Value |
Mortgage Real Estate Investment Trusts (REITs) |
3.6 |
Entertainment |
4.8 |
Diversified Financial Services |
5.1 |
Real Estate |
5.3 |
Health Care - Products |
5.5 |
Food |
5.9 |
Commercial Services |
6.2 |
Computers |
6.5 |
Health Care - Services |
11.2 |
Oil & Gas |
14.4 | Excludes cash equivalents. |
|
| Largest Holdings [Text Block] |
Top Ten Holdings - % Net Assets
Table Summary
Select Medical Corp., 6.250%, Due 12/1/2032 |
1.7 |
Paratus Energy Services Ltd., 9.500%, Due 6/27/2029 |
1.6 |
Tenet Healthcare Corp., 5.500%, Due 11/15/2032 |
1.6 |
Minerva Luxembourg SA, 8.875%, Due 9/13/2033 |
1.6 |
GEO Group, Inc., 10.250%, Due 4/15/2031 |
1.5 |
Industrial F&B Investments III, Inc., 7.750%, Due 2/11/2033 |
1.5 |
Verve Group SE, 6.019%, Due 4/1/2029 |
1.5 |
Cerdia Finanz GmbH, 9.375%, Due 10/3/2031 |
1.5 |
Flutter Treasury DAC, 5.875%, Due 6/4/2031 |
1.4 |
Amentum Holdings, Inc., 7.250%, Due 8/1/2032 |
1.3 | Excludes cash equivalents. |
|
| Material Fund Change [Text Block] |
|
|
| C000096904 |
|
|
| Shareholder Report [Line Items] |
|
|
| Fund Name |
SiM High Yield Opportunities Fund
|
|
| Class Name |
C
|
|
| Trading Symbol |
SHOCX
|
|
| Annual or Semi-Annual Statement [Text Block] |
This semi-annual shareholder report contains important information about American Beacon SiM High Yield Opportunities Fund for the period of September 1, 2025 to February 28, 2026.
|
|
| Additional Information [Text Block] |
You can find additional information about the Fund at www.americanbeaconfunds.com/fund-resources/. You can request this information by contacting us at 800-658-5811.
|
|
| Additional Information Phone Number |
800-658-5811
|
|
| Additional Information Website |
www.americanbeaconfunds.com/fund-resources/
|
|
| Expenses [Text Block] |
What were the Fund costs for the last six months?(based on a hypothetical $10,000 investment)
Table Summary
Class Name |
Costs of a $10,000 investment |
Costs paid as a percentage of a $10,000 investment |
Class C |
$92 |
1.82%Footnote Reference* |
| Footnote |
Description |
Footnote* |
Annualized. | |
|
| Expenses Paid, Amount |
$ 92
|
|
| Expense Ratio, Percent |
1.82%
|
[11] |
| AssetsNet |
$ 2,213,932,522
|
|
| Holdings Count | Holding |
120
|
|
| Advisory Fees Paid, Amount |
$ 6,126,430
|
|
| InvestmentCompanyPortfolioTurnover |
17.00%
|
|
| Additional Fund Statistics [Text Block] |
Table Summary
Total Net Assets |
$2,213,932,522 |
# of Portfolio Holdings |
120 |
Portfolio Turnover Rate |
17% |
Total Management Fees Paid |
$6,126,430 | |
|
| Holdings [Text Block] |
Asset Allocation - % Investments
Table Summary
Value |
Value |
Corporate Obligations |
62.1 |
Foreign Corporate Obligations |
29.3 |
Preferred Stocks |
4.0 |
Investment Companies |
1.6 |
Foreign Convertible Obligations |
1.5 |
Convertible Obligations |
1.0 |
Foreign Common Stocks |
0.5 | Excludes foreign exchange holdings. Top Ten Industry Allocations - % Investments
Table Summary
Value |
Value |
Mortgage Real Estate Investment Trusts (REITs) |
3.6 |
Entertainment |
4.8 |
Diversified Financial Services |
5.1 |
Real Estate |
5.3 |
Health Care - Products |
5.5 |
Food |
5.9 |
Commercial Services |
6.2 |
Computers |
6.5 |
Health Care - Services |
11.2 |
Oil & Gas |
14.4 | Excludes cash equivalents. |
|
| Largest Holdings [Text Block] |
Top Ten Holdings - % Net Assets
Table Summary
Select Medical Corp., 6.250%, Due 12/1/2032 |
1.7 |
Paratus Energy Services Ltd., 9.500%, Due 6/27/2029 |
1.6 |
Tenet Healthcare Corp., 5.500%, Due 11/15/2032 |
1.6 |
Minerva Luxembourg SA, 8.875%, Due 9/13/2033 |
1.6 |
GEO Group, Inc., 10.250%, Due 4/15/2031 |
1.5 |
Industrial F&B Investments III, Inc., 7.750%, Due 2/11/2033 |
1.5 |
Verve Group SE, 6.019%, Due 4/1/2029 |
1.5 |
Cerdia Finanz GmbH, 9.375%, Due 10/3/2031 |
1.5 |
Flutter Treasury DAC, 5.875%, Due 6/4/2031 |
1.4 |
Amentum Holdings, Inc., 7.250%, Due 8/1/2032 |
1.3 | Excludes cash equivalents. |
|
| Material Fund Change [Text Block] |
|
|
| C000096907 |
|
|
| Shareholder Report [Line Items] |
|
|
| Fund Name |
SiM High Yield Opportunities Fund
|
|
| Class Name |
Investor
|
|
| Trading Symbol |
SHYPX
|
|
| Annual or Semi-Annual Statement [Text Block] |
This semi-annual shareholder report contains important information about American Beacon SiM High Yield Opportunities Fund for the period of September 1, 2025 to February 28, 2026.
|
|
| Additional Information [Text Block] |
You can find additional information about the Fund at www.americanbeaconfunds.com/fund-resources/. You can request this information by contacting us at 800-658-5811.
|
|
| Additional Information Phone Number |
800-658-5811
|
|
| Additional Information Website |
www.americanbeaconfunds.com/fund-resources/
|
|
| Expenses [Text Block] |
What were the Fund costs for the last six months?(based on a hypothetical $10,000 investment)
Table Summary
Class Name |
Costs of a $10,000 investment |
Costs paid as a percentage of a $10,000 investment |
Investor |
$56 |
1.11%Footnote Reference* |
| Footnote |
Description |
Footnote* |
Annualized. | |
|
| Expenses Paid, Amount |
$ 56
|
|
| Expense Ratio, Percent |
1.11%
|
[12] |
| AssetsNet |
$ 2,213,932,522
|
|
| Holdings Count | Holding |
120
|
|
| Advisory Fees Paid, Amount |
$ 6,126,430
|
|
| InvestmentCompanyPortfolioTurnover |
17.00%
|
|
| Additional Fund Statistics [Text Block] |
Table Summary
Total Net Assets |
$2,213,932,522 |
# of Portfolio Holdings |
120 |
Portfolio Turnover Rate |
17% |
Total Management Fees Paid |
$6,126,430 | |
|
| Holdings [Text Block] |
Asset Allocation - % Investments
Table Summary
Value |
Value |
Corporate Obligations |
62.1 |
Foreign Corporate Obligations |
29.3 |
Preferred Stocks |
4.0 |
Investment Companies |
1.6 |
Foreign Convertible Obligations |
1.5 |
Convertible Obligations |
1.0 |
Foreign Common Stocks |
0.5 | Excludes foreign exchange holdings. Top Ten Industry Allocations - % Investments
Table Summary
Value |
Value |
Mortgage Real Estate Investment Trusts (REITs) |
3.6 |
Entertainment |
4.8 |
Diversified Financial Services |
5.1 |
Real Estate |
5.3 |
Health Care - Products |
5.5 |
Food |
5.9 |
Commercial Services |
6.2 |
Computers |
6.5 |
Health Care - Services |
11.2 |
Oil & Gas |
14.4 | Excludes cash equivalents. |
|
| Largest Holdings [Text Block] |
Top Ten Holdings - % Net Assets
Table Summary
Select Medical Corp., 6.250%, Due 12/1/2032 |
1.7 |
Paratus Energy Services Ltd., 9.500%, Due 6/27/2029 |
1.6 |
Tenet Healthcare Corp., 5.500%, Due 11/15/2032 |
1.6 |
Minerva Luxembourg SA, 8.875%, Due 9/13/2033 |
1.6 |
GEO Group, Inc., 10.250%, Due 4/15/2031 |
1.5 |
Industrial F&B Investments III, Inc., 7.750%, Due 2/11/2033 |
1.5 |
Verve Group SE, 6.019%, Due 4/1/2029 |
1.5 |
Cerdia Finanz GmbH, 9.375%, Due 10/3/2031 |
1.5 |
Flutter Treasury DAC, 5.875%, Due 6/4/2031 |
1.4 |
Amentum Holdings, Inc., 7.250%, Due 8/1/2032 |
1.3 | Excludes cash equivalents. |
|
| Material Fund Change [Text Block] |
|
|
| C000096905 |
|
|
| Shareholder Report [Line Items] |
|
|
| Fund Name |
SiM High Yield Opportunities Fund
|
|
| Class Name |
R5
|
|
| Trading Symbol |
SHOIX
|
|
| Annual or Semi-Annual Statement [Text Block] |
This semi-annual shareholder report contains important information about American Beacon SiM High Yield Opportunities Fund for the period of September 1, 2025 to February 28, 2026.
|
|
| Additional Information [Text Block] |
You can find additional information about the Fund at www.americanbeaconfunds.com/fund-resources/. You can request this information by contacting us at 800-658-5811.
|
|
| Additional Information Phone Number |
800-658-5811
|
|
| Additional Information Website |
www.americanbeaconfunds.com/fund-resources/
|
|
| Expenses [Text Block] |
What were the Fund costs for the last six months?(based on a hypothetical $10,000 investment)
Table Summary
Class Name |
Costs of a $10,000 investment |
Costs paid as a percentage of a $10,000 investment |
R5 |
$38 |
0.75%Footnote Reference* |
| Footnote |
Description |
Footnote* |
Annualized. | |
|
| Expenses Paid, Amount |
$ 38
|
|
| Expense Ratio, Percent |
0.75%
|
[13] |
| AssetsNet |
$ 2,213,932,522
|
|
| Holdings Count | Holding |
120
|
|
| Advisory Fees Paid, Amount |
$ 6,126,430
|
|
| InvestmentCompanyPortfolioTurnover |
17.00%
|
|
| Additional Fund Statistics [Text Block] |
Table Summary
Total Net Assets |
$2,213,932,522 |
# of Portfolio Holdings |
120 |
Portfolio Turnover Rate |
17% |
Total Management Fees Paid |
$6,126,430 | |
|
| Holdings [Text Block] |
Asset Allocation - % Investments
Table Summary
Value |
Value |
Corporate Obligations |
62.1 |
Foreign Corporate Obligations |
29.3 |
Preferred Stocks |
4.0 |
Investment Companies |
1.6 |
Foreign Convertible Obligations |
1.5 |
Convertible Obligations |
1.0 |
Foreign Common Stocks |
0.5 | Excludes foreign exchange holdings. Top Ten Industry Allocations - % Investments
Table Summary
Value |
Value |
Mortgage Real Estate Investment Trusts (REITs) |
3.6 |
Entertainment |
4.8 |
Diversified Financial Services |
5.1 |
Real Estate |
5.3 |
Health Care - Products |
5.5 |
Food |
5.9 |
Commercial Services |
6.2 |
Computers |
6.5 |
Health Care - Services |
11.2 |
Oil & Gas |
14.4 | Excludes cash equivalents. |
|
| Largest Holdings [Text Block] |
Top Ten Holdings - % Net Assets
Table Summary
Select Medical Corp., 6.250%, Due 12/1/2032 |
1.7 |
Paratus Energy Services Ltd., 9.500%, Due 6/27/2029 |
1.6 |
Tenet Healthcare Corp., 5.500%, Due 11/15/2032 |
1.6 |
Minerva Luxembourg SA, 8.875%, Due 9/13/2033 |
1.6 |
GEO Group, Inc., 10.250%, Due 4/15/2031 |
1.5 |
Industrial F&B Investments III, Inc., 7.750%, Due 2/11/2033 |
1.5 |
Verve Group SE, 6.019%, Due 4/1/2029 |
1.5 |
Cerdia Finanz GmbH, 9.375%, Due 10/3/2031 |
1.5 |
Flutter Treasury DAC, 5.875%, Due 6/4/2031 |
1.4 |
Amentum Holdings, Inc., 7.250%, Due 8/1/2032 |
1.3 | Excludes cash equivalents. |
|
| Material Fund Change [Text Block] |
|
|
| C000096906 |
|
|
| Shareholder Report [Line Items] |
|
|
| Fund Name |
SiM High Yield Opportunities Fund
|
|
| Class Name |
Y
|
|
| Trading Symbol |
SHOYX
|
|
| Annual or Semi-Annual Statement [Text Block] |
This semi-annual shareholder report contains important information about American Beacon SiM High Yield Opportunities Fund for the period of September 1, 2025 to February 28, 2026.
|
|
| Additional Information [Text Block] |
You can find additional information about the Fund at www.americanbeaconfunds.com/fund-resources/. You can request this information by contacting us at 800-658-5811.
|
|
| Additional Information Phone Number |
800-658-5811
|
|
| Additional Information Website |
www.americanbeaconfunds.com/fund-resources/
|
|
| Expenses [Text Block] |
What were the Fund costs for the last six months?(based on a hypothetical $10,000 investment)
Table Summary
Class Name |
Costs of a $10,000 investment |
Costs paid as a percentage of a $10,000 investment |
Y |
$39 |
0.76%Footnote Reference* |
| Footnote |
Description |
Footnote* |
Annualized. | |
|
| Expenses Paid, Amount |
$ 39
|
|
| Expense Ratio, Percent |
0.76%
|
[14] |
| AssetsNet |
$ 2,213,932,522
|
|
| Holdings Count | Holding |
120
|
|
| Advisory Fees Paid, Amount |
$ 6,126,430
|
|
| InvestmentCompanyPortfolioTurnover |
17.00%
|
|
| Additional Fund Statistics [Text Block] |
Table Summary
Total Net Assets |
$2,213,932,522 |
# of Portfolio Holdings |
120 |
Portfolio Turnover Rate |
17% |
Total Management Fees Paid |
$6,126,430 | |
|
| Holdings [Text Block] |
Asset Allocation - % Investments
Table Summary
Value |
Value |
Corporate Obligations |
62.1 |
Foreign Corporate Obligations |
29.3 |
Preferred Stocks |
4.0 |
Investment Companies |
1.6 |
Foreign Convertible Obligations |
1.5 |
Convertible Obligations |
1.0 |
Foreign Common Stocks |
0.5 | Excludes foreign exchange holdings. Top Ten Industry Allocations - % Investments
Table Summary
Value |
Value |
Mortgage Real Estate Investment Trusts (REITs) |
3.6 |
Entertainment |
4.8 |
Diversified Financial Services |
5.1 |
Real Estate |
5.3 |
Health Care - Products |
5.5 |
Food |
5.9 |
Commercial Services |
6.2 |
Computers |
6.5 |
Health Care - Services |
11.2 |
Oil & Gas |
14.4 | Excludes cash equivalents. |
|
| Largest Holdings [Text Block] |
Top Ten Holdings - % Net Assets
Table Summary
Select Medical Corp., 6.250%, Due 12/1/2032 |
1.7 |
Paratus Energy Services Ltd., 9.500%, Due 6/27/2029 |
1.6 |
Tenet Healthcare Corp., 5.500%, Due 11/15/2032 |
1.6 |
Minerva Luxembourg SA, 8.875%, Due 9/13/2033 |
1.6 |
GEO Group, Inc., 10.250%, Due 4/15/2031 |
1.5 |
Industrial F&B Investments III, Inc., 7.750%, Due 2/11/2033 |
1.5 |
Verve Group SE, 6.019%, Due 4/1/2029 |
1.5 |
Cerdia Finanz GmbH, 9.375%, Due 10/3/2031 |
1.5 |
Flutter Treasury DAC, 5.875%, Due 6/4/2031 |
1.4 |
Amentum Holdings, Inc., 7.250%, Due 8/1/2032 |
1.3 | Excludes cash equivalents. |
|
| Material Fund Change [Text Block] |
|
|
| C000114555 |
|
|
| Shareholder Report [Line Items] |
|
|
| Fund Name |
The London Company Income Equity Fund
|
|
| Class Name |
A
|
|
| Trading Symbol |
ABCAX
|
|
| Annual or Semi-Annual Statement [Text Block] |
This semi-annual shareholder report contains important information about American Beacon The London Company Income Equity Fund for the period of September 1, 2025 to February 28, 2026.
|
|
| Additional Information [Text Block] |
You can find additional information about the Fund at www.americanbeaconfunds.com/fund-resources/. You can request this information by contacting us at 800-658-5811.
|
|
| Additional Information Phone Number |
800-658-5811
|
|
| Additional Information Website |
www.americanbeaconfunds.com/fund-resources/
|
|
| Expenses [Text Block] |
What were the Fund costs for the last six months?(based on a hypothetical $10,000 investment)
Table Summary
Class Name |
Costs of a $10,000 investment |
Costs paid as a percentage of a $10,000 investment |
Class A |
$55 |
1.07%Footnote Reference* |
| Footnote |
Description |
Footnote* |
Annualized. | |
|
| Expenses Paid, Amount |
$ 55
|
|
| Expense Ratio, Percent |
1.07%
|
[15] |
| AssetsNet |
$ 1,141,278,917
|
|
| Holdings Count | Holding |
29
|
|
| Advisory Fees Paid, Amount |
$ 3,596,793
|
|
| InvestmentCompanyPortfolioTurnover |
7.00%
|
|
| Additional Fund Statistics [Text Block] |
Table Summary
Total Net Assets |
$1,141,278,917 |
# of Portfolio Holdings |
29 |
Portfolio Turnover Rate |
7% |
Total Management Fees Paid |
$3,596,793 | |
|
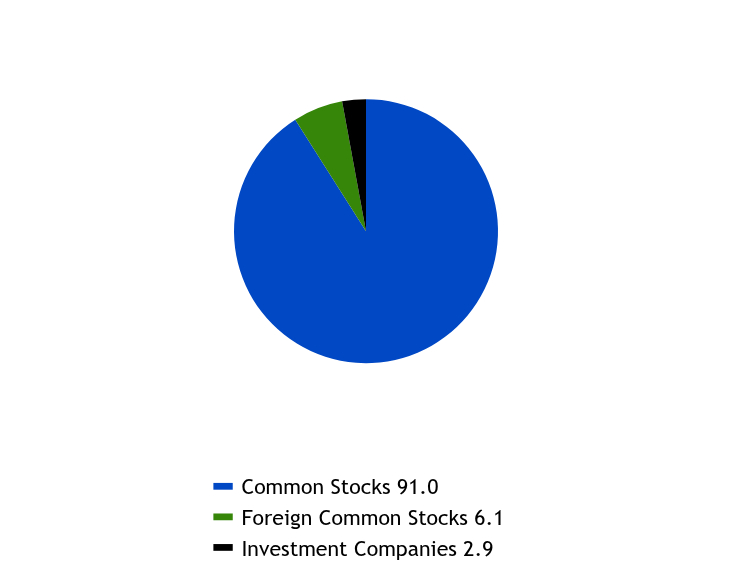
| Holdings [Text Block] |
Asset Allocation - % Investments
Table Summary
Value |
Value |
Common Stocks |
91.0 |
Foreign Common Stocks |
6.1 |
Investment Companies |
2.9 | The Fund may purchase and sell futures contracts to gain market exposure on cash balances. |
|
| Largest Holdings [Text Block] |
Top Ten Holdings - % Net Assets
Table Summary
Corning, Inc. |
9.1 |
Apple, Inc. |
5.0 |
Norfolk Southern Corp. |
5.0 |
Philip Morris International, Inc. |
4.6 |
Dominion Energy, Inc. |
4.5 |
Johnson & Johnson |
4.2 |
Blackrock, Inc. |
4.0 |
Cummins, Inc. |
3.8 |
Chevron Corp. |
3.8 |
Texas Instruments, Inc. |
3.7 | Excludes cash equivalents. |
|
| Material Fund Change [Text Block] |
|
|
| C000114556 |
|
|
| Shareholder Report [Line Items] |
|
|
| Fund Name |
The London Company Income Equity Fund
|
|
| Class Name |
C
|
|
| Trading Symbol |
ABECX
|
|
| Annual or Semi-Annual Statement [Text Block] |
This semi-annual shareholder report contains important information about American Beacon The London Company Income Equity Fund for the period of September 1, 2025 to February 28, 2026.
|
|
| Additional Information [Text Block] |
You can find additional information about the Fund at www.americanbeaconfunds.com/fund-resources/. You can request this information by contacting us at 800-658-5811.
|
|
| Additional Information Phone Number |
800-658-5811
|
|
| Additional Information Website |
www.americanbeaconfunds.com/fund-resources/
|
|
| Expenses [Text Block] |
What were the Fund costs for the last six months?(based on a hypothetical $10,000 investment)
Table Summary
Class Name |
Costs of a $10,000 investment |
Costs paid as a percentage of a $10,000 investment |
Class C |
$95 |
1.84%Footnote Reference* |
| Footnote |
Description |
Footnote* |
Annualized. | |
|
| Expenses Paid, Amount |
$ 95
|
|
| Expense Ratio, Percent |
1.84%
|
[16] |
| AssetsNet |
$ 1,141,278,917
|
|
| Holdings Count | Holding |
29
|
|
| Advisory Fees Paid, Amount |
$ 3,596,793
|
|
| InvestmentCompanyPortfolioTurnover |
7.00%
|
|
| Additional Fund Statistics [Text Block] |
Table Summary
Total Net Assets |
$1,141,278,917 |
# of Portfolio Holdings |
29 |
Portfolio Turnover Rate |
7% |
Total Management Fees Paid |
$3,596,793 | |
|
| Holdings [Text Block] |
Asset Allocation - % Investments
Table Summary
Value |
Value |
Common Stocks |
91.0 |
Foreign Common Stocks |
6.1 |
Investment Companies |
2.9 | The Fund may purchase and sell futures contracts to gain market exposure on cash balances. |
|
| Largest Holdings [Text Block] |
Top Ten Holdings - % Net Assets
Table Summary
Corning, Inc. |
9.1 |
Apple, Inc. |
5.0 |
Norfolk Southern Corp. |
5.0 |
Philip Morris International, Inc. |
4.6 |
Dominion Energy, Inc. |
4.5 |
Johnson & Johnson |
4.2 |
Blackrock, Inc. |
4.0 |
Cummins, Inc. |
3.8 |
Chevron Corp. |
3.8 |
Texas Instruments, Inc. |
3.7 | Excludes cash equivalents. |
|
| Material Fund Change [Text Block] |
|
|
| C000114559 |
|
|
| Shareholder Report [Line Items] |
|
|
| Fund Name |
The London Company Income Equity Fund
|
|
| Class Name |
Investor
|
|
| Trading Symbol |
ABCVX
|
|
| Annual or Semi-Annual Statement [Text Block] |
This semi-annual shareholder report contains important information about American Beacon The London Company Income Equity Fund for the period of September 1, 2025 to February 28, 2026.
|
|
| Additional Information [Text Block] |
You can find additional information about the Fund at www.americanbeaconfunds.com/fund-resources/. You can request this information by contacting us at 800-658-5811.
|
|
| Additional Information Phone Number |
800-658-5811
|
|
| Additional Information Website |
www.americanbeaconfunds.com/fund-resources/
|
|
| Expenses [Text Block] |
What were the Fund costs for the last six months?(based on a hypothetical $10,000 investment)
Table Summary
Class Name |
Costs of a $10,000 investment |
Costs paid as a percentage of a $10,000 investment |
Investor |
$54 |
1.05%Footnote Reference* |
| Footnote |
Description |
Footnote* |
Annualized. | |
|
| Expenses Paid, Amount |
$ 54
|
|
| Expense Ratio, Percent |
1.05%
|
[17] |
| AssetsNet |
$ 1,141,278,917
|
|
| Holdings Count | Holding |
29
|
|
| Advisory Fees Paid, Amount |
$ 3,596,793
|
|
| InvestmentCompanyPortfolioTurnover |
7.00%
|
|
| Additional Fund Statistics [Text Block] |
Table Summary
Total Net Assets |
$1,141,278,917 |
# of Portfolio Holdings |
29 |
Portfolio Turnover Rate |
7% |
Total Management Fees Paid |
$3,596,793 | |
|
| Holdings [Text Block] |
Asset Allocation - % Investments
Table Summary
Value |
Value |
Common Stocks |
91.0 |
Foreign Common Stocks |
6.1 |
Investment Companies |
2.9 | The Fund may purchase and sell futures contracts to gain market exposure on cash balances. |
|
| Largest Holdings [Text Block] |
Top Ten Holdings - % Net Assets
Table Summary
Corning, Inc. |
9.1 |
Apple, Inc. |
5.0 |
Norfolk Southern Corp. |
5.0 |
Philip Morris International, Inc. |
4.6 |
Dominion Energy, Inc. |
4.5 |
Johnson & Johnson |
4.2 |
Blackrock, Inc. |
4.0 |
Cummins, Inc. |
3.8 |
Chevron Corp. |
3.8 |
Texas Instruments, Inc. |
3.7 | Excludes cash equivalents. |
|
| Material Fund Change [Text Block] |
|
|
| C000114558 |
|
|
| Shareholder Report [Line Items] |
|
|
| Fund Name |
The London Company Income Equity Fund
|
|
| Class Name |
R5
|
|
| Trading Symbol |
ABCIX
|
|
| Annual or Semi-Annual Statement [Text Block] |
This semi-annual shareholder report contains important information about American Beacon The London Company Income Equity Fund for the period of September 1, 2025 to February 28, 2026.
|
|
| Additional Information [Text Block] |
You can find additional information about the Fund at www.americanbeaconfunds.com/fund-resources/. You can request this information by contacting us at 800-658-5811.
|
|
| Additional Information Phone Number |
800-658-5811
|
|
| Additional Information Website |
www.americanbeaconfunds.com/fund-resources/
|
|
| Expenses [Text Block] |
What were the Fund costs for the last six months?(based on a hypothetical $10,000 investment)
Table Summary
Class Name |
Costs of a $10,000 investment |
Costs paid as a percentage of a $10,000 investment |
R5 |
$40 |
0.77%Footnote Reference* |
| Footnote |
Description |
Footnote* |
Annualized. | |
|
| Expenses Paid, Amount |
$ 40
|
|
| Expense Ratio, Percent |
0.77%
|
[18] |
| AssetsNet |
$ 1,141,278,917
|
|
| Holdings Count | Holding |
29
|
|
| Advisory Fees Paid, Amount |
$ 3,596,793
|
|
| InvestmentCompanyPortfolioTurnover |
7.00%
|
|
| Additional Fund Statistics [Text Block] |
Table Summary
Total Net Assets |
$1,141,278,917 |
# of Portfolio Holdings |
29 |
Portfolio Turnover Rate |
7% |
Total Management Fees Paid |
$3,596,793 | |
|
| Holdings [Text Block] |
Asset Allocation - % Investments
Table Summary
Value |
Value |
Common Stocks |
91.0 |
Foreign Common Stocks |
6.1 |
Investment Companies |
2.9 | The Fund may purchase and sell futures contracts to gain market exposure on cash balances. |
|
| Largest Holdings [Text Block] |
Top Ten Holdings - % Net Assets
Table Summary
Corning, Inc. |
9.1 |
Apple, Inc. |
5.0 |
Norfolk Southern Corp. |
5.0 |
Philip Morris International, Inc. |
4.6 |
Dominion Energy, Inc. |
4.5 |
Johnson & Johnson |
4.2 |
Blackrock, Inc. |
4.0 |
Cummins, Inc. |
3.8 |
Chevron Corp. |
3.8 |
Texas Instruments, Inc. |
3.7 | Excludes cash equivalents. |
|
| Material Fund Change [Text Block] |
|
|
| C000222816 |
|
|
| Shareholder Report [Line Items] |
|
|
| Fund Name |
The London Company Income Equity Fund
|
|
| Class Name |
R6
|
|
| Trading Symbol |
ABCRX
|
|
| Annual or Semi-Annual Statement [Text Block] |
This semi-annual shareholder report contains important information about American Beacon The London Company Income Equity Fund for the period of September 1, 2025 to February 28, 2026.
|
|
| Additional Information [Text Block] |
You can find additional information about the Fund at www.americanbeaconfunds.com/fund-resources/. You can request this information by contacting us at 800-658-5811.
|
|
| Additional Information Phone Number |
800-658-5811
|
|
| Additional Information Website |
www.americanbeaconfunds.com/fund-resources/
|
|
| Expenses [Text Block] |
What were the Fund costs for the last six months?(based on a hypothetical $10,000 investment)
Table Summary
Class Name |
Costs of a $10,000 investment |
Costs paid as a percentage of a $10,000 investment |
R6 |
$38 |
0.73%Footnote Reference* |
| Footnote |
Description |
Footnote* |
Annualized. | |
|
| Expenses Paid, Amount |
$ 38
|
|
| Expense Ratio, Percent |
0.73%
|
[19] |
| AssetsNet |
$ 1,141,278,917
|
|
| Holdings Count | Holding |
29
|
|
| Advisory Fees Paid, Amount |
$ 3,596,793
|
|
| InvestmentCompanyPortfolioTurnover |
7.00%
|
|
| Additional Fund Statistics [Text Block] |
Table Summary
Total Net Assets |
$1,141,278,917 |
# of Portfolio Holdings |
29 |
Portfolio Turnover Rate |
7% |
Total Management Fees Paid |
$3,596,793 | |
|
| Holdings [Text Block] |
Asset Allocation - % Investments
Table Summary
Value |
Value |
Common Stocks |
91.0 |
Foreign Common Stocks |
6.1 |
Investment Companies |
2.9 | The Fund may purchase and sell futures contracts to gain market exposure on cash balances. |
|
| Largest Holdings [Text Block] |
Top Ten Holdings - % Net Assets
Table Summary
Corning, Inc. |
9.1 |
Apple, Inc. |
5.0 |
Norfolk Southern Corp. |
5.0 |
Philip Morris International, Inc. |
4.6 |
Dominion Energy, Inc. |
4.5 |
Johnson & Johnson |
4.2 |
Blackrock, Inc. |
4.0 |
Cummins, Inc. |
3.8 |
Chevron Corp. |
3.8 |
Texas Instruments, Inc. |
3.7 | Excludes cash equivalents. |
|
| Material Fund Change [Text Block] |
|
|
| C000114557 |
|
|
| Shareholder Report [Line Items] |
|
|
| Fund Name |
The London Company Income Equity Fund
|
|
| Class Name |
Y
|
|
| Trading Symbol |
ABCYX
|
|
| Annual or Semi-Annual Statement [Text Block] |
This semi-annual shareholder report contains important information about American Beacon The London Company Income Equity Fund for the period of September 1, 2025 to February 28, 2026.
|
|
| Additional Information [Text Block] |
You can find additional information about the Fund at www.americanbeaconfunds.com/fund-resources/. You can request this information by contacting us at 800-658-5811.
|
|
| Additional Information Phone Number |
800-658-5811
|
|
| Additional Information Website |
www.americanbeaconfunds.com/fund-resources/
|
|
| Expenses [Text Block] |
What were the Fund costs for the last six months?(based on a hypothetical $10,000 investment)
Table Summary
Class Name |
Costs of a $10,000 investment |
Costs paid as a percentage of a $10,000 investment |
Y |
$42 |
0.82%Footnote Reference* |
| Footnote |
Description |
Footnote* |
Annualized. | |
|
| Expenses Paid, Amount |
$ 42
|
|
| Expense Ratio, Percent |
0.82%
|
[20] |
| AssetsNet |
$ 1,141,278,917
|
|
| Holdings Count | Holding |
29
|
|
| Advisory Fees Paid, Amount |
$ 3,596,793
|
|
| InvestmentCompanyPortfolioTurnover |
7.00%
|
|
| Additional Fund Statistics [Text Block] |
Table Summary
Total Net Assets |
$1,141,278,917 |
# of Portfolio Holdings |
29 |
Portfolio Turnover Rate |
7% |
Total Management Fees Paid |
$3,596,793 | |
|
| Holdings [Text Block] |
Asset Allocation - % Investments
Table Summary
Value |
Value |
Common Stocks |
91.0 |
Foreign Common Stocks |
6.1 |
Investment Companies |
2.9 | The Fund may purchase and sell futures contracts to gain market exposure on cash balances. |
|
| Largest Holdings [Text Block] |
Top Ten Holdings - % Net Assets
Table Summary
Corning, Inc. |
9.1 |
Apple, Inc. |
5.0 |
Norfolk Southern Corp. |
5.0 |
Philip Morris International, Inc. |
4.6 |
Dominion Energy, Inc. |
4.5 |
Johnson & Johnson |
4.2 |
Blackrock, Inc. |
4.0 |
Cummins, Inc. |
3.8 |
Chevron Corp. |
3.8 |
Texas Instruments, Inc. |
3.7 | Excludes cash equivalents. |
|
| Material Fund Change [Text Block] |
|
|
|
|