Shareholder Report
|
6 Months Ended |
12 Months Ended |
Sep. 01, 2025 |
Feb. 28, 2026
USD ($)
Holding
|
| Shareholder Report [Line Items] |
|
|
| Document Type |
|
N-CSR
|
| Amendment Flag |
|
false
|
| Registrant Name |
|
Columbia Funds Series Trust
|
| Entity Central Index Key |
|
0001097519
|
| Entity Investment Company Type |
|
N-1A
|
| Document Period End Date |
|
Feb. 28, 2026
|
| Shareholder Report Annual or Semi-Annual |
|
Annual Shareholder Report
|
| C000029837 |
|
|
| Shareholder Report [Line Items] |
|
|
| Fund Name |
|
Columbia Convertible Securities Fund
|
| Class Name |
|
Class A
|
| Trading Symbol |
|
PACIX
|
| Annual or Semi-Annual Statement [Text Block] |
|
This annual shareholder report contains important information about Columbia Convertible Securities Fund (the Fund) for the period of March 1, 2025 to February 28, 2026.
|
| Additional Information [Text Block] |
|
You can find additional information about the Fund at columbiathreadneedleus.com/resources/literature. You can also request more information by contacting us at 1-800-345-6611.
|
| Additional Information Phone Number |
|
1-800-345-6611
|
| Additional Information Website |
|
columbiathreadneedleus.com/resources/literature
|
| Expenses [Text Block] |
|
What were the Fund costs for the reporting period? (Based on a hypothetical $10,000 investment)
Table Summary
Class |
Cost of a $10,000 investment |
Cost paid as a percentage of a $10,000 investment |
Class A |
$123 |
1.08% | |
| Expenses Paid, Amount |
|
$ 123
|
| Expense Ratio, Percent |
|
1.08%
|
| Factors Affecting Performance [Text Block] |
|
Management's Discussion of Fund Performance The performance of Class A shares for the period presented is shown in the Average Annual Total Returns table. Top Performance ContributorsStock selection | Selections in the health care and consumer discretionary sectors boosted the Fund’s relative performance most during the annual period. Allocations | An underweight allocation to the consumer discretionary sector buoyed relative Fund performance during the annual period. Individual holdings | Positions in Lumentum, an electrical product manufacturing company, Bloom Energy, a power generation company, and Eos Energy Enterprises, a battery storage solutions company were among the top contributors to the Fund’s relative performance. Top Performance DetractorsStock selection | Selections in the real estate and information technology sectors hurt the Fund’s relative performance during the annual period. Allocations | An underweight allocation to the consumer staples sector detracted from relative performance. Individual holdings | Positions in Rocket Lab USA, an aerospace company, Live Nation Entertainment, an entertainment company, and Coinbase Global, a crypto platform company, were among the top detractors from relative performance during the period. |
| Performance Past Does Not Indicate Future [Text] |
|
The Fund's past performance is not a good predictor of the Fund's future performance.
|
| Line Graph [Table Text Block] |
|
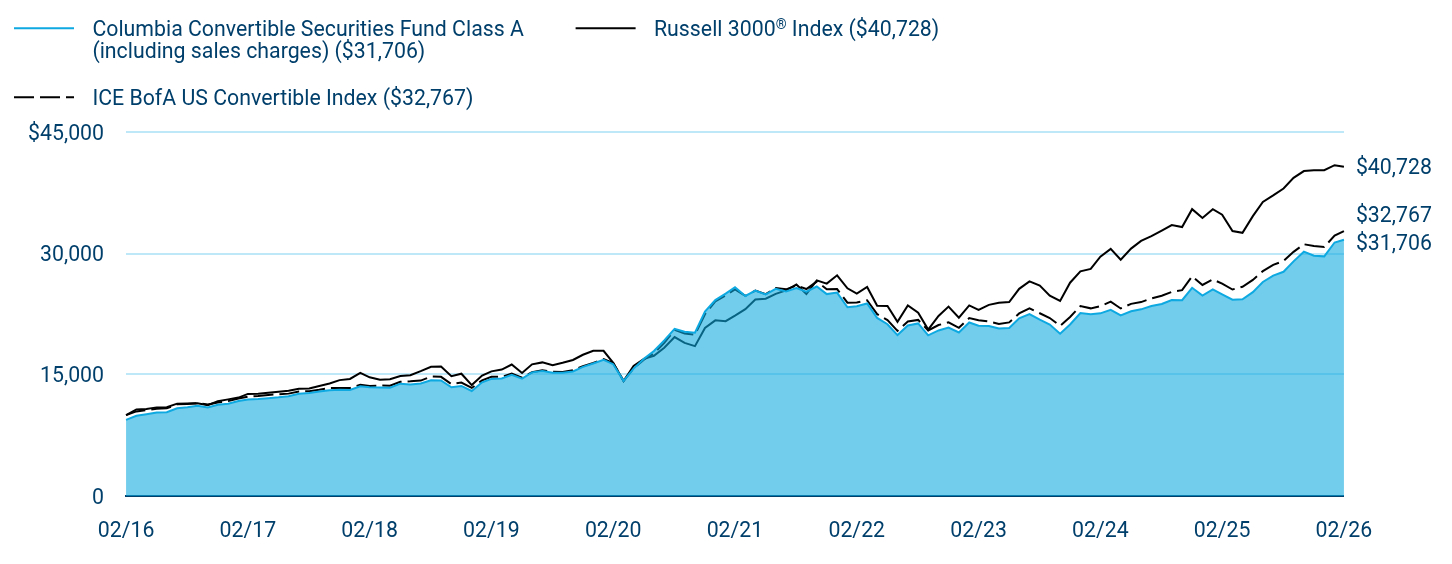
Table Summary
|
Columbia Convertible Securities Fund Class A (including sales charges) ($31,706) |
Russell 3000® Index ($40,728) |
ICE BofA US Convertible Index ($32,767) |
02/16 |
$9,425 |
$10,000 |
$10,000 |
03/16 |
$9,923 |
$10,704 |
$10,464 |
04/16 |
$10,104 |
$10,770 |
$10,617 |
05/16 |
$10,318 |
$10,963 |
$10,798 |
06/16 |
$10,373 |
$10,986 |
$10,844 |
07/16 |
$10,845 |
$11,422 |
$11,337 |
08/16 |
$10,990 |
$11,451 |
$11,369 |
09/16 |
$11,173 |
$11,469 |
$11,497 |
10/16 |
$10,945 |
$11,221 |
$11,307 |
11/16 |
$11,281 |
$11,723 |
$11,565 |
12/16 |
$11,401 |
$11,952 |
$11,739 |
01/17 |
$11,741 |
$12,176 |
$12,052 |
02/17 |
$11,939 |
$12,629 |
$12,282 |
03/17 |
$11,985 |
$12,638 |
$12,360 |
04/17 |
$12,101 |
$12,772 |
$12,497 |
05/17 |
$12,204 |
$12,903 |
$12,584 |
06/17 |
$12,338 |
$13,019 |
$12,664 |
07/17 |
$12,650 |
$13,264 |
$12,920 |
08/17 |
$12,753 |
$13,290 |
$12,968 |
09/17 |
$12,935 |
$13,614 |
$13,142 |
10/17 |
$13,085 |
$13,911 |
$13,357 |
11/17 |
$13,137 |
$14,334 |
$13,373 |
12/17 |
$13,120 |
$14,477 |
$13,347 |
01/18 |
$13,581 |
$15,240 |
$13,760 |
02/18 |
$13,449 |
$14,678 |
$13,605 |
03/18 |
$13,432 |
$14,384 |
$13,667 |
04/18 |
$13,393 |
$14,438 |
$13,639 |
05/18 |
$13,896 |
$14,846 |
$14,123 |
06/18 |
$13,781 |
$14,943 |
$14,182 |
07/18 |
$13,921 |
$15,439 |
$14,274 |
08/18 |
$14,307 |
$15,981 |
$14,776 |
09/18 |
$14,288 |
$16,008 |
$14,739 |
10/18 |
$13,446 |
$14,829 |
$13,848 |
11/18 |
$13,613 |
$15,126 |
$14,024 |
12/18 |
$12,989 |
$13,718 |
$13,367 |
01/19 |
$14,069 |
$14,896 |
$14,298 |
02/19 |
$14,485 |
$15,419 |
$14,738 |
03/19 |
$14,532 |
$15,645 |
$14,738 |
04/19 |
$14,978 |
$16,269 |
$15,134 |
05/19 |
$14,525 |
$15,216 |
$14,638 |
06/19 |
$15,294 |
$16,285 |
$15,306 |
07/19 |
$15,456 |
$16,527 |
$15,567 |
08/19 |
$15,259 |
$16,190 |
$15,375 |
09/19 |
$15,246 |
$16,475 |
$15,330 |
10/19 |
$15,409 |
$16,829 |
$15,572 |
11/19 |
$15,977 |
$17,469 |
$16,063 |
12/19 |
$16,384 |
$17,973 |
$16,462 |
01/20 |
$16,849 |
$17,954 |
$16,925 |
02/20 |
$16,303 |
$16,484 |
$16,447 |
03/20 |
$14,242 |
$14,217 |
$14,220 |
04/20 |
$15,758 |
$16,100 |
$15,797 |
05/20 |
$16,984 |
$16,961 |
$16,863 |
06/20 |
$17,938 |
$17,349 |
$17,654 |
07/20 |
$19,245 |
$18,334 |
$18,935 |
08/20 |
$20,683 |
$19,662 |
$20,557 |
09/20 |
$20,312 |
$18,946 |
$20,113 |
10/20 |
$20,197 |
$18,537 |
$19,948 |
11/20 |
$22,808 |
$20,792 |
$22,485 |
12/20 |
$24,229 |
$21,728 |
$24,070 |
01/21 |
$25,028 |
$21,631 |
$24,801 |
02/21 |
$25,818 |
$22,307 |
$25,564 |
03/21 |
$24,742 |
$23,107 |
$24,760 |
04/21 |
$25,405 |
$24,298 |
$25,400 |
05/21 |
$24,928 |
$24,409 |
$24,971 |
06/21 |
$25,619 |
$25,010 |
$25,731 |
07/21 |
$25,304 |
$25,433 |
$25,566 |
08/21 |
$25,724 |
$26,159 |
$26,041 |
09/21 |
$25,284 |
$24,985 |
$25,605 |
10/21 |
$25,914 |
$26,675 |
$26,522 |
11/21 |
$24,977 |
$26,269 |
$25,581 |
12/21 |
$25,167 |
$27,303 |
$25,597 |
01/22 |
$23,347 |
$25,697 |
$23,920 |
02/22 |
$23,485 |
$25,049 |
$23,927 |
03/22 |
$23,815 |
$25,862 |
$24,213 |
04/22 |
$22,029 |
$23,541 |
$22,495 |
05/22 |
$21,246 |
$23,509 |
$21,768 |
06/22 |
$19,909 |
$21,543 |
$20,424 |
07/22 |
$21,093 |
$23,564 |
$21,587 |
08/22 |
$21,352 |
$22,684 |
$21,784 |
09/22 |
$19,875 |
$20,581 |
$20,482 |
10/22 |
$20,481 |
$22,269 |
$21,149 |
11/22 |
$20,827 |
$23,431 |
$21,483 |
12/22 |
$20,230 |
$22,059 |
$20,808 |
01/23 |
$21,470 |
$23,578 |
$22,015 |
02/23 |
$21,068 |
$23,027 |
$21,731 |
03/23 |
$21,021 |
$23,643 |
$21,588 |
04/23 |
$20,736 |
$23,895 |
$21,287 |
05/23 |
$20,779 |
$23,988 |
$21,475 |
06/23 |
$21,986 |
$25,626 |
$22,588 |
07/23 |
$22,494 |
$26,544 |
$23,205 |
08/23 |
$21,821 |
$26,032 |
$22,604 |
09/23 |
$21,209 |
$24,792 |
$22,017 |
10/23 |
$20,076 |
$24,135 |
$21,048 |
11/23 |
$21,220 |
$26,385 |
$22,144 |
12/23 |
$22,639 |
$27,785 |
$23,486 |
01/24 |
$22,483 |
$28,093 |
$23,213 |
02/24 |
$22,595 |
$29,613 |
$23,491 |
03/24 |
$23,030 |
$30,569 |
$24,037 |
04/24 |
$22,333 |
$29,224 |
$23,200 |
05/24 |
$22,850 |
$30,604 |
$23,765 |
06/24 |
$23,090 |
$31,552 |
$23,986 |
07/24 |
$23,508 |
$32,138 |
$24,448 |
08/24 |
$23,756 |
$32,838 |
$24,768 |
09/24 |
$24,240 |
$33,517 |
$25,249 |
10/24 |
$24,228 |
$33,271 |
$25,461 |
11/24 |
$25,760 |
$35,484 |
$27,185 |
12/24 |
$24,791 |
$34,400 |
$26,102 |
01/25 |
$25,567 |
$35,486 |
$26,796 |
02/25 |
$24,951 |
$34,806 |
$26,261 |
03/25 |
$24,284 |
$32,775 |
$25,543 |
04/25 |
$24,341 |
$32,556 |
$25,888 |
05/25 |
$25,212 |
$34,619 |
$26,731 |
06/25 |
$26,471 |
$36,378 |
$27,811 |
07/25 |
$27,254 |
$37,179 |
$28,583 |
08/25 |
$27,737 |
$38,039 |
$29,081 |
09/25 |
$29,023 |
$39,352 |
$30,199 |
10/25 |
$30,224 |
$40,196 |
$31,143 |
11/25 |
$29,716 |
$40,306 |
$30,924 |
12/25 |
$29,644 |
$40,298 |
$30,795 |
01/26 |
$31,359 |
$40,923 |
$32,214 |
02/26 |
$31,706 |
$40,728 |
$32,767 |
|
| Average Annual Return [Table Text Block] |
|
Table Summary
Average Annual Total Returns (%) |
1 year |
5 years |
10 years |
Class A (excluding sales charges) |
27.07 |
4.19 |
12.90 |
Class A (including sales charges) |
19.79 |
2.97 |
12.23 |
Russell 3000® Index |
17.02 |
12.80 |
15.08 |
ICE BofA US Convertible Index |
24.77 |
5.09 |
12.60 | |
| No Deduction of Taxes [Text Block] |
|
Performance does not reflect the deduction of taxes that a shareholder may pay on fund distributions or on the redemptions of fund shares.
|
| Updated Performance Information Location [Text Block] |
|
columbiathreadneedleus.com/investment-products/mutual-funds
|
| AssetsNet |
|
$ 1,590,544,812
|
| Holdings Count | Holding |
|
118
|
| Advisory Fees Paid, Amount |
|
$ 10,354,758
|
| InvestmentCompanyPortfolioTurnover |
|
212.00%
|
| Additional Fund Statistics [Text Block] |
|
Table Summary
Fund net assets |
$1,590,544,812 |
Total number of portfolio holdings |
118 |
Management services fees (represents 0.77% of Fund average net assets) |
$10,354,758 |
Portfolio turnover for the reporting period |
212% | |
| Holdings [Text Block] |
|
Table Summary
Convertible Bonds |
78.2% |
Convertible Preferred Stocks |
18.0% |
Money Market Funds |
3.4% |
Common Stocks |
1.8% |
Other |
0.6% | |
| Largest Holdings [Text Block] |
|
Table Summary
Lumentum Holdings, Inc. 03/15/2032 0.375% |
4.6% |
Western Digital Corp. 11/15/2028 3.000% |
3.0% |
Bloom Energy Corp. 11/15/2030 0.000% |
2.6% |
Boeing Co. (The) 6.000% |
2.5% |
Live Nation Entertainment, Inc. 01/15/2030 2.875% |
2.3% |
Bank of America Corp. 7.250% |
2.3% |
NextEra Energy, Inc. 7.234% |
1.5% |
Ionis Pharmaceuticals, Inc. 12/01/2030 0.000% |
1.3% |
Akamai Technologies, Inc. 05/15/2033 0.250% |
1.3% |
Oracle Corp. 6.500% |
1.3% | |
| Material Fund Change [Text Block] |
|
|
| C000029839 |
|
|
| Shareholder Report [Line Items] |
|
|
| Fund Name |
|
Columbia Convertible Securities Fund
|
| Class Name |
|
Class C
|
| Trading Symbol |
|
PHIKX
|
| Annual or Semi-Annual Statement [Text Block] |
|
This annual shareholder report contains important information about Columbia Convertible Securities Fund (the Fund) for the period of March 1, 2025 to February 28, 2026.
|
| Additional Information [Text Block] |
|
You can find additional information about the Fund at columbiathreadneedleus.com/resources/literature. You can also request more information by contacting us at 1-800-345-6611.
|
| Additional Information Phone Number |
|
1-800-345-6611
|
| Additional Information Website |
|
columbiathreadneedleus.com/resources/literature
|
| Expenses [Text Block] |
|
What were the Fund costs for the reporting period? (Based on a hypothetical $10,000 investment)
Table Summary
Class |
Cost of a $10,000 investment |
Cost paid as a percentage of a $10,000 investment |
Class C |
$207 |
1.83% | |
| Expenses Paid, Amount |
|
$ 207
|
| Expense Ratio, Percent |
|
1.83%
|
| Factors Affecting Performance [Text Block] |
|
Management's Discussion of Fund Performance The performance of Class C shares for the period presented is shown in the Average Annual Total Returns table. Top Performance ContributorsStock selection | Selections in the health care and consumer discretionary sectors boosted the Fund’s relative performance most during the annual period. Allocations | An underweight allocation to the consumer discretionary sector buoyed relative Fund performance during the annual period. Individual holdings | Positions in Lumentum, an electrical product manufacturing company, Bloom Energy, a power generation company, and Eos Energy Enterprises, a battery storage solutions company were among the top contributors to the Fund’s relative performance. Top Performance DetractorsStock selection | Selections in the real estate and information technology sectors hurt the Fund’s relative performance during the annual period. Allocations | An underweight allocation to the consumer staples sector detracted from relative performance. Individual holdings | Positions in Rocket Lab USA, an aerospace company, Live Nation Entertainment, an entertainment company, and Coinbase Global, a crypto platform company, were among the top detractors from relative performance during the period. |
| Performance Past Does Not Indicate Future [Text] |
|
The Fund's past performance is not a good predictor of the Fund's future performance.
|
| Line Graph [Table Text Block] |
|

Table Summary
|
Columbia Convertible Securities Fund Class C (including sales charges) ($31,210) |
Russell 3000® Index ($40,728) |
ICE BofA US Convertible Index ($32,767) |
02/16 |
$10,000 |
$10,000 |
$10,000 |
03/16 |
$10,517 |
$10,704 |
$10,464 |
04/16 |
$10,704 |
$10,770 |
$10,617 |
05/16 |
$10,924 |
$10,963 |
$10,798 |
06/16 |
$10,976 |
$10,986 |
$10,844 |
07/16 |
$11,464 |
$11,422 |
$11,337 |
08/16 |
$11,617 |
$11,451 |
$11,369 |
09/16 |
$11,803 |
$11,469 |
$11,497 |
10/16 |
$11,555 |
$11,221 |
$11,307 |
11/16 |
$11,897 |
$11,723 |
$11,565 |
12/16 |
$12,015 |
$11,952 |
$11,739 |
01/17 |
$12,367 |
$12,176 |
$12,052 |
02/17 |
$12,570 |
$12,629 |
$12,282 |
03/17 |
$12,615 |
$12,638 |
$12,360 |
04/17 |
$12,731 |
$12,772 |
$12,497 |
05/17 |
$12,826 |
$12,903 |
$12,584 |
06/17 |
$12,957 |
$13,019 |
$12,664 |
07/17 |
$13,278 |
$13,264 |
$12,920 |
08/17 |
$13,374 |
$13,290 |
$12,968 |
09/17 |
$13,560 |
$13,614 |
$13,142 |
10/17 |
$13,711 |
$13,911 |
$13,357 |
11/17 |
$13,760 |
$14,334 |
$13,373 |
12/17 |
$13,728 |
$14,477 |
$13,347 |
01/18 |
$14,205 |
$15,240 |
$13,760 |
02/18 |
$14,053 |
$14,678 |
$13,605 |
03/18 |
$14,024 |
$14,384 |
$13,667 |
04/18 |
$13,975 |
$14,438 |
$13,639 |
05/18 |
$14,495 |
$14,846 |
$14,123 |
06/18 |
$14,370 |
$14,943 |
$14,182 |
07/18 |
$14,502 |
$15,439 |
$14,274 |
08/18 |
$14,892 |
$15,981 |
$14,776 |
09/18 |
$14,872 |
$16,008 |
$14,739 |
10/18 |
$13,986 |
$14,829 |
$13,848 |
11/18 |
$14,147 |
$15,126 |
$14,024 |
12/18 |
$13,490 |
$13,718 |
$13,367 |
01/19 |
$14,608 |
$14,896 |
$14,298 |
02/19 |
$15,026 |
$15,419 |
$14,738 |
03/19 |
$15,063 |
$15,645 |
$14,738 |
04/19 |
$15,519 |
$16,269 |
$15,134 |
05/19 |
$15,041 |
$15,216 |
$14,638 |
06/19 |
$15,825 |
$16,285 |
$15,306 |
07/19 |
$15,986 |
$16,527 |
$15,567 |
08/19 |
$15,767 |
$16,190 |
$15,375 |
09/19 |
$15,746 |
$16,475 |
$15,330 |
10/19 |
$15,907 |
$16,829 |
$15,572 |
11/19 |
$16,481 |
$17,469 |
$16,063 |
12/19 |
$16,885 |
$17,973 |
$16,462 |
01/20 |
$17,358 |
$17,954 |
$16,925 |
02/20 |
$16,786 |
$16,484 |
$16,447 |
03/20 |
$14,658 |
$14,217 |
$14,220 |
04/20 |
$16,206 |
$16,100 |
$15,797 |
05/20 |
$17,455 |
$16,961 |
$16,863 |
06/20 |
$18,423 |
$17,349 |
$17,654 |
07/20 |
$19,746 |
$18,334 |
$18,935 |
08/20 |
$21,218 |
$19,662 |
$20,557 |
09/20 |
$20,823 |
$18,946 |
$20,113 |
10/20 |
$20,688 |
$18,537 |
$19,948 |
11/20 |
$23,348 |
$20,792 |
$22,485 |
12/20 |
$24,790 |
$21,728 |
$24,070 |
01/21 |
$25,593 |
$21,631 |
$24,801 |
02/21 |
$26,387 |
$22,307 |
$25,564 |
03/21 |
$25,268 |
$23,107 |
$24,760 |
04/21 |
$25,922 |
$24,298 |
$25,400 |
05/21 |
$25,433 |
$24,409 |
$24,971 |
06/21 |
$26,118 |
$25,010 |
$25,731 |
07/21 |
$25,778 |
$25,433 |
$25,566 |
08/21 |
$26,190 |
$26,159 |
$26,041 |
09/21 |
$25,726 |
$24,985 |
$25,605 |
10/21 |
$26,343 |
$26,675 |
$26,522 |
11/21 |
$25,378 |
$26,269 |
$25,581 |
12/21 |
$25,556 |
$27,303 |
$25,597 |
01/22 |
$23,690 |
$25,697 |
$23,920 |
02/22 |
$23,811 |
$25,049 |
$23,927 |
03/22 |
$24,142 |
$25,862 |
$24,213 |
04/22 |
$22,314 |
$23,541 |
$22,495 |
05/22 |
$21,507 |
$23,509 |
$21,768 |
06/22 |
$20,143 |
$21,543 |
$20,424 |
07/22 |
$21,324 |
$23,564 |
$21,587 |
08/22 |
$21,576 |
$22,684 |
$21,784 |
09/22 |
$20,070 |
$20,581 |
$20,482 |
10/22 |
$20,673 |
$22,269 |
$21,149 |
11/22 |
$21,002 |
$23,431 |
$21,483 |
12/22 |
$20,380 |
$22,059 |
$20,808 |
01/23 |
$21,625 |
$23,578 |
$22,015 |
02/23 |
$21,206 |
$23,027 |
$21,731 |
03/23 |
$21,139 |
$23,643 |
$21,588 |
04/23 |
$20,852 |
$23,895 |
$21,287 |
05/23 |
$20,885 |
$23,988 |
$21,475 |
06/23 |
$22,075 |
$25,626 |
$22,588 |
07/23 |
$22,565 |
$26,544 |
$23,205 |
08/23 |
$21,875 |
$26,032 |
$22,604 |
09/23 |
$21,259 |
$24,792 |
$22,017 |
10/23 |
$20,108 |
$24,135 |
$21,048 |
11/23 |
$21,237 |
$26,385 |
$22,144 |
12/23 |
$22,647 |
$27,785 |
$23,486 |
01/24 |
$22,479 |
$28,093 |
$23,213 |
02/24 |
$22,568 |
$29,613 |
$23,491 |
03/24 |
$22,996 |
$30,569 |
$24,037 |
04/24 |
$22,286 |
$29,224 |
$23,200 |
05/24 |
$22,793 |
$30,604 |
$23,765 |
06/24 |
$23,014 |
$31,552 |
$23,986 |
07/24 |
$23,409 |
$32,138 |
$24,448 |
08/24 |
$23,647 |
$32,838 |
$24,768 |
09/24 |
$24,108 |
$33,517 |
$25,249 |
10/24 |
$24,085 |
$33,271 |
$25,461 |
11/24 |
$25,594 |
$35,484 |
$27,185 |
12/24 |
$24,613 |
$34,400 |
$26,102 |
01/25 |
$25,364 |
$35,486 |
$26,796 |
02/25 |
$24,750 |
$34,806 |
$26,261 |
03/25 |
$24,061 |
$32,775 |
$25,543 |
04/25 |
$24,107 |
$32,556 |
$25,888 |
05/25 |
$24,951 |
$34,619 |
$26,731 |
06/25 |
$26,180 |
$36,378 |
$27,811 |
07/25 |
$26,947 |
$37,179 |
$28,583 |
08/25 |
$27,404 |
$38,039 |
$29,081 |
09/25 |
$28,653 |
$39,352 |
$30,199 |
10/25 |
$29,821 |
$40,196 |
$31,143 |
11/25 |
$29,294 |
$40,306 |
$30,924 |
12/25 |
$29,203 |
$40,298 |
$30,795 |
01/26 |
$30,878 |
$40,923 |
$32,214 |
02/26 |
$31,210 |
$40,728 |
$32,767 |
|
| Average Annual Return [Table Text Block] |
|
Table Summary
Average Annual Total Returns (%) |
1 year |
5 years |
10 years |
Class C (excluding sales charges) |
26.10 |
3.41 |
12.05 |
Class C (including sales charges) |
25.10 |
3.41 |
12.05 |
Russell 3000® Index |
17.02 |
12.80 |
15.08 |
ICE BofA US Convertible Index |
24.77 |
5.09 |
12.60 | |
| No Deduction of Taxes [Text Block] |
|
Performance does not reflect the deduction of taxes that a shareholder may pay on fund distributions or on the redemptions of fund shares.
|
| Updated Performance Information Location [Text Block] |
|
columbiathreadneedleus.com/investment-products/mutual-funds
|
| AssetsNet |
|
$ 1,590,544,812
|
| Holdings Count | Holding |
|
118
|
| Advisory Fees Paid, Amount |
|
$ 10,354,758
|
| InvestmentCompanyPortfolioTurnover |
|
212.00%
|
| Additional Fund Statistics [Text Block] |
|
Table Summary
Fund net assets |
$1,590,544,812 |
Total number of portfolio holdings |
118 |
Management services fees (represents 0.77% of Fund average net assets) |
$10,354,758 |
Portfolio turnover for the reporting period |
212% | |
| Holdings [Text Block] |
|
Table Summary
Convertible Bonds |
78.2% |
Convertible Preferred Stocks |
18.0% |
Money Market Funds |
3.4% |
Common Stocks |
1.8% |
Other |
0.6% | |
| Largest Holdings [Text Block] |
|
Table Summary
Lumentum Holdings, Inc. 03/15/2032 0.375% |
4.6% |
Western Digital Corp. 11/15/2028 3.000% |
3.0% |
Bloom Energy Corp. 11/15/2030 0.000% |
2.6% |
Boeing Co. (The) 6.000% |
2.5% |
Live Nation Entertainment, Inc. 01/15/2030 2.875% |
2.3% |
Bank of America Corp. 7.250% |
2.3% |
NextEra Energy, Inc. 7.234% |
1.5% |
Ionis Pharmaceuticals, Inc. 12/01/2030 0.000% |
1.3% |
Akamai Technologies, Inc. 05/15/2033 0.250% |
1.3% |
Oracle Corp. 6.500% |
1.3% | |
| Material Fund Change [Text Block] |
|
|
| C000253703 |
|
|
| Shareholder Report [Line Items] |
|
|
| Fund Name |
|
Columbia Convertible Securities Fund
|
| Class Name |
|
Class S
|
| Trading Symbol |
|
NCIDX
|
| Annual or Semi-Annual Statement [Text Block] |
|
This annual shareholder report contains important information about Columbia Convertible Securities Fund (the Fund) for the period of March 1, 2025 to February 28, 2026.
|
| Additional Information [Text Block] |
|
You can find additional information about the Fund at columbiathreadneedleus.com/resources/literature. You can also request more information by contacting us at 1-800-345-6611.
|
| Additional Information Phone Number |
|
1-800-345-6611
|
| Additional Information Website |
|
columbiathreadneedleus.com/resources/literature
|
| Expenses [Text Block] |
|
What were the Fund costs for the reporting period? (Based on a hypothetical $10,000 investment)
Table Summary
Class |
Cost of a $10,000 investment |
Cost paid as a percentage of a $10,000 investment |
Class S |
$94 |
0.83% | |
| Expenses Paid, Amount |
|
$ 94
|
| Expense Ratio, Percent |
|
0.83%
|
| Factors Affecting Performance [Text Block] |
|
Management's Discussion of Fund Performance The performance of Class S shares for the period presented is shown in the Average Annual Total Returns table. Top Performance ContributorsStock selection | Selections in the health care and consumer discretionary sectors boosted the Fund’s relative performance most during the annual period. Allocations | An underweight allocation to the consumer discretionary sector buoyed relative Fund performance during the annual period. Individual holdings | Positions in Lumentum, an electrical product manufacturing company, Bloom Energy, a power generation company, and Eos Energy Enterprises, a battery storage solutions company were among the top contributors to the Fund’s relative performance. Top Performance DetractorsStock selection | Selections in the real estate and information technology sectors hurt the Fund’s relative performance during the annual period. Allocations | An underweight allocation to the consumer staples sector detracted from relative performance. Individual holdings | Positions in Rocket Lab USA, an aerospace company, Live Nation Entertainment, an entertainment company, and Coinbase Global, a crypto platform company, were among the top detractors from relative performance during the period. |
| Performance Past Does Not Indicate Future [Text] |
|
The Fund's past performance is not a good predictor of the Fund's future performance.
|
| Line Graph [Table Text Block] |
|
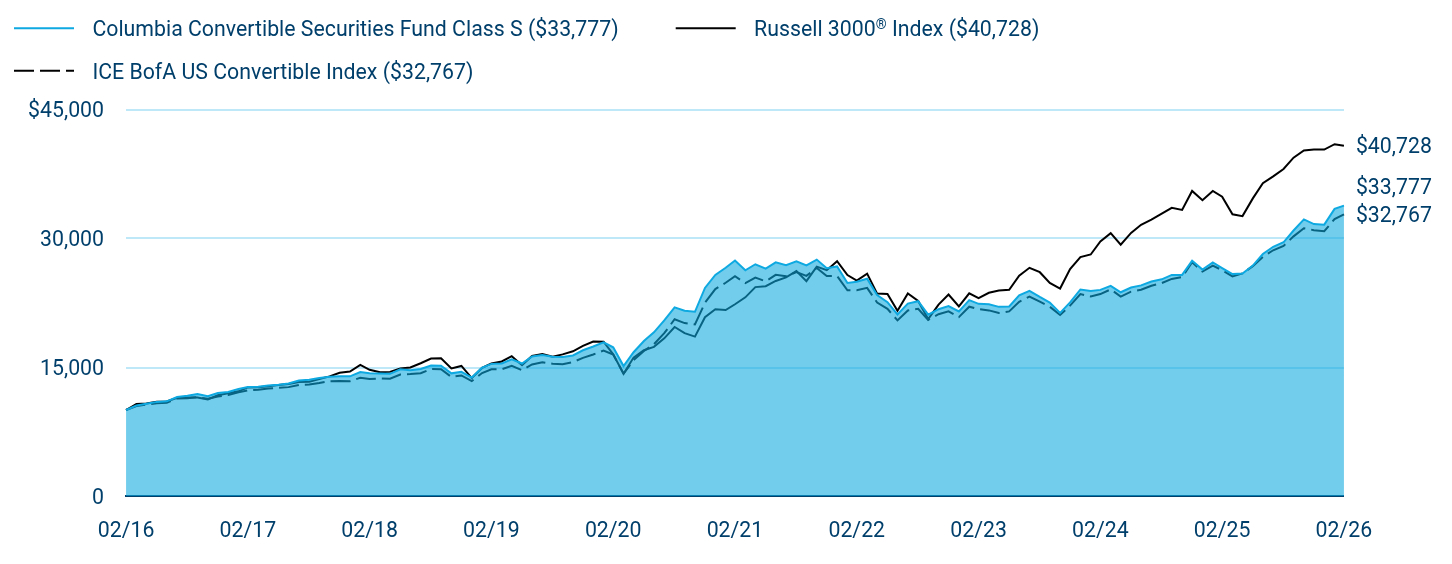
Table Summary
|
Columbia Convertible Securities Fund Class S ($33,777) |
Russell 3000® Index ($40,728) |
ICE BofA US Convertible Index ($32,767) |
02/16 |
$10,000 |
$10,000 |
$10,000 |
03/16 |
$10,528 |
$10,704 |
$10,464 |
04/16 |
$10,721 |
$10,770 |
$10,617 |
05/16 |
$10,947 |
$10,963 |
$10,798 |
06/16 |
$11,007 |
$10,986 |
$10,844 |
07/16 |
$11,508 |
$11,422 |
$11,337 |
08/16 |
$11,661 |
$11,451 |
$11,369 |
09/16 |
$11,855 |
$11,469 |
$11,497 |
10/16 |
$11,613 |
$11,221 |
$11,307 |
11/16 |
$11,970 |
$11,723 |
$11,565 |
12/16 |
$12,097 |
$11,952 |
$11,739 |
01/17 |
$12,458 |
$12,176 |
$12,052 |
02/17 |
$12,668 |
$12,629 |
$12,282 |
03/17 |
$12,716 |
$12,638 |
$12,360 |
04/17 |
$12,840 |
$12,772 |
$12,497 |
05/17 |
$12,949 |
$12,903 |
$12,584 |
06/17 |
$13,091 |
$13,019 |
$12,664 |
07/17 |
$13,422 |
$13,264 |
$12,920 |
08/17 |
$13,532 |
$13,290 |
$12,968 |
09/17 |
$13,724 |
$13,614 |
$13,142 |
10/17 |
$13,884 |
$13,911 |
$13,357 |
11/17 |
$13,939 |
$14,334 |
$13,373 |
12/17 |
$13,921 |
$14,477 |
$13,347 |
01/18 |
$14,410 |
$15,240 |
$13,760 |
02/18 |
$14,270 |
$14,678 |
$13,605 |
03/18 |
$14,252 |
$14,384 |
$13,667 |
04/18 |
$14,210 |
$14,438 |
$13,639 |
05/18 |
$14,744 |
$14,846 |
$14,123 |
06/18 |
$14,623 |
$14,943 |
$14,182 |
07/18 |
$14,771 |
$15,439 |
$14,274 |
08/18 |
$15,180 |
$15,981 |
$14,776 |
09/18 |
$15,160 |
$16,008 |
$14,739 |
10/18 |
$14,267 |
$14,829 |
$13,848 |
11/18 |
$14,444 |
$15,126 |
$14,024 |
12/18 |
$13,782 |
$13,718 |
$13,367 |
01/19 |
$14,928 |
$14,896 |
$14,298 |
02/19 |
$15,369 |
$15,419 |
$14,738 |
03/19 |
$15,420 |
$15,645 |
$14,738 |
04/19 |
$15,892 |
$16,269 |
$15,134 |
05/19 |
$15,412 |
$15,216 |
$14,638 |
06/19 |
$16,227 |
$16,285 |
$15,306 |
07/19 |
$16,400 |
$16,527 |
$15,567 |
08/19 |
$16,190 |
$16,190 |
$15,375 |
09/19 |
$16,177 |
$16,475 |
$15,330 |
10/19 |
$16,350 |
$16,829 |
$15,572 |
11/19 |
$16,952 |
$17,469 |
$16,063 |
12/19 |
$17,384 |
$17,973 |
$16,462 |
01/20 |
$17,877 |
$17,954 |
$16,925 |
02/20 |
$17,298 |
$16,484 |
$16,447 |
03/20 |
$15,112 |
$14,217 |
$14,220 |
04/20 |
$16,720 |
$16,100 |
$15,797 |
05/20 |
$18,020 |
$16,961 |
$16,863 |
06/20 |
$19,033 |
$17,349 |
$17,654 |
07/20 |
$20,420 |
$18,334 |
$18,935 |
08/20 |
$21,945 |
$19,662 |
$20,557 |
09/20 |
$21,552 |
$18,946 |
$20,113 |
10/20 |
$21,430 |
$18,537 |
$19,948 |
11/20 |
$24,201 |
$20,792 |
$22,485 |
12/20 |
$25,708 |
$21,728 |
$24,070 |
01/21 |
$26,556 |
$21,631 |
$24,801 |
02/21 |
$27,394 |
$22,307 |
$25,564 |
03/21 |
$26,252 |
$23,107 |
$24,760 |
04/21 |
$26,956 |
$24,298 |
$25,400 |
05/21 |
$26,450 |
$24,409 |
$24,971 |
06/21 |
$27,183 |
$25,010 |
$25,731 |
07/21 |
$26,849 |
$25,433 |
$25,566 |
08/21 |
$27,294 |
$26,159 |
$26,041 |
09/21 |
$26,827 |
$24,985 |
$25,605 |
10/21 |
$27,496 |
$26,675 |
$26,522 |
11/21 |
$26,502 |
$26,269 |
$25,581 |
12/21 |
$26,703 |
$27,303 |
$25,597 |
01/22 |
$24,772 |
$25,697 |
$23,920 |
02/22 |
$24,919 |
$25,049 |
$23,927 |
03/22 |
$25,269 |
$25,862 |
$24,213 |
04/22 |
$23,374 |
$23,541 |
$22,495 |
05/22 |
$22,543 |
$23,509 |
$21,768 |
06/22 |
$21,124 |
$21,543 |
$20,424 |
07/22 |
$22,381 |
$23,564 |
$21,587 |
08/22 |
$22,655 |
$22,684 |
$21,784 |
09/22 |
$21,089 |
$20,581 |
$20,482 |
10/22 |
$21,731 |
$22,269 |
$21,149 |
11/22 |
$22,098 |
$23,431 |
$21,483 |
12/22 |
$21,465 |
$22,059 |
$20,808 |
01/23 |
$22,781 |
$23,578 |
$22,015 |
02/23 |
$22,354 |
$23,027 |
$21,731 |
03/23 |
$22,304 |
$23,643 |
$21,588 |
04/23 |
$22,001 |
$23,895 |
$21,287 |
05/23 |
$22,048 |
$23,988 |
$21,475 |
06/23 |
$23,329 |
$25,626 |
$22,588 |
07/23 |
$23,868 |
$26,544 |
$23,205 |
08/23 |
$23,153 |
$26,032 |
$22,604 |
09/23 |
$22,504 |
$24,792 |
$22,017 |
10/23 |
$21,302 |
$24,135 |
$21,048 |
11/23 |
$22,515 |
$26,385 |
$22,144 |
12/23 |
$24,021 |
$27,785 |
$23,486 |
01/24 |
$23,855 |
$28,093 |
$23,213 |
02/24 |
$23,974 |
$29,613 |
$23,491 |
03/24 |
$24,436 |
$30,569 |
$24,037 |
04/24 |
$23,697 |
$29,224 |
$23,200 |
05/24 |
$24,245 |
$30,604 |
$23,765 |
06/24 |
$24,500 |
$31,552 |
$23,986 |
07/24 |
$24,943 |
$32,138 |
$24,448 |
08/24 |
$25,207 |
$32,838 |
$24,768 |
09/24 |
$25,720 |
$33,517 |
$25,249 |
10/24 |
$25,720 |
$33,271 |
$25,461 |
11/24 |
$27,354 |
$35,484 |
$27,185 |
12/24 |
$26,331 |
$34,400 |
$26,102 |
01/25 |
$27,165 |
$35,486 |
$26,796 |
02/25 |
$26,512 |
$34,806 |
$26,261 |
03/25 |
$25,809 |
$32,775 |
$25,543 |
04/25 |
$25,882 |
$32,556 |
$25,888 |
05/25 |
$26,805 |
$34,619 |
$26,731 |
06/25 |
$28,145 |
$36,378 |
$27,811 |
07/25 |
$28,988 |
$37,179 |
$28,583 |
08/25 |
$29,513 |
$38,039 |
$29,081 |
09/25 |
$30,883 |
$39,352 |
$30,199 |
10/25 |
$32,170 |
$40,196 |
$31,143 |
11/25 |
$31,631 |
$40,306 |
$30,924 |
12/25 |
$31,562 |
$40,298 |
$30,795 |
01/26 |
$33,395 |
$40,923 |
$32,214 |
02/26 |
$33,777 |
$40,728 |
$32,767 |
|
| Average Annual Return [Table Text Block] |
|
Table Summary
Average Annual Total Returns (%) |
1 year |
5 years |
10 years |
Class SFootnote Reference(a) |
27.40 |
4.28 |
12.94 |
Russell 3000® Index |
17.02 |
12.80 |
15.08 |
ICE BofA US Convertible Index |
24.77 |
5.09 |
12.60 | |
| No Deduction of Taxes [Text Block] |
|
Performance does not reflect the deduction of taxes that a shareholder may pay on fund distributions or on the redemptions of fund shares.
|
| Updated Performance Information Location [Text Block] |
|
columbiathreadneedleus.com/investment-products/mutual-funds
|
| AssetsNet |
|
$ 1,590,544,812
|
| Holdings Count | Holding |
|
118
|
| Advisory Fees Paid, Amount |
|
$ 10,354,758
|
| InvestmentCompanyPortfolioTurnover |
|
212.00%
|
| Additional Fund Statistics [Text Block] |
|
Table Summary
Fund net assets |
$1,590,544,812 |
Total number of portfolio holdings |
118 |
Management services fees (represents 0.77% of Fund average net assets) |
$10,354,758 |
Portfolio turnover for the reporting period |
212% | |
| Holdings [Text Block] |
|
Table Summary
Convertible Bonds |
78.2% |
Convertible Preferred Stocks |
18.0% |
Money Market Funds |
3.4% |
Common Stocks |
1.8% |
Other |
0.6% | |
| Largest Holdings [Text Block] |
|
Table Summary
Lumentum Holdings, Inc. 03/15/2032 0.375% |
4.6% |
Western Digital Corp. 11/15/2028 3.000% |
3.0% |
Bloom Energy Corp. 11/15/2030 0.000% |
2.6% |
Boeing Co. (The) 6.000% |
2.5% |
Live Nation Entertainment, Inc. 01/15/2030 2.875% |
2.3% |
Bank of America Corp. 7.250% |
2.3% |
NextEra Energy, Inc. 7.234% |
1.5% |
Ionis Pharmaceuticals, Inc. 12/01/2030 0.000% |
1.3% |
Akamai Technologies, Inc. 05/15/2033 0.250% |
1.3% |
Oracle Corp. 6.500% |
1.3% | |
| Material Fund Change [Text Block] |
|
|
| C000122575 |
|
|
| Shareholder Report [Line Items] |
|
|
| Fund Name |
|
Columbia Convertible Securities Fund
|
| Class Name |
|
Institutional 2 Class
|
| Trading Symbol |
|
COCRX
|
| Annual or Semi-Annual Statement [Text Block] |
|
This annual shareholder report contains important information about Columbia Convertible Securities Fund (the Fund) for the period of March 1, 2025 to February 28, 2026.
|
| Additional Information [Text Block] |
|
You can find additional information about the Fund at columbiathreadneedleus.com/resources/literature. You can also request more information by contacting us at 1-800-345-6611.
|
| Additional Information Phone Number |
|
1-800-345-6611
|
| Additional Information Website |
|
columbiathreadneedleus.com/resources/literature
|
| Expenses [Text Block] |
|
What were the Fund costs for the reporting period? (Based on a hypothetical $10,000 investment)
Table Summary
Class |
Cost of a $10,000 investment |
Cost paid as a percentage of a $10,000 investment |
Institutional 2 Class |
$90 |
0.79% | |
| Expenses Paid, Amount |
|
$ 90
|
| Expense Ratio, Percent |
|
0.79%
|
| Factors Affecting Performance [Text Block] |
|
Management's Discussion of Fund Performance The performance of Institutional 2 Class shares for the period presented is shown in the Average Annual Total Returns table. Top Performance ContributorsStock selection | Selections in the health care and consumer discretionary sectors boosted the Fund’s relative performance most during the annual period. Allocations | An underweight allocation to the consumer discretionary sector buoyed relative Fund performance during the annual period. Individual holdings | Positions in Lumentum, an electrical product manufacturing company, Bloom Energy, a power generation company, and Eos Energy Enterprises, a battery storage solutions company were among the top contributors to the Fund’s relative performance. Top Performance DetractorsStock selection | Selections in the real estate and information technology sectors hurt the Fund’s relative performance during the annual period. Allocations | An underweight allocation to the consumer staples sector detracted from relative performance. Individual holdings | Positions in Rocket Lab USA, an aerospace company, Live Nation Entertainment, an entertainment company, and Coinbase Global, a crypto platform company, were among the top detractors from relative performance during the period. |
| Performance Past Does Not Indicate Future [Text] |
|
The Fund's past performance is not a good predictor of the Fund's future performance.
|
| Line Graph [Table Text Block] |
|
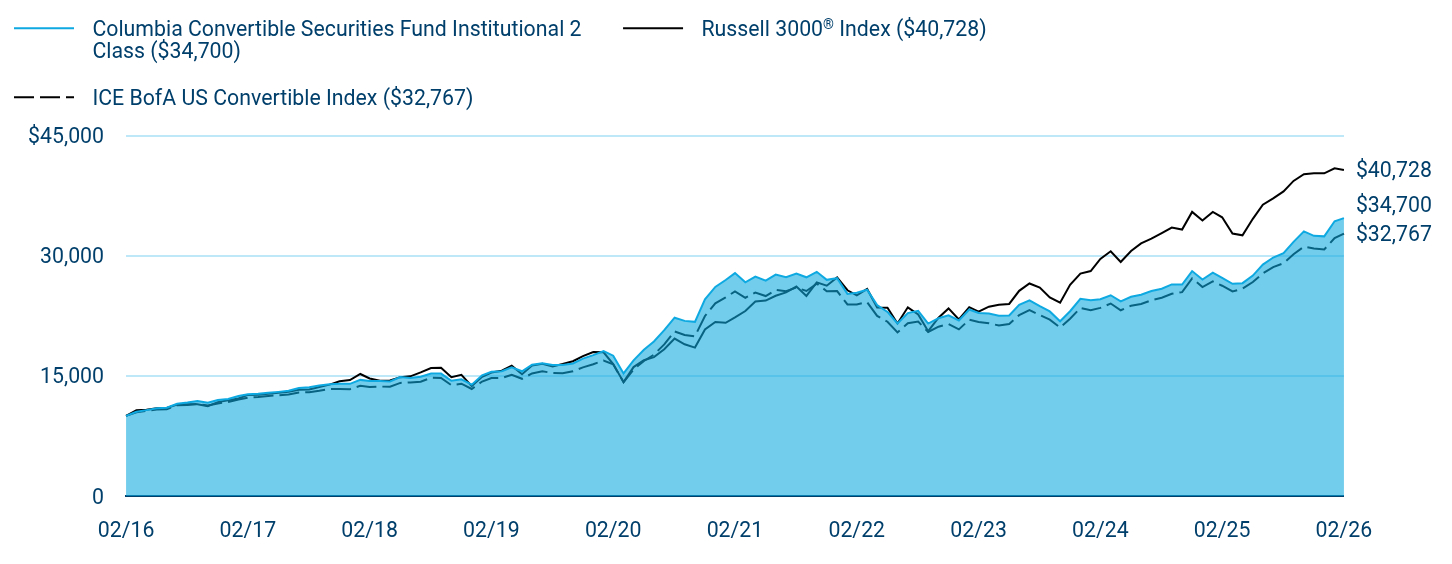
Table Summary
|
Columbia Convertible Securities Fund Institutional 2 Class ($34,700) |
Russell 3000® Index ($40,728) |
ICE BofA US Convertible Index ($32,767) |
02/16 |
$10,000 |
$10,000 |
$10,000 |
03/16 |
$10,526 |
$10,704 |
$10,464 |
04/16 |
$10,724 |
$10,770 |
$10,617 |
05/16 |
$10,955 |
$10,963 |
$10,798 |
06/16 |
$11,017 |
$10,986 |
$10,844 |
07/16 |
$11,521 |
$11,422 |
$11,337 |
08/16 |
$11,680 |
$11,451 |
$11,369 |
09/16 |
$11,876 |
$11,469 |
$11,497 |
10/16 |
$11,643 |
$11,221 |
$11,307 |
11/16 |
$11,997 |
$11,723 |
$11,565 |
12/16 |
$12,127 |
$11,952 |
$11,739 |
01/17 |
$12,492 |
$12,176 |
$12,052 |
02/17 |
$12,708 |
$12,629 |
$12,282 |
03/17 |
$12,760 |
$12,638 |
$12,360 |
04/17 |
$12,889 |
$12,772 |
$12,497 |
05/17 |
$13,005 |
$12,903 |
$12,584 |
06/17 |
$13,144 |
$13,019 |
$12,664 |
07/17 |
$13,487 |
$13,264 |
$12,920 |
08/17 |
$13,597 |
$13,290 |
$12,968 |
09/17 |
$13,792 |
$13,614 |
$13,142 |
10/17 |
$13,965 |
$13,911 |
$13,357 |
11/17 |
$14,021 |
$14,334 |
$13,373 |
12/17 |
$14,007 |
$14,477 |
$13,347 |
01/18 |
$14,502 |
$15,240 |
$13,760 |
02/18 |
$14,363 |
$14,678 |
$13,605 |
03/18 |
$14,349 |
$14,384 |
$13,667 |
04/18 |
$14,307 |
$14,438 |
$13,639 |
05/18 |
$14,854 |
$14,846 |
$14,123 |
06/18 |
$14,737 |
$14,943 |
$14,182 |
07/18 |
$14,892 |
$15,439 |
$14,274 |
08/18 |
$15,301 |
$15,981 |
$14,776 |
09/18 |
$15,286 |
$16,008 |
$14,739 |
10/18 |
$14,393 |
$14,829 |
$13,848 |
11/18 |
$14,570 |
$15,126 |
$14,024 |
12/18 |
$13,905 |
$13,718 |
$13,367 |
01/19 |
$15,073 |
$14,896 |
$14,298 |
02/19 |
$15,521 |
$15,419 |
$14,738 |
03/19 |
$15,577 |
$15,645 |
$14,738 |
04/19 |
$16,057 |
$16,269 |
$15,134 |
05/19 |
$15,577 |
$15,216 |
$14,638 |
06/19 |
$16,406 |
$16,285 |
$15,306 |
07/19 |
$16,586 |
$16,527 |
$15,567 |
08/19 |
$16,376 |
$16,190 |
$15,375 |
09/19 |
$16,368 |
$16,475 |
$15,330 |
10/19 |
$16,549 |
$16,829 |
$15,572 |
11/19 |
$17,160 |
$17,469 |
$16,063 |
12/19 |
$17,599 |
$17,973 |
$16,462 |
01/20 |
$18,109 |
$17,954 |
$16,925 |
02/20 |
$17,520 |
$16,484 |
$16,447 |
03/20 |
$15,312 |
$14,217 |
$14,220 |
04/20 |
$16,950 |
$16,100 |
$15,797 |
05/20 |
$18,271 |
$16,961 |
$16,863 |
06/20 |
$19,301 |
$17,349 |
$17,654 |
07/20 |
$20,710 |
$18,334 |
$18,935 |
08/20 |
$22,266 |
$19,662 |
$20,557 |
09/20 |
$21,872 |
$18,946 |
$20,113 |
10/20 |
$21,749 |
$18,537 |
$19,948 |
11/20 |
$24,566 |
$20,792 |
$22,485 |
12/20 |
$26,109 |
$21,728 |
$24,070 |
01/21 |
$26,978 |
$21,631 |
$24,801 |
02/21 |
$27,838 |
$22,307 |
$25,564 |
03/21 |
$26,686 |
$23,107 |
$24,760 |
04/21 |
$27,402 |
$24,298 |
$25,400 |
05/21 |
$26,901 |
$24,409 |
$24,971 |
06/21 |
$27,651 |
$25,010 |
$25,731 |
07/21 |
$27,315 |
$25,433 |
$25,566 |
08/21 |
$27,772 |
$26,159 |
$26,041 |
09/21 |
$27,314 |
$24,985 |
$25,605 |
10/21 |
$27,997 |
$26,675 |
$26,522 |
11/21 |
$26,997 |
$26,269 |
$25,581 |
12/21 |
$27,204 |
$27,303 |
$25,597 |
01/22 |
$25,240 |
$25,697 |
$23,920 |
02/22 |
$25,398 |
$25,049 |
$23,927 |
03/22 |
$25,769 |
$25,862 |
$24,213 |
04/22 |
$23,841 |
$23,541 |
$22,495 |
05/22 |
$22,993 |
$23,509 |
$21,768 |
06/22 |
$21,551 |
$21,543 |
$20,424 |
07/22 |
$22,839 |
$23,564 |
$21,587 |
08/22 |
$23,127 |
$22,684 |
$21,784 |
09/22 |
$21,533 |
$20,581 |
$20,482 |
10/22 |
$22,203 |
$22,269 |
$21,149 |
11/22 |
$22,572 |
$23,431 |
$21,483 |
12/22 |
$21,928 |
$22,059 |
$20,808 |
01/23 |
$23,290 |
$23,578 |
$22,015 |
02/23 |
$22,859 |
$23,027 |
$21,731 |
03/23 |
$22,803 |
$23,643 |
$21,588 |
04/23 |
$22,509 |
$23,895 |
$21,287 |
05/23 |
$22,556 |
$23,988 |
$21,475 |
06/23 |
$23,877 |
$25,626 |
$22,588 |
07/23 |
$24,433 |
$26,544 |
$23,205 |
08/23 |
$23,700 |
$26,032 |
$22,604 |
09/23 |
$23,050 |
$24,792 |
$22,017 |
10/23 |
$21,825 |
$24,135 |
$21,048 |
11/23 |
$23,074 |
$26,385 |
$22,144 |
12/23 |
$24,625 |
$27,785 |
$23,486 |
01/24 |
$24,457 |
$28,093 |
$23,213 |
02/24 |
$24,577 |
$29,613 |
$23,491 |
03/24 |
$25,074 |
$30,569 |
$24,037 |
04/24 |
$24,315 |
$29,224 |
$23,200 |
05/24 |
$24,881 |
$30,604 |
$23,765 |
06/24 |
$25,145 |
$31,552 |
$23,986 |
07/24 |
$25,605 |
$32,138 |
$24,448 |
08/24 |
$25,884 |
$32,838 |
$24,768 |
09/24 |
$26,422 |
$33,517 |
$25,249 |
10/24 |
$26,410 |
$33,271 |
$25,461 |
11/24 |
$28,092 |
$35,484 |
$27,185 |
12/24 |
$27,033 |
$34,400 |
$26,102 |
01/25 |
$27,891 |
$35,486 |
$26,796 |
02/25 |
$27,229 |
$34,806 |
$26,261 |
03/25 |
$26,507 |
$32,775 |
$25,543 |
04/25 |
$26,581 |
$32,556 |
$25,888 |
05/25 |
$27,530 |
$34,619 |
$26,731 |
06/25 |
$28,905 |
$36,378 |
$27,811 |
07/25 |
$29,784 |
$37,179 |
$28,583 |
08/25 |
$30,317 |
$38,039 |
$29,081 |
09/25 |
$31,735 |
$39,352 |
$30,199 |
10/25 |
$33,054 |
$40,196 |
$31,143 |
11/25 |
$32,494 |
$40,306 |
$30,924 |
12/25 |
$32,427 |
$40,298 |
$30,795 |
01/26 |
$34,313 |
$40,923 |
$32,214 |
02/26 |
$34,700 |
$40,728 |
$32,767 |
|
| Average Annual Return [Table Text Block] |
|
Table Summary
Average Annual Total Returns (%) |
1 year |
5 years |
10 years |
Institutional 2 Class |
27.44 |
4.50 |
13.25 |
Russell 3000® Index |
17.02 |
12.80 |
15.08 |
ICE BofA US Convertible Index |
24.77 |
5.09 |
12.60 | |
| No Deduction of Taxes [Text Block] |
|
Performance does not reflect the deduction of taxes that a shareholder may pay on fund distributions or on the redemptions of fund shares.
|
| Updated Performance Information Location [Text Block] |
|
columbiathreadneedleus.com/investment-products/mutual-funds
|
| AssetsNet |
|
$ 1,590,544,812
|
| Holdings Count | Holding |
|
118
|
| Advisory Fees Paid, Amount |
|
$ 10,354,758
|
| InvestmentCompanyPortfolioTurnover |
|
212.00%
|
| Additional Fund Statistics [Text Block] |
|
Table Summary
Fund net assets |
$1,590,544,812 |
Total number of portfolio holdings |
118 |
Management services fees (represents 0.77% of Fund average net assets) |
$10,354,758 |
Portfolio turnover for the reporting period |
212% | |
| Holdings [Text Block] |
|
Table Summary
Convertible Bonds |
78.2% |
Convertible Preferred Stocks |
18.0% |
Money Market Funds |
3.4% |
Common Stocks |
1.8% |
Other |
0.6% | |
| Largest Holdings [Text Block] |
|
Table Summary
Lumentum Holdings, Inc. 03/15/2032 0.375% |
4.6% |
Western Digital Corp. 11/15/2028 3.000% |
3.0% |
Bloom Energy Corp. 11/15/2030 0.000% |
2.6% |
Boeing Co. (The) 6.000% |
2.5% |
Live Nation Entertainment, Inc. 01/15/2030 2.875% |
2.3% |
Bank of America Corp. 7.250% |
2.3% |
NextEra Energy, Inc. 7.234% |
1.5% |
Ionis Pharmaceuticals, Inc. 12/01/2030 0.000% |
1.3% |
Akamai Technologies, Inc. 05/15/2033 0.250% |
1.3% |
Oracle Corp. 6.500% |
1.3% | |
| Material Fund Change [Text Block] |
|
|
| C000149202 |
|
|
| Shareholder Report [Line Items] |
|
|
| Fund Name |
|
Columbia Convertible Securities Fund
|
| Class Name |
|
Institutional 3 Class
|
| Trading Symbol |
|
CSFYX
|
| Annual or Semi-Annual Statement [Text Block] |
|
This annual shareholder report contains important information about Columbia Convertible Securities Fund (the Fund) for the period of March 1, 2025 to February 28, 2026.
|
| Additional Information [Text Block] |
|
You can find additional information about the Fund at columbiathreadneedleus.com/resources/literature. You can also request more information by contacting us at 1-800-345-6611.
|
| Additional Information Phone Number |
|
1-800-345-6611
|
| Additional Information Website |
|
columbiathreadneedleus.com/resources/literature
|
| Expenses [Text Block] |
|
What were the Fund costs for the reporting period? (Based on a hypothetical $10,000 investment)
Table Summary
Class |
Cost of a $10,000 investment |
Cost paid as a percentage of a $10,000 investment |
Institutional 3 Class |
$84 |
0.74% | |
| Expenses Paid, Amount |
|
$ 84
|
| Expense Ratio, Percent |
|
0.74%
|
| Factors Affecting Performance [Text Block] |
|
Management's Discussion of Fund Performance The performance of Institutional 3 Class shares for the period presented is shown in the Average Annual Total Returns table. Top Performance ContributorsStock selection | Selections in the health care and consumer discretionary sectors boosted the Fund’s relative performance most during the annual period. Allocations | An underweight allocation to the consumer discretionary sector buoyed relative Fund performance during the annual period. Individual holdings | Positions in Lumentum, an electrical product manufacturing company, Bloom Energy, a power generation company, and Eos Energy Enterprises, a battery storage solutions company were among the top contributors to the Fund’s relative performance. Top Performance DetractorsStock selection | Selections in the real estate and information technology sectors hurt the Fund’s relative performance during the annual period. Allocations | An underweight allocation to the consumer staples sector detracted from relative performance. Individual holdings | Positions in Rocket Lab USA, an aerospace company, Live Nation Entertainment, an entertainment company, and Coinbase Global, a crypto platform company, were among the top detractors from relative performance during the period. |
| Performance Past Does Not Indicate Future [Text] |
|
The Fund's past performance is not a good predictor of the Fund's future performance.
|
| Line Graph [Table Text Block] |
|

Table Summary
|
Columbia Convertible Securities Fund Institutional 3 Class ($34,871) |
Russell 3000® Index ($40,728) |
ICE BofA US Convertible Index ($32,767) |
02/16 |
$10,000 |
$10,000 |
$10,000 |
03/16 |
$10,530 |
$10,704 |
$10,464 |
04/16 |
$10,727 |
$10,770 |
$10,617 |
05/16 |
$10,956 |
$10,963 |
$10,798 |
06/16 |
$11,018 |
$10,986 |
$10,844 |
07/16 |
$11,519 |
$11,422 |
$11,337 |
08/16 |
$11,684 |
$11,451 |
$11,369 |
09/16 |
$11,880 |
$11,469 |
$11,497 |
10/16 |
$11,641 |
$11,221 |
$11,307 |
11/16 |
$11,999 |
$11,723 |
$11,565 |
12/16 |
$12,130 |
$11,952 |
$11,739 |
01/17 |
$12,499 |
$12,176 |
$12,052 |
02/17 |
$12,714 |
$12,629 |
$12,282 |
03/17 |
$12,767 |
$12,638 |
$12,360 |
04/17 |
$12,896 |
$12,772 |
$12,497 |
05/17 |
$13,011 |
$12,903 |
$12,584 |
06/17 |
$13,157 |
$13,019 |
$12,664 |
07/17 |
$13,497 |
$13,264 |
$12,920 |
08/17 |
$13,606 |
$13,290 |
$12,968 |
09/17 |
$13,803 |
$13,614 |
$13,142 |
10/17 |
$13,974 |
$13,911 |
$13,357 |
11/17 |
$14,029 |
$14,334 |
$13,373 |
12/17 |
$14,017 |
$14,477 |
$13,347 |
01/18 |
$14,516 |
$15,240 |
$13,760 |
02/18 |
$14,371 |
$14,678 |
$13,605 |
03/18 |
$14,359 |
$14,384 |
$13,667 |
04/18 |
$14,317 |
$14,438 |
$13,639 |
05/18 |
$14,867 |
$14,846 |
$14,123 |
06/18 |
$14,753 |
$14,943 |
$14,182 |
07/18 |
$14,907 |
$15,439 |
$14,274 |
08/18 |
$15,320 |
$15,981 |
$14,776 |
09/18 |
$15,308 |
$16,008 |
$14,739 |
10/18 |
$14,413 |
$14,829 |
$13,848 |
11/18 |
$14,589 |
$15,126 |
$14,024 |
12/18 |
$13,923 |
$13,718 |
$13,367 |
01/19 |
$15,091 |
$14,896 |
$14,298 |
02/19 |
$15,536 |
$15,419 |
$14,738 |
03/19 |
$15,593 |
$15,645 |
$14,738 |
04/19 |
$16,077 |
$16,269 |
$15,134 |
05/19 |
$15,600 |
$15,216 |
$14,638 |
06/19 |
$16,426 |
$16,285 |
$15,306 |
07/19 |
$16,612 |
$16,527 |
$15,567 |
08/19 |
$16,396 |
$16,190 |
$15,375 |
09/19 |
$16,390 |
$16,475 |
$15,330 |
10/19 |
$16,570 |
$16,829 |
$15,572 |
11/19 |
$17,185 |
$17,469 |
$16,063 |
12/19 |
$17,630 |
$17,973 |
$16,462 |
01/20 |
$18,137 |
$17,954 |
$16,925 |
02/20 |
$17,552 |
$16,484 |
$16,447 |
03/20 |
$15,344 |
$14,217 |
$14,220 |
04/20 |
$16,979 |
$16,100 |
$15,797 |
05/20 |
$18,300 |
$16,961 |
$16,863 |
06/20 |
$19,332 |
$17,349 |
$17,654 |
07/20 |
$20,748 |
$18,334 |
$18,935 |
08/20 |
$22,310 |
$19,662 |
$20,557 |
09/20 |
$21,913 |
$18,946 |
$20,113 |
10/20 |
$21,790 |
$18,537 |
$19,948 |
11/20 |
$24,621 |
$20,792 |
$22,485 |
12/20 |
$26,164 |
$21,728 |
$24,070 |
01/21 |
$27,027 |
$21,631 |
$24,801 |
02/21 |
$27,898 |
$22,307 |
$25,564 |
03/21 |
$26,739 |
$23,107 |
$24,760 |
04/21 |
$27,459 |
$24,298 |
$25,400 |
05/21 |
$26,962 |
$24,409 |
$24,971 |
06/21 |
$27,709 |
$25,010 |
$25,731 |
07/21 |
$27,385 |
$25,433 |
$25,566 |
08/21 |
$27,838 |
$26,159 |
$26,041 |
09/21 |
$27,377 |
$24,985 |
$25,605 |
10/21 |
$28,064 |
$26,675 |
$26,522 |
11/21 |
$27,053 |
$26,269 |
$25,581 |
12/21 |
$27,271 |
$27,303 |
$25,597 |
01/22 |
$25,303 |
$25,697 |
$23,920 |
02/22 |
$25,460 |
$25,049 |
$23,927 |
03/22 |
$25,830 |
$25,862 |
$24,213 |
04/22 |
$23,897 |
$23,541 |
$22,495 |
05/22 |
$23,057 |
$23,509 |
$21,768 |
06/22 |
$21,609 |
$21,543 |
$20,424 |
07/22 |
$22,896 |
$23,564 |
$21,587 |
08/22 |
$23,192 |
$22,684 |
$21,784 |
09/22 |
$21,593 |
$20,581 |
$20,482 |
10/22 |
$22,268 |
$22,269 |
$21,149 |
11/22 |
$22,634 |
$23,431 |
$21,483 |
12/22 |
$21,998 |
$22,059 |
$20,808 |
01/23 |
$23,358 |
$23,578 |
$22,015 |
02/23 |
$22,932 |
$23,027 |
$21,731 |
03/23 |
$22,878 |
$23,643 |
$21,588 |
04/23 |
$22,576 |
$23,895 |
$21,287 |
05/23 |
$22,634 |
$23,988 |
$21,475 |
06/23 |
$23,956 |
$25,626 |
$22,588 |
07/23 |
$24,507 |
$26,544 |
$23,205 |
08/23 |
$23,781 |
$26,032 |
$22,604 |
09/23 |
$23,116 |
$24,792 |
$22,017 |
10/23 |
$21,902 |
$24,135 |
$21,048 |
11/23 |
$23,152 |
$26,385 |
$22,144 |
12/23 |
$24,702 |
$27,785 |
$23,486 |
01/24 |
$24,536 |
$28,093 |
$23,213 |
02/24 |
$24,667 |
$29,613 |
$23,491 |
03/24 |
$25,162 |
$30,569 |
$24,037 |
04/24 |
$24,410 |
$29,224 |
$23,200 |
05/24 |
$24,971 |
$30,604 |
$23,765 |
06/24 |
$25,235 |
$31,552 |
$23,986 |
07/24 |
$25,704 |
$32,138 |
$24,448 |
08/24 |
$25,980 |
$32,838 |
$24,768 |
09/24 |
$26,516 |
$33,517 |
$25,249 |
10/24 |
$26,516 |
$33,271 |
$25,461 |
11/24 |
$28,195 |
$35,484 |
$27,185 |
12/24 |
$27,149 |
$34,400 |
$26,102 |
01/25 |
$27,999 |
$35,486 |
$26,796 |
02/25 |
$27,343 |
$34,806 |
$26,261 |
03/25 |
$26,619 |
$32,775 |
$25,543 |
04/25 |
$26,692 |
$32,556 |
$25,888 |
05/25 |
$27,644 |
$34,619 |
$26,731 |
06/25 |
$29,034 |
$36,378 |
$27,811 |
07/25 |
$29,906 |
$37,179 |
$28,583 |
08/25 |
$30,446 |
$38,039 |
$29,081 |
09/25 |
$31,867 |
$39,352 |
$30,199 |
10/25 |
$33,199 |
$40,196 |
$31,143 |
11/25 |
$32,644 |
$40,306 |
$30,924 |
12/25 |
$32,569 |
$40,298 |
$30,795 |
01/26 |
$34,463 |
$40,923 |
$32,214 |
02/26 |
$34,871 |
$40,728 |
$32,767 |
|
| Average Annual Return [Table Text Block] |
|
Table Summary
Average Annual Total Returns (%) |
1 year |
5 years |
10 years |
Institutional 3 Class |
27.53 |
4.56 |
13.30 |
Russell 3000® Index |
17.02 |
12.80 |
15.08 |
ICE BofA US Convertible Index |
24.77 |
5.09 |
12.60 | |
| No Deduction of Taxes [Text Block] |
|
Performance does not reflect the deduction of taxes that a shareholder may pay on fund distributions or on the redemptions of fund shares.
|
| Updated Performance Information Location [Text Block] |
|
columbiathreadneedleus.com/investment-products/mutual-funds
|
| AssetsNet |
|
$ 1,590,544,812
|
| Holdings Count | Holding |
|
118
|
| Advisory Fees Paid, Amount |
|
$ 10,354,758
|
| InvestmentCompanyPortfolioTurnover |
|
212.00%
|
| Additional Fund Statistics [Text Block] |
|
Table Summary
Fund net assets |
$1,590,544,812 |
Total number of portfolio holdings |
118 |
Management services fees (represents 0.77% of Fund average net assets) |
$10,354,758 |
Portfolio turnover for the reporting period |
212% | |
| Holdings [Text Block] |
|
Table Summary
Convertible Bonds |
78.2% |
Convertible Preferred Stocks |
18.0% |
Money Market Funds |
3.4% |
Common Stocks |
1.8% |
Other |
0.6% | |
| Largest Holdings [Text Block] |
|
Table Summary
Lumentum Holdings, Inc. 03/15/2032 0.375% |
4.6% |
Western Digital Corp. 11/15/2028 3.000% |
3.0% |
Bloom Energy Corp. 11/15/2030 0.000% |
2.6% |
Boeing Co. (The) 6.000% |
2.5% |
Live Nation Entertainment, Inc. 01/15/2030 2.875% |
2.3% |
Bank of America Corp. 7.250% |
2.3% |
NextEra Energy, Inc. 7.234% |
1.5% |
Ionis Pharmaceuticals, Inc. 12/01/2030 0.000% |
1.3% |
Akamai Technologies, Inc. 05/15/2033 0.250% |
1.3% |
Oracle Corp. 6.500% |
1.3% | |
| Material Fund Change [Text Block] |
|
|
| C000029840 |
|
|
| Shareholder Report [Line Items] |
|
|
| Fund Name |
|
Columbia Convertible Securities Fund
|
| Class Name |
|
Institutional Class
|
| Trading Symbol |
|
NCIAX
|
| Annual or Semi-Annual Statement [Text Block] |
|
This annual shareholder report contains important information about Columbia Convertible Securities Fund (the Fund) for the period of March 1, 2025 to February 28, 2026.
|
| Additional Information [Text Block] |
|
You can find additional information about the Fund at columbiathreadneedleus.com/resources/literature. You can also request more information by contacting us at 1-800-345-6611.
|
| Additional Information Phone Number |
|
1-800-345-6611
|
| Additional Information Website |
|
columbiathreadneedleus.com/resources/literature
|
| Expenses [Text Block] |
|
What were the Fund costs for the reporting period? (Based on a hypothetical $10,000 investment)
Table Summary
Class |
Cost of a $10,000 investment |
Cost paid as a percentage of a $10,000 investment |
Institutional Class |
$94 |
0.83% | |
| Expenses Paid, Amount |
|
$ 94
|
| Expense Ratio, Percent |
|
0.83%
|
| Factors Affecting Performance [Text Block] |
|
Management's Discussion of Fund Performance The performance of Institutional Class shares for the period presented is shown in the Average Annual Total Returns table. Top Performance ContributorsStock selection | Selections in the health care and consumer discretionary sectors boosted the Fund’s relative performance most during the annual period. Allocations | An underweight allocation to the consumer discretionary sector buoyed relative Fund performance during the annual period. Individual holdings | Positions in Lumentum, an electrical product manufacturing company, Bloom Energy, a power generation company, and Eos Energy Enterprises, a battery storage solutions company were among the top contributors to the Fund’s relative performance. Top Performance DetractorsStock selection | Selections in the real estate and information technology sectors hurt the Fund’s relative performance during the annual period. Allocations | An underweight allocation to the consumer staples sector detracted from relative performance. Individual holdings | Positions in Rocket Lab USA, an aerospace company, Live Nation Entertainment, an entertainment company, and Coinbase Global, a crypto platform company, were among the top detractors from relative performance during the period. |
| Performance Past Does Not Indicate Future [Text] |
|
The Fund's past performance is not a good predictor of the Fund's future performance.
|
| Line Graph [Table Text Block] |
|

Table Summary
|
Columbia Convertible Securities Fund Institutional Class ($34,488) |
Russell 3000® Index ($40,728) |
ICE BofA US Convertible Index ($32,767) |
02/16 |
$10,000 |
$10,000 |
$10,000 |
03/16 |
$10,527 |
$10,704 |
$10,464 |
04/16 |
$10,720 |
$10,770 |
$10,617 |
05/16 |
$10,946 |
$10,963 |
$10,798 |
06/16 |
$11,011 |
$10,986 |
$10,844 |
07/16 |
$11,512 |
$11,422 |
$11,337 |
08/16 |
$11,672 |
$11,451 |
$11,369 |
09/16 |
$11,867 |
$11,469 |
$11,497 |
10/16 |
$11,631 |
$11,221 |
$11,307 |
11/16 |
$11,981 |
$11,723 |
$11,565 |
12/16 |
$12,116 |
$11,952 |
$11,739 |
01/17 |
$12,483 |
$12,176 |
$12,052 |
02/17 |
$12,694 |
$12,629 |
$12,282 |
03/17 |
$12,743 |
$12,638 |
$12,360 |
04/17 |
$12,873 |
$12,772 |
$12,497 |
05/17 |
$12,983 |
$12,903 |
$12,584 |
06/17 |
$13,126 |
$13,019 |
$12,664 |
07/17 |
$13,464 |
$13,264 |
$12,920 |
08/17 |
$13,575 |
$13,290 |
$12,968 |
09/17 |
$13,776 |
$13,614 |
$13,142 |
10/17 |
$13,943 |
$13,911 |
$13,357 |
11/17 |
$13,999 |
$14,334 |
$13,373 |
12/17 |
$13,982 |
$14,477 |
$13,347 |
01/18 |
$14,473 |
$15,240 |
$13,760 |
02/18 |
$14,332 |
$14,678 |
$13,605 |
03/18 |
$14,316 |
$14,384 |
$13,667 |
04/18 |
$14,281 |
$14,438 |
$13,639 |
05/18 |
$14,816 |
$14,846 |
$14,123 |
06/18 |
$14,704 |
$14,943 |
$14,182 |
07/18 |
$14,859 |
$15,439 |
$14,274 |
08/18 |
$15,270 |
$15,981 |
$14,776 |
09/18 |
$15,253 |
$16,008 |
$14,739 |
10/18 |
$14,362 |
$14,829 |
$13,848 |
11/18 |
$14,533 |
$15,126 |
$14,024 |
12/18 |
$13,869 |
$13,718 |
$13,367 |
01/19 |
$15,036 |
$14,896 |
$14,298 |
02/19 |
$15,479 |
$15,419 |
$14,738 |
03/19 |
$15,532 |
$15,645 |
$14,738 |
04/19 |
$16,007 |
$16,269 |
$15,134 |
05/19 |
$15,532 |
$15,216 |
$14,638 |
06/19 |
$16,355 |
$16,285 |
$15,306 |
07/19 |
$16,536 |
$16,527 |
$15,567 |
08/19 |
$16,324 |
$16,190 |
$15,375 |
09/19 |
$16,314 |
$16,475 |
$15,330 |
10/19 |
$16,496 |
$16,829 |
$15,572 |
11/19 |
$17,103 |
$17,469 |
$16,063 |
12/19 |
$17,541 |
$17,973 |
$16,462 |
01/20 |
$18,046 |
$17,954 |
$16,925 |
02/20 |
$17,462 |
$16,484 |
$16,447 |
03/20 |
$15,263 |
$14,217 |
$14,220 |
04/20 |
$16,893 |
$16,100 |
$15,797 |
05/20 |
$18,205 |
$16,961 |
$16,863 |
06/20 |
$19,228 |
$17,349 |
$17,654 |
07/20 |
$20,636 |
$18,334 |
$18,935 |
08/20 |
$22,192 |
$19,662 |
$20,557 |
09/20 |
$21,792 |
$18,946 |
$20,113 |
10/20 |
$21,668 |
$18,537 |
$19,948 |
11/20 |
$24,474 |
$20,792 |
$22,485 |
12/20 |
$26,011 |
$21,728 |
$24,070 |
01/21 |
$26,867 |
$21,631 |
$24,801 |
02/21 |
$27,732 |
$22,307 |
$25,564 |
03/21 |
$26,577 |
$23,107 |
$24,760 |
04/21 |
$27,288 |
$24,298 |
$25,400 |
05/21 |
$26,794 |
$24,409 |
$24,971 |
06/21 |
$27,535 |
$25,010 |
$25,731 |
07/21 |
$27,207 |
$25,433 |
$25,566 |
08/21 |
$27,657 |
$26,159 |
$26,041 |
09/21 |
$27,202 |
$24,985 |
$25,605 |
10/21 |
$27,878 |
$26,675 |
$26,522 |
11/21 |
$26,873 |
$26,269 |
$25,581 |
12/21 |
$27,086 |
$27,303 |
$25,597 |
01/22 |
$25,131 |
$25,697 |
$23,920 |
02/22 |
$25,279 |
$25,049 |
$23,927 |
03/22 |
$25,649 |
$25,862 |
$24,213 |
04/22 |
$23,730 |
$23,541 |
$22,495 |
05/22 |
$22,888 |
$23,509 |
$21,768 |
06/22 |
$21,444 |
$21,543 |
$20,424 |
07/22 |
$22,729 |
$23,564 |
$21,587 |
08/22 |
$23,019 |
$22,684 |
$21,784 |
09/22 |
$21,422 |
$20,581 |
$20,482 |
10/22 |
$22,096 |
$22,269 |
$21,149 |
11/22 |
$22,457 |
$23,431 |
$21,483 |
12/22 |
$21,816 |
$22,059 |
$20,808 |
01/23 |
$23,164 |
$23,578 |
$22,015 |
02/23 |
$22,742 |
$23,027 |
$21,731 |
03/23 |
$22,694 |
$23,643 |
$21,588 |
04/23 |
$22,399 |
$23,895 |
$21,287 |
05/23 |
$22,446 |
$23,988 |
$21,475 |
06/23 |
$23,749 |
$25,626 |
$22,588 |
07/23 |
$24,297 |
$26,544 |
$23,205 |
08/23 |
$23,582 |
$26,032 |
$22,604 |
09/23 |
$22,926 |
$24,792 |
$22,017 |
10/23 |
$21,704 |
$24,135 |
$21,048 |
11/23 |
$22,950 |
$26,385 |
$22,144 |
12/23 |
$24,483 |
$27,785 |
$23,486 |
01/24 |
$24,327 |
$28,093 |
$23,213 |
02/24 |
$24,447 |
$29,613 |
$23,491 |
03/24 |
$24,933 |
$30,569 |
$24,037 |
04/24 |
$24,180 |
$29,224 |
$23,200 |
05/24 |
$24,739 |
$30,604 |
$23,765 |
06/24 |
$25,001 |
$31,552 |
$23,986 |
07/24 |
$25,465 |
$32,138 |
$24,448 |
08/24 |
$25,733 |
$32,838 |
$24,768 |
09/24 |
$26,260 |
$33,517 |
$25,249 |
10/24 |
$26,260 |
$33,271 |
$25,461 |
11/24 |
$27,929 |
$35,484 |
$27,185 |
12/24 |
$26,885 |
$34,400 |
$26,102 |
01/25 |
$27,724 |
$35,486 |
$26,796 |
02/25 |
$27,070 |
$34,806 |
$26,261 |
03/25 |
$26,352 |
$32,775 |
$25,543 |
04/25 |
$26,427 |
$32,556 |
$25,888 |
05/25 |
$27,369 |
$34,619 |
$26,731 |
06/25 |
$28,738 |
$36,378 |
$27,811 |
07/25 |
$29,598 |
$37,179 |
$28,583 |
08/25 |
$30,134 |
$38,039 |
$29,081 |
09/25 |
$31,533 |
$39,352 |
$30,199 |
10/25 |
$32,847 |
$40,196 |
$31,143 |
11/25 |
$32,297 |
$40,306 |
$30,924 |
12/25 |
$32,226 |
$40,298 |
$30,795 |
01/26 |
$34,086 |
$40,923 |
$32,214 |
02/26 |
$34,488 |
$40,728 |
$32,767 |
|
| Average Annual Return [Table Text Block] |
|
Table Summary
Average Annual Total Returns (%) |
1 year |
5 years |
10 years |
Institutional Class |
27.40 |
4.46 |
13.18 |
Russell 3000® Index |
17.02 |
12.80 |
15.08 |
ICE BofA US Convertible Index |
24.77 |
5.09 |
12.60 | |
| No Deduction of Taxes [Text Block] |
|
Performance does not reflect the deduction of taxes that a shareholder may pay on fund distributions or on the redemptions of fund shares.
|
| Updated Performance Information Location [Text Block] |
|
columbiathreadneedleus.com/investment-products/mutual-funds
|
| AssetsNet |
|
$ 1,590,544,812
|
| Holdings Count | Holding |
|
118
|
| Advisory Fees Paid, Amount |
|
$ 10,354,758
|
| InvestmentCompanyPortfolioTurnover |
|
212.00%
|
| Additional Fund Statistics [Text Block] |
|
Table Summary
Fund net assets |
$1,590,544,812 |
Total number of portfolio holdings |
118 |
Management services fees (represents 0.77% of Fund average net assets) |
$10,354,758 |
Portfolio turnover for the reporting period |
212% | |
| Holdings [Text Block] |
|
Table Summary
Convertible Bonds |
78.2% |
Convertible Preferred Stocks |
18.0% |
Money Market Funds |
3.4% |
Common Stocks |
1.8% |
Other |
0.6% | |
| Largest Holdings [Text Block] |
|
Table Summary
Lumentum Holdings, Inc. 03/15/2032 0.375% |
4.6% |
Western Digital Corp. 11/15/2028 3.000% |
3.0% |
Bloom Energy Corp. 11/15/2030 0.000% |
2.6% |
Boeing Co. (The) 6.000% |
2.5% |
Live Nation Entertainment, Inc. 01/15/2030 2.875% |
2.3% |
Bank of America Corp. 7.250% |
2.3% |
NextEra Energy, Inc. 7.234% |
1.5% |
Ionis Pharmaceuticals, Inc. 12/01/2030 0.000% |
1.3% |
Akamai Technologies, Inc. 05/15/2033 0.250% |
1.3% |
Oracle Corp. 6.500% |
1.3% | |
| Material Fund Change [Text Block] |
|
|
| C000029865 |
|
|
| Shareholder Report [Line Items] |
|
|
| Fund Name |
|
Columbia Cornerstone Equity Fund
|
| Class Name |
|
Class A
|
| Trading Symbol |
|
NSGAX
|
| Annual or Semi-Annual Statement [Text Block] |
|
This annual shareholder report contains important information about Columbia Cornerstone Equity Fund (the Fund) for the period of March 1, 2025 to February 28, 2026.
|
| Additional Information [Text Block] |
|
You can find additional information about the Fund at columbiathreadneedleus.com/resources/literature. You can also request more information by contacting us at 1-800-345-6611.
|
| Material Fund Change Notice [Text Block] |
|
This report describes changes to the Fund that occurred during the reporting period.
|
| Additional Information Phone Number |
|
1-800-345-6611
|
| Additional Information Website |
|
columbiathreadneedleus.com/resources/literature
|
| Expenses [Text Block] |
|
What were the Fund costs for the reporting period? (Based on a hypothetical $10,000 investment)
Table Summary
Class |
Cost of a $10,000 investment |
Cost paid as a percentage of a $10,000 investment |
Class A |
$95 |
0.90% | |
| Expenses Paid, Amount |
|
$ 95
|
| Expense Ratio, Percent |
|
0.90%
|
| Factors Affecting Performance [Text Block] |
|
Management's Discussion of Fund Performance The performance of Class A shares for the period presented is shown in the Average Annual Total Returns table. Top Performance ContributorsStock selection | Selections in the financials and consumer discretionary sectors boosted the Fund’s relative performance during the annual period. Allocations | An underweight position in the information technology sector, alongside an overweight in the communication services sector, contributed to the Fund’s relative performance during the annual period. Individual holdings | A relative overweight position in Exact Sciences Corporation, a developer of molecular diagnostics and cancer screening tests; a relative overweight position in General Motors Company, a global automotive manufacturer; a relative overweight position in Parker‑Hannifin Corporation, a provider of motion and control technologies; a relative overweight position in TE Connectivity plc, a designer and manufacturer of connectivity and sensor solutions; and a relative overweight position in General Dynamics Corporation, an aerospace and defense company, were among the top contributors to the Fund’s relative performance. Top Performance DetractorsStock selection | Selections in the information technology, industrials, real estate and utilities sectors hurt the Fund’s relative performance during the annual period. Allocations | An underweight position in the energy sector, alongside overweight positions in the financials and consumer discretionary sectors, detracted from the Fund’s relative performance during the annual period. Individual holdings | A relative overweight position in ServiceNow, Inc., an enterprise workflow software provider; a relative overweight position in Broadcom, Inc., a designer and manufacturer of semiconductor and infrastructure software solutions; a relative overweight position in Palo Alto Networks, Inc., a cybersecurity platform provider; a relative overweight position in Constellation Brands, Inc., a producer and marketer of alcoholic beverages; and a relative overweight position in Bristol‑Myers Squibb Company, a global biopharmaceutical company, were among the top detractors from the Fund’s relative performance. |
| Performance Past Does Not Indicate Future [Text] |
|
The Fund's past performance is not a good predictor of the Fund's future performance.
|
| Line Graph [Table Text Block] |
|
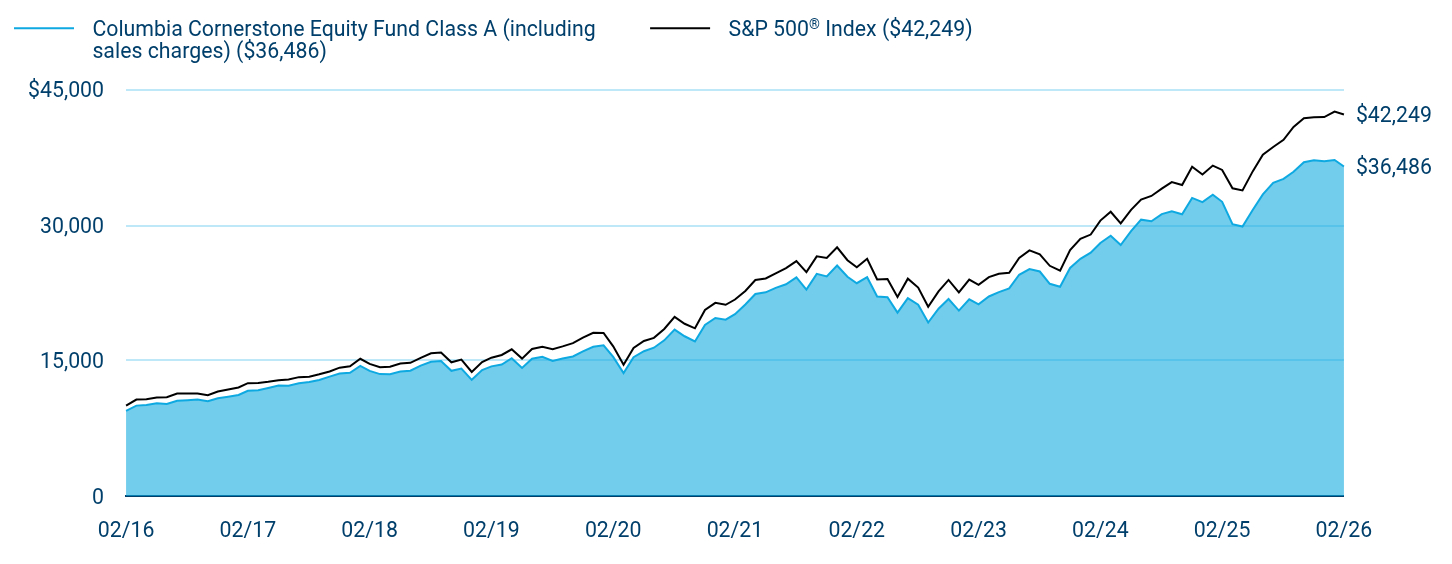
Table Summary
|
Columbia Cornerstone Equity Fund Class A (including sales charges) ($36,486) |
S&P 500® Index ($42,249) |
02/16 |
$9,427 |
$10,000 |
03/16 |
$10,009 |
$10,678 |
04/16 |
$10,078 |
$10,720 |
05/16 |
$10,269 |
$10,912 |
06/16 |
$10,186 |
$10,941 |
07/16 |
$10,551 |
$11,344 |
08/16 |
$10,603 |
$11,360 |
09/16 |
$10,673 |
$11,362 |
10/16 |
$10,499 |
$11,155 |
11/16 |
$10,821 |
$11,568 |
12/16 |
$10,993 |
$11,797 |
01/17 |
$11,188 |
$12,020 |
02/17 |
$11,657 |
$12,498 |
03/17 |
$11,719 |
$12,512 |
04/17 |
$11,958 |
$12,641 |
05/17 |
$12,224 |
$12,818 |
06/17 |
$12,219 |
$12,898 |
07/17 |
$12,487 |
$13,164 |
08/17 |
$12,621 |
$13,204 |
09/17 |
$12,844 |
$13,476 |
10/17 |
$13,220 |
$13,791 |
11/17 |
$13,568 |
$14,214 |
12/17 |
$13,651 |
$14,372 |
01/18 |
$14,408 |
$15,195 |
02/18 |
$13,856 |
$14,635 |
03/18 |
$13,501 |
$14,263 |
04/18 |
$13,492 |
$14,317 |
05/18 |
$13,791 |
$14,662 |
06/18 |
$13,881 |
$14,753 |
07/18 |
$14,447 |
$15,302 |
08/18 |
$14,857 |
$15,800 |
09/18 |
$14,954 |
$15,890 |
10/18 |
$13,861 |
$14,804 |
11/18 |
$14,115 |
$15,106 |
12/18 |
$12,864 |
$13,742 |
01/19 |
$13,945 |
$14,843 |
02/19 |
$14,356 |
$15,320 |
03/19 |
$14,562 |
$15,617 |
04/19 |
$15,262 |
$16,250 |
05/19 |
$14,181 |
$15,217 |
06/19 |
$15,201 |
$16,289 |
07/19 |
$15,424 |
$16,523 |
08/19 |
$14,956 |
$16,262 |
09/19 |
$15,222 |
$16,566 |
10/19 |
$15,456 |
$16,925 |
11/19 |
$16,009 |
$17,539 |
12/19 |
$16,520 |
$18,069 |
01/20 |
$16,694 |
$18,061 |
02/20 |
$15,404 |
$16,575 |
03/20 |
$13,617 |
$14,527 |
04/20 |
$15,372 |
$16,390 |
05/20 |
$16,033 |
$17,170 |
06/20 |
$16,422 |
$17,512 |
07/20 |
$17,241 |
$18,499 |
08/20 |
$18,430 |
$19,829 |
09/20 |
$17,690 |
$19,076 |
10/20 |
$17,118 |
$18,568 |
11/20 |
$18,946 |
$20,601 |
12/20 |
$19,714 |
$21,393 |
01/21 |
$19,527 |
$21,177 |
02/21 |
$20,133 |
$21,761 |
03/21 |
$21,217 |
$22,714 |
04/21 |
$22,370 |
$23,926 |
05/21 |
$22,557 |
$24,093 |
06/21 |
$23,053 |
$24,656 |
07/21 |
$23,449 |
$25,241 |
08/21 |
$24,216 |
$26,009 |
09/21 |
$22,850 |
$24,799 |
10/21 |
$24,600 |
$26,537 |
11/21 |
$24,324 |
$26,353 |
12/21 |
$25,531 |
$27,534 |
01/22 |
$24,278 |
$26,109 |
02/22 |
$23,564 |
$25,327 |
03/22 |
$24,228 |
$26,268 |
04/22 |
$22,086 |
$23,977 |
05/22 |
$22,023 |
$24,021 |
06/22 |
$20,311 |
$22,038 |
07/22 |
$21,922 |
$24,070 |
08/22 |
$21,182 |
$23,089 |
09/22 |
$19,214 |
$20,962 |
10/22 |
$20,746 |
$22,659 |
11/22 |
$21,816 |
$23,926 |
12/22 |
$20,530 |
$22,547 |
01/23 |
$21,778 |
$23,964 |
02/23 |
$21,234 |
$23,379 |
03/23 |
$22,097 |
$24,238 |
04/23 |
$22,575 |
$24,616 |
05/23 |
$22,987 |
$24,723 |
06/23 |
$24,499 |
$26,357 |
07/23 |
$25,132 |
$27,203 |
08/23 |
$24,863 |
$26,770 |
09/23 |
$23,502 |
$25,494 |
10/23 |
$23,165 |
$24,958 |
11/23 |
$25,253 |
$27,237 |
12/23 |
$26,270 |
$28,474 |
01/24 |
$26,952 |
$28,953 |
02/24 |
$28,024 |
$30,499 |
03/24 |
$28,818 |
$31,480 |
04/24 |
$27,788 |
$30,194 |
05/24 |
$29,333 |
$31,692 |
06/24 |
$30,602 |
$32,829 |
07/24 |
$30,429 |
$33,228 |
08/24 |
$31,218 |
$34,034 |
09/24 |
$31,520 |
$34,761 |
10/24 |
$31,204 |
$34,446 |
11/24 |
$33,012 |
$36,468 |
12/24 |
$32,549 |
$35,599 |
01/25 |
$33,376 |
$36,590 |
02/25 |
$32,578 |
$36,113 |
03/25 |
$30,112 |
$34,078 |
04/25 |
$29,846 |
$33,847 |
05/25 |
$31,692 |
$35,977 |
06/25 |
$33,408 |
$37,807 |
07/25 |
$34,689 |
$38,655 |
08/25 |
$35,126 |
$39,439 |
09/25 |
$35,909 |
$40,878 |
10/25 |
$36,963 |
$41,835 |
11/25 |
$37,189 |
$41,938 |
12/25 |
$37,064 |
$41,964 |
01/26 |
$37,216 |
$42,572 |
02/26 |
$36,486 |
$42,249 |
|
| Average Annual Return [Table Text Block] |
|
Table Summary
Average Annual Total Returns (%) |
1 year |
5 years |
10 years |
Class A (excluding sales charges) |
11.99 |
12.63 |
14.49 |
Class A (including sales charges) |
5.54 |
11.31 |
13.82 |
S&P 500® Index |
16.99 |
14.19 |
15.50 | |
| No Deduction of Taxes [Text Block] |
|
Performance does not reflect the deduction of taxes that a shareholder may pay on fund distributions or on the redemptions of fund shares.
|
| Material Change Date |
Sep. 01, 2025
|
|
| Updated Performance Information Location [Text Block] |
|
columbiathreadneedleus.com/investment-products/mutual-funds
|
| AssetsNet |
|
$ 1,569,593,480
|
| Holdings Count | Holding |
|
58
|
| Advisory Fees Paid, Amount |
|
$ 11,343,116
|
| InvestmentCompanyPortfolioTurnover |
|
71.00%
|
| Additional Fund Statistics [Text Block] |
|
Table Summary
Fund net assets |
$1,569,593,480 |
Total number of portfolio holdings |
58 |
Management services fees (represents 0.71% of Fund average net assets) |
$11,343,116 |
Portfolio turnover for the reporting period |
71% | |
| Holdings [Text Block] |
|
Table Summary
Information Technology |
30.1% |
Financials |
14.5% |
Consumer Discretionary |
12.5% |
Communication Services |
11.5% |
Health Care |
10.5% |
Industrials |
8.8% |
Utilities |
4.2% |
Consumer Staples |
4.0% |
Real Estate |
1.8% |
Energy |
1.3% |
Table Summary
Common Stocks |
99.2% |
Other |
0.8% | |
| Largest Holdings [Text Block] |
|
Table Summary
NVIDIA Corp. |
7.8% |
Alphabet, Inc., Class C |
6.7% |
Microsoft Corp. |
6.1% |
Apple, Inc. |
5.1% |
Amazon.com, Inc. |
4.6% |
Broadcom, Inc. |
4.1% |
Meta Platforms, Inc., Class A |
3.2% |
JPMorgan Chase & Co. |
3.0% |
Eli Lilly & Co. |
2.4% |
Citigroup, Inc. |
2.1% | |
| Material Fund Change [Text Block] |
|
This is a summary of the changes to the Fund. For more complete information, you may review the Fund’s prospectus, which is available at columbiathreadneedleus.com/resources/literature or upon request at 1-800-345-6611. Effective September 1, 2025, the Fund's name was changed from Columbia Select Large Cap Equity Fund to Columbia Cornerstone Equity Fund. |
| Material Fund Change Name [Text Block] |
|
Effective September 1, 2025, the Fund's name was changed from Columbia Select Large Cap Equity Fund to Columbia Cornerstone Equity Fund.
|
| Summary of Change Legend [Text Block] |
|
This is a summary of the changes to the Fund. For more complete information, you may review the Fund’s prospectus, which is available at columbiathreadneedleus.com/resources/literature or upon request at 1-800-345-6611.
|
| Updated Prospectus Phone Number |
|
1-800-345-6611
|
| Updated Prospectus Web Address |
|
columbiathreadneedleus.com/resources/literature
|
| C000029867 |
|
|
| Shareholder Report [Line Items] |
|
|
| Fund Name |
|
Columbia Cornerstone Equity Fund
|
| Class Name |
|
Class C
|
| Trading Symbol |
|
NSGCX
|
| Annual or Semi-Annual Statement [Text Block] |
|
This annual shareholder report contains important information about Columbia Cornerstone Equity Fund (the Fund) for the period of March 1, 2025 to February 28, 2026.
|
| Additional Information [Text Block] |
|
You can find additional information about the Fund at columbiathreadneedleus.com/resources/literature. You can also request more information by contacting us at 1-800-345-6611.
|
| Material Fund Change Notice [Text Block] |
|
This report describes changes to the Fund that occurred during the reporting period.
|
| Additional Information Phone Number |
|
1-800-345-6611
|
| Additional Information Website |
|
columbiathreadneedleus.com/resources/literature
|
| Expenses [Text Block] |
|
What were the Fund costs for the reporting period? (Based on a hypothetical $10,000 investment)
Table Summary
Class |
Cost of a $10,000 investment |
Cost paid as a percentage of a $10,000 investment |
Class C |
$174 |
1.65% | |
| Expenses Paid, Amount |
|
$ 174
|
| Expense Ratio, Percent |
|
1.65%
|
| Factors Affecting Performance [Text Block] |
|
Management's Discussion of Fund Performance The performance of Class C shares for the period presented is shown in the Average Annual Total Returns table. Top Performance ContributorsStock selection | Selections in the financials and consumer discretionary sectors boosted the Fund’s relative performance during the annual period. Allocations | An underweight position in the information technology sector, alongside an overweight in the communication services sector, contributed to the Fund’s relative performance during the annual period. Individual holdings | A relative overweight position in Exact Sciences Corporation, a developer of molecular diagnostics and cancer screening tests; a relative overweight position in General Motors Company, a global automotive manufacturer; a relative overweight position in Parker‑Hannifin Corporation, a provider of motion and control technologies; a relative overweight position in TE Connectivity plc, a designer and manufacturer of connectivity and sensor solutions; and a relative overweight position in General Dynamics Corporation, an aerospace and defense company, were among the top contributors to the Fund’s relative performance. Top Performance DetractorsStock selection | Selections in the information technology, industrials, real estate and utilities sectors hurt the Fund’s relative performance during the annual period. Allocations | An underweight position in the energy sector, alongside overweight positions in the financials and consumer discretionary sectors, detracted from the Fund’s relative performance during the annual period. Individual holdings | A relative overweight position in ServiceNow, Inc., an enterprise workflow software provider; a relative overweight position in Broadcom, Inc., a designer and manufacturer of semiconductor and infrastructure software solutions; a relative overweight position in Palo Alto Networks, Inc., a cybersecurity platform provider; a relative overweight position in Constellation Brands, Inc., a producer and marketer of alcoholic beverages; and a relative overweight position in Bristol‑Myers Squibb Company, a global biopharmaceutical company, were among the top detractors from the Fund’s relative performance. |
| Performance Past Does Not Indicate Future [Text] |
|
The Fund's past performance is not a good predictor of the Fund's future performance.
|
| Line Graph [Table Text Block] |
|
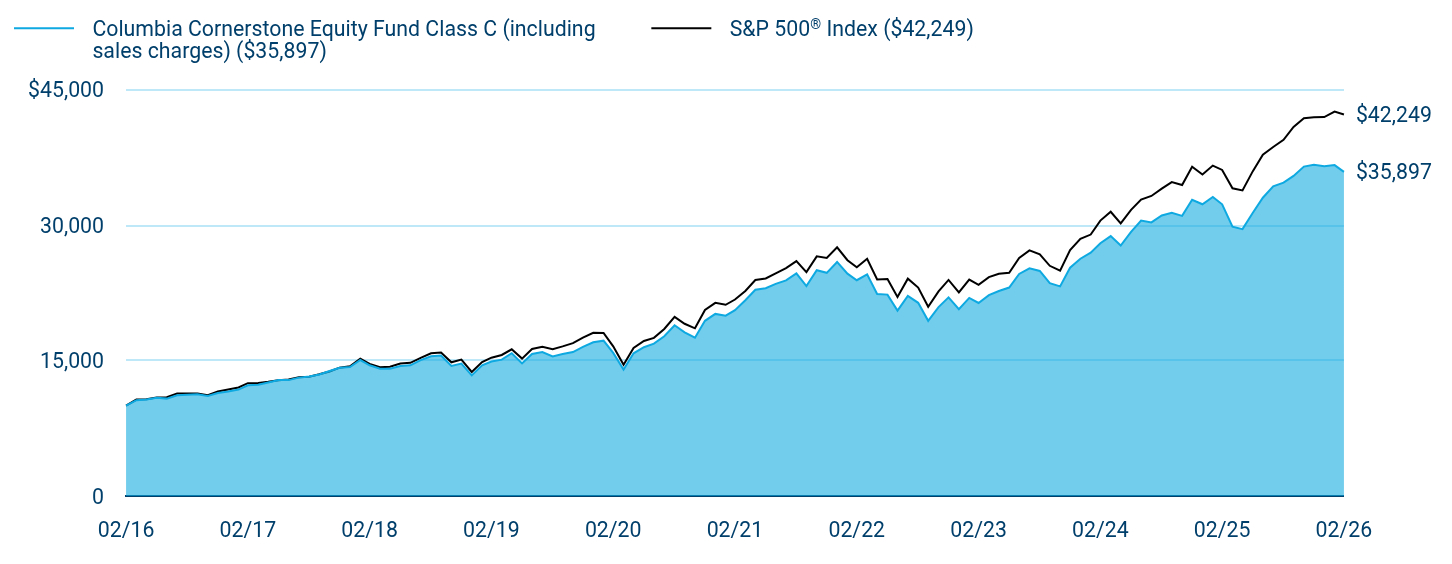
Table Summary
|
Columbia Cornerstone Equity Fund Class C (including sales charges) ($35,897) |
S&P 500® Index ($42,249) |
02/16 |
$10,000 |
$10,000 |
03/16 |
$10,616 |
$10,678 |
04/16 |
$10,675 |
$10,720 |
05/16 |
$10,874 |
$10,912 |
06/16 |
$10,785 |
$10,941 |
07/16 |
$11,152 |
$11,344 |
08/16 |
$11,202 |
$11,360 |
09/16 |
$11,271 |
$11,362 |
10/16 |
$11,082 |
$11,155 |
11/16 |
$11,410 |
$11,568 |
12/16 |
$11,581 |
$11,797 |
01/17 |
$11,783 |
$12,020 |
02/17 |
$12,266 |
$12,498 |
03/17 |
$12,327 |
$12,512 |
04/17 |
$12,578 |
$12,641 |
05/17 |
$12,850 |
$12,818 |
06/17 |
$12,835 |
$12,898 |
07/17 |
$13,109 |
$13,164 |
08/17 |
$13,242 |
$13,204 |
09/17 |
$13,465 |
$13,476 |
10/17 |
$13,851 |
$13,791 |
11/17 |
$14,207 |
$14,214 |
12/17 |
$14,276 |
$14,372 |
01/18 |
$15,061 |
$15,195 |
02/18 |
$14,478 |
$14,635 |
03/18 |
$14,096 |
$14,263 |
04/18 |
$14,085 |
$14,317 |
05/18 |
$14,393 |
$14,662 |
06/18 |
$14,477 |
$14,753 |
07/18 |
$15,055 |
$15,302 |
08/18 |
$15,466 |
$15,800 |
09/18 |
$15,555 |
$15,890 |
10/18 |
$14,410 |
$14,804 |
11/18 |
$14,666 |
$15,106 |
12/18 |
$13,358 |
$13,742 |
01/19 |
$14,480 |
$14,843 |
02/19 |
$14,890 |
$15,320 |
03/19 |
$15,100 |
$15,617 |
04/19 |
$15,813 |
$16,250 |
05/19 |
$14,679 |
$15,217 |
06/19 |
$15,736 |
$16,289 |
07/19 |
$15,941 |
$16,523 |
08/19 |
$15,446 |
$16,262 |
09/19 |
$15,724 |
$16,566 |
10/19 |
$15,941 |
$16,925 |
11/19 |
$16,510 |
$17,539 |
12/19 |
$17,028 |
$18,069 |
01/20 |
$17,200 |
$18,061 |
02/20 |
$15,851 |
$16,575 |
03/20 |
$14,010 |
$14,527 |
04/20 |
$15,801 |
$16,390 |
05/20 |
$16,476 |
$17,170 |
06/20 |
$16,869 |
$17,512 |
07/20 |
$17,697 |
$18,499 |
08/20 |
$18,906 |
$19,829 |
09/20 |
$18,129 |
$19,076 |
10/20 |
$17,531 |
$18,568 |
11/20 |
$19,403 |
$20,601 |
12/20 |
$20,168 |
$21,393 |
01/21 |
$19,970 |
$21,177 |
02/21 |
$20,578 |
$21,761 |
03/21 |
$21,674 |
$22,714 |
04/21 |
$22,836 |
$23,926 |
05/21 |
$23,008 |
$24,093 |
06/21 |
$23,490 |
$24,656 |
07/21 |
$23,885 |
$25,241 |
08/21 |
$24,647 |
$26,009 |
09/21 |
$23,245 |
$24,799 |
10/21 |
$25,001 |
$26,537 |
11/21 |
$24,715 |
$26,353 |
12/21 |
$25,919 |
$27,534 |
01/22 |
$24,623 |
$26,109 |
02/22 |
$23,897 |
$25,327 |
03/22 |
$24,552 |
$26,268 |
04/22 |
$22,373 |
$23,977 |
05/22 |
$22,302 |
$24,021 |
06/22 |
$20,534 |
$22,038 |
07/22 |
$22,163 |
$24,070 |
08/22 |
$21,394 |
$23,089 |
09/22 |
$19,402 |
$20,962 |
10/22 |
$20,926 |
$22,659 |
11/22 |
$21,998 |
$23,926 |
12/22 |
$20,685 |
$22,547 |
01/23 |
$21,937 |
$23,964 |
02/23 |
$21,379 |
$23,379 |
03/23 |
$22,239 |
$24,238 |
04/23 |
$22,707 |
$24,616 |
05/23 |
$23,084 |
$24,723 |
06/23 |
$24,591 |
$26,357 |
07/23 |
$25,219 |
$27,203 |
08/23 |
$24,928 |
$26,770 |
09/23 |
$23,564 |
$25,494 |
10/23 |
$23,212 |
$24,958 |
11/23 |
$25,280 |
$27,237 |
12/23 |
$26,280 |
$28,474 |
01/24 |
$26,944 |
$28,953 |
02/24 |
$27,987 |
$30,499 |
03/24 |
$28,778 |
$31,480 |
04/24 |
$27,734 |
$30,194 |
05/24 |
$29,252 |
$31,692 |
06/24 |
$30,497 |
$32,829 |
07/24 |
$30,301 |
$33,228 |
08/24 |
$31,069 |
$34,034 |
09/24 |
$31,363 |
$34,761 |
10/24 |
$31,020 |
$34,446 |
11/24 |
$32,802 |
$36,468 |
12/24 |
$32,308 |
$35,599 |
01/25 |
$33,119 |
$36,590 |
02/25 |
$32,308 |
$36,113 |
03/25 |
$29,827 |
$34,078 |
04/25 |
$29,557 |
$33,847 |
05/25 |
$31,363 |
$35,977 |
06/25 |
$33,034 |
$37,807 |
07/25 |
$34,293 |
$38,655 |
08/25 |
$34,707 |
$39,439 |
09/25 |
$35,449 |
$40,878 |
10/25 |
$36,484 |
$41,835 |
11/25 |
$36,674 |
$41,938 |
12/25 |
$36,524 |
$41,964 |
01/26 |
$36,646 |
$42,572 |
02/26 |
$35,897 |
$42,249 |
|
| Average Annual Return [Table Text Block] |
|
Table Summary
Average Annual Total Returns (%) |
1 year |
5 years |
10 years |
Class C (excluding sales charges) |
11.11 |
11.77 |
13.63 |
Class C (including sales charges) |
10.11 |
11.77 |
13.63 |
S&P 500® Index |
16.99 |
14.19 |
15.50 | |
| No Deduction of Taxes [Text Block] |
|
Performance does not reflect the deduction of taxes that a shareholder may pay on fund distributions or on the redemptions of fund shares.
|
| Material Change Date |
Sep. 01, 2025
|
|
| Updated Performance Information Location [Text Block] |
|
columbiathreadneedleus.com/investment-products/mutual-funds
|
| AssetsNet |
|
$ 1,569,593,480
|
| Holdings Count | Holding |
|
58
|
| Advisory Fees Paid, Amount |
|
$ 11,343,116
|
| InvestmentCompanyPortfolioTurnover |
|
71.00%
|
| Additional Fund Statistics [Text Block] |
|
Table Summary
Fund net assets |
$1,569,593,480 |
Total number of portfolio holdings |
58 |
Management services fees (represents 0.71% of Fund average net assets) |
$11,343,116 |
Portfolio turnover for the reporting period |
71% | |
| Holdings [Text Block] |
|
Table Summary
Information Technology |
30.1% |
Financials |
14.5% |
Consumer Discretionary |
12.5% |
Communication Services |
11.5% |
Health Care |
10.5% |
Industrials |
8.8% |
Utilities |
4.2% |
Consumer Staples |
4.0% |
Real Estate |
1.8% |
Energy |
1.3% |
Table Summary
Common Stocks |
99.2% |
Other |
0.8% | |
| Largest Holdings [Text Block] |
|
Table Summary
NVIDIA Corp. |
7.8% |
Alphabet, Inc., Class C |
6.7% |
Microsoft Corp. |
6.1% |
Apple, Inc. |
5.1% |
Amazon.com, Inc. |
4.6% |
Broadcom, Inc. |
4.1% |
Meta Platforms, Inc., Class A |
3.2% |
JPMorgan Chase & Co. |
3.0% |
Eli Lilly & Co. |
2.4% |
Citigroup, Inc. |
2.1% | |
| Material Fund Change [Text Block] |
|
This is a summary of the changes to the Fund. For more complete information, you may review the Fund’s prospectus, which is available at columbiathreadneedleus.com/resources/literature or upon request at 1-800-345-6611. Effective September 1, 2025, the Fund's name was changed from Columbia Select Large Cap Equity Fund to Columbia Cornerstone Equity Fund. |
| Material Fund Change Name [Text Block] |
|
Effective September 1, 2025, the Fund's name was changed from Columbia Select Large Cap Equity Fund to Columbia Cornerstone Equity Fund.
|
| Summary of Change Legend [Text Block] |
|
This is a summary of the changes to the Fund. For more complete information, you may review the Fund’s prospectus, which is available at columbiathreadneedleus.com/resources/literature or upon request at 1-800-345-6611.
|
| Updated Prospectus Phone Number |
|
1-800-345-6611
|
| Updated Prospectus Web Address |
|
columbiathreadneedleus.com/resources/literature
|
| C000253706 |
|
|
| Shareholder Report [Line Items] |
|
|
| Fund Name |
|
Columbia Cornerstone Equity Fund
|
| Class Name |
|
Class S
|
| Trading Symbol |
|
NSEAX
|
| Annual or Semi-Annual Statement [Text Block] |
|
This annual shareholder report contains important information about Columbia Cornerstone Equity Fund (the Fund) for the period of March 1, 2025 to February 28, 2026.
|
| Additional Information [Text Block] |
|
You can find additional information about the Fund at columbiathreadneedleus.com/resources/literature. You can also request more information by contacting us at 1-800-345-6611.
|
| Material Fund Change Notice [Text Block] |
|
This report describes changes to the Fund that occurred during the reporting period.
|
| Additional Information Phone Number |
|
1-800-345-6611
|
| Additional Information Website |
|
columbiathreadneedleus.com/resources/literature
|
| Expenses [Text Block] |
|
What were the Fund costs for the reporting period? (Based on a hypothetical $10,000 investment)
Table Summary
Class |
Cost of a $10,000 investment |
Cost paid as a percentage of a $10,000 investment |
Class S |
$69 |
0.65% | |
| Expenses Paid, Amount |
|
$ 69
|
| Expense Ratio, Percent |
|
0.65%
|
| Factors Affecting Performance [Text Block] |
|
Management's Discussion of Fund Performance The performance of Class S shares for the period presented is shown in the Average Annual Total Returns table. Top Performance ContributorsStock selection | Selections in the financials and consumer discretionary sectors boosted the Fund’s relative performance during the annual period. Allocations | An underweight position in the information technology sector, alongside an overweight in the communication services sector, contributed to the Fund’s relative performance during the annual period. Individual holdings | A relative overweight position in Exact Sciences Corporation, a developer of molecular diagnostics and cancer screening tests; a relative overweight position in General Motors Company, a global automotive manufacturer; a relative overweight position in Parker‑Hannifin Corporation, a provider of motion and control technologies; a relative overweight position in TE Connectivity plc, a designer and manufacturer of connectivity and sensor solutions; and a relative overweight position in General Dynamics Corporation, an aerospace and defense company, were among the top contributors to the Fund’s relative performance. Top Performance DetractorsStock selection | Selections in the information technology, industrials, real estate and utilities sectors hurt the Fund’s relative performance during the annual period. Allocations | An underweight position in the energy sector, alongside overweight positions in the financials and consumer discretionary sectors, detracted from the Fund’s relative performance during the annual period. Individual holdings | A relative overweight position in ServiceNow, Inc., an enterprise workflow software provider; a relative overweight position in Broadcom, Inc., a designer and manufacturer of semiconductor and infrastructure software solutions; a relative overweight position in Palo Alto Networks, Inc., a cybersecurity platform provider; a relative overweight position in Constellation Brands, Inc., a producer and marketer of alcoholic beverages; and a relative overweight position in Bristol‑Myers Squibb Company, a global biopharmaceutical company, were among the top detractors from the Fund’s relative performance. |
| Performance Past Does Not Indicate Future [Text] |
|
The Fund's past performance is not a good predictor of the Fund's future performance.
|
| Line Graph [Table Text Block] |
|
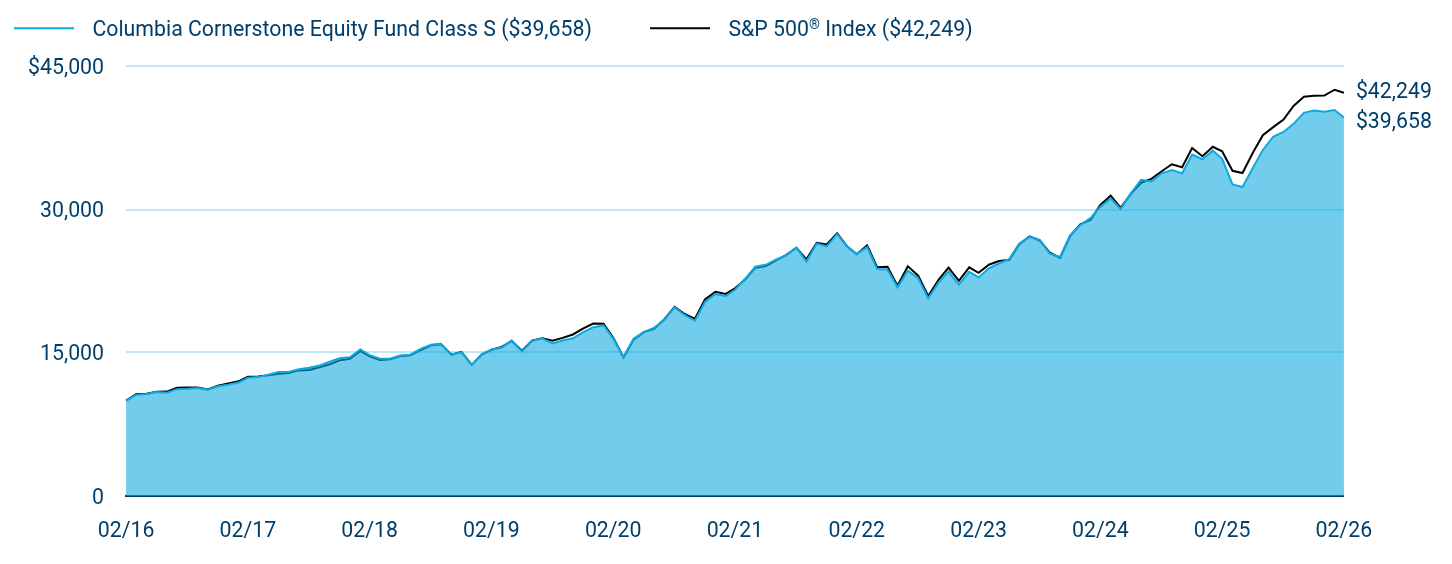
Table Summary
|
Columbia Cornerstone Equity Fund Class S ($39,658) |
S&P 500® Index ($42,249) |
02/16 |
$10,000 |
$10,000 |
03/16 |
$10,612 |
$10,678 |
04/16 |
$10,686 |
$10,720 |
05/16 |
$10,891 |
$10,912 |
06/16 |
$10,815 |
$10,941 |
07/16 |
$11,196 |
$11,344 |
08/16 |
$11,251 |
$11,360 |
09/16 |
$11,326 |
$11,362 |
10/16 |
$11,149 |
$11,155 |
11/16 |
$11,493 |
$11,568 |
12/16 |
$11,672 |
$11,797 |
01/17 |
$11,890 |
$12,020 |
02/17 |
$12,383 |
$12,498 |
03/17 |
$12,459 |
$12,512 |
04/17 |
$12,715 |
$12,641 |
05/17 |
$12,999 |
$12,818 |
06/17 |
$12,998 |
$12,898 |
07/17 |
$13,286 |
$13,164 |
08/17 |
$13,439 |
$13,204 |
09/17 |
$13,668 |
$13,476 |
10/17 |
$14,071 |
$13,791 |
11/17 |
$14,444 |
$14,214 |
12/17 |
$14,541 |
$14,372 |
01/18 |
$15,354 |
$15,195 |
02/18 |
$14,762 |
$14,635 |
03/18 |
$14,390 |
$14,263 |
04/18 |
$14,390 |
$14,317 |
05/18 |
$14,712 |
$14,662 |
06/18 |
$14,804 |
$14,753 |
07/18 |
$15,412 |
$15,302 |
08/18 |
$15,852 |
$15,800 |
09/18 |
$15,957 |
$15,890 |
10/18 |
$14,793 |
$14,804 |
11/18 |
$15,066 |
$15,106 |
12/18 |
$13,742 |
$13,742 |
01/19 |
$14,894 |
$14,843 |
02/19 |
$15,337 |
$15,320 |
03/19 |
$15,559 |
$15,617 |
04/19 |
$16,313 |
$16,250 |
05/19 |
$15,160 |
$15,217 |
06/19 |
$16,253 |
$16,289 |
07/19 |
$16,493 |
$16,523 |
08/19 |
$15,989 |
$16,262 |
09/19 |
$16,287 |
$16,566 |
10/19 |
$16,528 |
$16,925 |
11/19 |
$17,135 |
$17,539 |
12/19 |
$17,687 |
$18,069 |
01/20 |
$17,874 |
$18,061 |
02/20 |
$16,494 |
$16,575 |
03/20 |
$14,576 |
$14,527 |
04/20 |
$16,471 |
$16,390 |
05/20 |
$17,184 |
$17,170 |
06/20 |
$17,600 |
$17,512 |
07/20 |
$18,485 |
$18,499 |
08/20 |
$19,770 |
$19,829 |
09/20 |
$18,970 |
$19,076 |
10/20 |
$18,364 |
$18,568 |
11/20 |
$20,328 |
$20,601 |
12/20 |
$21,160 |
$21,393 |
01/21 |
$20,958 |
$21,177 |
02/21 |
$21,614 |
$21,761 |
03/21 |
$22,788 |
$22,714 |
04/21 |
$24,024 |
$23,926 |
05/21 |
$24,226 |
$24,093 |
06/21 |
$24,760 |
$24,656 |
07/21 |
$25,201 |
$25,241 |
08/21 |
$26,033 |
$26,009 |
09/21 |
$24,565 |
$24,799 |
10/21 |
$26,448 |
$26,537 |
11/21 |
$26,163 |
$26,353 |
12/21 |
$27,458 |
$27,534 |
01/22 |
$26,111 |
$26,109 |
02/22 |
$25,349 |
$25,327 |
03/22 |
$26,084 |
$26,268 |
04/22 |
$23,784 |
$23,977 |
05/22 |
$23,730 |
$24,021 |
06/22 |
$21,866 |
$22,038 |
07/22 |
$23,617 |
$24,070 |
08/22 |
$22,828 |
$23,089 |
09/22 |
$20,717 |
$20,962 |
10/22 |
$22,354 |
$22,659 |
11/22 |
$23,517 |
$23,926 |
12/22 |
$22,137 |
$22,547 |
01/23 |
$23,497 |
$23,964 |
02/23 |
$22,904 |
$23,379 |
03/23 |
$23,859 |
$24,238 |
04/23 |
$24,365 |
$24,616 |
05/23 |
$24,814 |
$24,723 |
06/23 |
$26,441 |
$26,357 |
07/23 |
$27,146 |
$27,203 |
08/23 |
$26,852 |
$26,770 |
09/23 |
$25,398 |
$25,494 |
10/23 |
$25,046 |
$24,958 |
11/23 |
$27,308 |
$27,237 |
12/23 |
$28,398 |
$28,474 |
01/24 |
$29,144 |
$28,953 |
02/24 |
$30,300 |
$30,499 |
03/24 |
$31,167 |
$31,480 |
04/24 |
$30,071 |
$30,194 |
05/24 |
$31,745 |
$31,692 |
06/24 |
$33,128 |
$32,829 |
07/24 |
$32,955 |
$33,228 |
08/24 |
$33,818 |
$34,034 |
09/24 |
$34,147 |
$34,761 |
10/24 |
$33,818 |
$34,446 |
11/24 |
$35,779 |
$36,468 |
12/24 |
$35,287 |
$35,599 |
01/25 |
$36,193 |
$36,590 |
02/25 |
$35,336 |
$36,113 |
03/25 |
$32,650 |
$34,078 |
04/25 |
$32,375 |
$33,847 |
05/25 |
$34,381 |
$35,977 |
06/25 |
$36,259 |
$37,807 |
07/25 |
$37,646 |
$38,655 |
08/25 |
$38,142 |
$39,439 |
09/25 |
$39,000 |
$40,878 |
10/25 |
$40,156 |
$41,835 |
11/25 |
$40,404 |
$41,938 |
12/25 |
$40,276 |
$41,964 |
01/26 |
$40,444 |
$42,572 |
02/26 |
$39,658 |
$42,249 |
|
| Average Annual Return [Table Text Block] |
|
Table Summary
Average Annual Total Returns (%) |
1 year |
5 years |
10 years |
Class SFootnote Reference(a) |
12.23 |
12.91 |
14.77 |
S&P 500® Index |
16.99 |
14.19 |
15.50 | |
| No Deduction of Taxes [Text Block] |
|
Performance does not reflect the deduction of taxes that a shareholder may pay on fund distributions or on the redemptions of fund shares.
|
| Material Change Date |
Sep. 01, 2025
|
|
| Updated Performance Information Location [Text Block] |
|
columbiathreadneedleus.com/investment-products/mutual-funds
|
| AssetsNet |
|
$ 1,569,593,480
|
| Holdings Count | Holding |
|
58
|
| Advisory Fees Paid, Amount |
|
$ 11,343,116
|
| InvestmentCompanyPortfolioTurnover |
|
71.00%
|
| Additional Fund Statistics [Text Block] |
|
Table Summary
Fund net assets |
$1,569,593,480 |
Total number of portfolio holdings |
58 |
Management services fees (represents 0.71% of Fund average net assets) |
$11,343,116 |
Portfolio turnover for the reporting period |
71% | |
| Holdings [Text Block] |
|
Table Summary
Information Technology |
30.1% |
Financials |
14.5% |
Consumer Discretionary |
12.5% |
Communication Services |
11.5% |
Health Care |
10.5% |
Industrials |
8.8% |
Utilities |
4.2% |
Consumer Staples |
4.0% |
Real Estate |
1.8% |
Energy |
1.3% |
Table Summary
Common Stocks |
99.2% |
Other |
0.8% | |
| Largest Holdings [Text Block] |
|
Table Summary
NVIDIA Corp. |
7.8% |
Alphabet, Inc., Class C |
6.7% |
Microsoft Corp. |
6.1% |
Apple, Inc. |
5.1% |
Amazon.com, Inc. |
4.6% |
Broadcom, Inc. |
4.1% |
Meta Platforms, Inc., Class A |
3.2% |
JPMorgan Chase & Co. |
3.0% |
Eli Lilly & Co. |
2.4% |
Citigroup, Inc. |
2.1% | |
| Material Fund Change [Text Block] |
|
This is a summary of the changes to the Fund. For more complete information, you may review the Fund’s prospectus, which is available at columbiathreadneedleus.com/resources/literature or upon request at 1-800-345-6611. Effective September 1, 2025, the Fund's name was changed from Columbia Select Large Cap Equity Fund to Columbia Cornerstone Equity Fund. |
| Material Fund Change Name [Text Block] |
|
Effective September 1, 2025, the Fund's name was changed from Columbia Select Large Cap Equity Fund to Columbia Cornerstone Equity Fund.
|
| Summary of Change Legend [Text Block] |
|
This is a summary of the changes to the Fund. For more complete information, you may review the Fund’s prospectus, which is available at columbiathreadneedleus.com/resources/literature or upon request at 1-800-345-6611.
|
| Updated Prospectus Phone Number |
|
1-800-345-6611
|
| Updated Prospectus Web Address |
|
columbiathreadneedleus.com/resources/literature
|
| C000122583 |
|
|
| Shareholder Report [Line Items] |
|
|
| Fund Name |
|
Columbia Cornerstone Equity Fund
|
| Class Name |
|
Institutional 2 Class
|
| Trading Symbol |
|
CLCRX
|
| Annual or Semi-Annual Statement [Text Block] |
|
This annual shareholder report contains important information about Columbia Cornerstone Equity Fund (the Fund) for the period of March 1, 2025 to February 28, 2026.
|
| Additional Information [Text Block] |
|
You can find additional information about the Fund at columbiathreadneedleus.com/resources/literature. You can also request more information by contacting us at 1-800-345-6611.
|
| Material Fund Change Notice [Text Block] |
|
This report describes changes to the Fund that occurred during the reporting period.
|
| Additional Information Phone Number |
|
1-800-345-6611
|
| Additional Information Website |
|
columbiathreadneedleus.com/resources/literature
|
| Expenses [Text Block] |
|
What were the Fund costs for the reporting period? (Based on a hypothetical $10,000 investment)
Table Summary
Class |
Cost of a $10,000 investment |
Cost paid as a percentage of a $10,000 investment |
Institutional 2 Class |
$63 |
0.59% | |
| Expenses Paid, Amount |
|
$ 63
|
| Expense Ratio, Percent |
|
0.59%
|
| Factors Affecting Performance [Text Block] |
|
Management's Discussion of Fund Performance The performance of Institutional 2 Class shares for the period presented is shown in the Average Annual Total Returns table. Top Performance ContributorsStock selection | Selections in the financials and consumer discretionary sectors boosted the Fund’s relative performance during the annual period. Allocations | An underweight position in the information technology sector, alongside an overweight in the communication services sector, contributed to the Fund’s relative performance during the annual period. Individual holdings | A relative overweight position in Exact Sciences Corporation, a developer of molecular diagnostics and cancer screening tests; a relative overweight position in General Motors Company, a global automotive manufacturer; a relative overweight position in Parker‑Hannifin Corporation, a provider of motion and control technologies; a relative overweight position in TE Connectivity plc, a designer and manufacturer of connectivity and sensor solutions; and a relative overweight position in General Dynamics Corporation, an aerospace and defense company, were among the top contributors to the Fund’s relative performance. Top Performance DetractorsStock selection | Selections in the information technology, industrials, real estate and utilities sectors hurt the Fund’s relative performance during the annual period. Allocations | An underweight position in the energy sector, alongside overweight positions in the financials and consumer discretionary sectors, detracted from the Fund’s relative performance during the annual period. Individual holdings | A relative overweight position in ServiceNow, Inc., an enterprise workflow software provider; a relative overweight position in Broadcom, Inc., a designer and manufacturer of semiconductor and infrastructure software solutions; a relative overweight position in Palo Alto Networks, Inc., a cybersecurity platform provider; a relative overweight position in Constellation Brands, Inc., a producer and marketer of alcoholic beverages; and a relative overweight position in Bristol‑Myers Squibb Company, a global biopharmaceutical company, were among the top detractors from the Fund’s relative performance. |
| Performance Past Does Not Indicate Future [Text] |
|
The Fund's past performance is not a good predictor of the Fund's future performance.
|
| Line Graph [Table Text Block] |
|

Table Summary
|
Columbia Cornerstone Equity Fund Institutional 2 Class ($39,970) |
S&P 500® Index ($42,249) |
02/16 |
$10,000 |
$10,000 |
03/16 |
$10,624 |
$10,678 |
04/16 |
$10,697 |
$10,720 |
05/16 |
$10,905 |
$10,912 |
06/16 |
$10,824 |
$10,941 |
07/16 |
$11,213 |
$11,344 |
08/16 |
$11,268 |
$11,360 |
09/16 |
$11,340 |
$11,362 |
10/16 |
$11,168 |
$11,155 |
11/16 |
$11,512 |
$11,568 |
12/16 |
$11,696 |
$11,797 |
01/17 |
$11,909 |
$12,020 |
02/17 |
$12,409 |
$12,498 |
03/17 |
$12,473 |
$12,512 |
04/17 |
$12,742 |
$12,641 |
05/17 |
$13,029 |
$12,818 |
06/17 |
$13,020 |
$12,898 |
07/17 |
$13,310 |
$13,164 |
08/17 |
$13,459 |
$13,204 |
09/17 |
$13,693 |
$13,476 |
10/17 |
$14,094 |
$13,791 |
11/17 |
$14,468 |
$14,214 |
12/17 |
$14,560 |
$14,372 |
01/18 |
$15,381 |
$15,195 |
02/18 |
$14,785 |
$14,635 |
03/18 |
$14,413 |
$14,263 |
04/18 |
$14,413 |
$14,317 |
05/18 |
$14,736 |
$14,662 |
06/18 |
$14,837 |
$14,753 |
07/18 |
$15,450 |
$15,302 |
08/18 |
$15,889 |
$15,800 |
09/18 |
$15,991 |
$15,890 |
10/18 |
$14,827 |
$14,804 |
11/18 |
$15,103 |
$15,106 |
12/18 |
$13,770 |
$13,742 |
01/19 |
$14,935 |
$14,843 |
02/19 |
$15,377 |
$15,320 |
03/19 |
$15,603 |
$15,617 |
04/19 |
$16,358 |
$16,250 |
05/19 |
$15,204 |
$15,217 |
06/19 |
$16,302 |
$16,289 |
07/19 |
$16,547 |
$16,523 |
08/19 |
$16,046 |
$16,262 |
09/19 |
$16,335 |
$16,566 |
10/19 |
$16,591 |
$16,925 |
11/19 |
$17,192 |
$17,539 |
12/19 |
$17,741 |
$18,069 |
01/20 |
$17,934 |
$18,061 |
02/20 |
$16,547 |
$16,575 |
03/20 |
$14,636 |
$14,527 |
04/20 |
$16,524 |
$16,390 |
05/20 |
$17,252 |
$17,170 |
06/20 |
$17,670 |
$17,512 |
07/20 |
$18,553 |
$18,499 |
08/20 |
$19,848 |
$19,829 |
09/20 |
$19,048 |
$19,076 |
10/20 |
$18,435 |
$18,568 |
11/20 |
$20,413 |
$20,601 |
12/20 |
$21,257 |
$21,393 |
01/21 |
$21,061 |
$21,177 |
02/21 |
$21,710 |
$21,761 |
03/21 |
$22,885 |
$22,714 |
04/21 |
$24,147 |
$23,926 |
05/21 |
$24,355 |
$24,093 |
06/21 |
$24,888 |
$24,656 |
07/21 |
$25,328 |
$25,241 |
08/21 |
$26,160 |
$26,009 |
09/21 |
$24,686 |
$24,799 |
10/21 |
$26,575 |
$26,537 |
11/21 |
$26,298 |
$26,353 |
12/21 |
$27,607 |
$27,534 |
01/22 |
$26,250 |
$26,109 |
02/22 |
$25,498 |
$25,327 |
03/22 |
$26,223 |
$26,268 |
04/22 |
$23,917 |
$23,977 |
05/22 |
$23,851 |
$24,021 |
06/22 |
$21,997 |
$22,038 |
07/22 |
$23,745 |
$24,070 |
08/22 |
$22,954 |
$23,089 |
09/22 |
$20,831 |
$20,962 |
10/22 |
$22,496 |
$22,659 |
11/22 |
$23,662 |
$23,926 |
12/22 |
$22,258 |
$22,547 |
01/23 |
$23,629 |
$23,964 |
02/23 |
$23,041 |
$23,379 |
03/23 |
$23,993 |
$24,238 |
04/23 |
$24,524 |
$24,616 |
05/23 |
$24,958 |
$24,723 |
06/23 |
$26,604 |
$26,357 |
07/23 |
$27,314 |
$27,203 |
08/23 |
$27,030 |
$26,770 |
09/23 |
$25,554 |
$25,494 |
10/23 |
$25,199 |
$24,958 |
11/23 |
$27,484 |
$27,237 |
12/23 |
$28,579 |
$28,474 |
01/24 |
$29,343 |
$28,953 |
02/24 |
$30,503 |
$30,499 |
03/24 |
$31,384 |
$31,480 |
04/24 |
$30,268 |
$30,194 |
05/24 |
$31,957 |
$31,692 |
06/24 |
$33,354 |
$32,829 |
07/24 |
$33,173 |
$33,228 |
08/24 |
$34,050 |
$34,034 |
09/24 |
$34,383 |
$34,761 |
10/24 |
$34,050 |
$34,446 |
11/24 |
$36,032 |
$36,468 |
12/24 |
$35,533 |
$35,599 |
01/25 |
$36,453 |
$36,590 |
02/25 |
$35,580 |
$36,113 |
03/25 |
$32,883 |
$34,078 |
04/25 |
$32,618 |
$33,847 |
05/25 |
$34,645 |
$35,977 |
06/25 |
$36,521 |
$37,807 |
07/25 |
$37,936 |
$38,655 |
08/25 |
$38,429 |
$39,439 |
09/25 |
$39,287 |
$40,878 |
10/25 |
$40,464 |
$41,835 |
11/25 |
$40,718 |
$41,938 |
12/25 |
$40,582 |
$41,964 |
01/26 |
$40,759 |
$42,572 |
02/26 |
$39,970 |
$42,249 |
|
| Average Annual Return [Table Text Block] |
|
Table Summary
Average Annual Total Returns (%) |
1 year |
5 years |
10 years |
Institutional 2 Class |
12.34 |
12.98 |
14.86 |
S&P 500® Index |
16.99 |
14.19 |
15.50 | |
| No Deduction of Taxes [Text Block] |
|
Performance does not reflect the deduction of taxes that a shareholder may pay on fund distributions or on the redemptions of fund shares.
|
| Material Change Date |
Sep. 01, 2025
|
|
| Updated Performance Information Location [Text Block] |
|
columbiathreadneedleus.com/investment-products/mutual-funds
|
| AssetsNet |
|
$ 1,569,593,480
|
| Holdings Count | Holding |
|
58
|
| Advisory Fees Paid, Amount |
|
$ 11,343,116
|
| InvestmentCompanyPortfolioTurnover |
|
71.00%
|
| Additional Fund Statistics [Text Block] |
|
Table Summary
Fund net assets |
$1,569,593,480 |
Total number of portfolio holdings |
58 |
Management services fees (represents 0.71% of Fund average net assets) |
$11,343,116 |
Portfolio turnover for the reporting period |
71% | |
| Holdings [Text Block] |
|
Table Summary
Information Technology |
30.1% |
Financials |
14.5% |
Consumer Discretionary |
12.5% |
Communication Services |
11.5% |
Health Care |
10.5% |
Industrials |
8.8% |
Utilities |
4.2% |
Consumer Staples |
4.0% |
Real Estate |
1.8% |
Energy |
1.3% |
Table Summary
Common Stocks |
99.2% |
Other |
0.8% | |
| Largest Holdings [Text Block] |
|
Table Summary
NVIDIA Corp. |
7.8% |
Alphabet, Inc., Class C |
6.7% |
Microsoft Corp. |
6.1% |
Apple, Inc. |
5.1% |
Amazon.com, Inc. |
4.6% |
Broadcom, Inc. |
4.1% |
Meta Platforms, Inc., Class A |
3.2% |
JPMorgan Chase & Co. |
3.0% |
Eli Lilly & Co. |
2.4% |
Citigroup, Inc. |
2.1% | |
| Material Fund Change [Text Block] |
|
This is a summary of the changes to the Fund. For more complete information, you may review the Fund’s prospectus, which is available at columbiathreadneedleus.com/resources/literature or upon request at 1-800-345-6611. Effective September 1, 2025, the Fund's name was changed from Columbia Select Large Cap Equity Fund to Columbia Cornerstone Equity Fund. |
| Material Fund Change Name [Text Block] |
|
Effective September 1, 2025, the Fund's name was changed from Columbia Select Large Cap Equity Fund to Columbia Cornerstone Equity Fund.
|
| Summary of Change Legend [Text Block] |
|
This is a summary of the changes to the Fund. For more complete information, you may review the Fund’s prospectus, which is available at columbiathreadneedleus.com/resources/literature or upon request at 1-800-345-6611.
|
| Updated Prospectus Phone Number |
|
1-800-345-6611
|
| Updated Prospectus Web Address |
|
columbiathreadneedleus.com/resources/literature
|
| C000173198 |
|
|
| Shareholder Report [Line Items] |
|
|
| Fund Name |
|
Columbia Cornerstone Equity Fund
|
| Class Name |
|
Institutional 3 Class
|
| Trading Symbol |
|
CLEYX
|
| Annual or Semi-Annual Statement [Text Block] |
|
This annual shareholder report contains important information about Columbia Cornerstone Equity Fund (the Fund) for the period of March 1, 2025 to February 28, 2026.
|
| Additional Information [Text Block] |
|
You can find additional information about the Fund at columbiathreadneedleus.com/resources/literature. You can also request more information by contacting us at 1-800-345-6611.
|
| Material Fund Change Notice [Text Block] |
|
This report describes changes to the Fund that occurred during the reporting period.
|
| Additional Information Phone Number |
|
1-800-345-6611
|
| Additional Information Website |
|
columbiathreadneedleus.com/resources/literature
|
| Expenses [Text Block] |
|
What were the Fund costs for the reporting period? (Based on a hypothetical $10,000 investment)
Table Summary
Class |
Cost of a $10,000 investment |
Cost paid as a percentage of a $10,000 investment |
Institutional 3 Class |
$57 |
0.54% | |
| Expenses Paid, Amount |
|
$ 57
|
| Expense Ratio, Percent |
|
0.54%
|
| Factors Affecting Performance [Text Block] |
|
Management's Discussion of Fund Performance The performance of Institutional 3 Class shares for the period presented is shown in the Average Annual Total Returns table. Top Performance ContributorsStock selection | Selections in the financials and consumer discretionary sectors boosted the Fund’s relative performance during the annual period. Allocations | An underweight position in the information technology sector, alongside an overweight in the communication services sector, contributed to the Fund’s relative performance during the annual period. Individual holdings | A relative overweight position in Exact Sciences Corporation, a developer of molecular diagnostics and cancer screening tests; a relative overweight position in General Motors Company, a global automotive manufacturer; a relative overweight position in Parker‑Hannifin Corporation, a provider of motion and control technologies; a relative overweight position in TE Connectivity plc, a designer and manufacturer of connectivity and sensor solutions; and a relative overweight position in General Dynamics Corporation, an aerospace and defense company, were among the top contributors to the Fund’s relative performance. Top Performance DetractorsStock selection | Selections in the information technology, industrials, real estate and utilities sectors hurt the Fund’s relative performance during the annual period. Allocations | An underweight position in the energy sector, alongside overweight positions in the financials and consumer discretionary sectors, detracted from the Fund’s relative performance during the annual period. Individual holdings | A relative overweight position in ServiceNow, Inc., an enterprise workflow software provider; a relative overweight position in Broadcom, Inc., a designer and manufacturer of semiconductor and infrastructure software solutions; a relative overweight position in Palo Alto Networks, Inc., a cybersecurity platform provider; a relative overweight position in Constellation Brands, Inc., a producer and marketer of alcoholic beverages; and a relative overweight position in Bristol‑Myers Squibb Company, a global biopharmaceutical company, were among the top detractors from the Fund’s relative performance. |
| Performance Past Does Not Indicate Future [Text] |
|
The Fund's past performance is not a good predictor of the Fund's future performance.
|
| Line Graph [Table Text Block] |
|
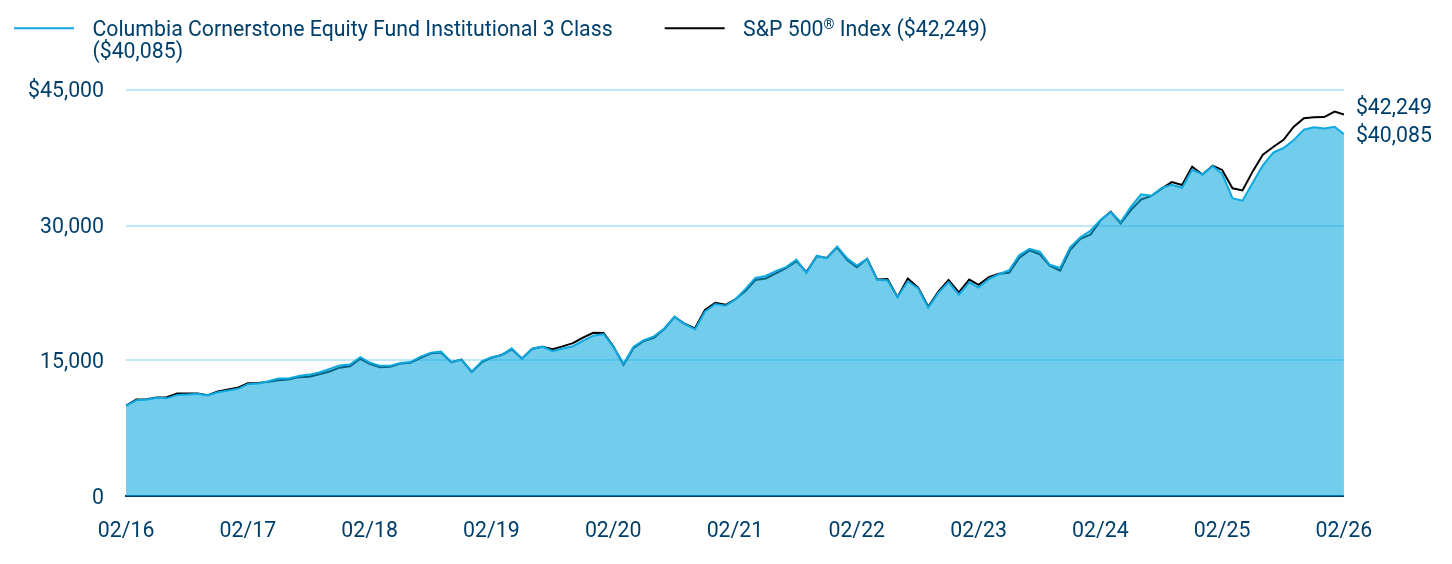
Table Summary
|
Columbia Cornerstone Equity Fund Institutional 3 Class ($40,085) |
S&P 500® Index ($42,249) |
02/16 |
$10,000 |
$10,000 |
03/16 |
$10,612 |
$10,678 |
04/16 |
$10,686 |
$10,720 |
05/16 |
$10,891 |
$10,912 |
06/16 |
$10,815 |
$10,941 |
07/16 |
$11,196 |
$11,344 |
08/16 |
$11,251 |
$11,360 |
09/16 |
$11,326 |
$11,362 |
10/16 |
$11,149 |
$11,155 |
11/16 |
$11,493 |
$11,568 |
12/16 |
$11,672 |
$11,797 |
01/17 |
$11,890 |
$12,020 |
02/17 |
$12,383 |
$12,498 |
03/17 |
$12,458 |
$12,512 |
04/17 |
$12,717 |
$12,641 |
05/17 |
$13,015 |
$12,818 |
06/17 |
$13,007 |
$12,898 |
07/17 |
$13,298 |
$13,164 |
08/17 |
$13,443 |
$13,204 |
09/17 |
$13,676 |
$13,476 |
10/17 |
$14,083 |
$13,791 |
11/17 |
$14,462 |
$14,214 |
12/17 |
$14,555 |
$14,372 |
01/18 |
$15,369 |
$15,195 |
02/18 |
$14,779 |
$14,635 |
03/18 |
$14,412 |
$14,263 |
04/18 |
$14,412 |
$14,317 |
05/18 |
$14,728 |
$14,662 |
06/18 |
$14,834 |
$14,753 |
07/18 |
$15,441 |
$15,302 |
08/18 |
$15,878 |
$15,800 |
09/18 |
$15,985 |
$15,890 |
10/18 |
$14,824 |
$14,804 |
11/18 |
$15,101 |
$15,106 |
12/18 |
$13,771 |
$13,742 |
01/19 |
$14,932 |
$14,843 |
02/19 |
$15,372 |
$15,320 |
03/19 |
$15,598 |
$15,617 |
04/19 |
$16,353 |
$16,250 |
05/19 |
$15,203 |
$15,217 |
06/19 |
$16,307 |
$16,289 |
07/19 |
$16,540 |
$16,523 |
08/19 |
$16,038 |
$16,262 |
09/19 |
$16,342 |
$16,566 |
10/19 |
$16,587 |
$16,925 |
11/19 |
$17,193 |
$17,539 |
12/19 |
$17,752 |
$18,069 |
01/20 |
$17,943 |
$18,061 |
02/20 |
$16,559 |
$16,575 |
03/20 |
$14,638 |
$14,527 |
04/20 |
$16,535 |
$16,390 |
05/20 |
$17,251 |
$17,170 |
06/20 |
$17,679 |
$17,512 |
07/20 |
$18,557 |
$18,499 |
08/20 |
$19,856 |
$19,829 |
09/20 |
$19,052 |
$19,076 |
10/20 |
$18,446 |
$18,568 |
11/20 |
$20,426 |
$20,601 |
12/20 |
$21,258 |
$21,393 |
01/21 |
$21,064 |
$21,177 |
02/21 |
$21,735 |
$21,761 |
03/21 |
$22,909 |
$22,714 |
04/21 |
$24,160 |
$23,926 |
05/21 |
$24,367 |
$24,093 |
06/21 |
$24,904 |
$24,656 |
07/21 |
$25,342 |
$25,241 |
08/21 |
$26,180 |
$26,009 |
09/21 |
$24,705 |
$24,799 |
10/21 |
$26,605 |
$26,537 |
11/21 |
$26,326 |
$26,353 |
12/21 |
$27,637 |
$27,534 |
01/22 |
$26,285 |
$26,109 |
02/22 |
$25,518 |
$25,327 |
03/22 |
$26,257 |
$26,268 |
04/22 |
$23,942 |
$23,977 |
05/22 |
$23,886 |
$24,021 |
06/22 |
$22,023 |
$22,038 |
07/22 |
$23,777 |
$24,070 |
08/22 |
$22,981 |
$23,089 |
09/22 |
$20,860 |
$20,962 |
10/22 |
$22,524 |
$22,659 |
11/22 |
$23,688 |
$23,926 |
12/22 |
$22,296 |
$22,547 |
01/23 |
$23,663 |
$23,964 |
02/23 |
$23,084 |
$23,379 |
03/23 |
$24,035 |
$24,238 |
04/23 |
$24,555 |
$24,616 |
05/23 |
$25,001 |
$24,723 |
06/23 |
$26,663 |
$26,357 |
07/23 |
$27,373 |
$27,203 |
08/23 |
$27,071 |
$26,770 |
09/23 |
$25,606 |
$25,494 |
10/23 |
$25,259 |
$24,958 |
11/23 |
$27,539 |
$27,237 |
12/23 |
$28,639 |
$28,474 |
01/24 |
$29,406 |
$28,953 |
02/24 |
$30,565 |
$30,499 |
03/24 |
$31,442 |
$31,480 |
04/24 |
$30,346 |
$30,194 |
05/24 |
$32,037 |
$31,692 |
06/24 |
$33,419 |
$32,829 |
07/24 |
$33,258 |
$33,228 |
08/24 |
$34,130 |
$34,034 |
09/24 |
$34,470 |
$34,761 |
10/24 |
$34,130 |
$34,446 |
11/24 |
$36,118 |
$36,468 |
12/24 |
$35,615 |
$35,599 |
01/25 |
$36,533 |
$36,590 |
02/25 |
$35,682 |
$36,113 |
03/25 |
$32,977 |
$34,078 |
04/25 |
$32,710 |
$33,847 |
05/25 |
$34,730 |
$35,977 |
06/25 |
$36,626 |
$37,807 |
07/25 |
$38,041 |
$38,655 |
08/25 |
$38,536 |
$39,439 |
09/25 |
$39,405 |
$40,878 |
10/25 |
$40,582 |
$41,835 |
11/25 |
$40,838 |
$41,938 |
12/25 |
$40,707 |
$41,964 |
01/26 |
$40,879 |
$42,572 |
02/26 |
$40,085 |
$42,249 |
|
| Average Annual Return [Table Text Block] |
|
Table Summary
Average Annual Total Returns (%) |
1 year |
5 years |
10 years |
Institutional 3 ClassFootnote Reference(a) |
12.34 |
13.02 |
14.89 |
S&P 500® Index |
16.99 |
14.19 |
15.50 | |
| No Deduction of Taxes [Text Block] |
|
Performance does not reflect the deduction of taxes that a shareholder may pay on fund distributions or on the redemptions of fund shares.
|
| Material Change Date |
Sep. 01, 2025
|
|
| Updated Performance Information Location [Text Block] |
|
columbiathreadneedleus.com/investment-products/mutual-funds
|
| AssetsNet |
|
$ 1,569,593,480
|
| Holdings Count | Holding |
|
58
|
| Advisory Fees Paid, Amount |
|
$ 11,343,116
|
| InvestmentCompanyPortfolioTurnover |
|
71.00%
|
| Additional Fund Statistics [Text Block] |
|
Table Summary
Fund net assets |
$1,569,593,480 |
Total number of portfolio holdings |
58 |
Management services fees (represents 0.71% of Fund average net assets) |
$11,343,116 |
Portfolio turnover for the reporting period |
71% | |
| Holdings [Text Block] |
|
Table Summary
Information Technology |
30.1% |
Financials |
14.5% |
Consumer Discretionary |
12.5% |
Communication Services |
11.5% |
Health Care |
10.5% |
Industrials |
8.8% |
Utilities |
4.2% |
Consumer Staples |
4.0% |
Real Estate |
1.8% |
Energy |
1.3% |
Table Summary
Common Stocks |
99.2% |
Other |
0.8% | |
| Largest Holdings [Text Block] |
|
Table Summary
NVIDIA Corp. |
7.8% |
Alphabet, Inc., Class C |
6.7% |
Microsoft Corp. |
6.1% |
Apple, Inc. |
5.1% |
Amazon.com, Inc. |
4.6% |
Broadcom, Inc. |
4.1% |
Meta Platforms, Inc., Class A |
3.2% |
JPMorgan Chase & Co. |
3.0% |
Eli Lilly & Co. |
2.4% |
Citigroup, Inc. |
2.1% | |
| Material Fund Change [Text Block] |
|
This is a summary of the changes to the Fund. For more complete information, you may review the Fund’s prospectus, which is available at columbiathreadneedleus.com/resources/literature or upon request at 1-800-345-6611. Effective September 1, 2025, the Fund's name was changed from Columbia Select Large Cap Equity Fund to Columbia Cornerstone Equity Fund. |
| Material Fund Change Name [Text Block] |
|
Effective September 1, 2025, the Fund's name was changed from Columbia Select Large Cap Equity Fund to Columbia Cornerstone Equity Fund.
|
| Summary of Change Legend [Text Block] |
|
This is a summary of the changes to the Fund. For more complete information, you may review the Fund’s prospectus, which is available at columbiathreadneedleus.com/resources/literature or upon request at 1-800-345-6611.
|
| Updated Prospectus Phone Number |
|
1-800-345-6611
|
| Updated Prospectus Web Address |
|
columbiathreadneedleus.com/resources/literature
|
| C000029868 |
|
|
| Shareholder Report [Line Items] |
|
|
| Fund Name |
|
Columbia Cornerstone Equity Fund
|
| Class Name |
|
Institutional Class
|
| Trading Symbol |
|
NSEPX
|
| Annual or Semi-Annual Statement [Text Block] |
|
This annual shareholder report contains important information about Columbia Cornerstone Equity Fund (the Fund) for the period of March 1, 2025 to February 28, 2026.
|
| Additional Information [Text Block] |
|
You can find additional information about the Fund at columbiathreadneedleus.com/resources/literature. You can also request more information by contacting us at 1-800-345-6611.
|
| Material Fund Change Notice [Text Block] |
|
This report describes changes to the Fund that occurred during the reporting period.
|
| Additional Information Phone Number |
|
1-800-345-6611
|
| Additional Information Website |
|
columbiathreadneedleus.com/resources/literature
|
| Expenses [Text Block] |
|
What were the Fund costs for the reporting period? (Based on a hypothetical $10,000 investment)
Table Summary
Class |
Cost of a $10,000 investment |
Cost paid as a percentage of a $10,000 investment |
Institutional Class |
$69 |
0.65% | |
| Expenses Paid, Amount |
|
$ 69
|
| Expense Ratio, Percent |
|
0.65%
|
| Factors Affecting Performance [Text Block] |
|
Management's Discussion of Fund Performance The performance of Institutional Class shares for the period presented is shown in the Average Annual Total Returns table. Top Performance ContributorsStock selection | Selections in the financials and consumer discretionary sectors boosted the Fund’s relative performance during the annual period. Allocations | An underweight position in the information technology sector, alongside an overweight in the communication services sector, contributed to the Fund’s relative performance during the annual period. Individual holdings | A relative overweight position in Exact Sciences Corporation, a developer of molecular diagnostics and cancer screening tests; a relative overweight position in General Motors Company, a global automotive manufacturer; a relative overweight position in Parker‑Hannifin Corporation, a provider of motion and control technologies; a relative overweight position in TE Connectivity plc, a designer and manufacturer of connectivity and sensor solutions; and a relative overweight position in General Dynamics Corporation, an aerospace and defense company, were among the top contributors to the Fund’s relative performance. Top Performance DetractorsStock selection | Selections in the information technology, industrials, real estate and utilities sectors hurt the Fund’s relative performance during the annual period. Allocations | An underweight position in the energy sector, alongside overweight positions in the financials and consumer discretionary sectors, detracted from the Fund’s relative performance during the annual period. Individual holdings | A relative overweight position in ServiceNow, Inc., an enterprise workflow software provider; a relative overweight position in Broadcom, Inc., a designer and manufacturer of semiconductor and infrastructure software solutions; a relative overweight position in Palo Alto Networks, Inc., a cybersecurity platform provider; a relative overweight position in Constellation Brands, Inc., a producer and marketer of alcoholic beverages; and a relative overweight position in Bristol‑Myers Squibb Company, a global biopharmaceutical company, were among the top detractors from the Fund’s relative performance. |
| Performance Past Does Not Indicate Future [Text] |
|
The Fund's past performance is not a good predictor of the Fund's future performance.
|
| Line Graph [Table Text Block] |
|

Table Summary
|
Columbia Cornerstone Equity Fund Institutional Class ($39,650) |
S&P 500® Index ($42,249) |
02/16 |
$10,000 |
$10,000 |
03/16 |
$10,612 |
$10,678 |
04/16 |
$10,686 |
$10,720 |
05/16 |
$10,891 |
$10,912 |
06/16 |
$10,815 |
$10,941 |
07/16 |
$11,196 |
$11,344 |
08/16 |
$11,251 |
$11,360 |
09/16 |
$11,326 |
$11,362 |
10/16 |
$11,149 |
$11,155 |
11/16 |
$11,493 |
$11,568 |
12/16 |
$11,672 |
$11,797 |
01/17 |
$11,890 |
$12,020 |
02/17 |
$12,383 |
$12,498 |
03/17 |
$12,459 |
$12,512 |
04/17 |
$12,715 |
$12,641 |
05/17 |
$12,999 |
$12,818 |
06/17 |
$12,998 |
$12,898 |
07/17 |
$13,286 |
$13,164 |
08/17 |
$13,439 |
$13,204 |
09/17 |
$13,668 |
$13,476 |
10/17 |
$14,071 |
$13,791 |
11/17 |
$14,444 |
$14,214 |
12/17 |
$14,541 |
$14,372 |
01/18 |
$15,354 |
$15,195 |
02/18 |
$14,762 |
$14,635 |
03/18 |
$14,390 |
$14,263 |
04/18 |
$14,390 |
$14,317 |
05/18 |
$14,712 |
$14,662 |
06/18 |
$14,804 |
$14,753 |
07/18 |
$15,412 |
$15,302 |
08/18 |
$15,852 |
$15,800 |
09/18 |
$15,957 |
$15,890 |
10/18 |
$14,793 |
$14,804 |
11/18 |
$15,066 |
$15,106 |
12/18 |
$13,742 |
$13,742 |
01/19 |
$14,894 |
$14,843 |
02/19 |
$15,337 |
$15,320 |
03/19 |
$15,559 |
$15,617 |
04/19 |
$16,313 |
$16,250 |
05/19 |
$15,160 |
$15,217 |
06/19 |
$16,253 |
$16,289 |
07/19 |
$16,493 |
$16,523 |
08/19 |
$15,989 |
$16,262 |
09/19 |
$16,287 |
$16,566 |
10/19 |
$16,528 |
$16,925 |
11/19 |
$17,135 |
$17,539 |
12/19 |
$17,687 |
$18,069 |
01/20 |
$17,874 |
$18,061 |
02/20 |
$16,494 |
$16,575 |
03/20 |
$14,576 |
$14,527 |
04/20 |
$16,471 |
$16,390 |
05/20 |
$17,184 |
$17,170 |
06/20 |
$17,600 |
$17,512 |
07/20 |
$18,485 |
$18,499 |
08/20 |
$19,770 |
$19,829 |
09/20 |
$18,970 |
$19,076 |
10/20 |
$18,364 |
$18,568 |
11/20 |
$20,328 |
$20,601 |
12/20 |
$21,160 |
$21,393 |
01/21 |
$20,958 |
$21,177 |
02/21 |
$21,614 |
$21,761 |
03/21 |
$22,788 |
$22,714 |
04/21 |
$24,024 |
$23,926 |
05/21 |
$24,226 |
$24,093 |
06/21 |
$24,760 |
$24,656 |
07/21 |
$25,201 |
$25,241 |
08/21 |
$26,033 |
$26,009 |
09/21 |
$24,565 |
$24,799 |
10/21 |
$26,448 |
$26,537 |
11/21 |
$26,163 |
$26,353 |
12/21 |
$27,458 |
$27,534 |
01/22 |
$26,111 |
$26,109 |
02/22 |
$25,349 |
$25,327 |
03/22 |
$26,084 |
$26,268 |
04/22 |
$23,784 |
$23,977 |
05/22 |
$23,730 |
$24,021 |
06/22 |
$21,866 |
$22,038 |
07/22 |
$23,617 |
$24,070 |
08/22 |
$22,828 |
$23,089 |
09/22 |
$20,717 |
$20,962 |
10/22 |
$22,354 |
$22,659 |
11/22 |
$23,517 |
$23,926 |
12/22 |
$22,137 |
$22,547 |
01/23 |
$23,497 |
$23,964 |
02/23 |
$22,904 |
$23,379 |
03/23 |
$23,859 |
$24,238 |
04/23 |
$24,365 |
$24,616 |
05/23 |
$24,814 |
$24,723 |
06/23 |
$26,441 |
$26,357 |
07/23 |
$27,146 |
$27,203 |
08/23 |
$26,852 |
$26,770 |
09/23 |
$25,398 |
$25,494 |
10/23 |
$25,046 |
$24,958 |
11/23 |
$27,308 |
$27,237 |
12/23 |
$28,398 |
$28,474 |
01/24 |
$29,144 |
$28,953 |
02/24 |
$30,300 |
$30,499 |
03/24 |
$31,167 |
$31,480 |
04/24 |
$30,071 |
$30,194 |
05/24 |
$31,745 |
$31,692 |
06/24 |
$33,128 |
$32,829 |
07/24 |
$32,955 |
$33,228 |
08/24 |
$33,818 |
$34,034 |
09/24 |
$34,147 |
$34,761 |
10/24 |
$33,802 |
$34,446 |
11/24 |
$35,779 |
$36,468 |
12/24 |
$35,277 |
$35,599 |
01/25 |
$36,183 |
$36,590 |
02/25 |
$35,325 |
$36,113 |
03/25 |
$32,655 |
$34,078 |
04/25 |
$32,380 |
$33,847 |
05/25 |
$34,387 |
$35,977 |
06/25 |
$36,250 |
$37,807 |
07/25 |
$37,654 |
$38,655 |
08/25 |
$38,133 |
$39,439 |
09/25 |
$38,992 |
$40,878 |
10/25 |
$40,148 |
$41,835 |
11/25 |
$40,395 |
$41,938 |
12/25 |
$40,268 |
$41,964 |
01/26 |
$40,452 |
$42,572 |
02/26 |
$39,650 |
$42,249 |
|
| Average Annual Return [Table Text Block] |
|
Table Summary
Average Annual Total Returns (%) |
1 year |
5 years |
10 years |
Institutional Class |
12.24 |
12.90 |
14.77 |
S&P 500® Index |
16.99 |
14.19 |
15.50 | |
| No Deduction of Taxes [Text Block] |
|
Performance does not reflect the deduction of taxes that a shareholder may pay on fund distributions or on the redemptions of fund shares.
|
| Material Change Date |
Sep. 01, 2025
|
|
| Updated Performance Information Location [Text Block] |
|
columbiathreadneedleus.com/investment-products/mutual-funds
|
| AssetsNet |
|
$ 1,569,593,480
|
| Holdings Count | Holding |
|
58
|
| Advisory Fees Paid, Amount |
|
$ 11,343,116
|
| InvestmentCompanyPortfolioTurnover |
|
71.00%
|
| Additional Fund Statistics [Text Block] |
|
Table Summary
Fund net assets |
$1,569,593,480 |
Total number of portfolio holdings |
58 |
Management services fees (represents 0.71% of Fund average net assets) |
$11,343,116 |
Portfolio turnover for the reporting period |
71% | |
| Holdings [Text Block] |
|
Table Summary
Information Technology |
30.1% |
Financials |
14.5% |
Consumer Discretionary |
12.5% |
Communication Services |
11.5% |
Health Care |
10.5% |
Industrials |
8.8% |
Utilities |
4.2% |
Consumer Staples |
4.0% |
Real Estate |
1.8% |
Energy |
1.3% |
Table Summary
Common Stocks |
99.2% |
Other |
0.8% | |
| Largest Holdings [Text Block] |
|
Table Summary
NVIDIA Corp. |
7.8% |
Alphabet, Inc., Class C |
6.7% |
Microsoft Corp. |
6.1% |
Apple, Inc. |
5.1% |
Amazon.com, Inc. |
4.6% |
Broadcom, Inc. |
4.1% |
Meta Platforms, Inc., Class A |
3.2% |
JPMorgan Chase & Co. |
3.0% |
Eli Lilly & Co. |
2.4% |
Citigroup, Inc. |
2.1% | |
| Material Fund Change [Text Block] |
|
This is a summary of the changes to the Fund. For more complete information, you may review the Fund’s prospectus, which is available at columbiathreadneedleus.com/resources/literature or upon request at 1-800-345-6611. Effective September 1, 2025, the Fund's name was changed from Columbia Select Large Cap Equity Fund to Columbia Cornerstone Equity Fund. |
| Material Fund Change Name [Text Block] |
|
Effective September 1, 2025, the Fund's name was changed from Columbia Select Large Cap Equity Fund to Columbia Cornerstone Equity Fund.
|
| Summary of Change Legend [Text Block] |
|
This is a summary of the changes to the Fund. For more complete information, you may review the Fund’s prospectus, which is available at columbiathreadneedleus.com/resources/literature or upon request at 1-800-345-6611.
|
| Updated Prospectus Phone Number |
|
1-800-345-6611
|
| Updated Prospectus Web Address |
|
columbiathreadneedleus.com/resources/literature
|
| C000030031 |
|
|
| Shareholder Report [Line Items] |
|
|
| Fund Name |
|
Columbia Large Cap Enhanced Core Fund
|
| Class Name |
|
Class A
|
| Trading Symbol |
|
NMIAX
|
| Annual or Semi-Annual Statement [Text Block] |
|
This annual shareholder report contains important information about Columbia Large Cap Enhanced Core Fund (the Fund) for the period of March 1, 2025 to February 28, 2026.
|
| Additional Information [Text Block] |
|
You can find additional information about the Fund at columbiathreadneedleus.com/resources/literature. You can also request more information by contacting us at 1-800-345-6611.
|
| Additional Information Phone Number |
|
1-800-345-6611
|
| Additional Information Website |
|
columbiathreadneedleus.com/resources/literature
|
| Expenses [Text Block] |
|
What were the Fund costs for the reporting period? (Based on a hypothetical $10,000 investment)
Table Summary
Class |
Cost of a $10,000 investment |
Cost paid as a percentage of a $10,000 investment |
Class A |
$90 |
0.83% | |
| Expenses Paid, Amount |
|
$ 90
|
| Expense Ratio, Percent |
|
0.83%
|
| Factors Affecting Performance [Text Block] |
|
Management's Discussion of Fund Performance The performance of Class A shares for the period presented is shown in the Average Annual Total Returns table. Top Performance ContributorsStock selection | Selections in the health care, financials and consumer discretionary sectors boosted the Fund’s relative performance most during the annual period. Allocations | Overweight allocations to oil and gas companies and interactive media and an underweight allocation to insurance companies aided the Fund’s relative performance during the period. Individual holdings | Positions in Lam Research, a firm that designs and manufactures semiconductors; Viatris, a global health care company; and Newmont Corporation, an exploration and mining company, were top contributors to the Fund’s relative performance during the period. Top Performance DetractorsStock selection | Selections in the industrials, information technology and consumer staples sectors hurt the Fund’s relative performance during the annual period. Allocations | Overweight allocations in the aerospace and defense and specialized REITs industries and an underweight allocation in the semiconductors industry detracted from the Fund’s relative results during the period. Individual holdings | The Fund’s underweight position in Micron, a memory and storage solutions company; an overweight position in ServiceNow, a firm that provides a workflow platform for digital businesses; and an overweight in Adobe, a global technology company focused on digital marketing and media solutions, were top detractors from the Fund’s relative performance during the period. |
| Performance Past Does Not Indicate Future [Text] |
|
The Fund's past performance is not a good predictor of the Fund's future performance.
|
| Line Graph [Table Text Block] |
|
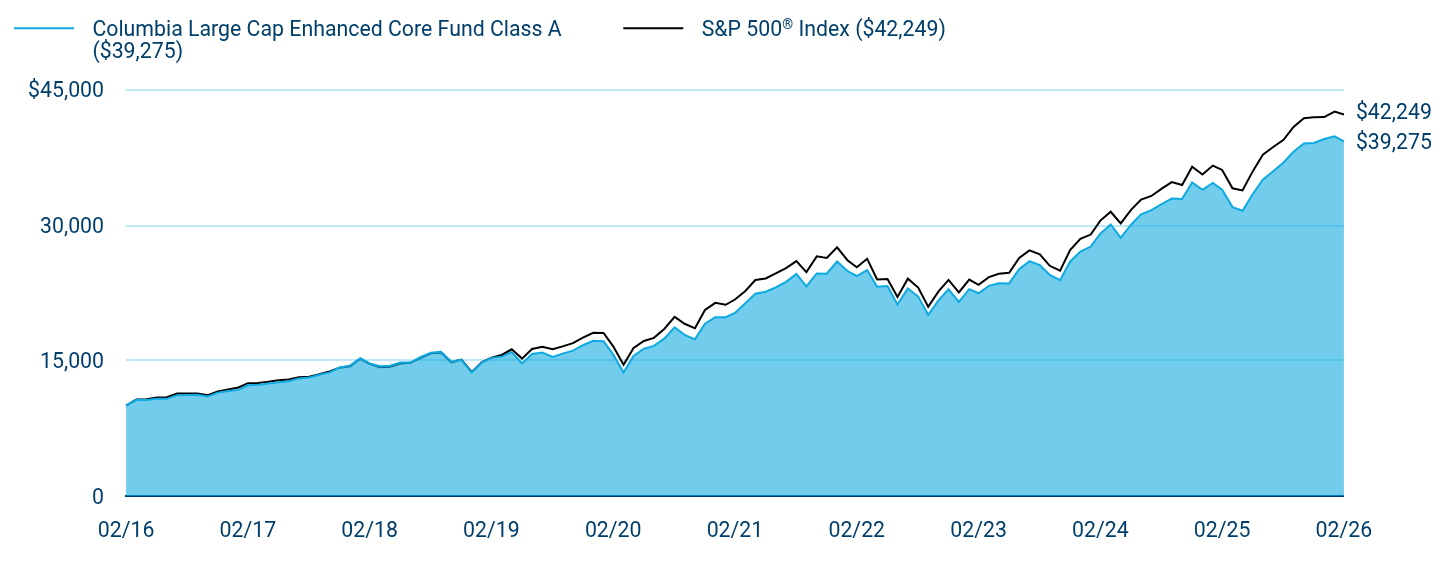
Table Summary
|
Columbia Large Cap Enhanced Core Fund Class A ($39,275) |
S&P 500® Index ($42,249) |
02/16 |
$10,000 |
$10,000 |
03/16 |
$10,645 |
$10,678 |
04/16 |
$10,620 |
$10,720 |
05/16 |
$10,767 |
$10,912 |
06/16 |
$10,761 |
$10,941 |
07/16 |
$11,168 |
$11,344 |
08/16 |
$11,173 |
$11,360 |
09/16 |
$11,209 |
$11,362 |
10/16 |
$11,031 |
$11,155 |
11/16 |
$11,448 |
$11,568 |
12/16 |
$11,628 |
$11,797 |
01/17 |
$11,752 |
$12,020 |
02/17 |
$12,262 |
$12,498 |
03/17 |
$12,308 |
$12,512 |
04/17 |
$12,447 |
$12,641 |
05/17 |
$12,591 |
$12,818 |
06/17 |
$12,703 |
$12,898 |
07/17 |
$13,024 |
$13,164 |
08/17 |
$13,115 |
$13,204 |
09/17 |
$13,420 |
$13,476 |
10/17 |
$13,693 |
$13,791 |
11/17 |
$14,229 |
$14,214 |
12/17 |
$14,433 |
$14,372 |
01/18 |
$15,252 |
$15,195 |
02/18 |
$14,690 |
$14,635 |
03/18 |
$14,369 |
$14,263 |
04/18 |
$14,421 |
$14,317 |
05/18 |
$14,778 |
$14,662 |
06/18 |
$14,783 |
$14,753 |
07/18 |
$15,394 |
$15,302 |
08/18 |
$15,859 |
$15,800 |
09/18 |
$15,969 |
$15,890 |
10/18 |
$14,880 |
$14,804 |
11/18 |
$15,076 |
$15,106 |
12/18 |
$13,698 |
$13,742 |
01/19 |
$14,811 |
$14,843 |
02/19 |
$15,298 |
$15,320 |
03/19 |
$15,435 |
$15,617 |
04/19 |
$15,936 |
$16,250 |
05/19 |
$14,674 |
$15,217 |
06/19 |
$15,726 |
$16,289 |
07/19 |
$15,878 |
$16,523 |
08/19 |
$15,409 |
$16,262 |
09/19 |
$15,766 |
$16,566 |
10/19 |
$16,103 |
$16,925 |
11/19 |
$16,698 |
$17,539 |
12/19 |
$17,192 |
$18,069 |
01/20 |
$17,151 |
$18,061 |
02/20 |
$15,654 |
$16,575 |
03/20 |
$13,683 |
$14,527 |
04/20 |
$15,519 |
$16,390 |
05/20 |
$16,311 |
$17,170 |
06/20 |
$16,626 |
$17,512 |
07/20 |
$17,428 |
$18,499 |
08/20 |
$18,667 |
$19,829 |
09/20 |
$17,851 |
$19,076 |
10/20 |
$17,348 |
$18,568 |
11/20 |
$19,082 |
$20,601 |
12/20 |
$19,806 |
$21,393 |
01/21 |
$19,799 |
$21,177 |
02/21 |
$20,277 |
$21,761 |
03/21 |
$21,350 |
$22,714 |
04/21 |
$22,402 |
$23,926 |
05/21 |
$22,622 |
$24,093 |
06/21 |
$23,093 |
$24,656 |
07/21 |
$23,714 |
$25,241 |
08/21 |
$24,591 |
$26,009 |
09/21 |
$23,225 |
$24,799 |
10/21 |
$24,653 |
$26,537 |
11/21 |
$24,622 |
$26,353 |
12/21 |
$25,965 |
$27,534 |
01/22 |
$24,913 |
$26,109 |
02/22 |
$24,364 |
$25,327 |
03/22 |
$25,027 |
$26,268 |
04/22 |
$23,170 |
$23,977 |
05/22 |
$23,255 |
$24,021 |
06/22 |
$21,194 |
$22,038 |
07/22 |
$22,993 |
$24,070 |
08/22 |
$22,088 |
$23,089 |
09/22 |
$20,068 |
$20,962 |
10/22 |
$21,656 |
$22,659 |
11/22 |
$22,893 |
$23,926 |
12/22 |
$21,494 |
$22,547 |
01/23 |
$22,906 |
$23,964 |
02/23 |
$22,453 |
$23,379 |
03/23 |
$23,267 |
$24,238 |
04/23 |
$23,555 |
$24,616 |
05/23 |
$23,545 |
$24,723 |
06/23 |
$25,121 |
$26,357 |
07/23 |
$26,010 |
$27,203 |
08/23 |
$25,571 |
$26,770 |
09/23 |
$24,483 |
$25,494 |
10/23 |
$23,908 |
$24,958 |
11/23 |
$25,947 |
$27,237 |
12/23 |
$27,060 |
$28,474 |
01/24 |
$27,622 |
$28,953 |
02/24 |
$29,059 |
$30,499 |
03/24 |
$30,074 |
$31,480 |
04/24 |
$28,594 |
$30,194 |
05/24 |
$30,042 |
$31,692 |
06/24 |
$31,202 |
$32,829 |
07/24 |
$31,653 |
$33,228 |
08/24 |
$32,318 |
$34,034 |
09/24 |
$32,950 |
$34,761 |
10/24 |
$32,882 |
$34,446 |
11/24 |
$34,732 |
$36,468 |
12/24 |
$33,901 |
$35,599 |
01/25 |
$34,660 |
$36,590 |
02/25 |
$33,926 |
$36,113 |
03/25 |
$31,991 |
$34,078 |
04/25 |
$31,587 |
$33,847 |
05/25 |
$33,448 |
$35,977 |
06/25 |
$35,035 |
$37,807 |
07/25 |
$35,968 |
$38,655 |
08/25 |
$36,938 |
$39,439 |
09/25 |
$38,136 |
$40,878 |
10/25 |
$39,044 |
$41,835 |
11/25 |
$39,094 |
$41,938 |
12/25 |
$39,539 |
$41,964 |
01/26 |
$39,830 |
$42,572 |
02/26 |
$39,275 |
$42,249 |
|
| Average Annual Return [Table Text Block] |
|
Table Summary
Average Annual Total Returns (%) |
1 year |
5 years |
10 years |
Class A |
15.77 |
14.14 |
14.66 |
S&P 500® Index |
16.99 |
14.19 |
15.50 | |
| No Deduction of Taxes [Text Block] |
|
Performance does not reflect the deduction of taxes that a shareholder may pay on fund distributions or on the redemptions of fund shares.
|
| Updated Performance Information Location [Text Block] |
|
columbiathreadneedleus.com/investment-products/mutual-funds
|
| AssetsNet |
|
$ 440,592,353
|
| Holdings Count | Holding |
|
102
|
| Advisory Fees Paid, Amount |
|
$ 3,605,133
|
| InvestmentCompanyPortfolioTurnover |
|
72.00%
|
| Additional Fund Statistics [Text Block] |
|
Table Summary
Fund net assets |
$440,592,353 |
Total number of portfolio holdings |
102 |
Management services fees (represents 0.75% of Fund average net assets) |
$3,605,133 |
Portfolio turnover for the reporting period |
72% | |
| Holdings [Text Block] |
|
Table Summary
Information Technology |
32.3% |
Financials |
12.0% |
Health Care |
10.3% |
Communication Services |
9.9% |
Consumer Discretionary |
9.7% |
Industrials |
8.7% |
Consumer Staples |
5.1% |
Energy |
3.9% |
Utilities |
2.9% |
Real Estate |
1.9% |
Other |
1.8% |
Table Summary
Common Stocks |
98.5% |
Money Market Funds |
1.5% | |
| Largest Holdings [Text Block] |
|
Table Summary
NVIDIA Corp. |
7.9% |
Apple, Inc. |
6.8% |
Alphabet, Inc., Class A |
6.1% |
Microsoft Corp. |
4.7% |
Amazon.com, Inc. |
3.4% |
Meta Platforms, Inc., Class A |
3.2% |
Broadcom, Inc. |
2.8% |
Exxon Mobil Corp. |
1.8% |
Tesla, Inc. |
1.4% |
Procter & Gamble Co. (The) |
1.4% | |
| Material Fund Change [Text Block] |
|
|
| C000030032 |
|
|
| Shareholder Report [Line Items] |
|
|
| Fund Name |
|
Columbia Large Cap Enhanced Core Fund
|
| Class Name |
|
Class R
|
| Trading Symbol |
|
CCERX
|
| Annual or Semi-Annual Statement [Text Block] |
|
This annual shareholder report contains important information about Columbia Large Cap Enhanced Core Fund (the Fund) for the period of March 1, 2025 to February 28, 2026.
|
| Additional Information [Text Block] |
|
You can find additional information about the Fund at columbiathreadneedleus.com/resources/literature. You can also request more information by contacting us at 1-800-345-6611.
|
| Additional Information Phone Number |
|
1-800-345-6611
|
| Additional Information Website |
|
columbiathreadneedleus.com/resources/literature
|
| Expenses [Text Block] |
|
What were the Fund costs for the reporting period? (Based on a hypothetical $10,000 investment)
Table Summary
Class |
Cost of a $10,000 investment |
Cost paid as a percentage of a $10,000 investment |
Class R |
$116 |
1.08% | |
| Expenses Paid, Amount |
|
$ 116
|
| Expense Ratio, Percent |
|
1.08%
|
| Factors Affecting Performance [Text Block] |
|
Management's Discussion of Fund Performance The performance of Class R shares for the period presented is shown in the Average Annual Total Returns table. Top Performance ContributorsStock selection | Selections in the health care, financials and consumer discretionary sectors boosted the Fund’s relative performance most during the annual period. Allocations | Overweight allocations to oil and gas companies and interactive media and an underweight allocation to insurance companies aided the Fund’s relative performance during the period. Individual holdings | Positions in Lam Research, a firm that designs and manufactures semiconductors; Viatris, a global health care company; and Newmont Corporation, an exploration and mining company, were top contributors to the Fund’s relative performance during the period. Top Performance DetractorsStock selection | Selections in the industrials, information technology and consumer staples sectors hurt the Fund’s relative performance during the annual period. Allocations | Overweight allocations in the aerospace and defense and specialized REITs industries and an underweight allocation in the semiconductors industry detracted from the Fund’s relative results during the period. Individual holdings | The Fund’s underweight position in Micron, a memory and storage solutions company; an overweight position in ServiceNow, a firm that provides a workflow platform for digital businesses; and an overweight in Adobe, a global technology company focused on digital marketing and media solutions, were top detractors from the Fund’s relative performance during the period. |
| Performance Past Does Not Indicate Future [Text] |
|
The Fund's past performance is not a good predictor of the Fund's future performance.
|
| Line Graph [Table Text Block] |
|
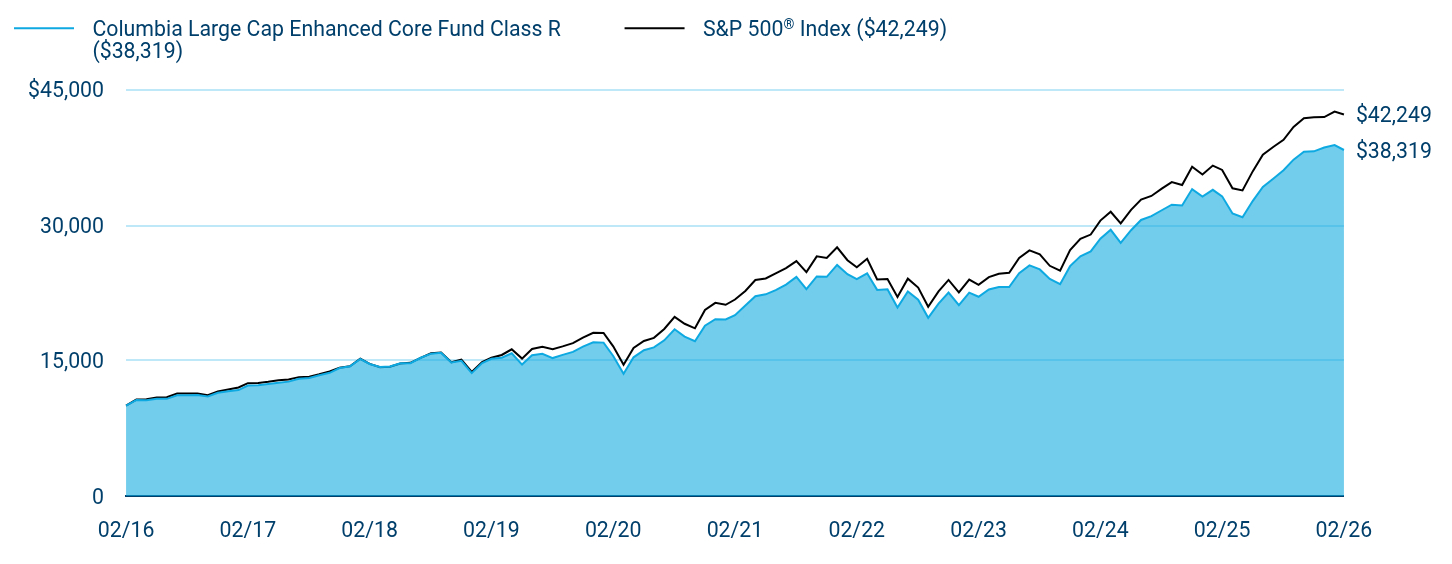
Table Summary
|
Columbia Large Cap Enhanced Core Fund Class R ($38,319) |
S&P 500® Index ($42,249) |
02/16 |
$10,000 |
$10,000 |
03/16 |
$10,641 |
$10,678 |
04/16 |
$10,615 |
$10,720 |
05/16 |
$10,763 |
$10,912 |
06/16 |
$10,758 |
$10,941 |
07/16 |
$11,156 |
$11,344 |
08/16 |
$11,166 |
$11,360 |
09/16 |
$11,196 |
$11,362 |
10/16 |
$11,018 |
$11,155 |
11/16 |
$11,426 |
$11,568 |
12/16 |
$11,608 |
$11,797 |
01/17 |
$11,727 |
$12,020 |
02/17 |
$12,236 |
$12,498 |
03/17 |
$12,277 |
$12,512 |
04/17 |
$12,416 |
$12,641 |
05/17 |
$12,555 |
$12,818 |
06/17 |
$12,667 |
$12,898 |
07/17 |
$12,983 |
$13,164 |
08/17 |
$13,068 |
$13,204 |
09/17 |
$13,368 |
$13,476 |
10/17 |
$13,640 |
$13,791 |
11/17 |
$14,170 |
$14,214 |
12/17 |
$14,367 |
$14,372 |
01/18 |
$15,183 |
$15,195 |
02/18 |
$14,624 |
$14,635 |
03/18 |
$14,297 |
$14,263 |
04/18 |
$14,344 |
$14,317 |
05/18 |
$14,699 |
$14,662 |
06/18 |
$14,704 |
$14,753 |
07/18 |
$15,307 |
$15,302 |
08/18 |
$15,764 |
$15,800 |
09/18 |
$15,868 |
$15,890 |
10/18 |
$14,789 |
$14,804 |
11/18 |
$14,972 |
$15,106 |
12/18 |
$13,606 |
$13,742 |
01/19 |
$14,712 |
$14,843 |
02/19 |
$15,191 |
$15,320 |
03/19 |
$15,320 |
$15,617 |
04/19 |
$15,812 |
$16,250 |
05/19 |
$14,557 |
$15,217 |
06/19 |
$15,597 |
$16,289 |
07/19 |
$15,748 |
$16,523 |
08/19 |
$15,275 |
$16,262 |
09/19 |
$15,630 |
$16,566 |
10/19 |
$15,965 |
$16,925 |
11/19 |
$16,544 |
$17,539 |
12/19 |
$17,028 |
$18,069 |
01/20 |
$16,987 |
$18,061 |
02/20 |
$15,501 |
$16,575 |
03/20 |
$13,544 |
$14,527 |
04/20 |
$15,360 |
$16,390 |
05/20 |
$16,147 |
$17,170 |
06/20 |
$16,452 |
$17,512 |
07/20 |
$17,240 |
$18,499 |
08/20 |
$18,462 |
$19,829 |
09/20 |
$17,652 |
$19,076 |
10/20 |
$17,146 |
$18,568 |
11/20 |
$18,860 |
$20,601 |
12/20 |
$19,572 |
$21,393 |
01/21 |
$19,557 |
$21,177 |
02/21 |
$20,030 |
$21,761 |
03/21 |
$21,087 |
$22,714 |
04/21 |
$22,121 |
$23,926 |
05/21 |
$22,332 |
$24,093 |
06/21 |
$22,797 |
$24,656 |
07/21 |
$23,405 |
$25,241 |
08/21 |
$24,266 |
$26,009 |
09/21 |
$22,913 |
$24,799 |
10/21 |
$24,312 |
$26,537 |
11/21 |
$24,274 |
$26,353 |
12/21 |
$25,591 |
$27,534 |
01/22 |
$24,560 |
$26,109 |
02/22 |
$24,007 |
$25,327 |
03/22 |
$24,663 |
$26,268 |
04/22 |
$22,826 |
$23,977 |
05/22 |
$22,901 |
$24,021 |
06/22 |
$20,871 |
$22,038 |
07/22 |
$22,641 |
$24,070 |
08/22 |
$21,736 |
$23,089 |
09/22 |
$19,737 |
$20,962 |
10/22 |
$21,298 |
$22,659 |
11/22 |
$22,521 |
$23,926 |
12/22 |
$21,132 |
$22,547 |
01/23 |
$22,525 |
$23,964 |
02/23 |
$22,068 |
$23,379 |
03/23 |
$22,871 |
$24,238 |
04/23 |
$23,146 |
$24,616 |
05/23 |
$23,135 |
$24,723 |
06/23 |
$24,672 |
$26,357 |
07/23 |
$25,538 |
$27,203 |
08/23 |
$25,094 |
$26,770 |
09/23 |
$24,032 |
$25,494 |
10/23 |
$23,455 |
$24,958 |
11/23 |
$25,455 |
$27,237 |
12/23 |
$26,543 |
$28,474 |
01/24 |
$27,086 |
$28,953 |
02/24 |
$28,490 |
$30,499 |
03/24 |
$29,480 |
$31,480 |
04/24 |
$28,022 |
$30,194 |
05/24 |
$29,437 |
$31,692 |
06/24 |
$30,568 |
$32,829 |
07/24 |
$31,002 |
$33,228 |
08/24 |
$31,646 |
$34,034 |
09/24 |
$32,256 |
$34,761 |
10/24 |
$32,179 |
$34,446 |
11/24 |
$33,988 |
$36,468 |
12/24 |
$33,162 |
$35,599 |
01/25 |
$33,908 |
$36,590 |
02/25 |
$33,186 |
$36,113 |
03/25 |
$31,284 |
$34,078 |
04/25 |
$30,875 |
$33,847 |
05/25 |
$32,692 |
$35,977 |
06/25 |
$34,237 |
$37,807 |
07/25 |
$35,142 |
$38,655 |
08/25 |
$36,084 |
$39,439 |
09/25 |
$37,249 |
$40,878 |
10/25 |
$38,116 |
$41,835 |
11/25 |
$38,166 |
$41,938 |
12/25 |
$38,591 |
$41,964 |
01/26 |
$38,864 |
$42,572 |
02/26 |
$38,319 |
$42,249 |
|
| Average Annual Return [Table Text Block] |
|
Table Summary
Average Annual Total Returns (%) |
1 year |
5 years |
10 years |
Class R |
15.47 |
13.85 |
14.38 |
S&P 500® Index |
16.99 |
14.19 |
15.50 | |
| No Deduction of Taxes [Text Block] |
|
Performance does not reflect the deduction of taxes that a shareholder may pay on fund distributions or on the redemptions of fund shares.
|
| Updated Performance Information Location [Text Block] |
|
columbiathreadneedleus.com/investment-products/mutual-funds
|
| AssetsNet |
|
$ 440,592,353
|
| Holdings Count | Holding |
|
102
|
| Advisory Fees Paid, Amount |
|
$ 3,605,133
|
| InvestmentCompanyPortfolioTurnover |
|
72.00%
|
| Additional Fund Statistics [Text Block] |
|
Table Summary
Fund net assets |
$440,592,353 |
Total number of portfolio holdings |
102 |
Management services fees (represents 0.75% of Fund average net assets) |
$3,605,133 |
Portfolio turnover for the reporting period |
72% | |
| Holdings [Text Block] |
|
Table Summary
Information Technology |
32.3% |
Financials |
12.0% |
Health Care |
10.3% |
Communication Services |
9.9% |
Consumer Discretionary |
9.7% |
Industrials |
8.7% |
Consumer Staples |
5.1% |
Energy |
3.9% |
Utilities |
2.9% |
Real Estate |
1.9% |
Other |
1.8% |
Table Summary
Common Stocks |
98.5% |
Money Market Funds |
1.5% | |
| Largest Holdings [Text Block] |
|
Table Summary
NVIDIA Corp. |
7.9% |
Apple, Inc. |
6.8% |
Alphabet, Inc., Class A |
6.1% |
Microsoft Corp. |
4.7% |
Amazon.com, Inc. |
3.4% |
Meta Platforms, Inc., Class A |
3.2% |
Broadcom, Inc. |
2.8% |
Exxon Mobil Corp. |
1.8% |
Tesla, Inc. |
1.4% |
Procter & Gamble Co. (The) |
1.4% | |
| Material Fund Change [Text Block] |
|
|
| C000253708 |
|
|
| Shareholder Report [Line Items] |
|
|
| Fund Name |
|
Columbia Large Cap Enhanced Core Fund
|
| Class Name |
|
Class S
|
| Trading Symbol |
|
NMIDX
|
| Annual or Semi-Annual Statement [Text Block] |
|
This annual shareholder report contains important information about Columbia Large Cap Enhanced Core Fund (the Fund) for the period of March 1, 2025 to February 28, 2026.
|
| Additional Information [Text Block] |
|
You can find additional information about the Fund at columbiathreadneedleus.com/resources/literature. You can also request more information by contacting us at 1-800-345-6611.
|
| Additional Information Phone Number |
|
1-800-345-6611
|
| Additional Information Website |
|
columbiathreadneedleus.com/resources/literature
|
| Expenses [Text Block] |
|
What were the Fund costs for the reporting period? (Based on a hypothetical $10,000 investment)
Table Summary
Class |
Cost of a $10,000 investment |
Cost paid as a percentage of a $10,000 investment |
Class S |
$63 |
0.58% | |
| Expenses Paid, Amount |
|
$ 63
|
| Expense Ratio, Percent |
|
0.58%
|
| Factors Affecting Performance [Text Block] |
|
Management's Discussion of Fund Performance The performance of Class S shares for the period presented is shown in the Average Annual Total Returns table. Top Performance ContributorsStock selection | Selections in the health care, financials and consumer discretionary sectors boosted the Fund’s relative performance most during the annual period. Allocations | Overweight allocations to oil and gas companies and interactive media and an underweight allocation to insurance companies aided the Fund’s relative performance during the period. Individual holdings | Positions in Lam Research, a firm that designs and manufactures semiconductors; Viatris, a global health care company; and Newmont Corporation, an exploration and mining company, were top contributors to the Fund’s relative performance during the period. Top Performance DetractorsStock selection | Selections in the industrials, information technology and consumer staples sectors hurt the Fund’s relative performance during the annual period. Allocations | Overweight allocations in the aerospace and defense and specialized REITs industries and an underweight allocation in the semiconductors industry detracted from the Fund’s relative results during the period. Individual holdings | The Fund’s underweight position in Micron, a memory and storage solutions company; an overweight position in ServiceNow, a firm that provides a workflow platform for digital businesses; and an overweight in Adobe, a global technology company focused on digital marketing and media solutions, were top detractors from the Fund’s relative performance during the period. |
| Performance Past Does Not Indicate Future [Text] |
|
The Fund's past performance is not a good predictor of the Fund's future performance.
|
| Line Graph [Table Text Block] |
|

Table Summary
|
Columbia Large Cap Enhanced Core Fund Class S ($39,416) |
S&P 500® Index ($42,249) |
02/16 |
$10,000 |
$10,000 |
03/16 |
$10,645 |
$10,678 |
04/16 |
$10,620 |
$10,720 |
05/16 |
$10,767 |
$10,912 |
06/16 |
$10,761 |
$10,941 |
07/16 |
$11,168 |
$11,344 |
08/16 |
$11,173 |
$11,360 |
09/16 |
$11,209 |
$11,362 |
10/16 |
$11,031 |
$11,155 |
11/16 |
$11,448 |
$11,568 |
12/16 |
$11,628 |
$11,797 |
01/17 |
$11,752 |
$12,020 |
02/17 |
$12,262 |
$12,498 |
03/17 |
$12,308 |
$12,512 |
04/17 |
$12,447 |
$12,641 |
05/17 |
$12,591 |
$12,818 |
06/17 |
$12,703 |
$12,898 |
07/17 |
$13,024 |
$13,164 |
08/17 |
$13,115 |
$13,204 |
09/17 |
$13,420 |
$13,476 |
10/17 |
$13,693 |
$13,791 |
11/17 |
$14,229 |
$14,214 |
12/17 |
$14,433 |
$14,372 |
01/18 |
$15,252 |
$15,195 |
02/18 |
$14,690 |
$14,635 |
03/18 |
$14,369 |
$14,263 |
04/18 |
$14,421 |
$14,317 |
05/18 |
$14,778 |
$14,662 |
06/18 |
$14,783 |
$14,753 |
07/18 |
$15,394 |
$15,302 |
08/18 |
$15,859 |
$15,800 |
09/18 |
$15,969 |
$15,890 |
10/18 |
$14,880 |
$14,804 |
11/18 |
$15,076 |
$15,106 |
12/18 |
$13,698 |
$13,742 |
01/19 |
$14,811 |
$14,843 |
02/19 |
$15,298 |
$15,320 |
03/19 |
$15,435 |
$15,617 |
04/19 |
$15,936 |
$16,250 |
05/19 |
$14,674 |
$15,217 |
06/19 |
$15,726 |
$16,289 |
07/19 |
$15,878 |
$16,523 |
08/19 |
$15,409 |
$16,262 |
09/19 |
$15,766 |
$16,566 |
10/19 |
$16,103 |
$16,925 |
11/19 |
$16,698 |
$17,539 |
12/19 |
$17,192 |
$18,069 |
01/20 |
$17,151 |
$18,061 |
02/20 |
$15,654 |
$16,575 |
03/20 |
$13,683 |
$14,527 |
04/20 |
$15,519 |
$16,390 |
05/20 |
$16,311 |
$17,170 |
06/20 |
$16,626 |
$17,512 |
07/20 |
$17,428 |
$18,499 |
08/20 |
$18,667 |
$19,829 |
09/20 |
$17,851 |
$19,076 |
10/20 |
$17,348 |
$18,568 |
11/20 |
$19,082 |
$20,601 |
12/20 |
$19,806 |
$21,393 |
01/21 |
$19,799 |
$21,177 |
02/21 |
$20,277 |
$21,761 |
03/21 |
$21,350 |
$22,714 |
04/21 |
$22,402 |
$23,926 |
05/21 |
$22,622 |
$24,093 |
06/21 |
$23,093 |
$24,656 |
07/21 |
$23,714 |
$25,241 |
08/21 |
$24,591 |
$26,009 |
09/21 |
$23,225 |
$24,799 |
10/21 |
$24,653 |
$26,537 |
11/21 |
$24,622 |
$26,353 |
12/21 |
$25,965 |
$27,534 |
01/22 |
$24,913 |
$26,109 |
02/22 |
$24,364 |
$25,327 |
03/22 |
$25,027 |
$26,268 |
04/22 |
$23,170 |
$23,977 |
05/22 |
$23,255 |
$24,021 |
06/22 |
$21,194 |
$22,038 |
07/22 |
$22,993 |
$24,070 |
08/22 |
$22,088 |
$23,089 |
09/22 |
$20,068 |
$20,962 |
10/22 |
$21,656 |
$22,659 |
11/22 |
$22,893 |
$23,926 |
12/22 |
$21,494 |
$22,547 |
01/23 |
$22,906 |
$23,964 |
02/23 |
$22,453 |
$23,379 |
03/23 |
$23,267 |
$24,238 |
04/23 |
$23,555 |
$24,616 |
05/23 |
$23,545 |
$24,723 |
06/23 |
$25,121 |
$26,357 |
07/23 |
$26,010 |
$27,203 |
08/23 |
$25,571 |
$26,770 |
09/23 |
$24,483 |
$25,494 |
10/23 |
$23,908 |
$24,958 |
11/23 |
$25,947 |
$27,237 |
12/23 |
$27,060 |
$28,474 |
01/24 |
$27,622 |
$28,953 |
02/24 |
$29,059 |
$30,499 |
03/24 |
$30,074 |
$31,480 |
04/24 |
$28,594 |
$30,194 |
05/24 |
$30,042 |
$31,692 |
06/24 |
$31,202 |
$32,829 |
07/24 |
$31,653 |
$33,228 |
08/24 |
$32,318 |
$34,034 |
09/24 |
$32,950 |
$34,761 |
10/24 |
$32,883 |
$34,446 |
11/24 |
$34,746 |
$36,468 |
12/24 |
$33,919 |
$35,599 |
01/25 |
$34,693 |
$36,590 |
02/25 |
$33,969 |
$36,113 |
03/25 |
$32,028 |
$34,078 |
04/25 |
$31,634 |
$33,847 |
05/25 |
$33,502 |
$35,977 |
06/25 |
$35,095 |
$37,807 |
07/25 |
$36,044 |
$38,655 |
08/25 |
$37,019 |
$39,439 |
09/25 |
$38,234 |
$40,878 |
10/25 |
$39,145 |
$41,835 |
11/25 |
$39,208 |
$41,938 |
12/25 |
$39,667 |
$41,964 |
01/26 |
$39,960 |
$42,572 |
02/26 |
$39,416 |
$42,249 |
|
| Average Annual Return [Table Text Block] |
|
Table Summary
Average Annual Total Returns (%) |
1 year |
5 years |
10 years |
Class SFootnote Reference(a) |
16.04 |
14.22 |
14.70 |
S&P 500® Index |
16.99 |
14.19 |
15.50 | |
| No Deduction of Taxes [Text Block] |
|
Performance does not reflect the deduction of taxes that a shareholder may pay on fund distributions or on the redemptions of fund shares.
|
| Updated Performance Information Location [Text Block] |
|
columbiathreadneedleus.com/investment-products/mutual-funds
|
| AssetsNet |
|
$ 440,592,353
|
| Holdings Count | Holding |
|
102
|
| Advisory Fees Paid, Amount |
|
$ 3,605,133
|
| InvestmentCompanyPortfolioTurnover |
|
72.00%
|
| Additional Fund Statistics [Text Block] |
|
Table Summary
Fund net assets |
$440,592,353 |
Total number of portfolio holdings |
102 |
Management services fees (represents 0.75% of Fund average net assets) |
$3,605,133 |
Portfolio turnover for the reporting period |
72% | |
| Holdings [Text Block] |
|
Table Summary
Information Technology |
32.3% |
Financials |
12.0% |
Health Care |
10.3% |
Communication Services |
9.9% |
Consumer Discretionary |
9.7% |
Industrials |
8.7% |
Consumer Staples |
5.1% |
Energy |
3.9% |
Utilities |
2.9% |
Real Estate |
1.9% |
Other |
1.8% |
Table Summary
Common Stocks |
98.5% |
Money Market Funds |
1.5% | |
| Largest Holdings [Text Block] |
|
Table Summary
NVIDIA Corp. |
7.9% |
Apple, Inc. |
6.8% |
Alphabet, Inc., Class A |
6.1% |
Microsoft Corp. |
4.7% |
Amazon.com, Inc. |
3.4% |
Meta Platforms, Inc., Class A |
3.2% |
Broadcom, Inc. |
2.8% |
Exxon Mobil Corp. |
1.8% |
Tesla, Inc. |
1.4% |
Procter & Gamble Co. (The) |
1.4% | |
| Material Fund Change [Text Block] |
|
|
| C000079027 |
|
|
| Shareholder Report [Line Items] |
|
|
| Fund Name |
|
Columbia Large Cap Enhanced Core Fund
|
| Class Name |
|
Institutional 3 Class
|
| Trading Symbol |
|
CECYX
|
| Annual or Semi-Annual Statement [Text Block] |
|
This annual shareholder report contains important information about Columbia Large Cap Enhanced Core Fund (the Fund) for the period of March 1, 2025 to February 28, 2026.
|
| Additional Information [Text Block] |
|
You can find additional information about the Fund at columbiathreadneedleus.com/resources/literature. You can also request more information by contacting us at 1-800-345-6611.
|
| Additional Information Phone Number |
|
1-800-345-6611
|
| Additional Information Website |
|
columbiathreadneedleus.com/resources/literature
|
| Expenses [Text Block] |
|
What were the Fund costs for the reporting period? (Based on a hypothetical $10,000 investment)
Table Summary
Class |
Cost of a $10,000 investment |
Cost paid as a percentage of a $10,000 investment |
Institutional 3 Class |
$45 |
0.42% | |
| Expenses Paid, Amount |
|
$ 45
|
| Expense Ratio, Percent |
|
0.42%
|
| Factors Affecting Performance [Text Block] |
|
Management's Discussion of Fund Performance The performance of Institutional 3 Class shares for the period presented is shown in the Average Annual Total Returns table. Top Performance ContributorsStock selection | Selections in the health care, financials and consumer discretionary sectors boosted the Fund’s relative performance most during the annual period. Allocations | Overweight allocations to oil and gas companies and interactive media and an underweight allocation to insurance companies aided the Fund’s relative performance during the period. Individual holdings | Positions in Lam Research, a firm that designs and manufactures semiconductors; Viatris, a global health care company; and Newmont Corporation, an exploration and mining company, were top contributors to the Fund’s relative performance during the period. Top Performance DetractorsStock selection | Selections in the industrials, information technology and consumer staples sectors hurt the Fund’s relative performance during the annual period. Allocations | Overweight allocations in the aerospace and defense and specialized REITs industries and an underweight allocation in the semiconductors industry detracted from the Fund’s relative results during the period. Individual holdings | The Fund’s underweight position in Micron, a memory and storage solutions company; an overweight position in ServiceNow, a firm that provides a workflow platform for digital businesses; and an overweight in Adobe, a global technology company focused on digital marketing and media solutions, were top detractors from the Fund’s relative performance during the period. |
| Performance Past Does Not Indicate Future [Text] |
|
The Fund's past performance is not a good predictor of the Fund's future performance.
|
| Line Graph [Table Text Block] |
|
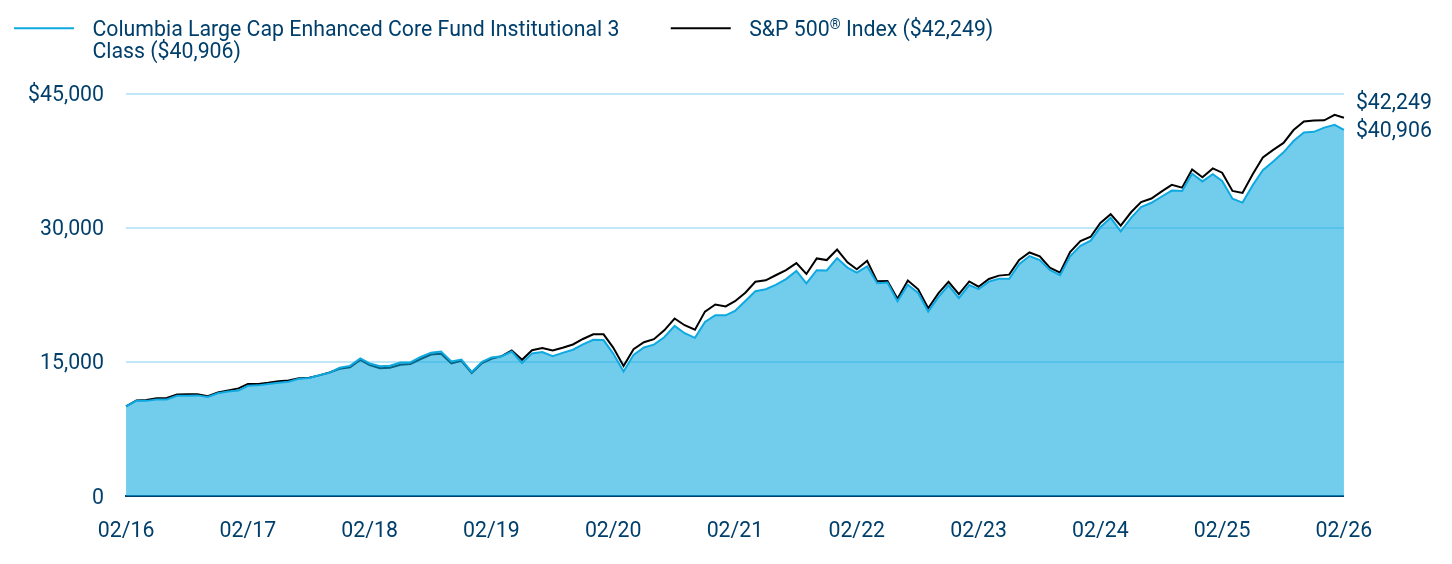
Table Summary
|
Columbia Large Cap Enhanced Core Fund Institutional 3 Class ($40,906) |
S&P 500® Index ($42,249) |
02/16 |
$10,000 |
$10,000 |
03/16 |
$10,646 |
$10,678 |
04/16 |
$10,626 |
$10,720 |
05/16 |
$10,779 |
$10,912 |
06/16 |
$10,779 |
$10,941 |
07/16 |
$11,188 |
$11,344 |
08/16 |
$11,198 |
$11,360 |
09/16 |
$11,239 |
$11,362 |
10/16 |
$11,065 |
$11,155 |
11/16 |
$11,483 |
$11,568 |
12/16 |
$11,669 |
$11,797 |
01/17 |
$11,793 |
$12,020 |
02/17 |
$12,311 |
$12,498 |
03/17 |
$12,357 |
$12,512 |
04/17 |
$12,503 |
$12,641 |
05/17 |
$12,653 |
$12,818 |
06/17 |
$12,767 |
$12,898 |
07/17 |
$13,096 |
$13,164 |
08/17 |
$13,188 |
$13,204 |
09/17 |
$13,500 |
$13,476 |
10/17 |
$13,780 |
$13,791 |
11/17 |
$14,324 |
$14,214 |
12/17 |
$14,531 |
$14,372 |
01/18 |
$15,364 |
$15,195 |
02/18 |
$14,803 |
$14,635 |
03/18 |
$14,484 |
$14,263 |
04/18 |
$14,543 |
$14,317 |
05/18 |
$14,903 |
$14,662 |
06/18 |
$14,917 |
$14,753 |
07/18 |
$15,541 |
$15,302 |
08/18 |
$16,010 |
$15,800 |
09/18 |
$16,128 |
$15,890 |
10/18 |
$15,034 |
$14,804 |
11/18 |
$15,232 |
$15,106 |
12/18 |
$13,851 |
$13,742 |
01/19 |
$14,979 |
$14,843 |
02/19 |
$15,481 |
$15,320 |
03/19 |
$15,619 |
$15,617 |
04/19 |
$16,134 |
$16,250 |
05/19 |
$14,861 |
$15,217 |
06/19 |
$15,928 |
$16,289 |
07/19 |
$16,089 |
$16,523 |
08/19 |
$15,619 |
$16,262 |
09/19 |
$15,988 |
$16,566 |
10/19 |
$16,337 |
$16,925 |
11/19 |
$16,940 |
$17,539 |
12/19 |
$17,447 |
$18,069 |
01/20 |
$17,413 |
$18,061 |
02/20 |
$15,904 |
$16,575 |
03/20 |
$13,899 |
$14,527 |
04/20 |
$15,766 |
$16,390 |
05/20 |
$16,586 |
$17,170 |
06/20 |
$16,911 |
$17,512 |
07/20 |
$17,734 |
$18,499 |
08/20 |
$18,995 |
$19,829 |
09/20 |
$18,179 |
$19,076 |
10/20 |
$17,667 |
$18,568 |
11/20 |
$19,440 |
$20,601 |
12/20 |
$20,189 |
$21,393 |
01/21 |
$20,181 |
$21,177 |
02/21 |
$20,677 |
$21,761 |
03/21 |
$21,788 |
$22,714 |
04/21 |
$22,869 |
$23,926 |
05/21 |
$23,102 |
$24,093 |
06/21 |
$23,590 |
$24,656 |
07/21 |
$24,232 |
$25,241 |
08/21 |
$25,144 |
$26,009 |
09/21 |
$23,748 |
$24,799 |
10/21 |
$25,224 |
$26,537 |
11/21 |
$25,200 |
$26,353 |
12/21 |
$26,576 |
$27,534 |
01/22 |
$25,516 |
$26,109 |
02/22 |
$24,962 |
$25,327 |
03/22 |
$25,652 |
$26,268 |
04/22 |
$23,757 |
$23,977 |
05/22 |
$23,854 |
$24,021 |
06/22 |
$21,749 |
$22,038 |
07/22 |
$23,597 |
$24,070 |
08/22 |
$22,678 |
$23,089 |
09/22 |
$20,603 |
$20,962 |
10/22 |
$22,244 |
$22,659 |
11/22 |
$23,535 |
$23,926 |
12/22 |
$22,099 |
$22,547 |
01/23 |
$23,564 |
$23,964 |
02/23 |
$23,097 |
$23,379 |
03/23 |
$23,946 |
$24,238 |
04/23 |
$24,254 |
$24,616 |
05/23 |
$24,254 |
$24,723 |
06/23 |
$25,884 |
$26,357 |
07/23 |
$26,801 |
$27,203 |
08/23 |
$26,359 |
$26,770 |
09/23 |
$25,248 |
$25,494 |
10/23 |
$24,666 |
$24,958 |
11/23 |
$26,779 |
$27,237 |
12/23 |
$27,934 |
$28,474 |
01/24 |
$28,527 |
$28,953 |
02/24 |
$30,025 |
$30,499 |
03/24 |
$31,075 |
$31,480 |
04/24 |
$29,555 |
$30,194 |
05/24 |
$31,075 |
$31,692 |
06/24 |
$32,274 |
$32,829 |
07/24 |
$32,753 |
$33,228 |
08/24 |
$33,453 |
$34,034 |
09/24 |
$34,119 |
$34,761 |
10/24 |
$34,061 |
$34,446 |
11/24 |
$35,999 |
$36,468 |
12/24 |
$35,141 |
$35,599 |
01/25 |
$35,943 |
$36,590 |
02/25 |
$35,192 |
$36,113 |
03/25 |
$33,196 |
$34,078 |
04/25 |
$32,776 |
$33,847 |
05/25 |
$34,734 |
$35,977 |
06/25 |
$36,381 |
$37,807 |
07/25 |
$37,364 |
$38,655 |
08/25 |
$38,386 |
$39,439 |
09/25 |
$39,644 |
$40,878 |
10/25 |
$40,601 |
$41,835 |
11/25 |
$40,680 |
$41,938 |
12/25 |
$41,152 |
$41,964 |
01/26 |
$41,456 |
$42,572 |
02/26 |
$40,906 |
$42,249 |
|
| Average Annual Return [Table Text Block] |
|
Table Summary
Average Annual Total Returns (%) |
1 year |
5 years |
10 years |
Institutional 3 Class |
16.24 |
14.62 |
15.13 |
S&P 500® Index |
16.99 |
14.19 |
15.50 | |
| No Deduction of Taxes [Text Block] |
|
Performance does not reflect the deduction of taxes that a shareholder may pay on fund distributions or on the redemptions of fund shares.
|
| Updated Performance Information Location [Text Block] |
|
columbiathreadneedleus.com/investment-products/mutual-funds
|
| AssetsNet |
|
$ 440,592,353
|
| Holdings Count | Holding |
|
102
|
| Advisory Fees Paid, Amount |
|
$ 3,605,133
|
| InvestmentCompanyPortfolioTurnover |
|
72.00%
|
| Additional Fund Statistics [Text Block] |
|
Table Summary
Fund net assets |
$440,592,353 |
Total number of portfolio holdings |
102 |
Management services fees (represents 0.75% of Fund average net assets) |
$3,605,133 |
Portfolio turnover for the reporting period |
72% | |
| Holdings [Text Block] |
|
Table Summary
Information Technology |
32.3% |
Financials |
12.0% |
Health Care |
10.3% |
Communication Services |
9.9% |
Consumer Discretionary |
9.7% |
Industrials |
8.7% |
Consumer Staples |
5.1% |
Energy |
3.9% |
Utilities |
2.9% |
Real Estate |
1.9% |
Other |
1.8% |
Table Summary
Common Stocks |
98.5% |
Money Market Funds |
1.5% | |
| Largest Holdings [Text Block] |
|
Table Summary
NVIDIA Corp. |
7.9% |
Apple, Inc. |
6.8% |
Alphabet, Inc., Class A |
6.1% |
Microsoft Corp. |
4.7% |
Amazon.com, Inc. |
3.4% |
Meta Platforms, Inc., Class A |
3.2% |
Broadcom, Inc. |
2.8% |
Exxon Mobil Corp. |
1.8% |
Tesla, Inc. |
1.4% |
Procter & Gamble Co. (The) |
1.4% | |
| Material Fund Change [Text Block] |
|
|
| C000030033 |
|
|
| Shareholder Report [Line Items] |
|
|
| Fund Name |
|
Columbia Large Cap Enhanced Core Fund
|
| Class Name |
|
Institutional Class
|
| Trading Symbol |
|
NMIMX
|
| Annual or Semi-Annual Statement [Text Block] |
|
This annual shareholder report contains important information about Columbia Large Cap Enhanced Core Fund (the Fund) for the period of March 1, 2025 to February 28, 2026.
|
| Additional Information [Text Block] |
|
You can find additional information about the Fund at columbiathreadneedleus.com/resources/literature. You can also request more information by contacting us at 1-800-345-6611.
|
| Additional Information Phone Number |
|
1-800-345-6611
|
| Additional Information Website |
|
columbiathreadneedleus.com/resources/literature
|
| Expenses [Text Block] |
|
What were the Fund costs for the reporting period? (Based on a hypothetical $10,000 investment)
Table Summary
Class |
Cost of a $10,000 investment |
Cost paid as a percentage of a $10,000 investment |
Institutional Class |
$63 |
0.58% | |
| Expenses Paid, Amount |
|
$ 63
|
| Expense Ratio, Percent |
|
0.58%
|
| Factors Affecting Performance [Text Block] |
|
Management's Discussion of Fund Performance The performance of Institutional Class shares for the period presented is shown in the Average Annual Total Returns table. Top Performance ContributorsStock selection | Selections in the health care, financials and consumer discretionary sectors boosted the Fund’s relative performance most during the annual period. Allocations | Overweight allocations to oil and gas companies and interactive media and an underweight allocation to insurance companies aided the Fund’s relative performance during the period. Individual holdings | Positions in Lam Research, a firm that designs and manufactures semiconductors; Viatris, a global health care company; and Newmont Corporation, an exploration and mining company, were top contributors to the Fund’s relative performance during the period. Top Performance DetractorsStock selection | Selections in the industrials, information technology and consumer staples sectors hurt the Fund’s relative performance during the annual period. Allocations | Overweight allocations in the aerospace and defense and specialized REITs industries and an underweight allocation in the semiconductors industry detracted from the Fund’s relative results during the period. Individual holdings | The Fund’s underweight position in Micron, a memory and storage solutions company; an overweight position in ServiceNow, a firm that provides a workflow platform for digital businesses; and an overweight in Adobe, a global technology company focused on digital marketing and media solutions, were top detractors from the Fund’s relative performance during the period. |
| Performance Past Does Not Indicate Future [Text] |
|
The Fund's past performance is not a good predictor of the Fund's future performance.
|
| Line Graph [Table Text Block] |
|

Table Summary
|
Columbia Large Cap Enhanced Core Fund Institutional Class ($40,277) |
S&P 500® Index ($42,249) |
02/16 |
$10,000 |
$10,000 |
03/16 |
$10,646 |
$10,678 |
04/16 |
$10,621 |
$10,720 |
05/16 |
$10,774 |
$10,912 |
06/16 |
$10,772 |
$10,941 |
07/16 |
$11,180 |
$11,344 |
08/16 |
$11,190 |
$11,360 |
09/16 |
$11,226 |
$11,362 |
10/16 |
$11,052 |
$11,155 |
11/16 |
$11,466 |
$11,568 |
12/16 |
$11,653 |
$11,797 |
01/17 |
$11,777 |
$12,020 |
02/17 |
$12,294 |
$12,498 |
03/17 |
$12,341 |
$12,512 |
04/17 |
$12,481 |
$12,641 |
05/17 |
$12,631 |
$12,818 |
06/17 |
$12,748 |
$12,898 |
07/17 |
$13,071 |
$13,164 |
08/17 |
$13,162 |
$13,204 |
09/17 |
$13,469 |
$13,476 |
10/17 |
$13,754 |
$13,791 |
11/17 |
$14,286 |
$14,214 |
12/17 |
$14,499 |
$14,372 |
01/18 |
$15,323 |
$15,195 |
02/18 |
$14,764 |
$14,635 |
03/18 |
$14,440 |
$14,263 |
04/18 |
$14,499 |
$14,317 |
05/18 |
$14,858 |
$14,662 |
06/18 |
$14,868 |
$14,753 |
07/18 |
$15,490 |
$15,302 |
08/18 |
$15,958 |
$15,800 |
09/18 |
$16,069 |
$15,890 |
10/18 |
$14,979 |
$14,804 |
11/18 |
$15,176 |
$15,106 |
12/18 |
$13,793 |
$13,742 |
01/19 |
$14,923 |
$14,843 |
02/19 |
$15,416 |
$15,320 |
03/19 |
$15,554 |
$15,617 |
04/19 |
$16,059 |
$16,250 |
05/19 |
$14,792 |
$15,217 |
06/19 |
$15,855 |
$16,289 |
07/19 |
$16,015 |
$16,523 |
08/19 |
$15,541 |
$16,262 |
09/19 |
$15,908 |
$16,566 |
10/19 |
$16,255 |
$16,925 |
11/19 |
$16,856 |
$17,539 |
12/19 |
$17,355 |
$18,069 |
01/20 |
$17,321 |
$18,061 |
02/20 |
$15,813 |
$16,575 |
03/20 |
$13,818 |
$14,527 |
04/20 |
$15,676 |
$16,390 |
05/20 |
$16,485 |
$17,170 |
06/20 |
$16,811 |
$17,512 |
07/20 |
$17,622 |
$18,499 |
08/20 |
$18,876 |
$19,829 |
09/20 |
$18,057 |
$19,076 |
10/20 |
$17,548 |
$18,568 |
11/20 |
$19,304 |
$20,601 |
12/20 |
$20,045 |
$21,393 |
01/21 |
$20,038 |
$21,177 |
02/21 |
$20,530 |
$21,761 |
03/21 |
$21,626 |
$22,714 |
04/21 |
$22,693 |
$23,926 |
05/21 |
$22,924 |
$24,093 |
06/21 |
$23,402 |
$24,656 |
07/21 |
$24,032 |
$25,241 |
08/21 |
$24,930 |
$26,009 |
09/21 |
$23,552 |
$24,799 |
10/21 |
$25,009 |
$26,537 |
11/21 |
$24,978 |
$26,353 |
12/21 |
$26,346 |
$27,534 |
01/22 |
$25,286 |
$26,109 |
02/22 |
$24,736 |
$25,327 |
03/22 |
$25,411 |
$26,268 |
04/22 |
$23,531 |
$23,977 |
05/22 |
$23,618 |
$24,021 |
06/22 |
$21,532 |
$22,038 |
07/22 |
$23,374 |
$24,070 |
08/22 |
$22,442 |
$23,089 |
09/22 |
$20,396 |
$20,962 |
10/22 |
$22,013 |
$22,659 |
11/22 |
$23,282 |
$23,926 |
12/22 |
$21,865 |
$22,547 |
01/23 |
$23,305 |
$23,964 |
02/23 |
$22,842 |
$23,379 |
03/23 |
$23,683 |
$24,238 |
04/23 |
$23,978 |
$24,616 |
05/23 |
$23,978 |
$24,723 |
06/23 |
$25,584 |
$26,357 |
07/23 |
$26,491 |
$27,203 |
08/23 |
$26,054 |
$26,770 |
09/23 |
$24,944 |
$25,494 |
10/23 |
$24,368 |
$24,958 |
11/23 |
$26,459 |
$27,237 |
12/23 |
$27,596 |
$28,474 |
01/24 |
$28,170 |
$28,953 |
02/24 |
$29,640 |
$30,499 |
03/24 |
$30,689 |
$31,480 |
04/24 |
$29,176 |
$30,194 |
05/24 |
$30,667 |
$31,692 |
06/24 |
$31,855 |
$32,829 |
07/24 |
$32,316 |
$33,228 |
08/24 |
$33,008 |
$34,034 |
09/24 |
$33,654 |
$34,761 |
10/24 |
$33,597 |
$34,446 |
11/24 |
$35,500 |
$36,468 |
12/24 |
$34,647 |
$35,599 |
01/25 |
$35,438 |
$36,590 |
02/25 |
$34,697 |
$36,113 |
03/25 |
$32,726 |
$34,078 |
04/25 |
$32,312 |
$33,847 |
05/25 |
$34,233 |
$35,977 |
06/25 |
$35,862 |
$37,807 |
07/25 |
$36,819 |
$38,655 |
08/25 |
$37,828 |
$39,439 |
09/25 |
$39,056 |
$40,878 |
10/25 |
$40,000 |
$41,835 |
11/25 |
$40,065 |
$41,938 |
12/25 |
$40,520 |
$41,964 |
01/26 |
$40,819 |
$42,572 |
02/26 |
$40,277 |
$42,249 |
|
| Average Annual Return [Table Text Block] |
|
Table Summary
Average Annual Total Returns (%) |
1 year |
5 years |
10 years |
Institutional Class |
16.08 |
14.43 |
14.95 |
S&P 500® Index |
16.99 |
14.19 |
15.50 | |
| No Deduction of Taxes [Text Block] |
|
Performance does not reflect the deduction of taxes that a shareholder may pay on fund distributions or on the redemptions of fund shares.
|
| Updated Performance Information Location [Text Block] |
|
columbiathreadneedleus.com/investment-products/mutual-funds
|
| AssetsNet |
|
$ 440,592,353
|
| Holdings Count | Holding |
|
102
|
| Advisory Fees Paid, Amount |
|
$ 3,605,133
|
| InvestmentCompanyPortfolioTurnover |
|
72.00%
|
| Additional Fund Statistics [Text Block] |
|
Table Summary
Fund net assets |
$440,592,353 |
Total number of portfolio holdings |
102 |
Management services fees (represents 0.75% of Fund average net assets) |
$3,605,133 |
Portfolio turnover for the reporting period |
72% | |
| Holdings [Text Block] |
|
Table Summary
Information Technology |
32.3% |
Financials |
12.0% |
Health Care |
10.3% |
Communication Services |
9.9% |
Consumer Discretionary |
9.7% |
Industrials |
8.7% |
Consumer Staples |
5.1% |
Energy |
3.9% |
Utilities |
2.9% |
Real Estate |
1.9% |
Other |
1.8% |
Table Summary
Common Stocks |
98.5% |
Money Market Funds |
1.5% | |
| Largest Holdings [Text Block] |
|
Table Summary
NVIDIA Corp. |
7.9% |
Apple, Inc. |
6.8% |
Alphabet, Inc., Class A |
6.1% |
Microsoft Corp. |
4.7% |
Amazon.com, Inc. |
3.4% |
Meta Platforms, Inc., Class A |
3.2% |
Broadcom, Inc. |
2.8% |
Exxon Mobil Corp. |
1.8% |
Tesla, Inc. |
1.4% |
Procter & Gamble Co. (The) |
1.4% | |
| Material Fund Change [Text Block] |
|
|
| C000029874 |
|
|
| Shareholder Report [Line Items] |
|
|
| Fund Name |
|
Columbia Large Cap Growth Opportunity Fund
|
| Class Name |
|
Class A
|
| Trading Symbol |
|
NFEAX
|
| Annual or Semi-Annual Statement [Text Block] |
|
This annual shareholder report contains important information about Columbia Large Cap Growth Opportunity Fund (the Fund) for the period of March 1, 2025 to February 28, 2026.
|
| Additional Information [Text Block] |
|
You can find additional information about the Fund at columbiathreadneedleus.com/resources/literature. You can also request more information by contacting us at 1-800-345-6611.
|
| Additional Information Phone Number |
|
1-800-345-6611
|
| Additional Information Website |
|
columbiathreadneedleus.com/resources/literature
|
| Expenses [Text Block] |
|
What were the Fund costs for the reporting period? (Based on a hypothetical $10,000 investment)
Table Summary
Class |
Cost of a $10,000 investment |
Cost paid as a percentage of a $10,000 investment |
Class A |
$111 |
1.05% | |
| Expenses Paid, Amount |
|
$ 111
|
| Expense Ratio, Percent |
|
1.05%
|
| Factors Affecting Performance [Text Block] |
|
Management's Discussion of Fund Performance The performance of Class A shares for the period presented is shown in the Average Annual Total Returns table. Top Performance ContributorsStock selection | Selections in the financials and consumer discretionary sectors boosted the Fund’s relative performance during the annual period. Allocations | An underweight position in the information technology sector, alongside an overweight in the communication services sector, contributed to the Fund’s relative performance during the annual period. Individual holdings | A relative overweight position in Exact Sciences Corporation, a developer of molecular diagnostics and cancer screening tests; a relative overweight position in General Motors Company, a global automotive manufacturer; a relative overweight position in Parker‑Hannifin Corporation, a provider of motion and control technologies; a relative overweight position in TE Connectivity plc, a designer and manufacturer of connectivity and sensor solutions; and a relative overweight position in General Dynamics Corporation, an aerospace and defense company, were among the top contributors to the Fund’s relative performance. Top Performance DetractorsStock selection | Selections in the information technology, industrials, real estate and utilities sectors hurt the Fund’s relative performance during the annual period. Allocations | An underweight position in the energy sector, alongside overweight positions in the financials and consumer discretionary sectors, detracted from the Fund’s relative performance during the annual period. Individual holdings | A relative overweight position in ServiceNow, Inc., an enterprise workflow software provider; a relative overweight position in Broadcom Inc., a designer and manufacturer of semiconductor and infrastructure software solutions; a relative overweight position in Palo Alto Networks, Inc., a cybersecurity platform provider; a relative overweight position in Constellation Brands, Inc., a producer and marketer of alcoholic beverages; and a relative overweight position in Bristol‑Myers Squibb Company, a global biopharmaceutical company, were among the top detractors from relative Fund performance. |
| Performance Past Does Not Indicate Future [Text] |
|
The Fund's past performance is not a good predictor of the Fund's future performance.
|
| Line Graph [Table Text Block] |
|
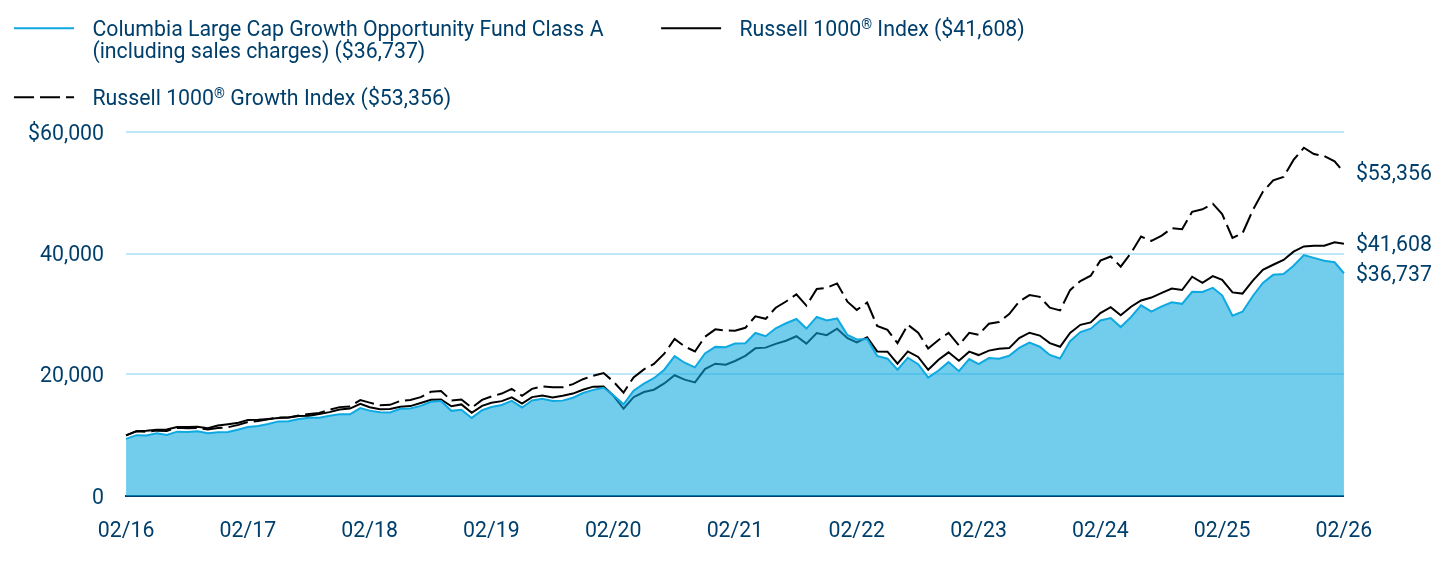
Table Summary
|
Columbia Large Cap Growth Opportunity Fund Class A (including sales charges) ($36,737) |
Russell 1000® Index ($41,608) |
Russell 1000® Growth Index ($53,356) |
02/16 |
$9,423 |
$10,000 |
$10,000 |
03/16 |
$10,038 |
$10,697 |
$10,674 |
04/16 |
$9,987 |
$10,755 |
$10,577 |
05/16 |
$10,342 |
$10,943 |
$10,782 |
06/16 |
$10,063 |
$10,968 |
$10,740 |
07/16 |
$10,617 |
$11,386 |
$11,247 |
08/16 |
$10,566 |
$11,401 |
$11,191 |
09/16 |
$10,674 |
$11,410 |
$11,232 |
10/16 |
$10,351 |
$11,187 |
$10,968 |
11/16 |
$10,509 |
$11,628 |
$11,207 |
12/16 |
$10,556 |
$11,847 |
$11,346 |
01/17 |
$10,976 |
$12,085 |
$11,728 |
02/17 |
$11,388 |
$12,553 |
$12,215 |
03/17 |
$11,540 |
$12,561 |
$12,356 |
04/17 |
$11,873 |
$12,694 |
$12,639 |
05/17 |
$12,307 |
$12,856 |
$12,968 |
06/17 |
$12,328 |
$12,945 |
$12,933 |
07/17 |
$12,694 |
$13,202 |
$13,277 |
08/17 |
$12,899 |
$13,243 |
$13,521 |
09/17 |
$12,913 |
$13,525 |
$13,696 |
10/17 |
$13,242 |
$13,835 |
$14,227 |
11/17 |
$13,469 |
$14,257 |
$14,659 |
12/17 |
$13,468 |
$14,416 |
$14,773 |
01/18 |
$14,497 |
$15,207 |
$15,820 |
02/18 |
$14,082 |
$14,649 |
$15,405 |
03/18 |
$13,813 |
$14,317 |
$14,982 |
04/18 |
$13,767 |
$14,365 |
$15,035 |
05/18 |
$14,397 |
$14,732 |
$15,694 |
06/18 |
$14,439 |
$14,827 |
$15,845 |
07/18 |
$14,864 |
$15,339 |
$16,310 |
08/18 |
$15,537 |
$15,868 |
$17,202 |
09/18 |
$15,657 |
$15,928 |
$17,298 |
10/18 |
$14,047 |
$14,801 |
$15,751 |
11/18 |
$14,231 |
$15,102 |
$15,918 |
12/18 |
$12,879 |
$13,726 |
$14,550 |
01/19 |
$14,151 |
$14,877 |
$15,858 |
02/19 |
$14,672 |
$15,380 |
$16,425 |
03/19 |
$15,014 |
$15,648 |
$16,892 |
04/19 |
$15,706 |
$16,280 |
$17,656 |
05/19 |
$14,604 |
$15,243 |
$16,540 |
06/19 |
$15,749 |
$16,313 |
$17,676 |
07/19 |
$16,019 |
$16,566 |
$18,075 |
08/19 |
$15,687 |
$16,263 |
$17,937 |
09/19 |
$15,731 |
$16,545 |
$17,939 |
10/19 |
$16,203 |
$16,895 |
$18,445 |
11/19 |
$16,980 |
$17,534 |
$19,263 |
12/19 |
$17,507 |
$18,040 |
$19,844 |
01/20 |
$17,856 |
$18,060 |
$20,288 |
02/20 |
$16,659 |
$16,584 |
$18,906 |
03/20 |
$15,131 |
$14,392 |
$17,046 |
04/20 |
$17,366 |
$16,294 |
$19,569 |
05/20 |
$18,535 |
$17,154 |
$20,883 |
06/20 |
$19,429 |
$17,533 |
$21,792 |
07/20 |
$20,831 |
$18,560 |
$23,469 |
08/20 |
$23,060 |
$19,922 |
$25,890 |
09/20 |
$21,981 |
$19,194 |
$24,672 |
10/20 |
$21,225 |
$18,731 |
$23,834 |
11/20 |
$23,504 |
$20,937 |
$26,275 |
12/20 |
$24,596 |
$21,822 |
$27,483 |
01/21 |
$24,542 |
$21,642 |
$27,280 |
02/21 |
$25,134 |
$22,269 |
$27,273 |
03/21 |
$25,209 |
$23,112 |
$27,742 |
04/21 |
$26,897 |
$24,356 |
$29,630 |
05/21 |
$26,360 |
$24,472 |
$29,220 |
06/21 |
$27,667 |
$25,085 |
$31,053 |
07/21 |
$28,493 |
$25,606 |
$32,076 |
08/21 |
$29,201 |
$26,347 |
$33,276 |
09/21 |
$27,620 |
$25,137 |
$31,412 |
10/21 |
$29,531 |
$26,881 |
$34,133 |
11/21 |
$28,941 |
$26,521 |
$34,341 |
12/21 |
$29,287 |
$27,595 |
$35,067 |
01/22 |
$26,556 |
$26,039 |
$32,058 |
02/22 |
$25,831 |
$25,325 |
$30,696 |
03/22 |
$25,892 |
$26,179 |
$31,897 |
04/22 |
$23,115 |
$23,846 |
$28,045 |
05/22 |
$22,652 |
$23,809 |
$27,393 |
06/22 |
$20,822 |
$21,815 |
$25,223 |
07/22 |
$22,809 |
$23,847 |
$28,251 |
08/22 |
$21,739 |
$22,931 |
$26,935 |
09/22 |
$19,523 |
$20,810 |
$24,316 |
10/22 |
$20,689 |
$22,479 |
$25,737 |
11/22 |
$22,083 |
$23,695 |
$26,910 |
12/22 |
$20,593 |
$22,317 |
$24,850 |
01/23 |
$22,580 |
$23,813 |
$26,921 |
02/23 |
$21,758 |
$23,246 |
$26,601 |
03/23 |
$22,752 |
$23,982 |
$28,420 |
04/23 |
$22,656 |
$24,279 |
$28,700 |
05/23 |
$23,134 |
$24,392 |
$30,008 |
06/23 |
$24,433 |
$26,039 |
$32,060 |
07/23 |
$25,312 |
$26,935 |
$33,140 |
08/23 |
$24,624 |
$26,464 |
$32,843 |
09/23 |
$23,268 |
$25,220 |
$31,057 |
10/23 |
$22,675 |
$24,610 |
$30,615 |
11/23 |
$25,522 |
$26,909 |
$33,952 |
12/23 |
$27,031 |
$28,237 |
$35,455 |
01/24 |
$27,604 |
$28,631 |
$36,340 |
02/24 |
$28,960 |
$30,177 |
$38,819 |
03/24 |
$29,342 |
$31,145 |
$39,502 |
04/24 |
$27,871 |
$29,819 |
$37,827 |
05/24 |
$29,533 |
$31,224 |
$40,091 |
06/24 |
$31,441 |
$32,257 |
$42,795 |
07/24 |
$30,403 |
$32,726 |
$42,067 |
08/24 |
$31,265 |
$33,502 |
$42,943 |
09/24 |
$31,950 |
$34,218 |
$44,160 |
10/24 |
$31,696 |
$33,979 |
$44,014 |
11/24 |
$33,674 |
$36,167 |
$46,868 |
12/24 |
$33,642 |
$35,159 |
$47,282 |
01/25 |
$34,335 |
$36,278 |
$48,217 |
02/25 |
$33,107 |
$35,643 |
$46,485 |
03/25 |
$29,739 |
$33,580 |
$42,569 |
04/25 |
$30,392 |
$33,381 |
$43,323 |
05/25 |
$32,988 |
$35,512 |
$47,156 |
06/25 |
$35,142 |
$37,310 |
$50,163 |
07/25 |
$36,478 |
$38,139 |
$52,057 |
08/25 |
$36,601 |
$38,942 |
$52,639 |
09/25 |
$37,978 |
$40,292 |
$55,435 |
10/25 |
$39,745 |
$41,161 |
$57,449 |
11/25 |
$39,273 |
$41,262 |
$56,407 |
12/25 |
$38,789 |
$41,264 |
$56,058 |
01/26 |
$38,556 |
$41,832 |
$55,210 |
02/26 |
$36,737 |
$41,608 |
$53,356 |
|
| Average Annual Return [Table Text Block] |
|
Table Summary
Average Annual Total Returns (%) |
1 year |
5 years |
10 years |
Class A (excluding sales charges) |
10.97 |
7.89 |
14.58 |
Class A (including sales charges) |
4.58 |
6.61 |
13.90 |
Russell 1000® Index |
16.73 |
13.32 |
15.32 |
Russell 1000® Growth Index |
14.78 |
14.36 |
18.23 | |
| No Deduction of Taxes [Text Block] |
|
Performance does not reflect the deduction of taxes that a shareholder may pay on fund distributions or on the redemptions of fund shares.
|
| Updated Performance Information Location [Text Block] |
|
columbiathreadneedleus.com/investment-products/mutual-funds
|
| AssetsNet |
|
$ 1,209,625,976
|
| Holdings Count | Holding |
|
43
|
| Advisory Fees Paid, Amount |
|
$ 9,139,308
|
| InvestmentCompanyPortfolioTurnover |
|
53.00%
|
| Additional Fund Statistics [Text Block] |
|
Table Summary
Fund net assets |
$1,209,625,976 |
Total number of portfolio holdings |
43 |
Management services fees (represents 0.73% of Fund average net assets) |
$9,139,308 |
Portfolio turnover for the reporting period |
53% | |
| Holdings [Text Block] |
|
Information Technology Sub-Industry Allocation
Table Summary
Semiconductors |
20.6% |
Systems Software |
14.2% |
Technology Hardware, Storage & Peripherals |
6.9% |
Electronic Manufacturing Services |
1.4% |
Communications Equipment |
1.3% |
Other |
0.4% |
Table Summary
Information Technology |
44.8% |
Consumer Discretionary |
14.8% |
Communication Services |
13.5% |
Health Care |
10.2% |
Industrials |
5.9% |
Financials |
5.4% |
Consumer Staples |
3.8% |
Real Estate |
1.1% | |
| Largest Holdings [Text Block] |
|
Table Summary
NVIDIA Corp. |
13.3% |
Microsoft Corp. |
10.4% |
Alphabet, Inc., Class A |
7.6% |
Apple, Inc. |
6.9% |
Amazon.com, Inc. |
6.5% |
Meta Platforms, Inc., Class A |
5.0% |
Broadcom, Inc. |
4.9% |
Eli Lilly & Co. |
4.2% |
Visa, Inc., Class A |
3.1% |
Costco Wholesale Corp. |
2.8% | |
| Material Fund Change [Text Block] |
|
|
| C000175686 |
|
|
| Shareholder Report [Line Items] |
|
|
| Fund Name |
|
Columbia Large Cap Growth Opportunity Fund
|
| Class Name |
|
Class R
|
| Trading Symbol |
|
CLGPX
|
| Annual or Semi-Annual Statement [Text Block] |
|
This annual shareholder report contains important information about Columbia Large Cap Growth Opportunity Fund (the Fund) for the period of March 1, 2025 to February 28, 2026.
|
| Additional Information [Text Block] |
|
You can find additional information about the Fund at columbiathreadneedleus.com/resources/literature. You can also request more information by contacting us at 1-800-345-6611.
|
| Additional Information Phone Number |
|
1-800-345-6611
|
| Additional Information Website |
|
columbiathreadneedleus.com/resources/literature
|
| Expenses [Text Block] |
|
What were the Fund costs for the reporting period? (Based on a hypothetical $10,000 investment)
Table Summary
Class |
Cost of a $10,000 investment |
Cost paid as a percentage of a $10,000 investment |
Class R |
$137 |
1.30% | |
| Expenses Paid, Amount |
|
$ 137
|
| Expense Ratio, Percent |
|
1.30%
|
| Factors Affecting Performance [Text Block] |
|
Management's Discussion of Fund Performance The performance of Class R shares for the period presented is shown in the Average Annual Total Returns table. Top Performance ContributorsStock selection | Selections in the financials and consumer discretionary sectors boosted the Fund’s relative performance during the annual period. Allocations | An underweight position in the information technology sector, alongside an overweight in the communication services sector, contributed to the Fund’s relative performance during the annual period. Individual holdings | A relative overweight position in Exact Sciences Corporation, a developer of molecular diagnostics and cancer screening tests; a relative overweight position in General Motors Company, a global automotive manufacturer; a relative overweight position in Parker‑Hannifin Corporation, a provider of motion and control technologies; a relative overweight position in TE Connectivity plc, a designer and manufacturer of connectivity and sensor solutions; and a relative overweight position in General Dynamics Corporation, an aerospace and defense company, were among the top contributors to the Fund’s relative performance. Top Performance DetractorsStock selection | Selections in the information technology, industrials, real estate and utilities sectors hurt the Fund’s relative performance during the annual period. Allocations | An underweight position in the energy sector, alongside overweight positions in the financials and consumer discretionary sectors, detracted from the Fund’s relative performance during the annual period. Individual holdings | A relative overweight position in ServiceNow, Inc., an enterprise workflow software provider; a relative overweight position in Broadcom Inc., a designer and manufacturer of semiconductor and infrastructure software solutions; a relative overweight position in Palo Alto Networks, Inc., a cybersecurity platform provider; a relative overweight position in Constellation Brands, Inc., a producer and marketer of alcoholic beverages; and a relative overweight position in Bristol‑Myers Squibb Company, a global biopharmaceutical company, were among the top detractors from relative Fund performance. |
| Performance Past Does Not Indicate Future [Text] |
|
The Fund's past performance is not a good predictor of the Fund's future performance.
|
| Line Graph [Table Text Block] |
|

Table Summary
|
Columbia Large Cap Growth Opportunity Fund Class R ($38,010) |
Russell 1000® Index ($41,608) |
Russell 1000® Growth Index ($53,356) |
02/16 |
$10,000 |
$10,000 |
$10,000 |
03/16 |
$10,650 |
$10,697 |
$10,674 |
04/16 |
$10,594 |
$10,755 |
$10,577 |
05/16 |
$10,968 |
$10,943 |
$10,782 |
06/16 |
$10,670 |
$10,968 |
$10,740 |
07/16 |
$11,255 |
$11,386 |
$11,247 |
08/16 |
$11,199 |
$11,401 |
$11,191 |
09/16 |
$11,311 |
$11,410 |
$11,232 |
10/16 |
$10,967 |
$11,187 |
$10,968 |
11/16 |
$11,133 |
$11,628 |
$11,207 |
12/16 |
$11,176 |
$11,847 |
$11,346 |
01/17 |
$11,624 |
$12,085 |
$11,728 |
02/17 |
$12,057 |
$12,553 |
$12,215 |
03/17 |
$12,216 |
$12,561 |
$12,356 |
04/17 |
$12,566 |
$12,694 |
$12,639 |
05/17 |
$13,022 |
$12,856 |
$12,968 |
06/17 |
$13,044 |
$12,945 |
$12,933 |
07/17 |
$13,428 |
$13,202 |
$13,277 |
08/17 |
$13,643 |
$13,243 |
$13,521 |
09/17 |
$13,650 |
$13,525 |
$13,696 |
10/17 |
$13,996 |
$13,835 |
$14,227 |
11/17 |
$14,226 |
$14,257 |
$14,659 |
12/17 |
$14,228 |
$14,416 |
$14,773 |
01/18 |
$15,307 |
$15,207 |
$15,820 |
02/18 |
$14,864 |
$14,649 |
$15,405 |
03/18 |
$14,582 |
$14,317 |
$14,982 |
04/18 |
$14,534 |
$14,365 |
$15,035 |
05/18 |
$15,194 |
$14,732 |
$15,694 |
06/18 |
$15,233 |
$14,827 |
$15,845 |
07/18 |
$15,677 |
$15,339 |
$16,310 |
08/18 |
$16,390 |
$15,868 |
$17,202 |
09/18 |
$16,515 |
$15,928 |
$17,298 |
10/18 |
$14,814 |
$14,801 |
$15,751 |
11/18 |
$14,998 |
$15,102 |
$15,918 |
12/18 |
$13,574 |
$13,726 |
$14,550 |
01/19 |
$14,905 |
$14,877 |
$15,858 |
02/19 |
$15,459 |
$15,380 |
$16,425 |
03/19 |
$15,808 |
$15,648 |
$16,892 |
04/19 |
$16,540 |
$16,280 |
$17,656 |
05/19 |
$15,379 |
$15,243 |
$16,540 |
06/19 |
$16,576 |
$16,313 |
$17,676 |
07/19 |
$16,860 |
$16,566 |
$18,075 |
08/19 |
$16,503 |
$16,263 |
$17,937 |
09/19 |
$16,549 |
$16,545 |
$17,939 |
10/19 |
$17,033 |
$16,895 |
$18,445 |
11/19 |
$17,847 |
$17,534 |
$19,263 |
12/19 |
$18,398 |
$18,040 |
$19,844 |
01/20 |
$18,763 |
$18,060 |
$20,288 |
02/20 |
$17,501 |
$16,584 |
$18,906 |
03/20 |
$15,893 |
$14,392 |
$17,046 |
04/20 |
$18,240 |
$16,294 |
$19,569 |
05/20 |
$19,463 |
$17,154 |
$20,883 |
06/20 |
$20,398 |
$17,533 |
$21,792 |
07/20 |
$21,864 |
$18,560 |
$23,469 |
08/20 |
$24,195 |
$19,922 |
$25,890 |
09/20 |
$23,055 |
$19,194 |
$24,672 |
10/20 |
$22,254 |
$18,731 |
$23,834 |
11/20 |
$24,648 |
$20,937 |
$26,275 |
12/20 |
$25,789 |
$21,822 |
$27,483 |
01/21 |
$25,722 |
$21,642 |
$27,280 |
02/21 |
$26,351 |
$22,269 |
$27,273 |
03/21 |
$26,408 |
$23,112 |
$27,742 |
04/21 |
$28,173 |
$24,356 |
$29,630 |
05/21 |
$27,610 |
$24,472 |
$29,220 |
06/21 |
$28,972 |
$25,085 |
$31,053 |
07/21 |
$29,833 |
$25,606 |
$32,076 |
08/21 |
$30,571 |
$26,347 |
$33,276 |
09/21 |
$28,910 |
$25,137 |
$31,412 |
10/21 |
$30,891 |
$26,881 |
$34,133 |
11/21 |
$30,276 |
$26,521 |
$34,341 |
12/21 |
$30,634 |
$27,595 |
$35,067 |
01/22 |
$27,781 |
$26,039 |
$32,058 |
02/22 |
$27,011 |
$25,325 |
$30,696 |
03/22 |
$27,059 |
$26,179 |
$31,897 |
04/22 |
$24,158 |
$23,846 |
$28,045 |
05/22 |
$23,661 |
$23,809 |
$27,393 |
06/22 |
$21,744 |
$21,815 |
$25,223 |
07/22 |
$23,825 |
$23,847 |
$28,251 |
08/22 |
$22,696 |
$22,931 |
$26,935 |
09/22 |
$20,377 |
$20,810 |
$24,316 |
10/22 |
$21,605 |
$22,479 |
$25,737 |
11/22 |
$23,033 |
$23,695 |
$26,910 |
12/22 |
$21,487 |
$22,317 |
$24,850 |
01/23 |
$23,568 |
$23,813 |
$26,921 |
02/23 |
$22,696 |
$23,246 |
$26,601 |
03/23 |
$23,726 |
$23,982 |
$28,420 |
04/23 |
$23,607 |
$24,279 |
$28,700 |
05/23 |
$24,103 |
$24,392 |
$30,008 |
06/23 |
$25,471 |
$26,039 |
$32,060 |
07/23 |
$26,382 |
$26,935 |
$33,140 |
08/23 |
$25,649 |
$26,464 |
$32,843 |
09/23 |
$24,242 |
$25,220 |
$31,057 |
10/23 |
$23,607 |
$24,610 |
$30,615 |
11/23 |
$26,561 |
$26,909 |
$33,952 |
12/23 |
$28,127 |
$28,237 |
$35,455 |
01/24 |
$28,721 |
$28,631 |
$36,340 |
02/24 |
$30,129 |
$30,177 |
$38,819 |
03/24 |
$30,505 |
$31,145 |
$39,502 |
04/24 |
$28,999 |
$29,819 |
$37,827 |
05/24 |
$30,704 |
$31,224 |
$40,091 |
06/24 |
$32,663 |
$32,257 |
$42,795 |
07/24 |
$31,585 |
$32,726 |
$42,067 |
08/24 |
$32,500 |
$33,502 |
$42,943 |
09/24 |
$33,171 |
$34,218 |
$44,160 |
10/24 |
$32,927 |
$33,979 |
$44,014 |
11/24 |
$34,959 |
$36,167 |
$46,868 |
12/24 |
$34,925 |
$35,159 |
$47,282 |
01/25 |
$35,645 |
$36,278 |
$48,217 |
02/25 |
$34,350 |
$35,643 |
$46,485 |
03/25 |
$30,855 |
$33,580 |
$42,569 |
04/25 |
$31,513 |
$33,381 |
$43,323 |
05/25 |
$34,206 |
$35,512 |
$47,156 |
06/25 |
$36,420 |
$37,310 |
$50,163 |
07/25 |
$37,806 |
$38,139 |
$52,057 |
08/25 |
$37,934 |
$38,942 |
$52,639 |
09/25 |
$39,341 |
$40,292 |
$55,435 |
10/25 |
$41,175 |
$41,161 |
$57,449 |
11/25 |
$40,684 |
$41,262 |
$56,407 |
12/25 |
$40,161 |
$41,264 |
$56,058 |
01/26 |
$39,897 |
$41,832 |
$55,210 |
02/26 |
$38,010 |
$41,608 |
$53,356 |
|
| Average Annual Return [Table Text Block] |
|
Table Summary
Average Annual Total Returns (%) |
1 year |
5 years |
10 years |
Class RFootnote Reference(a) |
10.66 |
7.60 |
14.29 |
Russell 1000® Index |
16.73 |
13.32 |
15.32 |
Russell 1000® Growth Index |
14.78 |
14.36 |
18.23 | |
| No Deduction of Taxes [Text Block] |
|
Performance does not reflect the deduction of taxes that a shareholder may pay on fund distributions or on the redemptions of fund shares.
|
| Updated Performance Information Location [Text Block] |
|
columbiathreadneedleus.com/investment-products/mutual-funds
|
| AssetsNet |
|
$ 1,209,625,976
|
| Holdings Count | Holding |
|
43
|
| Advisory Fees Paid, Amount |
|
$ 9,139,308
|
| InvestmentCompanyPortfolioTurnover |
|
53.00%
|
| Additional Fund Statistics [Text Block] |
|
Table Summary
Fund net assets |
$1,209,625,976 |
Total number of portfolio holdings |
43 |
Management services fees (represents 0.73% of Fund average net assets) |
$9,139,308 |
Portfolio turnover for the reporting period |
53% | |
| Holdings [Text Block] |
|
Information Technology Sub-Industry Allocation
Table Summary
Semiconductors |
20.6% |
Systems Software |
14.2% |
Technology Hardware, Storage & Peripherals |
6.9% |
Electronic Manufacturing Services |
1.4% |
Communications Equipment |
1.3% |
Other |
0.4% |
Table Summary
Information Technology |
44.8% |
Consumer Discretionary |
14.8% |
Communication Services |
13.5% |
Health Care |
10.2% |
Industrials |
5.9% |
Financials |
5.4% |
Consumer Staples |
3.8% |
Real Estate |
1.1% | |
| Largest Holdings [Text Block] |
|
Table Summary
NVIDIA Corp. |
13.3% |
Microsoft Corp. |
10.4% |
Alphabet, Inc., Class A |
7.6% |
Apple, Inc. |
6.9% |
Amazon.com, Inc. |
6.5% |
Meta Platforms, Inc., Class A |
5.0% |
Broadcom, Inc. |
4.9% |
Eli Lilly & Co. |
4.2% |
Visa, Inc., Class A |
3.1% |
Costco Wholesale Corp. |
2.8% | |
| Material Fund Change [Text Block] |
|
|
| C000253707 |
|
|
| Shareholder Report [Line Items] |
|
|
| Fund Name |
|
Columbia Large Cap Growth Opportunity Fund
|
| Class Name |
|
Class S
|
| Trading Symbol |
|
NFEDX
|
| Annual or Semi-Annual Statement [Text Block] |
|
This annual shareholder report contains important information about Columbia Large Cap Growth Opportunity Fund (the Fund) for the period of March 1, 2025 to February 28, 2026.
|
| Additional Information [Text Block] |
|
You can find additional information about the Fund at columbiathreadneedleus.com/resources/literature. You can also request more information by contacting us at 1-800-345-6611.
|
| Additional Information Phone Number |
|
1-800-345-6611
|
| Additional Information Website |
|
columbiathreadneedleus.com/resources/literature
|
| Expenses [Text Block] |
|
What were the Fund costs for the reporting period? (Based on a hypothetical $10,000 investment)
Table Summary
Class |
Cost of a $10,000 investment |
Cost paid as a percentage of a $10,000 investment |
Class S |
$84 |
0.80% | |
| Expenses Paid, Amount |
|
$ 84
|
| Expense Ratio, Percent |
|
0.80%
|
| Factors Affecting Performance [Text Block] |
|
Management's Discussion of Fund Performance The performance of Class S shares for the period presented is shown in the Average Annual Total Returns table. Top Performance ContributorsStock selection | Selections in the financials and consumer discretionary sectors boosted the Fund’s relative performance during the annual period. Allocations | An underweight position in the information technology sector, alongside an overweight in the communication services sector, contributed to the Fund’s relative performance during the annual period. Individual holdings | A relative overweight position in Exact Sciences Corporation, a developer of molecular diagnostics and cancer screening tests; a relative overweight position in General Motors Company, a global automotive manufacturer; a relative overweight position in Parker‑Hannifin Corporation, a provider of motion and control technologies; a relative overweight position in TE Connectivity plc, a designer and manufacturer of connectivity and sensor solutions; and a relative overweight position in General Dynamics Corporation, an aerospace and defense company, were among the top contributors to the Fund’s relative performance. Top Performance DetractorsStock selection | Selections in the information technology, industrials, real estate and utilities sectors hurt the Fund’s relative performance during the annual period. Allocations | An underweight position in the energy sector, alongside overweight positions in the financials and consumer discretionary sectors, detracted from the Fund’s relative performance during the annual period. Individual holdings | A relative overweight position in ServiceNow, Inc., an enterprise workflow software provider; a relative overweight position in Broadcom Inc., a designer and manufacturer of semiconductor and infrastructure software solutions; a relative overweight position in Palo Alto Networks, Inc., a cybersecurity platform provider; a relative overweight position in Constellation Brands, Inc., a producer and marketer of alcoholic beverages; and a relative overweight position in Bristol‑Myers Squibb Company, a global biopharmaceutical company, were among the top detractors from relative Fund performance. |
| Performance Past Does Not Indicate Future [Text] |
|
The Fund's past performance is not a good predictor of the Fund's future performance.
|
| Line Graph [Table Text Block] |
|
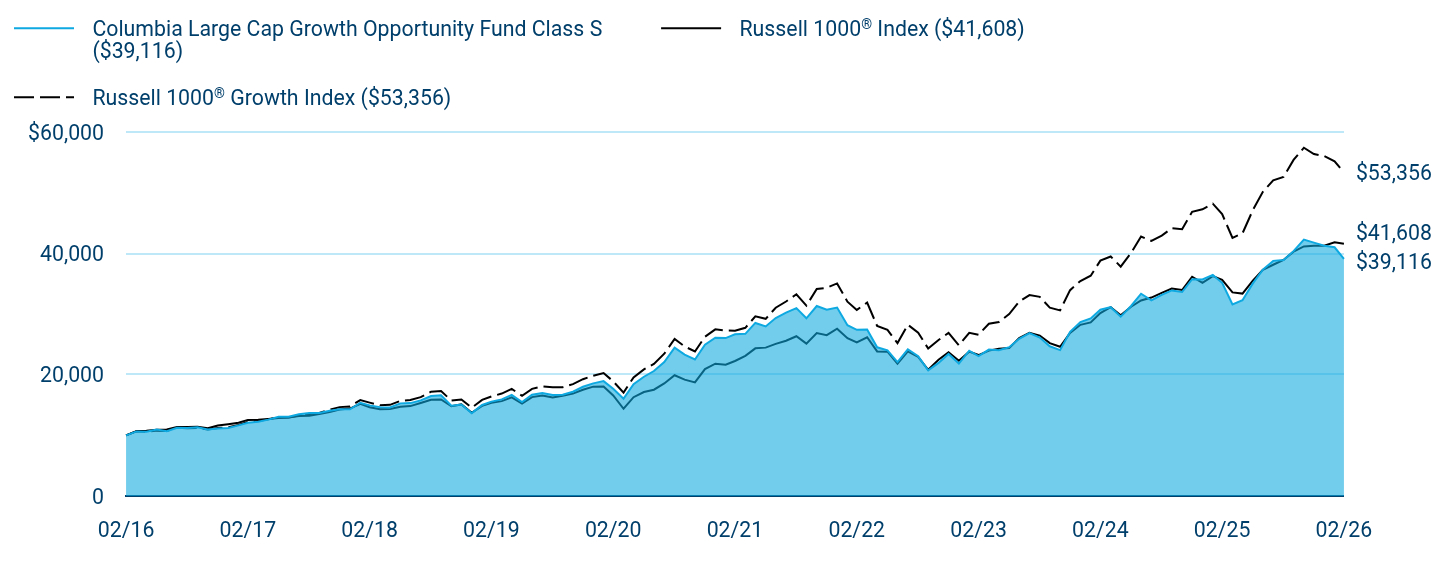
Table Summary
|
Columbia Large Cap Growth Opportunity Fund Class S ($39,116) |
Russell 1000® Index ($41,608) |
Russell 1000® Growth Index ($53,356) |
02/16 |
$10,000 |
$10,000 |
$10,000 |
03/16 |
$10,652 |
$10,697 |
$10,674 |
04/16 |
$10,599 |
$10,755 |
$10,577 |
05/16 |
$10,975 |
$10,943 |
$10,782 |
06/16 |
$10,679 |
$10,968 |
$10,740 |
07/16 |
$11,266 |
$11,386 |
$11,247 |
08/16 |
$11,213 |
$11,401 |
$11,191 |
09/16 |
$11,327 |
$11,410 |
$11,232 |
10/16 |
$10,984 |
$11,187 |
$10,968 |
11/16 |
$11,152 |
$11,628 |
$11,207 |
12/16 |
$11,202 |
$11,847 |
$11,346 |
01/17 |
$11,648 |
$12,085 |
$11,728 |
02/17 |
$12,085 |
$12,553 |
$12,215 |
03/17 |
$12,246 |
$12,561 |
$12,356 |
04/17 |
$12,600 |
$12,694 |
$12,639 |
05/17 |
$13,060 |
$12,856 |
$12,968 |
06/17 |
$13,082 |
$12,945 |
$12,933 |
07/17 |
$13,471 |
$13,202 |
$13,277 |
08/17 |
$13,688 |
$13,243 |
$13,521 |
09/17 |
$13,704 |
$13,525 |
$13,696 |
10/17 |
$14,053 |
$13,835 |
$14,227 |
11/17 |
$14,294 |
$14,257 |
$14,659 |
12/17 |
$14,292 |
$14,416 |
$14,773 |
01/18 |
$15,384 |
$15,207 |
$15,820 |
02/18 |
$14,944 |
$14,649 |
$15,405 |
03/18 |
$14,659 |
$14,317 |
$14,982 |
04/18 |
$14,610 |
$14,365 |
$15,035 |
05/18 |
$15,278 |
$14,732 |
$15,694 |
06/18 |
$15,323 |
$14,827 |
$15,845 |
07/18 |
$15,774 |
$15,339 |
$16,310 |
08/18 |
$16,487 |
$15,868 |
$17,202 |
09/18 |
$16,615 |
$15,928 |
$17,298 |
10/18 |
$14,907 |
$14,801 |
$15,751 |
11/18 |
$15,102 |
$15,102 |
$15,918 |
12/18 |
$13,667 |
$13,726 |
$14,550 |
01/19 |
$15,017 |
$14,877 |
$15,858 |
02/19 |
$15,570 |
$15,380 |
$16,425 |
03/19 |
$15,933 |
$15,648 |
$16,892 |
04/19 |
$16,667 |
$16,280 |
$17,656 |
05/19 |
$15,498 |
$15,243 |
$16,540 |
06/19 |
$16,712 |
$16,313 |
$17,676 |
07/19 |
$17,000 |
$16,566 |
$18,075 |
08/19 |
$16,647 |
$16,263 |
$17,937 |
09/19 |
$16,694 |
$16,545 |
$17,939 |
10/19 |
$17,194 |
$16,895 |
$18,445 |
11/19 |
$18,019 |
$17,534 |
$19,263 |
12/19 |
$18,578 |
$18,040 |
$19,844 |
01/20 |
$18,949 |
$18,060 |
$20,288 |
02/20 |
$17,678 |
$16,584 |
$18,906 |
03/20 |
$16,057 |
$14,392 |
$17,046 |
04/20 |
$18,428 |
$16,294 |
$19,569 |
05/20 |
$19,669 |
$17,154 |
$20,883 |
06/20 |
$20,618 |
$17,533 |
$21,792 |
07/20 |
$22,106 |
$18,560 |
$23,469 |
08/20 |
$24,472 |
$19,922 |
$25,890 |
09/20 |
$23,326 |
$19,194 |
$24,672 |
10/20 |
$22,523 |
$18,731 |
$23,834 |
11/20 |
$24,943 |
$20,937 |
$26,275 |
12/20 |
$26,101 |
$21,822 |
$27,483 |
01/21 |
$26,044 |
$21,642 |
$27,280 |
02/21 |
$26,672 |
$22,269 |
$27,273 |
03/21 |
$26,752 |
$23,112 |
$27,742 |
04/21 |
$28,544 |
$24,356 |
$29,630 |
05/21 |
$27,973 |
$24,472 |
$29,220 |
06/21 |
$29,360 |
$25,085 |
$31,053 |
07/21 |
$30,237 |
$25,606 |
$32,076 |
08/21 |
$30,988 |
$26,347 |
$33,276 |
09/21 |
$29,310 |
$25,137 |
$31,412 |
10/21 |
$31,338 |
$26,881 |
$34,133 |
11/21 |
$30,712 |
$26,521 |
$34,341 |
12/21 |
$31,079 |
$27,595 |
$35,067 |
01/22 |
$28,181 |
$26,039 |
$32,058 |
02/22 |
$27,411 |
$25,325 |
$30,696 |
03/22 |
$27,477 |
$26,179 |
$31,897 |
04/22 |
$24,529 |
$23,846 |
$28,045 |
05/22 |
$24,038 |
$23,809 |
$27,393 |
06/22 |
$22,097 |
$21,815 |
$25,223 |
07/22 |
$24,205 |
$23,847 |
$28,251 |
08/22 |
$23,070 |
$22,931 |
$26,935 |
09/22 |
$20,718 |
$20,810 |
$24,316 |
10/22 |
$21,955 |
$22,479 |
$25,737 |
11/22 |
$23,435 |
$23,695 |
$26,910 |
12/22 |
$21,853 |
$22,317 |
$24,850 |
01/23 |
$23,962 |
$23,813 |
$26,921 |
02/23 |
$23,090 |
$23,246 |
$26,601 |
03/23 |
$24,144 |
$23,982 |
$28,420 |
04/23 |
$24,043 |
$24,279 |
$28,700 |
05/23 |
$24,550 |
$24,392 |
$30,008 |
06/23 |
$25,928 |
$26,039 |
$32,060 |
07/23 |
$26,861 |
$26,935 |
$33,140 |
08/23 |
$26,131 |
$26,464 |
$32,843 |
09/23 |
$24,692 |
$25,220 |
$31,057 |
10/23 |
$24,063 |
$24,610 |
$30,615 |
11/23 |
$27,084 |
$26,909 |
$33,952 |
12/23 |
$28,685 |
$28,237 |
$35,455 |
01/24 |
$29,293 |
$28,631 |
$36,340 |
02/24 |
$30,733 |
$30,177 |
$38,819 |
03/24 |
$31,138 |
$31,145 |
$39,502 |
04/24 |
$29,577 |
$29,819 |
$37,827 |
05/24 |
$31,341 |
$31,224 |
$40,091 |
06/24 |
$33,365 |
$32,257 |
$42,795 |
07/24 |
$32,263 |
$32,726 |
$42,067 |
08/24 |
$33,178 |
$33,502 |
$42,943 |
09/24 |
$33,906 |
$34,218 |
$44,160 |
10/24 |
$33,644 |
$33,979 |
$44,014 |
11/24 |
$35,750 |
$36,167 |
$46,868 |
12/24 |
$35,722 |
$35,159 |
$47,282 |
01/25 |
$36,465 |
$36,278 |
$48,217 |
02/25 |
$35,168 |
$35,643 |
$46,485 |
03/25 |
$31,591 |
$33,580 |
$42,569 |
04/25 |
$32,282 |
$33,381 |
$43,323 |
05/25 |
$35,065 |
$35,512 |
$47,156 |
06/25 |
$37,341 |
$37,310 |
$50,163 |
07/25 |
$38,783 |
$38,139 |
$52,057 |
08/25 |
$38,926 |
$38,942 |
$52,639 |
09/25 |
$40,386 |
$40,292 |
$55,435 |
10/25 |
$42,291 |
$41,161 |
$57,449 |
11/25 |
$41,793 |
$41,262 |
$56,407 |
12/25 |
$41,285 |
$41,264 |
$56,058 |
01/26 |
$41,029 |
$41,832 |
$55,210 |
02/26 |
$39,116 |
$41,608 |
$53,356 |
|
| Average Annual Return [Table Text Block] |
|
Table Summary
Average Annual Total Returns (%) |
1 year |
5 years |
10 years |
Class SFootnote Reference(a) |
11.22 |
7.96 |
14.61 |
Russell 1000® Index |
16.73 |
13.32 |
15.32 |
Russell 1000® Growth Index |
14.78 |
14.36 |
18.23 | |
| No Deduction of Taxes [Text Block] |
|
Performance does not reflect the deduction of taxes that a shareholder may pay on fund distributions or on the redemptions of fund shares.
|
| Updated Performance Information Location [Text Block] |
|
columbiathreadneedleus.com/investment-products/mutual-funds
|
| AssetsNet |
|
$ 1,209,625,976
|
| Holdings Count | Holding |
|
43
|
| Advisory Fees Paid, Amount |
|
$ 9,139,308
|
| InvestmentCompanyPortfolioTurnover |
|
53.00%
|
| Additional Fund Statistics [Text Block] |
|
Table Summary
Fund net assets |
$1,209,625,976 |
Total number of portfolio holdings |
43 |
Management services fees (represents 0.73% of Fund average net assets) |
$9,139,308 |
Portfolio turnover for the reporting period |
53% | |
| Holdings [Text Block] |
|
Information Technology Sub-Industry Allocation
Table Summary
Semiconductors |
20.6% |
Systems Software |
14.2% |
Technology Hardware, Storage & Peripherals |
6.9% |
Electronic Manufacturing Services |
1.4% |
Communications Equipment |
1.3% |
Other |
0.4% |
Table Summary
Information Technology |
44.8% |
Consumer Discretionary |
14.8% |
Communication Services |
13.5% |
Health Care |
10.2% |
Industrials |
5.9% |
Financials |
5.4% |
Consumer Staples |
3.8% |
Real Estate |
1.1% | |
| Largest Holdings [Text Block] |
|
Table Summary
NVIDIA Corp. |
13.3% |
Microsoft Corp. |
10.4% |
Alphabet, Inc., Class A |
7.6% |
Apple, Inc. |
6.9% |
Amazon.com, Inc. |
6.5% |
Meta Platforms, Inc., Class A |
5.0% |
Broadcom, Inc. |
4.9% |
Eli Lilly & Co. |
4.2% |
Visa, Inc., Class A |
3.1% |
Costco Wholesale Corp. |
2.8% | |
| Material Fund Change [Text Block] |
|
|
| C000136868 |
|
|
| Shareholder Report [Line Items] |
|
|
| Fund Name |
|
Columbia Large Cap Growth Opportunity Fund
|
| Class Name |
|
Institutional 2 Class
|
| Trading Symbol |
|
CADRX
|
| Annual or Semi-Annual Statement [Text Block] |
|
This annual shareholder report contains important information about Columbia Large Cap Growth Opportunity Fund (the Fund) for the period of March 1, 2025 to February 28, 2026.
|
| Additional Information [Text Block] |
|
You can find additional information about the Fund at columbiathreadneedleus.com/resources/literature. You can also request more information by contacting us at 1-800-345-6611.
|
| Additional Information Phone Number |
|
1-800-345-6611
|
| Additional Information Website |
|
columbiathreadneedleus.com/resources/literature
|
| Expenses [Text Block] |
|
What were the Fund costs for the reporting period? (Based on a hypothetical $10,000 investment)
Table Summary
Class |
Cost of a $10,000 investment |
Cost paid as a percentage of a $10,000 investment |
Institutional 2 Class |
$78 |
0.74% | |
| Expenses Paid, Amount |
|
$ 78
|
| Expense Ratio, Percent |
|
0.74%
|
| Factors Affecting Performance [Text Block] |
|
Management's Discussion of Fund Performance The performance of Institutional 2 Class shares for the period presented is shown in the Average Annual Total Returns table. Top Performance ContributorsStock selection | Selections in the financials and consumer discretionary sectors boosted the Fund’s relative performance during the annual period. Allocations | An underweight position in the information technology sector, alongside an overweight in the communication services sector, contributed to the Fund’s relative performance during the annual period. Individual holdings | A relative overweight position in Exact Sciences Corporation, a developer of molecular diagnostics and cancer screening tests; a relative overweight position in General Motors Company, a global automotive manufacturer; a relative overweight position in Parker‑Hannifin Corporation, a provider of motion and control technologies; a relative overweight position in TE Connectivity plc, a designer and manufacturer of connectivity and sensor solutions; and a relative overweight position in General Dynamics Corporation, an aerospace and defense company, were among the top contributors to the Fund’s relative performance. Top Performance DetractorsStock selection | Selections in the information technology, industrials, real estate and utilities sectors hurt the Fund’s relative performance during the annual period. Allocations | An underweight position in the energy sector, alongside overweight positions in the financials and consumer discretionary sectors, detracted from the Fund’s relative performance during the annual period. Individual holdings | A relative overweight position in ServiceNow, Inc., an enterprise workflow software provider; a relative overweight position in Broadcom Inc., a designer and manufacturer of semiconductor and infrastructure software solutions; a relative overweight position in Palo Alto Networks, Inc., a cybersecurity platform provider; a relative overweight position in Constellation Brands, Inc., a producer and marketer of alcoholic beverages; and a relative overweight position in Bristol‑Myers Squibb Company, a global biopharmaceutical company, were among the top detractors from relative Fund performance. |
| Performance Past Does Not Indicate Future [Text] |
|
The Fund's past performance is not a good predictor of the Fund's future performance.
|
| Line Graph [Table Text Block] |
|
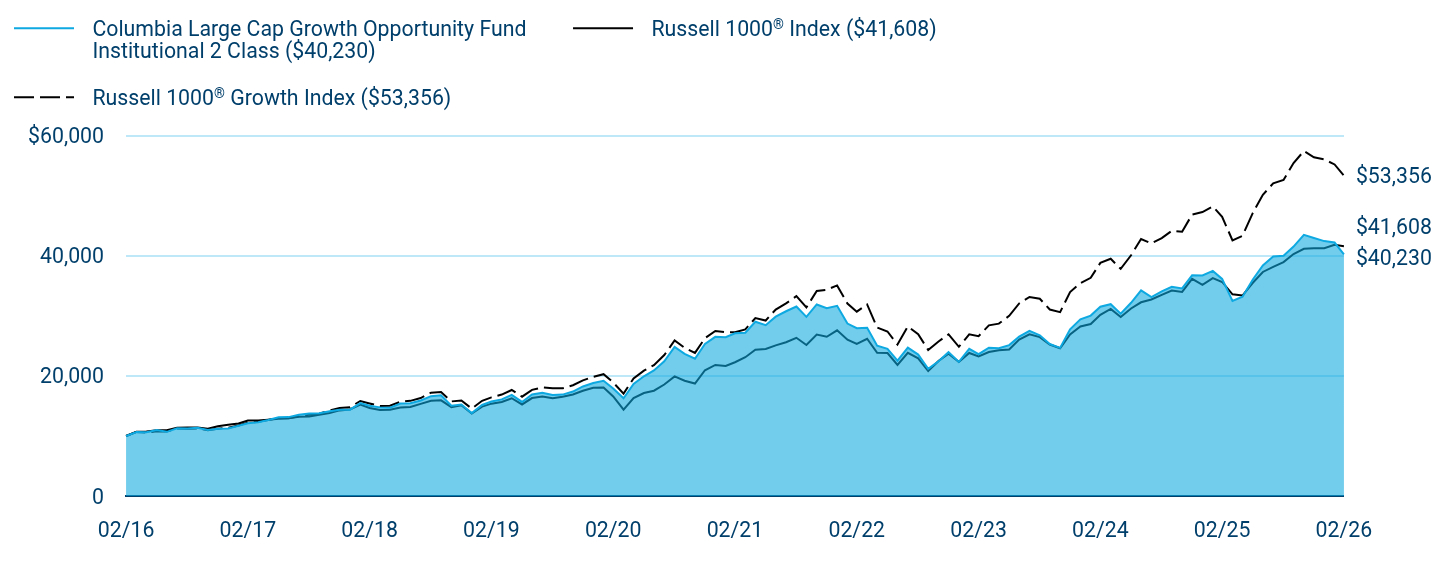
Table Summary
|
Columbia Large Cap Growth Opportunity Fund Institutional 2 Class ($40,230) |
Russell 1000® Index ($41,608) |
Russell 1000® Growth Index ($53,356) |
02/16 |
$10,000 |
$10,000 |
$10,000 |
03/16 |
$10,653 |
$10,697 |
$10,674 |
04/16 |
$10,604 |
$10,755 |
$10,577 |
05/16 |
$10,980 |
$10,943 |
$10,782 |
06/16 |
$10,684 |
$10,968 |
$10,740 |
07/16 |
$11,278 |
$11,386 |
$11,247 |
08/16 |
$11,229 |
$11,401 |
$11,191 |
09/16 |
$11,347 |
$11,410 |
$11,232 |
10/16 |
$11,008 |
$11,187 |
$10,968 |
11/16 |
$11,181 |
$11,628 |
$11,207 |
12/16 |
$11,227 |
$11,847 |
$11,346 |
01/17 |
$11,685 |
$12,085 |
$11,728 |
02/17 |
$12,123 |
$12,553 |
$12,215 |
03/17 |
$12,290 |
$12,561 |
$12,356 |
04/17 |
$12,652 |
$12,694 |
$12,639 |
05/17 |
$13,117 |
$12,856 |
$12,968 |
06/17 |
$13,137 |
$12,945 |
$12,933 |
07/17 |
$13,538 |
$13,202 |
$13,277 |
08/17 |
$13,755 |
$13,243 |
$13,521 |
09/17 |
$13,776 |
$13,525 |
$13,696 |
10/17 |
$14,127 |
$13,835 |
$14,227 |
11/17 |
$14,373 |
$14,257 |
$14,659 |
12/17 |
$14,376 |
$14,416 |
$14,773 |
01/18 |
$15,479 |
$15,207 |
$15,820 |
02/18 |
$15,038 |
$14,649 |
$15,405 |
03/18 |
$14,758 |
$14,317 |
$14,982 |
04/18 |
$14,714 |
$14,365 |
$15,035 |
05/18 |
$15,391 |
$14,732 |
$15,694 |
06/18 |
$15,438 |
$14,827 |
$15,845 |
07/18 |
$15,896 |
$15,339 |
$16,310 |
08/18 |
$16,629 |
$15,868 |
$17,202 |
09/18 |
$16,759 |
$15,928 |
$17,298 |
10/18 |
$15,041 |
$14,801 |
$15,751 |
11/18 |
$15,232 |
$15,102 |
$15,918 |
12/18 |
$13,798 |
$13,726 |
$14,550 |
01/19 |
$15,156 |
$14,877 |
$15,858 |
02/19 |
$15,730 |
$15,380 |
$16,425 |
03/19 |
$16,093 |
$15,648 |
$16,892 |
04/19 |
$16,845 |
$16,280 |
$17,656 |
05/19 |
$15,665 |
$15,243 |
$16,540 |
06/19 |
$16,894 |
$16,313 |
$17,676 |
07/19 |
$17,191 |
$16,566 |
$18,075 |
08/19 |
$16,836 |
$16,263 |
$17,937 |
09/19 |
$16,886 |
$16,545 |
$17,939 |
10/19 |
$17,397 |
$16,895 |
$18,445 |
11/19 |
$18,238 |
$17,534 |
$19,263 |
12/19 |
$18,810 |
$18,040 |
$19,844 |
01/20 |
$19,189 |
$18,060 |
$20,288 |
02/20 |
$17,902 |
$16,584 |
$18,906 |
03/20 |
$16,263 |
$14,392 |
$17,046 |
04/20 |
$18,678 |
$16,294 |
$19,569 |
05/20 |
$19,938 |
$17,154 |
$20,883 |
06/20 |
$20,907 |
$17,533 |
$21,792 |
07/20 |
$22,421 |
$18,560 |
$23,469 |
08/20 |
$24,822 |
$19,922 |
$25,890 |
09/20 |
$23,664 |
$19,194 |
$24,672 |
10/20 |
$22,860 |
$18,731 |
$23,834 |
11/20 |
$25,318 |
$20,937 |
$26,275 |
12/20 |
$26,507 |
$21,822 |
$27,483 |
01/21 |
$26,448 |
$21,642 |
$27,280 |
02/21 |
$27,109 |
$22,269 |
$27,273 |
03/21 |
$27,188 |
$23,112 |
$27,742 |
04/21 |
$29,015 |
$24,356 |
$29,630 |
05/21 |
$28,442 |
$24,472 |
$29,220 |
06/21 |
$29,867 |
$25,085 |
$31,053 |
07/21 |
$30,766 |
$25,606 |
$32,076 |
08/21 |
$31,547 |
$26,347 |
$33,276 |
09/21 |
$29,835 |
$25,137 |
$31,412 |
10/21 |
$31,900 |
$26,881 |
$34,133 |
11/21 |
$31,280 |
$26,521 |
$34,341 |
12/21 |
$31,663 |
$27,595 |
$35,067 |
01/22 |
$28,722 |
$26,039 |
$32,058 |
02/22 |
$27,946 |
$25,325 |
$30,696 |
03/22 |
$28,013 |
$26,179 |
$31,897 |
04/22 |
$25,018 |
$23,846 |
$28,045 |
05/22 |
$24,510 |
$23,809 |
$27,393 |
06/22 |
$22,536 |
$21,815 |
$25,223 |
07/22 |
$24,701 |
$23,847 |
$28,251 |
08/22 |
$23,548 |
$22,931 |
$26,935 |
09/22 |
$21,161 |
$20,810 |
$24,316 |
10/22 |
$22,426 |
$22,479 |
$25,737 |
11/22 |
$23,943 |
$23,695 |
$26,910 |
12/22 |
$22,331 |
$22,317 |
$24,850 |
01/23 |
$24,496 |
$23,813 |
$26,921 |
02/23 |
$23,611 |
$23,246 |
$26,601 |
03/23 |
$24,685 |
$23,982 |
$28,420 |
04/23 |
$24,591 |
$24,279 |
$28,700 |
05/23 |
$25,128 |
$24,392 |
$30,008 |
06/23 |
$26,535 |
$26,039 |
$32,060 |
07/23 |
$27,514 |
$26,935 |
$33,140 |
08/23 |
$26,772 |
$26,464 |
$32,843 |
09/23 |
$25,302 |
$25,220 |
$31,057 |
10/23 |
$24,670 |
$24,610 |
$30,615 |
11/23 |
$27,751 |
$26,909 |
$33,952 |
12/23 |
$29,411 |
$28,237 |
$35,455 |
01/24 |
$30,043 |
$28,631 |
$36,340 |
02/24 |
$31,513 |
$30,177 |
$38,819 |
03/24 |
$31,939 |
$31,145 |
$39,502 |
04/24 |
$30,359 |
$29,819 |
$37,827 |
05/24 |
$32,176 |
$31,224 |
$40,091 |
06/24 |
$34,244 |
$32,257 |
$42,795 |
07/24 |
$33,133 |
$32,726 |
$42,067 |
08/24 |
$34,083 |
$33,502 |
$42,943 |
09/24 |
$34,824 |
$34,218 |
$44,160 |
10/24 |
$34,567 |
$33,979 |
$44,014 |
11/24 |
$36,741 |
$36,167 |
$46,868 |
12/24 |
$36,714 |
$35,159 |
$47,282 |
01/25 |
$37,478 |
$36,278 |
$48,217 |
02/25 |
$36,146 |
$35,643 |
$46,485 |
03/25 |
$32,474 |
$33,580 |
$42,569 |
04/25 |
$33,189 |
$33,381 |
$43,323 |
05/25 |
$36,048 |
$35,512 |
$47,156 |
06/25 |
$38,399 |
$37,310 |
$50,163 |
07/25 |
$39,868 |
$38,139 |
$52,057 |
08/25 |
$40,018 |
$38,942 |
$52,639 |
09/25 |
$41,538 |
$40,292 |
$55,435 |
10/25 |
$43,491 |
$41,161 |
$57,449 |
11/25 |
$42,973 |
$41,262 |
$56,407 |
12/25 |
$42,447 |
$41,264 |
$56,058 |
01/26 |
$42,208 |
$41,832 |
$55,210 |
02/26 |
$40,230 |
$41,608 |
$53,356 |
|
| Average Annual Return [Table Text Block] |
|
Table Summary
Average Annual Total Returns (%) |
1 year |
5 years |
10 years |
Institutional 2 Class |
11.30 |
8.21 |
14.94 |
Russell 1000® Index |
16.73 |
13.32 |
15.32 |
Russell 1000® Growth Index |
14.78 |
14.36 |
18.23 | |
| No Deduction of Taxes [Text Block] |
|
Performance does not reflect the deduction of taxes that a shareholder may pay on fund distributions or on the redemptions of fund shares.
|
| Updated Performance Information Location [Text Block] |
|
columbiathreadneedleus.com/investment-products/mutual-funds
|
| AssetsNet |
|
$ 1,209,625,976
|
| Holdings Count | Holding |
|
43
|
| Advisory Fees Paid, Amount |
|
$ 9,139,308
|
| InvestmentCompanyPortfolioTurnover |
|
53.00%
|
| Additional Fund Statistics [Text Block] |
|
Table Summary
Fund net assets |
$1,209,625,976 |
Total number of portfolio holdings |
43 |
Management services fees (represents 0.73% of Fund average net assets) |
$9,139,308 |
Portfolio turnover for the reporting period |
53% | |
| Holdings [Text Block] |
|
Information Technology Sub-Industry Allocation
Table Summary
Semiconductors |
20.6% |
Systems Software |
14.2% |
Technology Hardware, Storage & Peripherals |
6.9% |
Electronic Manufacturing Services |
1.4% |
Communications Equipment |
1.3% |
Other |
0.4% |
Table Summary
Information Technology |
44.8% |
Consumer Discretionary |
14.8% |
Communication Services |
13.5% |
Health Care |
10.2% |
Industrials |
5.9% |
Financials |
5.4% |
Consumer Staples |
3.8% |
Real Estate |
1.1% | |
| Largest Holdings [Text Block] |
|
Table Summary
NVIDIA Corp. |
13.3% |
Microsoft Corp. |
10.4% |
Alphabet, Inc., Class A |
7.6% |
Apple, Inc. |
6.9% |
Amazon.com, Inc. |
6.5% |
Meta Platforms, Inc., Class A |
5.0% |
Broadcom, Inc. |
4.9% |
Eli Lilly & Co. |
4.2% |
Visa, Inc., Class A |
3.1% |
Costco Wholesale Corp. |
2.8% | |
| Material Fund Change [Text Block] |
|
|
| C000171353 |
|
|
| Shareholder Report [Line Items] |
|
|
| Fund Name |
|
Columbia Large Cap Growth Opportunity Fund
|
| Class Name |
|
Institutional 3 Class
|
| Trading Symbol |
|
CLRYX
|
| Annual or Semi-Annual Statement [Text Block] |
|
This annual shareholder report contains important information about Columbia Large Cap Growth Opportunity Fund (the Fund) for the period of March 1, 2025 to February 28, 2026.
|
| Additional Information [Text Block] |
|
You can find additional information about the Fund at columbiathreadneedleus.com/resources/literature. You can also request more information by contacting us at 1-800-345-6611.
|
| Additional Information Phone Number |
|
1-800-345-6611
|
| Additional Information Website |
|
columbiathreadneedleus.com/resources/literature
|
| Expenses [Text Block] |
|
What were the Fund costs for the reporting period? (Based on a hypothetical $10,000 investment)
Table Summary
Class |
Cost of a $10,000 investment |
Cost paid as a percentage of a $10,000 investment |
Institutional 3 Class |
$74 |
0.70% | |
| Expenses Paid, Amount |
|
$ 74
|
| Expense Ratio, Percent |
|
0.70%
|
| Factors Affecting Performance [Text Block] |
|
Management's Discussion of Fund Performance The performance of Institutional 3 Class shares for the period presented is shown in the Average Annual Total Returns table. Top Performance ContributorsStock selection | Selections in the financials and consumer discretionary sectors boosted the Fund’s relative performance during the annual period. Allocations | An underweight position in the information technology sector, alongside an overweight in the communication services sector, contributed to the Fund’s relative performance during the annual period. Individual holdings | A relative overweight position in Exact Sciences Corporation, a developer of molecular diagnostics and cancer screening tests; a relative overweight position in General Motors Company, a global automotive manufacturer; a relative overweight position in Parker‑Hannifin Corporation, a provider of motion and control technologies; a relative overweight position in TE Connectivity plc, a designer and manufacturer of connectivity and sensor solutions; and a relative overweight position in General Dynamics Corporation, an aerospace and defense company, were among the top contributors to the Fund’s relative performance. Top Performance DetractorsStock selection | Selections in the information technology, industrials, real estate and utilities sectors hurt the Fund’s relative performance during the annual period. Allocations | An underweight position in the energy sector, alongside overweight positions in the financials and consumer discretionary sectors, detracted from the Fund’s relative performance during the annual period. Individual holdings | A relative overweight position in ServiceNow, Inc., an enterprise workflow software provider; a relative overweight position in Broadcom Inc., a designer and manufacturer of semiconductor and infrastructure software solutions; a relative overweight position in Palo Alto Networks, Inc., a cybersecurity platform provider; a relative overweight position in Constellation Brands, Inc., a producer and marketer of alcoholic beverages; and a relative overweight position in Bristol‑Myers Squibb Company, a global biopharmaceutical company, were among the top detractors from relative Fund performance. |
| Performance Past Does Not Indicate Future [Text] |
|
The Fund's past performance is not a good predictor of the Fund's future performance.
|
| Line Graph [Table Text Block] |
|

Table Summary
|
Columbia Large Cap Growth Opportunity Fund Institutional 3 Class ($40,263) |
Russell 1000® Index ($41,608) |
Russell 1000® Growth Index ($53,356) |
02/16 |
$10,000 |
$10,000 |
$10,000 |
03/16 |
$10,652 |
$10,697 |
$10,674 |
04/16 |
$10,599 |
$10,755 |
$10,577 |
05/16 |
$10,975 |
$10,943 |
$10,782 |
06/16 |
$10,679 |
$10,968 |
$10,740 |
07/16 |
$11,266 |
$11,386 |
$11,247 |
08/16 |
$11,213 |
$11,401 |
$11,191 |
09/16 |
$11,327 |
$11,410 |
$11,232 |
10/16 |
$10,984 |
$11,187 |
$10,968 |
11/16 |
$11,152 |
$11,628 |
$11,207 |
12/16 |
$11,202 |
$11,847 |
$11,346 |
01/17 |
$11,648 |
$12,085 |
$11,728 |
02/17 |
$12,085 |
$12,553 |
$12,215 |
03/17 |
$12,253 |
$12,561 |
$12,356 |
04/17 |
$12,611 |
$12,694 |
$12,639 |
05/17 |
$13,076 |
$12,856 |
$12,968 |
06/17 |
$13,104 |
$12,945 |
$12,933 |
07/17 |
$13,502 |
$13,202 |
$13,277 |
08/17 |
$13,719 |
$13,243 |
$13,521 |
09/17 |
$13,740 |
$13,525 |
$13,696 |
10/17 |
$14,095 |
$13,835 |
$14,227 |
11/17 |
$14,333 |
$14,257 |
$14,659 |
12/17 |
$14,339 |
$14,416 |
$14,773 |
01/18 |
$15,439 |
$15,207 |
$15,820 |
02/18 |
$14,999 |
$14,649 |
$15,405 |
03/18 |
$14,718 |
$14,317 |
$14,982 |
04/18 |
$14,673 |
$14,365 |
$15,035 |
05/18 |
$15,356 |
$14,732 |
$15,694 |
06/18 |
$15,398 |
$14,827 |
$15,845 |
07/18 |
$15,855 |
$15,339 |
$16,310 |
08/18 |
$16,581 |
$15,868 |
$17,202 |
09/18 |
$16,723 |
$15,928 |
$17,298 |
10/18 |
$15,003 |
$14,801 |
$15,751 |
11/18 |
$15,200 |
$15,102 |
$15,918 |
12/18 |
$13,766 |
$13,726 |
$14,550 |
01/19 |
$15,122 |
$14,877 |
$15,858 |
02/19 |
$15,691 |
$15,380 |
$16,425 |
03/19 |
$16,059 |
$15,648 |
$16,892 |
04/19 |
$16,804 |
$16,280 |
$17,656 |
05/19 |
$15,632 |
$15,243 |
$16,540 |
06/19 |
$16,854 |
$16,313 |
$17,676 |
07/19 |
$17,162 |
$16,566 |
$18,075 |
08/19 |
$16,803 |
$16,263 |
$17,937 |
09/19 |
$16,854 |
$16,545 |
$17,939 |
10/19 |
$17,367 |
$16,895 |
$18,445 |
11/19 |
$18,204 |
$17,534 |
$19,263 |
12/19 |
$18,771 |
$18,040 |
$19,844 |
01/20 |
$19,156 |
$18,060 |
$20,288 |
02/20 |
$17,874 |
$16,584 |
$18,906 |
03/20 |
$16,244 |
$14,392 |
$17,046 |
04/20 |
$18,652 |
$16,294 |
$19,569 |
05/20 |
$19,907 |
$17,154 |
$20,883 |
06/20 |
$20,876 |
$17,533 |
$21,792 |
07/20 |
$22,394 |
$18,560 |
$23,469 |
08/20 |
$24,789 |
$19,922 |
$25,890 |
09/20 |
$23,630 |
$19,194 |
$24,672 |
10/20 |
$22,823 |
$18,731 |
$23,834 |
11/20 |
$25,285 |
$20,937 |
$26,275 |
12/20 |
$26,465 |
$21,822 |
$27,483 |
01/21 |
$26,413 |
$21,642 |
$27,280 |
02/21 |
$27,073 |
$22,269 |
$27,273 |
03/21 |
$27,155 |
$23,112 |
$27,742 |
04/21 |
$28,979 |
$24,356 |
$29,630 |
05/21 |
$28,413 |
$24,472 |
$29,220 |
06/21 |
$29,826 |
$25,085 |
$31,053 |
07/21 |
$30,734 |
$25,606 |
$32,076 |
08/21 |
$31,508 |
$26,347 |
$33,276 |
09/21 |
$29,803 |
$25,137 |
$31,412 |
10/21 |
$31,867 |
$26,881 |
$34,133 |
11/21 |
$31,250 |
$26,521 |
$34,341 |
12/21 |
$31,628 |
$27,595 |
$35,067 |
01/22 |
$28,704 |
$26,039 |
$32,058 |
02/22 |
$27,923 |
$25,325 |
$30,696 |
03/22 |
$27,980 |
$26,179 |
$31,897 |
04/22 |
$24,999 |
$23,846 |
$28,045 |
05/22 |
$24,502 |
$23,809 |
$27,393 |
06/22 |
$22,519 |
$21,815 |
$25,223 |
07/22 |
$24,674 |
$23,847 |
$28,251 |
08/22 |
$23,537 |
$22,931 |
$26,935 |
09/22 |
$21,145 |
$20,810 |
$24,316 |
10/22 |
$22,417 |
$22,479 |
$25,737 |
11/22 |
$23,928 |
$23,695 |
$26,910 |
12/22 |
$22,333 |
$22,317 |
$24,850 |
01/23 |
$24,488 |
$23,813 |
$26,921 |
02/23 |
$23,588 |
$23,246 |
$26,601 |
03/23 |
$24,691 |
$23,982 |
$28,420 |
04/23 |
$24,573 |
$24,279 |
$28,700 |
05/23 |
$25,116 |
$24,392 |
$30,008 |
06/23 |
$26,541 |
$26,039 |
$32,060 |
07/23 |
$27,508 |
$26,935 |
$33,140 |
08/23 |
$26,762 |
$26,464 |
$32,843 |
09/23 |
$25,302 |
$25,220 |
$31,057 |
10/23 |
$24,657 |
$24,610 |
$30,615 |
11/23 |
$27,746 |
$26,909 |
$33,952 |
12/23 |
$29,409 |
$28,237 |
$35,455 |
01/24 |
$30,054 |
$28,631 |
$36,340 |
02/24 |
$31,530 |
$30,177 |
$38,819 |
03/24 |
$31,938 |
$31,145 |
$39,502 |
04/24 |
$30,359 |
$29,819 |
$37,827 |
05/24 |
$32,175 |
$31,224 |
$40,091 |
06/24 |
$34,260 |
$32,257 |
$42,795 |
07/24 |
$33,134 |
$32,726 |
$42,067 |
08/24 |
$34,104 |
$33,502 |
$42,943 |
09/24 |
$34,832 |
$34,218 |
$44,160 |
10/24 |
$34,589 |
$33,979 |
$44,014 |
11/24 |
$36,754 |
$36,167 |
$46,868 |
12/24 |
$36,743 |
$35,159 |
$47,282 |
01/25 |
$37,495 |
$36,278 |
$48,217 |
02/25 |
$36,166 |
$35,643 |
$46,485 |
03/25 |
$32,495 |
$33,580 |
$42,569 |
04/25 |
$33,212 |
$33,381 |
$43,323 |
05/25 |
$36,061 |
$35,512 |
$47,156 |
06/25 |
$38,433 |
$37,310 |
$50,163 |
07/25 |
$39,910 |
$38,139 |
$52,057 |
08/25 |
$40,054 |
$38,942 |
$52,639 |
09/25 |
$41,566 |
$40,292 |
$55,435 |
10/25 |
$43,528 |
$41,161 |
$57,449 |
11/25 |
$43,006 |
$41,262 |
$56,407 |
12/25 |
$42,492 |
$41,264 |
$56,058 |
01/26 |
$42,234 |
$41,832 |
$55,210 |
02/26 |
$40,263 |
$41,608 |
$53,356 |
|
| Average Annual Return [Table Text Block] |
|
Table Summary
Average Annual Total Returns (%) |
1 year |
5 years |
10 years |
Institutional 3 ClassFootnote Reference(a) |
11.33 |
8.26 |
14.95 |
Russell 1000® Index |
16.73 |
13.32 |
15.32 |
Russell 1000® Growth Index |
14.78 |
14.36 |
18.23 | |
| No Deduction of Taxes [Text Block] |
|
Performance does not reflect the deduction of taxes that a shareholder may pay on fund distributions or on the redemptions of fund shares.
|
| Updated Performance Information Location [Text Block] |
|
columbiathreadneedleus.com/investment-products/mutual-funds
|
| AssetsNet |
|
$ 1,209,625,976
|
| Holdings Count | Holding |
|
43
|
| Advisory Fees Paid, Amount |
|
$ 9,139,308
|
| InvestmentCompanyPortfolioTurnover |
|
53.00%
|
| Additional Fund Statistics [Text Block] |
|
Table Summary
Fund net assets |
$1,209,625,976 |
Total number of portfolio holdings |
43 |
Management services fees (represents 0.73% of Fund average net assets) |
$9,139,308 |
Portfolio turnover for the reporting period |
53% | |
| Holdings [Text Block] |
|
Information Technology Sub-Industry Allocation
Table Summary
Semiconductors |
20.6% |
Systems Software |
14.2% |
Technology Hardware, Storage & Peripherals |
6.9% |
Electronic Manufacturing Services |
1.4% |
Communications Equipment |
1.3% |
Other |
0.4% |
Table Summary
Information Technology |
44.8% |
Consumer Discretionary |
14.8% |
Communication Services |
13.5% |
Health Care |
10.2% |
Industrials |
5.9% |
Financials |
5.4% |
Consumer Staples |
3.8% |
Real Estate |
1.1% | |
| Largest Holdings [Text Block] |
|
Table Summary
NVIDIA Corp. |
13.3% |
Microsoft Corp. |
10.4% |
Alphabet, Inc., Class A |
7.6% |
Apple, Inc. |
6.9% |
Amazon.com, Inc. |
6.5% |
Meta Platforms, Inc., Class A |
5.0% |
Broadcom, Inc. |
4.9% |
Eli Lilly & Co. |
4.2% |
Visa, Inc., Class A |
3.1% |
Costco Wholesale Corp. |
2.8% | |
| Material Fund Change [Text Block] |
|
|
| C000029877 |
|
|
| Shareholder Report [Line Items] |
|
|
| Fund Name |
|
Columbia Large Cap Growth Opportunity Fund
|
| Class Name |
|
Institutional Class
|
| Trading Symbol |
|
NFEPX
|
| Annual or Semi-Annual Statement [Text Block] |
|
This annual shareholder report contains important information about Columbia Large Cap Growth Opportunity Fund (the Fund) for the period of March 1, 2025 to February 28, 2026.
|
| Additional Information [Text Block] |
|
You can find additional information about the Fund at columbiathreadneedleus.com/resources/literature. You can also request more information by contacting us at 1-800-345-6611.
|
| Additional Information Phone Number |
|
1-800-345-6611
|
| Additional Information Website |
|
columbiathreadneedleus.com/resources/literature
|
| Expenses [Text Block] |
|
What were the Fund costs for the reporting period? (Based on a hypothetical $10,000 investment)
Table Summary
Class |
Cost of a $10,000 investment |
Cost paid as a percentage of a $10,000 investment |
Institutional Class |
$84 |
0.80% | |
| Expenses Paid, Amount |
|
$ 84
|
| Expense Ratio, Percent |
|
0.80%
|
| Factors Affecting Performance [Text Block] |
|
Management's Discussion of Fund Performance The performance of Institutional Class shares for the period presented is shown in the Average Annual Total Returns table. Top Performance ContributorsStock selection | Selections in the financials and consumer discretionary sectors boosted the Fund’s relative performance during the annual period. Allocations | An underweight position in the information technology sector, alongside an overweight in the communication services sector, contributed to the Fund’s relative performance during the annual period. Individual holdings | A relative overweight position in Exact Sciences Corporation, a developer of molecular diagnostics and cancer screening tests; a relative overweight position in General Motors Company, a global automotive manufacturer; a relative overweight position in Parker‑Hannifin Corporation, a provider of motion and control technologies; a relative overweight position in TE Connectivity plc, a designer and manufacturer of connectivity and sensor solutions; and a relative overweight position in General Dynamics Corporation, an aerospace and defense company, were among the top contributors to the Fund’s relative performance. Top Performance DetractorsStock selection | Selections in the information technology, industrials, real estate and utilities sectors hurt the Fund’s relative performance during the annual period. Allocations | An underweight position in the energy sector, alongside overweight positions in the financials and consumer discretionary sectors, detracted from the Fund’s relative performance during the annual period. Individual holdings | A relative overweight position in ServiceNow, Inc., an enterprise workflow software provider; a relative overweight position in Broadcom Inc., a designer and manufacturer of semiconductor and infrastructure software solutions; a relative overweight position in Palo Alto Networks, Inc., a cybersecurity platform provider; a relative overweight position in Constellation Brands, Inc., a producer and marketer of alcoholic beverages; and a relative overweight position in Bristol‑Myers Squibb Company, a global biopharmaceutical company, were among the top detractors from relative Fund performance. |
| Performance Past Does Not Indicate Future [Text] |
|
The Fund's past performance is not a good predictor of the Fund's future performance.
|
| Line Graph [Table Text Block] |
|

Table Summary
|
Columbia Large Cap Growth Opportunity Fund Institutional Class ($39,971) |
Russell 1000® Index ($41,608) |
Russell 1000® Growth Index ($53,356) |
02/16 |
$10,000 |
$10,000 |
$10,000 |
03/16 |
$10,654 |
$10,697 |
$10,674 |
04/16 |
$10,604 |
$10,755 |
$10,577 |
05/16 |
$10,985 |
$10,943 |
$10,782 |
06/16 |
$10,687 |
$10,968 |
$10,740 |
07/16 |
$11,280 |
$11,386 |
$11,247 |
08/16 |
$11,223 |
$11,401 |
$11,191 |
09/16 |
$11,344 |
$11,410 |
$11,232 |
10/16 |
$11,008 |
$11,187 |
$10,968 |
11/16 |
$11,180 |
$11,628 |
$11,207 |
12/16 |
$11,227 |
$11,847 |
$11,346 |
01/17 |
$11,680 |
$12,085 |
$11,728 |
02/17 |
$12,119 |
$12,553 |
$12,215 |
03/17 |
$12,285 |
$12,561 |
$12,356 |
04/17 |
$12,645 |
$12,694 |
$12,639 |
05/17 |
$13,105 |
$12,856 |
$12,968 |
06/17 |
$13,133 |
$12,945 |
$12,933 |
07/17 |
$13,526 |
$13,202 |
$13,277 |
08/17 |
$13,744 |
$13,243 |
$13,521 |
09/17 |
$13,766 |
$13,525 |
$13,696 |
10/17 |
$14,115 |
$13,835 |
$14,227 |
11/17 |
$14,362 |
$14,257 |
$14,659 |
12/17 |
$14,364 |
$14,416 |
$14,773 |
01/18 |
$15,462 |
$15,207 |
$15,820 |
02/18 |
$15,020 |
$14,649 |
$15,405 |
03/18 |
$14,738 |
$14,317 |
$14,982 |
04/18 |
$14,692 |
$14,365 |
$15,035 |
05/18 |
$15,378 |
$14,732 |
$15,694 |
06/18 |
$15,418 |
$14,827 |
$15,845 |
07/18 |
$15,870 |
$15,339 |
$16,310 |
08/18 |
$16,599 |
$15,868 |
$17,202 |
09/18 |
$16,734 |
$15,928 |
$17,298 |
10/18 |
$15,014 |
$14,801 |
$15,751 |
11/18 |
$15,212 |
$15,102 |
$15,918 |
12/18 |
$13,770 |
$13,726 |
$14,550 |
01/19 |
$15,133 |
$14,877 |
$15,858 |
02/19 |
$15,697 |
$15,380 |
$16,425 |
03/19 |
$16,058 |
$15,648 |
$16,892 |
04/19 |
$16,807 |
$16,280 |
$17,656 |
05/19 |
$15,629 |
$15,243 |
$16,540 |
06/19 |
$16,858 |
$16,313 |
$17,676 |
07/19 |
$17,158 |
$16,566 |
$18,075 |
08/19 |
$16,798 |
$16,263 |
$17,937 |
09/19 |
$16,849 |
$16,545 |
$17,939 |
10/19 |
$17,356 |
$16,895 |
$18,445 |
11/19 |
$18,197 |
$17,534 |
$19,263 |
12/19 |
$18,768 |
$18,040 |
$19,844 |
01/20 |
$19,145 |
$18,060 |
$20,288 |
02/20 |
$17,856 |
$16,584 |
$18,906 |
03/20 |
$16,226 |
$14,392 |
$17,046 |
04/20 |
$18,630 |
$16,294 |
$19,569 |
05/20 |
$19,891 |
$17,154 |
$20,883 |
06/20 |
$20,847 |
$17,533 |
$21,792 |
07/20 |
$22,365 |
$18,560 |
$23,469 |
08/20 |
$24,755 |
$19,922 |
$25,890 |
09/20 |
$23,599 |
$19,194 |
$24,672 |
10/20 |
$22,796 |
$18,731 |
$23,834 |
11/20 |
$25,244 |
$20,937 |
$26,275 |
12/20 |
$26,432 |
$21,822 |
$27,483 |
01/21 |
$26,369 |
$21,642 |
$27,280 |
02/21 |
$27,023 |
$22,269 |
$27,273 |
03/21 |
$27,095 |
$23,112 |
$27,742 |
04/21 |
$28,921 |
$24,356 |
$29,630 |
05/21 |
$28,351 |
$24,472 |
$29,220 |
06/21 |
$29,761 |
$25,085 |
$31,053 |
07/21 |
$30,664 |
$25,606 |
$32,076 |
08/21 |
$31,432 |
$26,347 |
$33,276 |
09/21 |
$29,739 |
$25,137 |
$31,412 |
10/21 |
$31,793 |
$26,881 |
$34,133 |
11/21 |
$31,161 |
$26,521 |
$34,341 |
12/21 |
$31,551 |
$27,595 |
$35,067 |
01/22 |
$28,618 |
$26,039 |
$32,058 |
02/22 |
$27,831 |
$25,325 |
$30,696 |
03/22 |
$27,903 |
$26,179 |
$31,897 |
04/22 |
$24,926 |
$23,846 |
$28,045 |
05/22 |
$24,426 |
$23,809 |
$27,393 |
06/22 |
$22,459 |
$21,815 |
$25,223 |
07/22 |
$24,602 |
$23,847 |
$28,251 |
08/22 |
$23,453 |
$22,931 |
$26,935 |
09/22 |
$21,070 |
$20,810 |
$24,316 |
10/22 |
$22,339 |
$22,479 |
$25,737 |
11/22 |
$23,830 |
$23,695 |
$26,910 |
12/22 |
$22,236 |
$22,317 |
$24,850 |
01/23 |
$24,396 |
$23,813 |
$26,921 |
02/23 |
$23,505 |
$23,246 |
$26,601 |
03/23 |
$24,585 |
$23,982 |
$28,420 |
04/23 |
$24,482 |
$24,279 |
$28,700 |
05/23 |
$25,013 |
$24,392 |
$30,008 |
06/23 |
$26,419 |
$26,039 |
$32,060 |
07/23 |
$27,379 |
$26,935 |
$33,140 |
08/23 |
$26,642 |
$26,464 |
$32,843 |
09/23 |
$25,185 |
$25,220 |
$31,057 |
10/23 |
$24,550 |
$24,610 |
$30,615 |
11/23 |
$27,619 |
$26,909 |
$33,952 |
12/23 |
$29,265 |
$28,237 |
$35,455 |
01/24 |
$29,899 |
$28,631 |
$36,340 |
02/24 |
$31,374 |
$30,177 |
$38,819 |
03/24 |
$31,785 |
$31,145 |
$39,502 |
04/24 |
$30,208 |
$29,819 |
$37,827 |
05/24 |
$32,008 |
$31,224 |
$40,091 |
06/24 |
$34,080 |
$32,257 |
$42,795 |
07/24 |
$32,960 |
$32,726 |
$42,067 |
08/24 |
$33,923 |
$33,502 |
$42,943 |
09/24 |
$34,641 |
$34,218 |
$44,160 |
10/24 |
$34,395 |
$33,979 |
$44,014 |
11/24 |
$36,548 |
$36,167 |
$46,868 |
12/24 |
$36,519 |
$35,159 |
$47,282 |
01/25 |
$37,279 |
$36,278 |
$48,217 |
02/25 |
$35,954 |
$35,643 |
$46,485 |
03/25 |
$32,297 |
$33,580 |
$42,569 |
04/25 |
$33,003 |
$33,381 |
$43,323 |
05/25 |
$35,848 |
$35,512 |
$47,156 |
06/25 |
$38,175 |
$37,310 |
$50,163 |
07/25 |
$39,649 |
$38,139 |
$52,057 |
08/25 |
$39,795 |
$38,942 |
$52,639 |
09/25 |
$41,288 |
$40,292 |
$55,435 |
10/25 |
$43,236 |
$41,161 |
$57,449 |
11/25 |
$42,726 |
$41,262 |
$56,407 |
12/25 |
$42,207 |
$41,264 |
$56,058 |
01/26 |
$41,946 |
$41,832 |
$55,210 |
02/26 |
$39,971 |
$41,608 |
$53,356 |
|
| Average Annual Return [Table Text Block] |
|
Table Summary
Average Annual Total Returns (%) |
1 year |
5 years |
10 years |
Institutional Class |
11.17 |
8.14 |
14.86 |
Russell 1000® Index |
16.73 |
13.32 |
15.32 |
Russell 1000® Growth Index |
14.78 |
14.36 |
18.23 | |
| No Deduction of Taxes [Text Block] |
|
Performance does not reflect the deduction of taxes that a shareholder may pay on fund distributions or on the redemptions of fund shares.
|
| Updated Performance Information Location [Text Block] |
|
columbiathreadneedleus.com/investment-products/mutual-funds
|
| AssetsNet |
|
$ 1,209,625,976
|
| Holdings Count | Holding |
|
43
|
| Advisory Fees Paid, Amount |
|
$ 9,139,308
|
| InvestmentCompanyPortfolioTurnover |
|
53.00%
|
| Additional Fund Statistics [Text Block] |
|
Table Summary
Fund net assets |
$1,209,625,976 |
Total number of portfolio holdings |
43 |
Management services fees (represents 0.73% of Fund average net assets) |
$9,139,308 |
Portfolio turnover for the reporting period |
53% | |
| Holdings [Text Block] |
|
Information Technology Sub-Industry Allocation
Table Summary
Semiconductors |
20.6% |
Systems Software |
14.2% |
Technology Hardware, Storage & Peripherals |
6.9% |
Electronic Manufacturing Services |
1.4% |
Communications Equipment |
1.3% |
Other |
0.4% |
Table Summary
Information Technology |
44.8% |
Consumer Discretionary |
14.8% |
Communication Services |
13.5% |
Health Care |
10.2% |
Industrials |
5.9% |
Financials |
5.4% |
Consumer Staples |
3.8% |
Real Estate |
1.1% | |
| Largest Holdings [Text Block] |
|
Table Summary
NVIDIA Corp. |
13.3% |
Microsoft Corp. |
10.4% |
Alphabet, Inc., Class A |
7.6% |
Apple, Inc. |
6.9% |
Amazon.com, Inc. |
6.5% |
Meta Platforms, Inc., Class A |
5.0% |
Broadcom, Inc. |
4.9% |
Eli Lilly & Co. |
4.2% |
Visa, Inc., Class A |
3.1% |
Costco Wholesale Corp. |
2.8% | |
| Material Fund Change [Text Block] |
|
|
| C000030051 |
|
|
| Shareholder Report [Line Items] |
|
|
| Fund Name |
|
Columbia Large Cap Index Fund
|
| Class Name |
|
Class A
|
| Trading Symbol |
|
NEIAX
|
| Annual or Semi-Annual Statement [Text Block] |
|
This annual shareholder report contains important information about Columbia Large Cap Index Fund (the Fund) for the period of March 1, 2025 to February 28, 2026.
|
| Additional Information [Text Block] |
|
You can find additional information about the Fund at columbiathreadneedleus.com/resources/literature. You can also request more information by contacting us at 1-800-345-6611.
|
| Additional Information Phone Number |
|
1-800-345-6611
|
| Additional Information Website |
|
columbiathreadneedleus.com/resources/literature
|
| Expenses [Text Block] |
|
What were the Fund costs for the reporting period? (Based on a hypothetical $10,000 investment)
Table Summary
Class |
Cost of a $10,000 investment |
Cost paid as a percentage of a $10,000 investment |
Class A |
$49 |
0.45% | |
| Expenses Paid, Amount |
|
$ 49
|
| Expense Ratio, Percent |
|
0.45%
|
| Factors Affecting Performance [Text Block] |
|
Management's Discussion of Fund Performance The performance of Class A shares for the period presented is shown in the Average Annual Total Returns table. Top Performance ContributorsSectors | The information technology, communication services and industrials sectors were the top performing sectors for the Fund, on an absolute basis, during the period. Individual holdings | Fund positions in NVIDIA, a developer and provider of AI solutions for various applications; Alphabet, the parent company of Google; Microsoft, a leading developer of computer software, operating systems and applications; Broadcom, a semiconductor company; and JPMorgan Chase, one of the world’s largest diversified banking and financial institutions, were among the top absolute contributors to Fund performance during the period. Top Performance DetractorsSectors | The real estate, financials and materials sectors were the weakest performing sectors on an absolute basis. Individual holdings | Fund positions in UnitedHealth Group, a managed health care and health insurance company; Fiserv, a financial technology and payments processing company; Accenture, a technology consulting company; Salesforce, a cloud-based enterprise software company; and Adobe, a cloud‑based application software and digital experience provider, were among the top absolute detractors from Fund performance during the period. |
| Performance Past Does Not Indicate Future [Text] |
|
The Fund's past performance is not a good predictor of the Fund's future performance.
|
| Line Graph [Table Text Block] |
|

Table Summary
|
Columbia Large Cap Index Fund Class A ($40,388) |
S&P 500® Index ($42,249) |
02/16 |
$10,000 |
$10,000 |
03/16 |
$10,675 |
$10,678 |
04/16 |
$10,713 |
$10,720 |
05/16 |
$10,899 |
$10,912 |
06/16 |
$10,925 |
$10,941 |
07/16 |
$11,322 |
$11,344 |
08/16 |
$11,336 |
$11,360 |
09/16 |
$11,333 |
$11,362 |
10/16 |
$11,119 |
$11,155 |
11/16 |
$11,528 |
$11,568 |
12/16 |
$11,752 |
$11,797 |
01/17 |
$11,969 |
$12,020 |
02/17 |
$12,440 |
$12,498 |
03/17 |
$12,451 |
$12,512 |
04/17 |
$12,573 |
$12,641 |
05/17 |
$12,746 |
$12,818 |
06/17 |
$12,820 |
$12,898 |
07/17 |
$13,078 |
$13,164 |
08/17 |
$13,114 |
$13,204 |
09/17 |
$13,381 |
$13,476 |
10/17 |
$13,687 |
$13,791 |
11/17 |
$14,101 |
$14,214 |
12/17 |
$14,255 |
$14,372 |
01/18 |
$15,066 |
$15,195 |
02/18 |
$14,505 |
$14,635 |
03/18 |
$14,131 |
$14,263 |
04/18 |
$14,180 |
$14,317 |
05/18 |
$14,513 |
$14,662 |
06/18 |
$14,598 |
$14,753 |
07/18 |
$15,136 |
$15,302 |
08/18 |
$15,622 |
$15,800 |
09/18 |
$15,705 |
$15,890 |
10/18 |
$14,624 |
$14,804 |
11/18 |
$14,917 |
$15,106 |
12/18 |
$13,564 |
$13,742 |
01/19 |
$14,646 |
$14,843 |
02/19 |
$15,112 |
$15,320 |
03/19 |
$15,400 |
$15,617 |
04/19 |
$16,017 |
$16,250 |
05/19 |
$14,994 |
$15,217 |
06/19 |
$16,045 |
$16,289 |
07/19 |
$16,269 |
$16,523 |
08/19 |
$16,005 |
$16,262 |
09/19 |
$16,299 |
$16,566 |
10/19 |
$16,645 |
$16,925 |
11/19 |
$17,243 |
$17,539 |
12/19 |
$17,757 |
$18,069 |
01/20 |
$17,743 |
$18,061 |
02/20 |
$16,276 |
$16,575 |
03/20 |
$14,259 |
$14,527 |
04/20 |
$16,082 |
$16,390 |
05/20 |
$16,842 |
$17,170 |
06/20 |
$17,169 |
$17,512 |
07/20 |
$18,130 |
$18,499 |
08/20 |
$19,425 |
$19,829 |
09/20 |
$18,679 |
$19,076 |
10/20 |
$18,173 |
$18,568 |
11/20 |
$20,157 |
$20,601 |
12/20 |
$20,924 |
$21,393 |
01/21 |
$20,704 |
$21,177 |
02/21 |
$21,270 |
$21,761 |
03/21 |
$22,194 |
$22,714 |
04/21 |
$23,367 |
$23,926 |
05/21 |
$23,523 |
$24,093 |
06/21 |
$24,063 |
$24,656 |
07/21 |
$24,626 |
$25,241 |
08/21 |
$25,363 |
$26,009 |
09/21 |
$24,175 |
$24,799 |
10/21 |
$25,860 |
$26,537 |
11/21 |
$25,671 |
$26,353 |
12/21 |
$26,810 |
$27,534 |
01/22 |
$25,410 |
$26,109 |
02/22 |
$24,644 |
$25,327 |
03/22 |
$25,550 |
$26,268 |
04/22 |
$23,315 |
$23,977 |
05/22 |
$23,345 |
$24,021 |
06/22 |
$21,415 |
$22,038 |
07/22 |
$23,379 |
$24,070 |
08/22 |
$22,418 |
$23,089 |
09/22 |
$20,347 |
$20,962 |
10/22 |
$21,999 |
$22,659 |
11/22 |
$23,223 |
$23,926 |
12/22 |
$21,878 |
$22,547 |
01/23 |
$23,241 |
$23,964 |
02/23 |
$22,668 |
$23,379 |
03/23 |
$23,488 |
$24,238 |
04/23 |
$23,849 |
$24,616 |
05/23 |
$23,943 |
$24,723 |
06/23 |
$25,516 |
$26,357 |
07/23 |
$26,327 |
$27,203 |
08/23 |
$25,899 |
$26,770 |
09/23 |
$24,654 |
$25,494 |
10/23 |
$24,123 |
$24,958 |
11/23 |
$26,317 |
$27,237 |
12/23 |
$27,502 |
$28,474 |
01/24 |
$27,954 |
$28,953 |
02/24 |
$29,437 |
$30,499 |
03/24 |
$30,375 |
$31,480 |
04/24 |
$29,119 |
$30,194 |
05/24 |
$30,553 |
$31,692 |
06/24 |
$31,639 |
$32,829 |
07/24 |
$32,010 |
$33,228 |
08/24 |
$32,774 |
$34,034 |
09/24 |
$33,462 |
$34,761 |
10/24 |
$33,145 |
$34,446 |
11/24 |
$35,078 |
$36,468 |
12/24 |
$34,225 |
$35,599 |
01/25 |
$35,166 |
$36,590 |
02/25 |
$34,687 |
$36,113 |
03/25 |
$32,718 |
$34,078 |
04/25 |
$32,484 |
$33,847 |
05/25 |
$34,518 |
$35,977 |
06/25 |
$36,257 |
$37,807 |
07/25 |
$37,057 |
$38,655 |
08/25 |
$37,798 |
$39,439 |
09/25 |
$39,162 |
$40,878 |
10/25 |
$40,060 |
$41,835 |
11/25 |
$40,145 |
$41,938 |
12/25 |
$40,147 |
$41,964 |
01/26 |
$40,712 |
$42,572 |
02/26 |
$40,388 |
$42,249 |
|
| Average Annual Return [Table Text Block] |
|
Table Summary
Average Annual Total Returns (%) |
1 year |
5 years |
10 years |
Class A |
16.43 |
13.68 |
14.98 |
S&P 500® Index |
16.99 |
14.19 |
15.50 | |
| No Deduction of Taxes [Text Block] |
|
Performance does not reflect the deduction of taxes that a shareholder may pay on fund distributions or on the redemptions of fund shares.
|
| Updated Performance Information Location [Text Block] |
|
columbiathreadneedleus.com/investment-products/mutual-funds
|
| AssetsNet |
|
$ 3,017,509,210
|
| Holdings Count | Holding |
|
506
|
| Advisory Fees Paid, Amount |
|
$ 6,165,959
|
| InvestmentCompanyPortfolioTurnover |
|
5.00%
|
| Additional Fund Statistics [Text Block] |
|
Table Summary
Fund net assets |
$3,017,509,210 |
Total number of portfolio holdings |
506 |
Management services fees (represents 0.20% of Fund average net assets) |
$6,165,959 |
Portfolio turnover for the reporting period |
5% | |
| Holdings [Text Block] |
|
Table Summary
Information Technology |
31.9% |
Financials |
12.3% |
Communication Services |
10.4% |
Consumer Discretionary |
9.8% |
Health Care |
9.7% |
Industrials |
9.1% |
Consumer Staples |
5.4% |
Energy |
3.4% |
Utilities |
2.5% |
Materials |
2.1% |
Other |
2.0% |
Table Summary
Common Stocks |
98.6% |
Money Market Funds |
1.3% | |
| Largest Holdings [Text Block] |
|
Table Summary
NVIDIA Corp. |
7.2% |
Apple, Inc. |
6.5% |
Microsoft Corp. |
4.9% |
Amazon.com, Inc. |
3.4% |
Alphabet, Inc., Class A |
3.0% |
Broadcom, Inc. |
2.5% |
Alphabet, Inc., Class C |
2.4% |
Meta Platforms, Inc., Class A |
2.4% |
Tesla, Inc. |
1.9% |
Berkshire Hathaway, Inc., Class B |
1.6% | |
| Material Fund Change [Text Block] |
|
|
| C000122593 |
|
|
| Shareholder Report [Line Items] |
|
|
| Fund Name |
|
Columbia Large Cap Index Fund
|
| Class Name |
|
Institutional 2 Class
|
| Trading Symbol |
|
CLXRX
|
| Annual or Semi-Annual Statement [Text Block] |
|
This annual shareholder report contains important information about Columbia Large Cap Index Fund (the Fund) for the period of March 1, 2025 to February 28, 2026.
|
| Additional Information [Text Block] |
|
You can find additional information about the Fund at columbiathreadneedleus.com/resources/literature. You can also request more information by contacting us at 1-800-345-6611.
|
| Additional Information Phone Number |
|
1-800-345-6611
|
| Additional Information Website |
|
columbiathreadneedleus.com/resources/literature
|
| Expenses [Text Block] |
|
What were the Fund costs for the reporting period? (Based on a hypothetical $10,000 investment)
Table Summary
Class |
Cost of a $10,000 investment |
Cost paid as a percentage of a $10,000 investment |
Institutional 2 Class |
$22 |
0.20% | |
| Expenses Paid, Amount |
|
$ 22
|
| Expense Ratio, Percent |
|
0.20%
|
| Factors Affecting Performance [Text Block] |
|
Management's Discussion of Fund Performance The performance of Institutional 2 Class shares for the period presented is shown in the Average Annual Total Returns table. Top Performance ContributorsSectors | The information technology, communication services and industrials sectors were the top performing sectors for the Fund, on an absolute basis, during the period. Individual holdings | Fund positions in NVIDIA, a developer and provider of AI solutions for various applications; Alphabet, the parent company of Google; Microsoft, a leading developer of computer software, operating systems and applications; Broadcom, a semiconductor company; and JPMorgan Chase, one of the world’s largest diversified banking and financial institutions, were among the top absolute contributors to Fund performance during the period. Top Performance DetractorsSectors | The real estate, financials and materials sectors were the weakest performing sectors on an absolute basis. Individual holdings | Fund positions in UnitedHealth Group, a managed health care and health insurance company; Fiserv, a financial technology and payments processing company; Accenture, a technology consulting company; Salesforce, a cloud-based enterprise software company; and Adobe, a cloud‑based application software and digital experience provider, were among the top absolute detractors from Fund performance during the period. |
| Performance Past Does Not Indicate Future [Text] |
|
The Fund's past performance is not a good predictor of the Fund's future performance.
|
| Line Graph [Table Text Block] |
|

Table Summary
|
Columbia Large Cap Index Fund Institutional 2 Class ($41,416) |
S&P 500® Index ($42,249) |
02/16 |
$10,000 |
$10,000 |
03/16 |
$10,676 |
$10,678 |
04/16 |
$10,716 |
$10,720 |
05/16 |
$10,907 |
$10,912 |
06/16 |
$10,934 |
$10,941 |
07/16 |
$11,336 |
$11,344 |
08/16 |
$11,349 |
$11,360 |
09/16 |
$11,349 |
$11,362 |
10/16 |
$11,139 |
$11,155 |
11/16 |
$11,551 |
$11,568 |
12/16 |
$11,778 |
$11,797 |
01/17 |
$11,998 |
$12,020 |
02/17 |
$12,473 |
$12,498 |
03/17 |
$12,484 |
$12,512 |
04/17 |
$12,611 |
$12,641 |
05/17 |
$12,787 |
$12,818 |
06/17 |
$12,864 |
$12,898 |
07/17 |
$13,127 |
$13,164 |
08/17 |
$13,166 |
$13,204 |
09/17 |
$13,434 |
$13,476 |
10/17 |
$13,746 |
$13,791 |
11/17 |
$14,165 |
$14,214 |
12/17 |
$14,322 |
$14,372 |
01/18 |
$15,139 |
$15,195 |
02/18 |
$14,577 |
$14,635 |
03/18 |
$14,205 |
$14,263 |
04/18 |
$14,256 |
$14,317 |
05/18 |
$14,597 |
$14,662 |
06/18 |
$14,683 |
$14,753 |
07/18 |
$15,229 |
$15,302 |
08/18 |
$15,722 |
$15,800 |
09/18 |
$15,809 |
$15,890 |
10/18 |
$14,724 |
$14,804 |
11/18 |
$15,021 |
$15,106 |
12/18 |
$13,663 |
$13,742 |
01/19 |
$14,754 |
$14,843 |
02/19 |
$15,226 |
$15,320 |
03/19 |
$15,520 |
$15,617 |
04/19 |
$16,147 |
$16,250 |
05/19 |
$15,115 |
$15,217 |
06/19 |
$16,180 |
$16,289 |
07/19 |
$16,408 |
$16,523 |
08/19 |
$16,147 |
$16,262 |
09/19 |
$16,447 |
$16,566 |
10/19 |
$16,799 |
$16,925 |
11/19 |
$17,408 |
$17,539 |
12/19 |
$17,930 |
$18,069 |
01/20 |
$17,919 |
$18,061 |
02/20 |
$16,440 |
$16,575 |
03/20 |
$14,408 |
$14,527 |
04/20 |
$16,253 |
$16,390 |
05/20 |
$17,023 |
$17,170 |
06/20 |
$17,357 |
$17,512 |
07/20 |
$18,334 |
$18,499 |
08/20 |
$19,647 |
$19,829 |
09/20 |
$18,897 |
$19,076 |
10/20 |
$18,390 |
$18,568 |
11/20 |
$20,401 |
$20,601 |
12/20 |
$21,181 |
$21,393 |
01/21 |
$20,961 |
$21,177 |
02/21 |
$21,538 |
$21,761 |
03/21 |
$22,476 |
$22,714 |
04/21 |
$23,672 |
$23,926 |
05/21 |
$23,834 |
$24,093 |
06/21 |
$24,386 |
$24,656 |
07/21 |
$24,961 |
$25,241 |
08/21 |
$25,719 |
$26,009 |
09/21 |
$24,516 |
$24,799 |
10/21 |
$26,229 |
$26,537 |
11/21 |
$26,043 |
$26,353 |
12/21 |
$27,207 |
$27,534 |
01/22 |
$25,793 |
$26,109 |
02/22 |
$25,017 |
$25,327 |
03/22 |
$25,944 |
$26,268 |
04/22 |
$23,676 |
$23,977 |
05/22 |
$23,715 |
$24,021 |
06/22 |
$21,757 |
$22,038 |
07/22 |
$23,760 |
$24,070 |
08/22 |
$22,786 |
$23,089 |
09/22 |
$20,683 |
$20,962 |
10/22 |
$22,373 |
$22,659 |
11/22 |
$23,619 |
$23,926 |
12/22 |
$22,255 |
$22,547 |
01/23 |
$23,651 |
$23,964 |
02/23 |
$23,068 |
$23,379 |
03/23 |
$23,909 |
$24,238 |
04/23 |
$24,279 |
$24,616 |
05/23 |
$24,381 |
$24,723 |
06/23 |
$25,993 |
$26,357 |
07/23 |
$26,821 |
$27,203 |
08/23 |
$26,389 |
$26,770 |
09/23 |
$25,124 |
$25,494 |
10/23 |
$24,592 |
$24,958 |
11/23 |
$26,836 |
$27,237 |
12/23 |
$28,050 |
$28,474 |
01/24 |
$28,517 |
$28,953 |
02/24 |
$30,034 |
$30,499 |
03/24 |
$30,994 |
$31,480 |
04/24 |
$29,721 |
$30,194 |
05/24 |
$31,190 |
$31,692 |
06/24 |
$32,308 |
$32,829 |
07/24 |
$32,694 |
$33,228 |
08/24 |
$33,478 |
$34,034 |
09/24 |
$34,187 |
$34,761 |
10/24 |
$33,870 |
$34,446 |
11/24 |
$35,852 |
$36,468 |
12/24 |
$34,992 |
$35,599 |
01/25 |
$35,957 |
$36,590 |
02/25 |
$35,480 |
$36,113 |
03/25 |
$33,475 |
$34,078 |
04/25 |
$33,239 |
$33,847 |
05/25 |
$35,325 |
$35,977 |
06/25 |
$37,119 |
$37,807 |
07/25 |
$37,940 |
$38,655 |
08/25 |
$38,704 |
$39,439 |
09/25 |
$40,110 |
$40,878 |
10/25 |
$41,040 |
$41,835 |
11/25 |
$41,137 |
$41,938 |
12/25 |
$41,152 |
$41,964 |
01/26 |
$41,739 |
$42,572 |
02/26 |
$41,416 |
$42,249 |
|
| Average Annual Return [Table Text Block] |
|
Table Summary
Average Annual Total Returns (%) |
1 year |
5 years |
10 years |
Institutional 2 Class |
16.73 |
13.97 |
15.27 |
S&P 500® Index |
16.99 |
14.19 |
15.50 | |
| No Deduction of Taxes [Text Block] |
|
Performance does not reflect the deduction of taxes that a shareholder may pay on fund distributions or on the redemptions of fund shares.
|
| Updated Performance Information Location [Text Block] |
|
columbiathreadneedleus.com/investment-products/mutual-funds
|
| AssetsNet |
|
$ 3,017,509,210
|
| Holdings Count | Holding |
|
506
|
| Advisory Fees Paid, Amount |
|
$ 6,165,959
|
| InvestmentCompanyPortfolioTurnover |
|
5.00%
|
| Additional Fund Statistics [Text Block] |
|
Table Summary
Fund net assets |
$3,017,509,210 |
Total number of portfolio holdings |
506 |
Management services fees (represents 0.20% of Fund average net assets) |
$6,165,959 |
Portfolio turnover for the reporting period |
5% | |
| Holdings [Text Block] |
|
Table Summary
Information Technology |
31.9% |
Financials |
12.3% |
Communication Services |
10.4% |
Consumer Discretionary |
9.8% |
Health Care |
9.7% |
Industrials |
9.1% |
Consumer Staples |
5.4% |
Energy |
3.4% |
Utilities |
2.5% |
Materials |
2.1% |
Other |
2.0% |
Table Summary
Common Stocks |
98.6% |
Money Market Funds |
1.3% | |
| Largest Holdings [Text Block] |
|
Table Summary
NVIDIA Corp. |
7.2% |
Apple, Inc. |
6.5% |
Microsoft Corp. |
4.9% |
Amazon.com, Inc. |
3.4% |
Alphabet, Inc., Class A |
3.0% |
Broadcom, Inc. |
2.5% |
Alphabet, Inc., Class C |
2.4% |
Meta Platforms, Inc., Class A |
2.4% |
Tesla, Inc. |
1.9% |
Berkshire Hathaway, Inc., Class B |
1.6% | |
| Material Fund Change [Text Block] |
|
|
| C000173199 |
|
|
| Shareholder Report [Line Items] |
|
|
| Fund Name |
|
Columbia Large Cap Index Fund
|
| Class Name |
|
Institutional 3 Class
|
| Trading Symbol |
|
CLPYX
|
| Annual or Semi-Annual Statement [Text Block] |
|
This annual shareholder report contains important information about Columbia Large Cap Index Fund (the Fund) for the period of March 1, 2025 to February 28, 2026.
|
| Additional Information [Text Block] |
|
You can find additional information about the Fund at columbiathreadneedleus.com/resources/literature. You can also request more information by contacting us at 1-800-345-6611.
|
| Additional Information Phone Number |
|
1-800-345-6611
|
| Additional Information Website |
|
columbiathreadneedleus.com/resources/literature
|
| Expenses [Text Block] |
|
What were the Fund costs for the reporting period? (Based on a hypothetical $10,000 investment)
Table Summary
Class |
Cost of a $10,000 investment |
Cost paid as a percentage of a $10,000 investment |
Institutional 3 Class |
$22 |
0.20% | |
| Expenses Paid, Amount |
|
$ 22
|
| Expense Ratio, Percent |
|
0.20%
|
| Factors Affecting Performance [Text Block] |
|
Management's Discussion of Fund Performance The performance of Institutional 3 Class shares for the period presented is shown in the Average Annual Total Returns table. Top Performance ContributorsSectors | The information technology, communication services and industrials sectors were the top performing sectors for the Fund, on an absolute basis, during the period. Individual holdings | Fund positions in NVIDIA, a developer and provider of AI solutions for various applications; Alphabet, the parent company of Google; Microsoft, a leading developer of computer software, operating systems and applications; Broadcom, a semiconductor company; and JPMorgan Chase, one of the world’s largest diversified banking and financial institutions, were among the top absolute contributors to Fund performance during the period. Top Performance DetractorsSectors | The real estate, financials and materials sectors were the weakest performing sectors on an absolute basis. Individual holdings | Fund positions in UnitedHealth Group, a managed health care and health insurance company; Fiserv, a financial technology and payments processing company; Accenture, a technology consulting company; Salesforce, a cloud-based enterprise software company; and Adobe, a cloud‑based application software and digital experience provider, were among the top absolute detractors from Fund performance during the period. |
| Performance Past Does Not Indicate Future [Text] |
|
The Fund's past performance is not a good predictor of the Fund's future performance.
|
| Line Graph [Table Text Block] |
|

Table Summary
|
Columbia Large Cap Index Fund Institutional 3 Class ($41,424) |
S&P 500® Index ($42,249) |
02/16 |
$10,000 |
$10,000 |
03/16 |
$10,677 |
$10,678 |
04/16 |
$10,717 |
$10,720 |
05/16 |
$10,908 |
$10,912 |
06/16 |
$10,933 |
$10,941 |
07/16 |
$11,337 |
$11,344 |
08/16 |
$11,350 |
$11,360 |
09/16 |
$11,350 |
$11,362 |
10/16 |
$11,140 |
$11,155 |
11/16 |
$11,550 |
$11,568 |
12/16 |
$11,777 |
$11,797 |
01/17 |
$11,997 |
$12,020 |
02/17 |
$12,472 |
$12,498 |
03/17 |
$12,487 |
$12,512 |
04/17 |
$12,612 |
$12,641 |
05/17 |
$12,788 |
$12,818 |
06/17 |
$12,867 |
$12,898 |
07/17 |
$13,129 |
$13,164 |
08/17 |
$13,168 |
$13,204 |
09/17 |
$13,438 |
$13,476 |
10/17 |
$13,748 |
$13,791 |
11/17 |
$14,167 |
$14,214 |
12/17 |
$14,322 |
$14,372 |
01/18 |
$15,143 |
$15,195 |
02/18 |
$14,579 |
$14,635 |
03/18 |
$14,209 |
$14,263 |
04/18 |
$14,258 |
$14,317 |
05/18 |
$14,600 |
$14,662 |
06/18 |
$14,688 |
$14,753 |
07/18 |
$15,232 |
$15,302 |
08/18 |
$15,725 |
$15,800 |
09/18 |
$15,812 |
$15,890 |
10/18 |
$14,727 |
$14,804 |
11/18 |
$15,025 |
$15,106 |
12/18 |
$13,665 |
$13,742 |
01/19 |
$14,758 |
$14,843 |
02/19 |
$15,229 |
$15,320 |
03/19 |
$15,526 |
$15,617 |
04/19 |
$16,150 |
$16,250 |
05/19 |
$15,121 |
$15,217 |
06/19 |
$16,184 |
$16,289 |
07/19 |
$16,416 |
$16,523 |
08/19 |
$16,154 |
$16,262 |
09/19 |
$16,453 |
$16,566 |
10/19 |
$16,807 |
$16,925 |
11/19 |
$17,415 |
$17,539 |
12/19 |
$17,935 |
$18,069 |
01/20 |
$17,928 |
$18,061 |
02/20 |
$16,446 |
$16,575 |
03/20 |
$14,411 |
$14,527 |
04/20 |
$16,256 |
$16,390 |
05/20 |
$17,028 |
$17,170 |
06/20 |
$17,363 |
$17,512 |
07/20 |
$18,339 |
$18,499 |
08/20 |
$19,655 |
$19,829 |
09/20 |
$18,903 |
$19,076 |
10/20 |
$18,397 |
$18,568 |
11/20 |
$20,407 |
$20,601 |
12/20 |
$21,186 |
$21,393 |
01/21 |
$20,969 |
$21,177 |
02/21 |
$21,545 |
$21,761 |
03/21 |
$22,484 |
$22,714 |
04/21 |
$23,682 |
$23,926 |
05/21 |
$23,842 |
$24,093 |
06/21 |
$24,397 |
$24,656 |
07/21 |
$24,970 |
$25,241 |
08/21 |
$25,726 |
$26,009 |
09/21 |
$24,523 |
$24,799 |
10/21 |
$26,240 |
$26,537 |
11/21 |
$26,050 |
$26,353 |
12/21 |
$27,217 |
$27,534 |
01/22 |
$25,803 |
$26,109 |
02/22 |
$25,029 |
$25,327 |
03/22 |
$25,952 |
$26,268 |
04/22 |
$23,687 |
$23,977 |
05/22 |
$23,723 |
$24,021 |
06/22 |
$21,765 |
$22,038 |
07/22 |
$23,766 |
$24,070 |
08/22 |
$22,794 |
$23,089 |
09/22 |
$20,688 |
$20,962 |
10/22 |
$22,376 |
$22,659 |
11/22 |
$23,623 |
$23,926 |
12/22 |
$22,257 |
$22,547 |
01/23 |
$23,657 |
$23,964 |
02/23 |
$23,075 |
$23,379 |
03/23 |
$23,917 |
$24,238 |
04/23 |
$24,285 |
$24,616 |
05/23 |
$24,387 |
$24,723 |
06/23 |
$25,998 |
$26,357 |
07/23 |
$26,827 |
$27,203 |
08/23 |
$26,394 |
$26,770 |
09/23 |
$25,132 |
$25,494 |
10/23 |
$24,599 |
$24,958 |
11/23 |
$26,843 |
$27,237 |
12/23 |
$28,057 |
$28,474 |
01/24 |
$28,521 |
$28,953 |
02/24 |
$30,043 |
$30,499 |
03/24 |
$30,999 |
$31,480 |
04/24 |
$29,729 |
$30,194 |
05/24 |
$31,201 |
$31,692 |
06/24 |
$32,312 |
$32,829 |
07/24 |
$32,698 |
$33,228 |
08/24 |
$33,492 |
$34,034 |
09/24 |
$34,200 |
$34,761 |
10/24 |
$33,883 |
$34,446 |
11/24 |
$35,867 |
$36,468 |
12/24 |
$34,998 |
$35,599 |
01/25 |
$35,967 |
$36,590 |
02/25 |
$35,492 |
$36,113 |
03/25 |
$33,482 |
$34,078 |
04/25 |
$33,245 |
$33,847 |
05/25 |
$35,333 |
$35,977 |
06/25 |
$37,125 |
$37,807 |
07/25 |
$37,947 |
$38,655 |
08/25 |
$38,714 |
$39,439 |
09/25 |
$40,118 |
$40,878 |
10/25 |
$41,050 |
$41,835 |
11/25 |
$41,146 |
$41,938 |
12/25 |
$41,155 |
$41,964 |
01/26 |
$41,748 |
$42,572 |
02/26 |
$41,424 |
$42,249 |
|
| Average Annual Return [Table Text Block] |
|
Table Summary
Average Annual Total Returns (%) |
1 year |
5 years |
10 years |
Institutional 3 ClassFootnote Reference(a) |
16.71 |
13.97 |
15.27 |
S&P 500® Index |
16.99 |
14.19 |
15.50 | |
| No Deduction of Taxes [Text Block] |
|
Performance does not reflect the deduction of taxes that a shareholder may pay on fund distributions or on the redemptions of fund shares.
|
| Updated Performance Information Location [Text Block] |
|
columbiathreadneedleus.com/investment-products/mutual-funds
|
| AssetsNet |
|
$ 3,017,509,210
|
| Holdings Count | Holding |
|
506
|
| Advisory Fees Paid, Amount |
|
$ 6,165,959
|
| InvestmentCompanyPortfolioTurnover |
|
5.00%
|
| Additional Fund Statistics [Text Block] |
|
Table Summary
Fund net assets |
$3,017,509,210 |
Total number of portfolio holdings |
506 |
Management services fees (represents 0.20% of Fund average net assets) |
$6,165,959 |
Portfolio turnover for the reporting period |
5% | |
| Holdings [Text Block] |
|
Table Summary
Information Technology |
31.9% |
Financials |
12.3% |
Communication Services |
10.4% |
Consumer Discretionary |
9.8% |
Health Care |
9.7% |
Industrials |
9.1% |
Consumer Staples |
5.4% |
Energy |
3.4% |
Utilities |
2.5% |
Materials |
2.1% |
Other |
2.0% |
Table Summary
Common Stocks |
98.6% |
Money Market Funds |
1.3% | |
| Largest Holdings [Text Block] |
|
Table Summary
NVIDIA Corp. |
7.2% |
Apple, Inc. |
6.5% |
Microsoft Corp. |
4.9% |
Amazon.com, Inc. |
3.4% |
Alphabet, Inc., Class A |
3.0% |
Broadcom, Inc. |
2.5% |
Alphabet, Inc., Class C |
2.4% |
Meta Platforms, Inc., Class A |
2.4% |
Tesla, Inc. |
1.9% |
Berkshire Hathaway, Inc., Class B |
1.6% | |
| Material Fund Change [Text Block] |
|
|
| C000030053 |
|
|
| Shareholder Report [Line Items] |
|
|
| Fund Name |
|
Columbia Large Cap Index Fund
|
| Class Name |
|
Institutional Class
|
| Trading Symbol |
|
NINDX
|
| Annual or Semi-Annual Statement [Text Block] |
|
This annual shareholder report contains important information about Columbia Large Cap Index Fund (the Fund) for the period of March 1, 2025 to February 28, 2026.
|
| Additional Information [Text Block] |
|
You can find additional information about the Fund at columbiathreadneedleus.com/resources/literature. You can also request more information by contacting us at 1-800-345-6611.
|
| Additional Information Phone Number |
|
1-800-345-6611
|
| Additional Information Website |
|
columbiathreadneedleus.com/resources/literature
|
| Expenses [Text Block] |
|
What were the Fund costs for the reporting period? (Based on a hypothetical $10,000 investment)
Table Summary
Class |
Cost of a $10,000 investment |
Cost paid as a percentage of a $10,000 investment |
Institutional Class |
$22 |
0.20% | |
| Expenses Paid, Amount |
|
$ 22
|
| Expense Ratio, Percent |
|
0.20%
|
| Factors Affecting Performance [Text Block] |
|
Management's Discussion of Fund Performance The performance of Institutional Class shares for the period presented is shown in the Average Annual Total Returns table. Top Performance ContributorsSectors | The information technology, communication services and industrials sectors were the top performing sectors for the Fund, on an absolute basis, during the period. Individual holdings | Fund positions in NVIDIA, a developer and provider of AI solutions for various applications; Alphabet, the parent company of Google; Microsoft, a leading developer of computer software, operating systems and applications; Broadcom, a semiconductor company; and JPMorgan Chase, one of the world’s largest diversified banking and financial institutions, were among the top absolute contributors to Fund performance during the period. Top Performance DetractorsSectors | The real estate, financials and materials sectors were the weakest performing sectors on an absolute basis. Individual holdings | Fund positions in UnitedHealth Group, a managed health care and health insurance company; Fiserv, a financial technology and payments processing company; Accenture, a technology consulting company; Salesforce, a cloud-based enterprise software company; and Adobe, a cloud‑based application software and digital experience provider, were among the top absolute detractors from Fund performance during the period. |
| Performance Past Does Not Indicate Future [Text] |
|
The Fund's past performance is not a good predictor of the Fund's future performance.
|
| Line Graph [Table Text Block] |
|
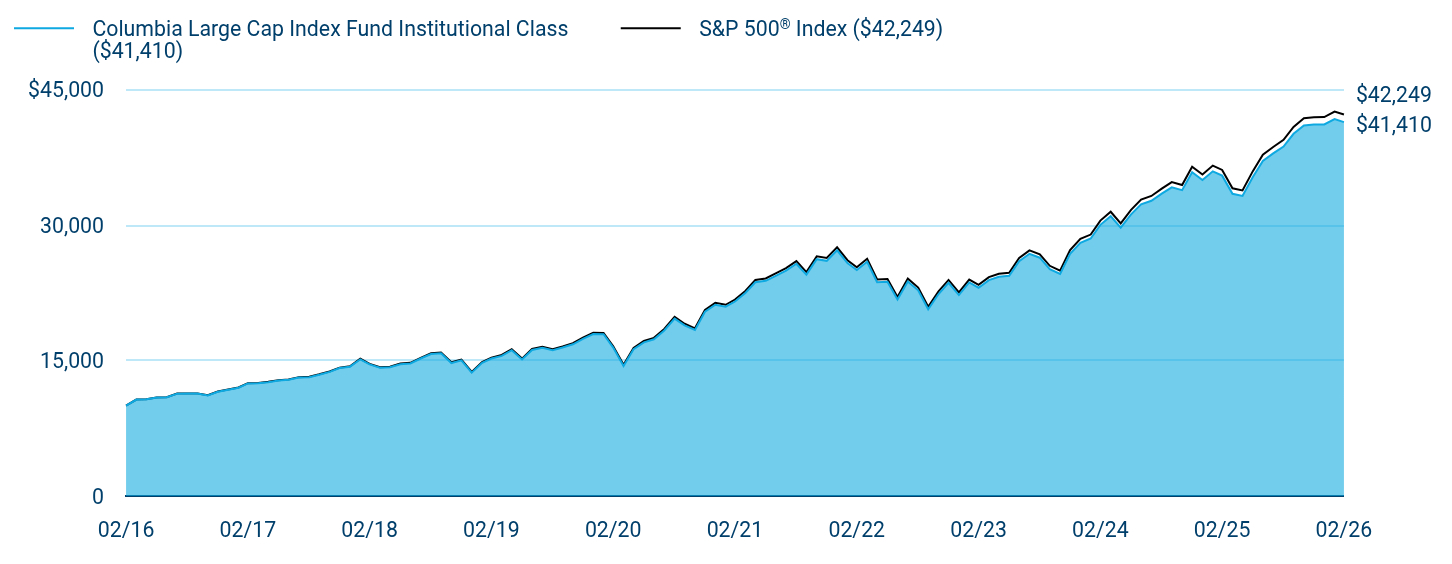
Table Summary
|
Columbia Large Cap Index Fund Institutional Class ($41,410) |
S&P 500® Index ($42,249) |
02/16 |
$10,000 |
$10,000 |
03/16 |
$10,677 |
$10,678 |
04/16 |
$10,717 |
$10,720 |
05/16 |
$10,908 |
$10,912 |
06/16 |
$10,933 |
$10,941 |
07/16 |
$11,337 |
$11,344 |
08/16 |
$11,350 |
$11,360 |
09/16 |
$11,350 |
$11,362 |
10/16 |
$11,140 |
$11,155 |
11/16 |
$11,550 |
$11,568 |
12/16 |
$11,777 |
$11,797 |
01/17 |
$11,997 |
$12,020 |
02/17 |
$12,472 |
$12,498 |
03/17 |
$12,483 |
$12,512 |
04/17 |
$12,610 |
$12,641 |
05/17 |
$12,786 |
$12,818 |
06/17 |
$12,864 |
$12,898 |
07/17 |
$13,127 |
$13,164 |
08/17 |
$13,163 |
$13,204 |
09/17 |
$13,435 |
$13,476 |
10/17 |
$13,746 |
$13,791 |
11/17 |
$14,165 |
$14,214 |
12/17 |
$14,321 |
$14,372 |
01/18 |
$15,138 |
$15,195 |
02/18 |
$14,577 |
$14,635 |
03/18 |
$14,203 |
$14,263 |
04/18 |
$14,255 |
$14,317 |
05/18 |
$14,597 |
$14,662 |
06/18 |
$14,684 |
$14,753 |
07/18 |
$15,229 |
$15,302 |
08/18 |
$15,720 |
$15,800 |
09/18 |
$15,809 |
$15,890 |
10/18 |
$14,723 |
$14,804 |
11/18 |
$15,022 |
$15,106 |
12/18 |
$13,662 |
$13,742 |
01/19 |
$14,753 |
$14,843 |
02/19 |
$15,227 |
$15,320 |
03/19 |
$15,518 |
$15,617 |
04/19 |
$16,145 |
$16,250 |
05/19 |
$15,117 |
$15,217 |
06/19 |
$16,179 |
$16,289 |
07/19 |
$16,410 |
$16,523 |
08/19 |
$16,146 |
$16,262 |
09/19 |
$16,447 |
$16,566 |
10/19 |
$16,801 |
$16,925 |
11/19 |
$17,406 |
$17,539 |
12/19 |
$17,930 |
$18,069 |
01/20 |
$17,919 |
$18,061 |
02/20 |
$16,440 |
$16,575 |
03/20 |
$14,406 |
$14,527 |
04/20 |
$16,253 |
$16,390 |
05/20 |
$17,022 |
$17,170 |
06/20 |
$17,358 |
$17,512 |
07/20 |
$18,334 |
$18,499 |
08/20 |
$19,648 |
$19,829 |
09/20 |
$18,895 |
$19,076 |
10/20 |
$18,388 |
$18,568 |
11/20 |
$20,400 |
$20,601 |
12/20 |
$21,180 |
$21,393 |
01/21 |
$20,963 |
$21,177 |
02/21 |
$21,540 |
$21,761 |
03/21 |
$22,476 |
$22,714 |
04/21 |
$23,674 |
$23,926 |
05/21 |
$23,835 |
$24,093 |
06/21 |
$24,386 |
$24,656 |
07/21 |
$24,960 |
$25,241 |
08/21 |
$25,717 |
$26,009 |
09/21 |
$24,514 |
$24,799 |
10/21 |
$26,229 |
$26,537 |
11/21 |
$26,043 |
$26,353 |
12/21 |
$27,206 |
$27,534 |
01/22 |
$25,792 |
$26,109 |
02/22 |
$25,018 |
$25,327 |
03/22 |
$25,942 |
$26,268 |
04/22 |
$23,675 |
$23,977 |
05/22 |
$23,714 |
$24,021 |
06/22 |
$21,755 |
$22,038 |
07/22 |
$23,761 |
$24,070 |
08/22 |
$22,783 |
$23,089 |
09/22 |
$20,685 |
$20,962 |
10/22 |
$22,371 |
$22,659 |
11/22 |
$23,617 |
$23,926 |
12/22 |
$22,255 |
$22,547 |
01/23 |
$23,650 |
$23,964 |
02/23 |
$23,067 |
$23,379 |
03/23 |
$23,909 |
$24,238 |
04/23 |
$24,277 |
$24,616 |
05/23 |
$24,382 |
$24,723 |
06/23 |
$25,993 |
$26,357 |
07/23 |
$26,821 |
$27,203 |
08/23 |
$26,389 |
$26,770 |
09/23 |
$25,123 |
$25,494 |
10/23 |
$24,593 |
$24,958 |
11/23 |
$26,831 |
$27,237 |
12/23 |
$28,049 |
$28,474 |
01/24 |
$28,512 |
$28,953 |
02/24 |
$30,030 |
$30,499 |
03/24 |
$30,994 |
$31,480 |
04/24 |
$29,720 |
$30,194 |
05/24 |
$31,190 |
$31,692 |
06/24 |
$32,304 |
$32,829 |
07/24 |
$32,690 |
$33,228 |
08/24 |
$33,478 |
$34,034 |
09/24 |
$34,189 |
$34,761 |
10/24 |
$33,869 |
$34,446 |
11/24 |
$35,854 |
$36,468 |
12/24 |
$34,993 |
$35,599 |
01/25 |
$35,956 |
$36,590 |
02/25 |
$35,478 |
$36,113 |
03/25 |
$33,469 |
$34,078 |
04/25 |
$33,238 |
$33,847 |
05/25 |
$35,324 |
$35,977 |
06/25 |
$37,115 |
$37,807 |
07/25 |
$37,943 |
$38,655 |
08/25 |
$38,705 |
$39,439 |
09/25 |
$40,109 |
$40,878 |
10/25 |
$41,043 |
$41,835 |
11/25 |
$41,135 |
$41,938 |
12/25 |
$41,151 |
$41,964 |
01/26 |
$41,737 |
$42,572 |
02/26 |
$41,410 |
$42,249 |
|
| Average Annual Return [Table Text Block] |
|
Table Summary
Average Annual Total Returns (%) |
1 year |
5 years |
10 years |
Institutional Class |
16.72 |
13.97 |
15.27 |
S&P 500® Index |
16.99 |
14.19 |
15.50 | |
| No Deduction of Taxes [Text Block] |
|
Performance does not reflect the deduction of taxes that a shareholder may pay on fund distributions or on the redemptions of fund shares.
|
| Updated Performance Information Location [Text Block] |
|
columbiathreadneedleus.com/investment-products/mutual-funds
|
| AssetsNet |
|
$ 3,017,509,210
|
| Holdings Count | Holding |
|
506
|
| Advisory Fees Paid, Amount |
|
$ 6,165,959
|
| InvestmentCompanyPortfolioTurnover |
|
5.00%
|
| Additional Fund Statistics [Text Block] |
|
Table Summary
Fund net assets |
$3,017,509,210 |
Total number of portfolio holdings |
506 |
Management services fees (represents 0.20% of Fund average net assets) |
$6,165,959 |
Portfolio turnover for the reporting period |
5% | |
| Holdings [Text Block] |
|
Table Summary
Information Technology |
31.9% |
Financials |
12.3% |
Communication Services |
10.4% |
Consumer Discretionary |
9.8% |
Health Care |
9.7% |
Industrials |
9.1% |
Consumer Staples |
5.4% |
Energy |
3.4% |
Utilities |
2.5% |
Materials |
2.1% |
Other |
2.0% |
Table Summary
Common Stocks |
98.6% |
Money Market Funds |
1.3% | |
| Largest Holdings [Text Block] |
|
Table Summary
NVIDIA Corp. |
7.2% |
Apple, Inc. |
6.5% |
Microsoft Corp. |
4.9% |
Amazon.com, Inc. |
3.4% |
Alphabet, Inc., Class A |
3.0% |
Broadcom, Inc. |
2.5% |
Alphabet, Inc., Class C |
2.4% |
Meta Platforms, Inc., Class A |
2.4% |
Tesla, Inc. |
1.9% |
Berkshire Hathaway, Inc., Class B |
1.6% | |
| Material Fund Change [Text Block] |
|
|
| C000030054 |
|
|
| Shareholder Report [Line Items] |
|
|
| Fund Name |
|
Columbia Mid Cap Index Fund
|
| Class Name |
|
Class A
|
| Trading Symbol |
|
NTIAX
|
| Annual or Semi-Annual Statement [Text Block] |
|
This annual shareholder report contains important information about Columbia Mid Cap Index Fund (the Fund) for the period of March 1, 2025 to February 28, 2026.
|
| Additional Information [Text Block] |
|
You can find additional information about the Fund at columbiathreadneedleus.com/resources/literature. You can also request more information by contacting us at 1-800-345-6611.
|
| Additional Information Phone Number |
|
1-800-345-6611
|
| Additional Information Website |
|
columbiathreadneedleus.com/resources/literature
|
| Expenses [Text Block] |
|
What were the Fund costs for the reporting period? (Based on a hypothetical $10,000 investment)
Table Summary
Class |
Cost of a $10,000 investment |
Cost paid as a percentage of a $10,000 investment |
Class A |
$49 |
0.45% | |
| Expenses Paid, Amount |
|
$ 49
|
| Expense Ratio, Percent |
|
0.45%
|
| Factors Affecting Performance [Text Block] |
|
Management's Discussion of Fund Performance The performance of Class A shares for the period presented is shown in the Average Annual Total Returns table. Top Performance ContributorsSectors | The information technology, communication services and industrials sectors were the top performing sectors for the Fund, on an absolute basis, during the period. Individual holdings | Fund positions in Lumentum, an optical and photonics components manufacturer; Coherent Corp., a photonics, lasers, and advanced materials technology manufacturer; Ciena Corporation, an optical networking equipment and software company; Comfort Systems USA, a mechanical and electrical contracting services company; and Curtiss-Wright, an aerospace, defense, and industrial technology manufacturer, were among the top absolute contributors to Fund performance during the period. Top Performance DetractorsSectors | The real estate, financials and materials sectors were the weakest performing sectors for the Fund, on an absolute basis, during the period. Individual holdings | Fund positions in Berry Global, a global packaging and materials manufacturing company; Sarepta, a biotechnology company focused on rare diseases; Nutanix, an enterprise cloud infrastructure software company; Duolingo, an education technology software company; and Pinnacle Financial, a regional commercial bank and financial services firm, were among the top absolute detractors from Fund performance during the period. |
| Performance Past Does Not Indicate Future [Text] |
|
The Fund's past performance is not a good predictor of the Fund's future performance.
|
| Line Graph [Table Text Block] |
|
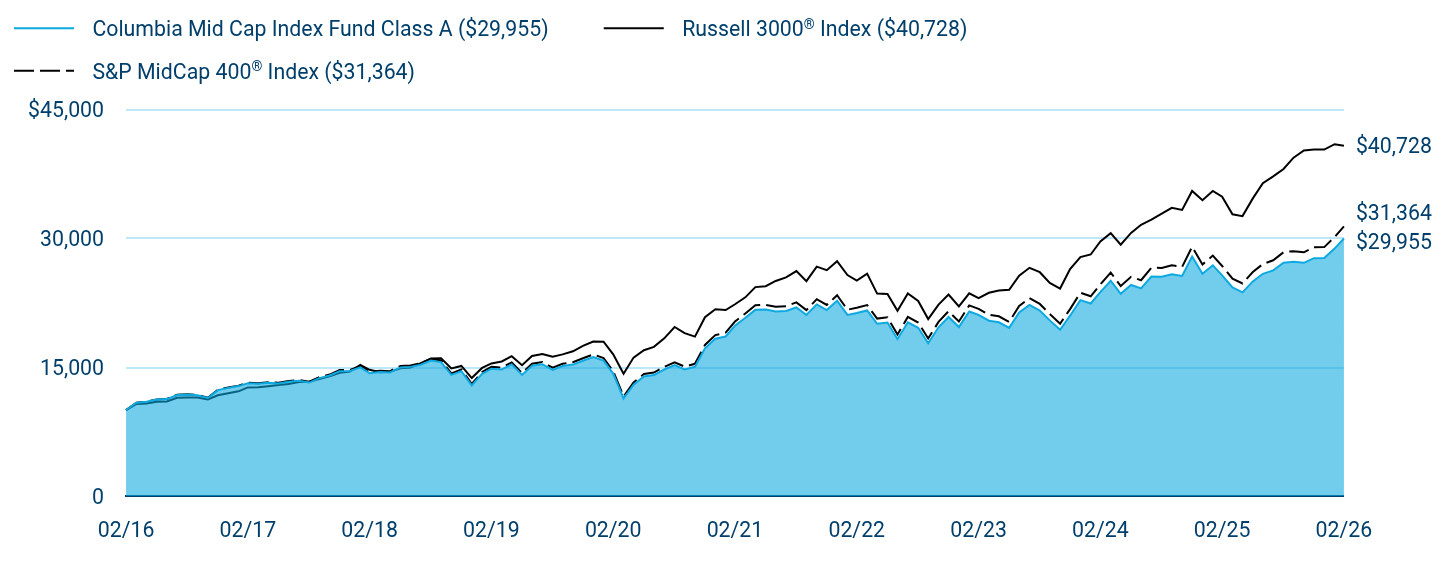
Table Summary
|
Columbia Mid Cap Index Fund Class A ($29,955) |
Russell 3000® Index ($40,728) |
S&P MidCap 400® Index ($31,364) |
02/16 |
$10,000 |
$10,000 |
$10,000 |
03/16 |
$10,847 |
$10,704 |
$10,852 |
04/16 |
$10,975 |
$10,770 |
$10,984 |
05/16 |
$11,224 |
$10,963 |
$11,238 |
06/16 |
$11,271 |
$10,986 |
$11,285 |
07/16 |
$11,746 |
$11,422 |
$11,769 |
08/16 |
$11,799 |
$11,451 |
$11,828 |
09/16 |
$11,723 |
$11,469 |
$11,753 |
10/16 |
$11,401 |
$11,221 |
$11,438 |
11/16 |
$12,313 |
$11,723 |
$12,354 |
12/16 |
$12,579 |
$11,952 |
$12,624 |
01/17 |
$12,783 |
$12,176 |
$12,836 |
02/17 |
$13,110 |
$12,629 |
$13,173 |
03/17 |
$13,052 |
$12,638 |
$13,122 |
04/17 |
$13,159 |
$12,772 |
$13,231 |
05/17 |
$13,085 |
$12,903 |
$13,167 |
06/17 |
$13,296 |
$13,019 |
$13,380 |
07/17 |
$13,404 |
$13,264 |
$13,498 |
08/17 |
$13,197 |
$13,290 |
$13,291 |
09/17 |
$13,709 |
$13,614 |
$13,811 |
10/17 |
$14,014 |
$13,911 |
$14,124 |
11/17 |
$14,525 |
$14,334 |
$14,643 |
12/17 |
$14,552 |
$14,477 |
$14,675 |
01/18 |
$14,965 |
$15,240 |
$15,097 |
02/18 |
$14,288 |
$14,678 |
$14,428 |
03/18 |
$14,420 |
$14,384 |
$14,562 |
04/18 |
$14,376 |
$14,438 |
$14,524 |
05/18 |
$14,957 |
$14,846 |
$15,123 |
06/18 |
$15,019 |
$14,943 |
$15,187 |
07/18 |
$15,275 |
$15,439 |
$15,455 |
08/18 |
$15,763 |
$15,981 |
$15,948 |
09/18 |
$15,577 |
$16,008 |
$15,774 |
10/18 |
$14,088 |
$14,829 |
$14,268 |
11/18 |
$14,522 |
$15,126 |
$14,713 |
12/18 |
$12,868 |
$13,718 |
$13,048 |
01/19 |
$14,208 |
$14,896 |
$14,413 |
02/19 |
$14,811 |
$15,419 |
$15,024 |
03/19 |
$14,725 |
$15,645 |
$14,939 |
04/19 |
$15,309 |
$16,269 |
$15,540 |
05/19 |
$14,084 |
$15,216 |
$14,301 |
06/19 |
$15,156 |
$16,285 |
$15,394 |
07/19 |
$15,331 |
$16,527 |
$15,577 |
08/19 |
$14,677 |
$16,190 |
$14,923 |
09/19 |
$15,126 |
$16,475 |
$15,381 |
10/19 |
$15,283 |
$16,829 |
$15,554 |
11/19 |
$15,732 |
$17,469 |
$16,017 |
12/19 |
$16,170 |
$17,973 |
$16,467 |
01/20 |
$15,745 |
$17,954 |
$16,037 |
02/20 |
$14,237 |
$16,484 |
$14,515 |
03/20 |
$11,343 |
$14,217 |
$11,576 |
04/20 |
$12,952 |
$16,100 |
$13,218 |
05/20 |
$13,893 |
$16,961 |
$14,185 |
06/20 |
$14,068 |
$17,349 |
$14,363 |
07/20 |
$14,713 |
$18,334 |
$15,025 |
08/20 |
$15,220 |
$19,662 |
$15,553 |
09/20 |
$14,723 |
$18,946 |
$15,048 |
10/20 |
$15,030 |
$18,537 |
$15,375 |
11/20 |
$17,176 |
$20,792 |
$17,570 |
12/20 |
$18,287 |
$21,728 |
$18,716 |
01/21 |
$18,556 |
$21,631 |
$18,998 |
02/21 |
$19,808 |
$22,307 |
$20,290 |
03/21 |
$20,724 |
$23,107 |
$21,237 |
04/21 |
$21,652 |
$24,298 |
$22,194 |
05/21 |
$21,686 |
$24,409 |
$22,237 |
06/21 |
$21,452 |
$25,010 |
$22,009 |
07/21 |
$21,523 |
$25,433 |
$22,085 |
08/21 |
$21,933 |
$26,159 |
$22,516 |
09/21 |
$21,053 |
$24,985 |
$21,622 |
10/21 |
$22,285 |
$26,675 |
$22,894 |
11/21 |
$21,628 |
$26,269 |
$22,222 |
12/21 |
$22,714 |
$27,303 |
$23,350 |
01/22 |
$21,064 |
$25,697 |
$21,667 |
02/22 |
$21,288 |
$25,049 |
$21,908 |
03/22 |
$21,579 |
$25,862 |
$22,212 |
04/22 |
$20,034 |
$23,541 |
$20,633 |
05/22 |
$20,180 |
$23,509 |
$20,787 |
06/22 |
$18,242 |
$21,543 |
$18,788 |
07/22 |
$20,210 |
$23,564 |
$20,826 |
08/22 |
$19,568 |
$22,684 |
$20,180 |
09/22 |
$17,767 |
$20,581 |
$18,325 |
10/22 |
$19,624 |
$22,269 |
$20,252 |
11/22 |
$20,824 |
$23,431 |
$21,491 |
12/22 |
$19,649 |
$22,059 |
$20,301 |
01/23 |
$21,463 |
$23,578 |
$22,174 |
02/23 |
$21,065 |
$23,027 |
$21,772 |
03/23 |
$20,386 |
$23,643 |
$21,074 |
04/23 |
$20,210 |
$23,895 |
$20,908 |
05/23 |
$19,561 |
$23,988 |
$20,242 |
06/23 |
$21,338 |
$25,626 |
$22,096 |
07/23 |
$22,220 |
$26,544 |
$23,007 |
08/23 |
$21,566 |
$26,032 |
$22,342 |
09/23 |
$20,426 |
$24,792 |
$21,167 |
10/23 |
$19,331 |
$24,135 |
$20,038 |
11/23 |
$20,973 |
$26,385 |
$21,742 |
12/23 |
$22,788 |
$27,785 |
$23,638 |
01/24 |
$22,389 |
$28,093 |
$23,233 |
02/24 |
$23,714 |
$29,613 |
$24,613 |
03/24 |
$25,038 |
$30,569 |
$25,990 |
04/24 |
$23,522 |
$29,224 |
$24,426 |
05/24 |
$24,544 |
$30,604 |
$25,498 |
06/24 |
$24,150 |
$31,552 |
$25,095 |
07/24 |
$25,533 |
$32,138 |
$26,552 |
08/24 |
$25,516 |
$32,838 |
$26,531 |
09/24 |
$25,796 |
$33,517 |
$26,838 |
10/24 |
$25,598 |
$33,271 |
$26,648 |
11/24 |
$27,854 |
$35,484 |
$28,996 |
12/24 |
$25,843 |
$34,400 |
$26,930 |
01/25 |
$26,833 |
$35,486 |
$27,967 |
02/25 |
$25,666 |
$34,806 |
$26,751 |
03/25 |
$24,252 |
$32,775 |
$25,287 |
04/25 |
$23,686 |
$32,556 |
$24,718 |
05/25 |
$24,959 |
$34,619 |
$26,052 |
06/25 |
$25,849 |
$36,378 |
$26,984 |
07/25 |
$26,249 |
$37,179 |
$27,421 |
08/25 |
$27,139 |
$38,039 |
$28,352 |
09/25 |
$27,248 |
$39,352 |
$28,482 |
10/25 |
$27,121 |
$40,196 |
$28,349 |
11/25 |
$27,666 |
$40,306 |
$28,929 |
12/25 |
$27,676 |
$40,298 |
$28,950 |
01/26 |
$28,777 |
$40,923 |
$30,123 |
02/26 |
$29,955 |
$40,728 |
$31,364 |
|
| Average Annual Return [Table Text Block] |
|
Table Summary
Average Annual Total Returns (%) |
1 year |
5 years |
10 years |
Class A |
16.71 |
8.62 |
11.60 |
Russell 3000® Index |
17.02 |
12.80 |
15.08 |
S&P MidCap 400® Index |
17.24 |
9.10 |
12.11 | |
| No Deduction of Taxes [Text Block] |
|
Performance does not reflect the deduction of taxes that a shareholder may pay on fund distributions or on the redemptions of fund shares.
|
| Updated Performance Information Location [Text Block] |
|
columbiathreadneedleus.com/investment-products/mutual-funds
|
| AssetsNet |
|
$ 2,578,939,466
|
| Holdings Count | Holding |
|
402
|
| Advisory Fees Paid, Amount |
|
$ 4,949,801
|
| InvestmentCompanyPortfolioTurnover |
|
16.00%
|
| Additional Fund Statistics [Text Block] |
|
Table Summary
Fund net assets |
$2,578,939,466 |
Total number of portfolio holdings |
402 |
Management services fees (represents 0.20% of Fund average net assets) |
$4,949,801 |
Portfolio turnover for the reporting period |
16% | |
| Holdings [Text Block] |
|
Table Summary
Industrials |
25.2% |
Financials |
14.3% |
Information Technology |
13.9% |
Consumer Discretionary |
11.0% |
Health Care |
8.5% |
Real Estate |
6.5% |
Materials |
5.7% |
Energy |
4.5% |
Consumer Staples |
4.4% |
Utilities |
3.2% |
Other |
1.5% |
Table Summary
Common Stocks |
98.7% |
Money Market Funds |
1.2% | |
| Largest Holdings [Text Block] |
|
Table Summary
Lumentum Holdings, Inc. |
1.4% |
Coherent Corp. |
1.2% |
TechnipFMC PLC |
0.8% |
Curtiss-Wright Corp. |
0.7% |
Casey's General Stores, Inc. |
0.7% |
XPO, Inc. |
0.7% |
Royal Gold, Inc. |
0.7% |
Flex Ltd. |
0.7% |
Woodward, Inc. |
0.7% |
ATI, Inc. |
0.6% | |
| Material Fund Change [Text Block] |
|
|
| C000122594 |
|
|
| Shareholder Report [Line Items] |
|
|
| Fund Name |
|
Columbia Mid Cap Index Fund
|
| Class Name |
|
Institutional 2 Class
|
| Trading Symbol |
|
CPXRX
|
| Annual or Semi-Annual Statement [Text Block] |
|
This annual shareholder report contains important information about Columbia Mid Cap Index Fund (the Fund) for the period of March 1, 2025 to February 28, 2026.
|
| Additional Information [Text Block] |
|
You can find additional information about the Fund at columbiathreadneedleus.com/resources/literature. You can also request more information by contacting us at 1-800-345-6611.
|
| Additional Information Phone Number |
|
1-800-345-6611
|
| Additional Information Website |
|
columbiathreadneedleus.com/resources/literature
|
| Expenses [Text Block] |
|
What were the Fund costs for the reporting period? (Based on a hypothetical $10,000 investment)
Table Summary
Class |
Cost of a $10,000 investment |
Cost paid as a percentage of a $10,000 investment |
Institutional 2 Class |
$22 |
0.20% | |
| Expenses Paid, Amount |
|
$ 22
|
| Expense Ratio, Percent |
|
0.20%
|
| Factors Affecting Performance [Text Block] |
|
Management's Discussion of Fund Performance The performance of Institutional 2 Class shares for the period presented is shown in the Average Annual Total Returns table. Top Performance ContributorsSectors | The information technology, communication services and industrials sectors were the top performing sectors for the Fund, on an absolute basis, during the period. Individual holdings | Fund positions in Lumentum, an optical and photonics components manufacturer; Coherent Corp., a photonics, lasers, and advanced materials technology manufacturer; Ciena Corporation, an optical networking equipment and software company; Comfort Systems USA, a mechanical and electrical contracting services company; and Curtiss-Wright, an aerospace, defense, and industrial technology manufacturer, were among the top absolute contributors to Fund performance during the period. Top Performance DetractorsSectors | The real estate, financials and materials sectors were the weakest performing sectors for the Fund, on an absolute basis, during the period. Individual holdings | Fund positions in Berry Global, a global packaging and materials manufacturing company; Sarepta, a biotechnology company focused on rare diseases; Nutanix, an enterprise cloud infrastructure software company; Duolingo, an education technology software company; and Pinnacle Financial, a regional commercial bank and financial services firm, were among the top absolute detractors from Fund performance during the period. |
| Performance Past Does Not Indicate Future [Text] |
|
The Fund's past performance is not a good predictor of the Fund's future performance.
|
| Line Graph [Table Text Block] |
|

Table Summary
|
Columbia Mid Cap Index Fund Institutional 2 Class ($30,696) |
Russell 3000® Index ($40,728) |
S&P MidCap 400® Index ($31,364) |
02/16 |
$10,000 |
$10,000 |
$10,000 |
03/16 |
$10,843 |
$10,704 |
$10,852 |
04/16 |
$10,977 |
$10,770 |
$10,984 |
05/16 |
$11,223 |
$10,963 |
$11,238 |
06/16 |
$11,273 |
$10,986 |
$11,285 |
07/16 |
$11,749 |
$11,422 |
$11,769 |
08/16 |
$11,809 |
$11,451 |
$11,828 |
09/16 |
$11,734 |
$11,469 |
$11,753 |
10/16 |
$11,416 |
$11,221 |
$11,438 |
11/16 |
$12,323 |
$11,723 |
$12,354 |
12/16 |
$12,594 |
$11,952 |
$12,624 |
01/17 |
$12,804 |
$12,176 |
$12,836 |
02/17 |
$13,135 |
$12,629 |
$13,173 |
03/17 |
$13,079 |
$12,638 |
$13,122 |
04/17 |
$13,191 |
$12,772 |
$13,231 |
05/17 |
$13,119 |
$12,903 |
$13,167 |
06/17 |
$13,333 |
$13,019 |
$13,380 |
07/17 |
$13,447 |
$13,264 |
$13,498 |
08/17 |
$13,235 |
$13,290 |
$13,291 |
09/17 |
$13,756 |
$13,614 |
$13,811 |
10/17 |
$14,066 |
$13,911 |
$14,124 |
11/17 |
$14,579 |
$14,334 |
$14,643 |
12/17 |
$14,610 |
$14,477 |
$14,675 |
01/18 |
$15,027 |
$15,240 |
$15,097 |
02/18 |
$14,349 |
$14,678 |
$14,428 |
03/18 |
$14,479 |
$14,384 |
$14,562 |
04/18 |
$14,444 |
$14,438 |
$14,524 |
05/18 |
$15,036 |
$14,846 |
$15,123 |
06/18 |
$15,094 |
$14,943 |
$15,187 |
07/18 |
$15,357 |
$15,439 |
$15,455 |
08/18 |
$15,848 |
$15,981 |
$15,948 |
09/18 |
$15,673 |
$16,008 |
$15,774 |
10/18 |
$14,174 |
$14,829 |
$14,268 |
11/18 |
$14,612 |
$15,126 |
$14,713 |
12/18 |
$12,952 |
$13,718 |
$13,048 |
01/19 |
$14,307 |
$14,896 |
$14,413 |
02/19 |
$14,914 |
$15,419 |
$15,024 |
03/19 |
$14,829 |
$15,645 |
$14,939 |
04/19 |
$15,417 |
$16,269 |
$15,540 |
05/19 |
$14,184 |
$15,216 |
$14,301 |
06/19 |
$15,271 |
$16,285 |
$15,394 |
07/19 |
$15,445 |
$16,527 |
$15,577 |
08/19 |
$14,796 |
$16,190 |
$14,923 |
09/19 |
$15,251 |
$16,475 |
$15,381 |
10/19 |
$15,416 |
$16,829 |
$15,554 |
11/19 |
$15,871 |
$17,469 |
$16,017 |
12/19 |
$16,317 |
$17,973 |
$16,467 |
01/20 |
$15,886 |
$17,954 |
$16,037 |
02/20 |
$14,370 |
$16,484 |
$14,515 |
03/20 |
$11,460 |
$14,217 |
$11,576 |
04/20 |
$13,076 |
$16,100 |
$13,218 |
05/20 |
$14,029 |
$16,961 |
$14,185 |
06/20 |
$14,209 |
$17,349 |
$14,363 |
07/20 |
$14,859 |
$18,334 |
$15,025 |
08/20 |
$15,383 |
$19,662 |
$15,553 |
09/20 |
$14,880 |
$18,946 |
$15,048 |
10/20 |
$15,194 |
$18,537 |
$15,375 |
11/20 |
$17,364 |
$20,792 |
$17,570 |
12/20 |
$18,497 |
$21,728 |
$18,716 |
01/21 |
$18,774 |
$21,631 |
$18,998 |
02/21 |
$20,049 |
$22,307 |
$20,290 |
03/21 |
$20,981 |
$23,107 |
$21,237 |
04/21 |
$21,923 |
$24,298 |
$22,194 |
05/21 |
$21,956 |
$24,409 |
$22,237 |
06/21 |
$21,733 |
$25,010 |
$22,009 |
07/21 |
$21,803 |
$25,433 |
$22,085 |
08/21 |
$22,221 |
$26,159 |
$22,516 |
09/21 |
$21,338 |
$24,985 |
$21,622 |
10/21 |
$22,593 |
$26,675 |
$22,894 |
11/21 |
$21,919 |
$26,269 |
$22,222 |
12/21 |
$23,029 |
$27,303 |
$23,350 |
01/22 |
$21,368 |
$25,697 |
$21,667 |
02/22 |
$21,604 |
$25,049 |
$21,908 |
03/22 |
$21,891 |
$25,862 |
$22,212 |
04/22 |
$20,335 |
$23,541 |
$20,633 |
05/22 |
$20,492 |
$23,509 |
$20,787 |
06/22 |
$18,515 |
$21,543 |
$18,788 |
07/22 |
$20,519 |
$23,564 |
$20,826 |
08/22 |
$19,883 |
$22,684 |
$20,180 |
09/22 |
$18,045 |
$20,581 |
$18,325 |
10/22 |
$19,938 |
$22,269 |
$20,252 |
11/22 |
$21,154 |
$23,431 |
$21,491 |
12/22 |
$19,977 |
$22,059 |
$20,301 |
01/23 |
$21,817 |
$23,578 |
$22,174 |
02/23 |
$21,423 |
$23,027 |
$21,772 |
03/23 |
$20,736 |
$23,643 |
$21,074 |
04/23 |
$20,561 |
$23,895 |
$20,908 |
05/23 |
$19,904 |
$23,988 |
$20,242 |
06/23 |
$21,732 |
$25,626 |
$22,096 |
07/23 |
$22,621 |
$26,544 |
$23,007 |
08/23 |
$21,958 |
$26,032 |
$22,342 |
09/23 |
$20,798 |
$24,792 |
$21,167 |
10/23 |
$19,699 |
$24,135 |
$20,038 |
11/23 |
$21,371 |
$26,385 |
$21,742 |
12/23 |
$23,229 |
$27,785 |
$23,638 |
01/24 |
$22,818 |
$28,093 |
$23,233 |
02/24 |
$24,178 |
$29,613 |
$24,613 |
03/24 |
$25,522 |
$30,569 |
$25,990 |
04/24 |
$23,988 |
$29,224 |
$24,426 |
05/24 |
$25,032 |
$30,604 |
$25,498 |
06/24 |
$24,636 |
$31,552 |
$25,095 |
07/24 |
$26,070 |
$32,138 |
$26,552 |
08/24 |
$26,038 |
$32,838 |
$26,531 |
09/24 |
$26,331 |
$33,517 |
$26,838 |
10/24 |
$26,152 |
$33,271 |
$26,648 |
11/24 |
$28,451 |
$35,484 |
$28,996 |
12/24 |
$26,411 |
$34,400 |
$26,930 |
01/25 |
$27,427 |
$35,486 |
$27,967 |
02/25 |
$26,219 |
$34,806 |
$26,751 |
03/25 |
$24,784 |
$32,775 |
$25,287 |
04/25 |
$24,224 |
$32,556 |
$24,718 |
05/25 |
$25,519 |
$34,619 |
$26,052 |
06/25 |
$26,446 |
$36,378 |
$26,984 |
07/25 |
$26,860 |
$37,179 |
$27,421 |
08/25 |
$27,777 |
$38,039 |
$28,352 |
09/25 |
$27,885 |
$39,352 |
$28,482 |
10/25 |
$27,759 |
$40,196 |
$28,349 |
11/25 |
$28,317 |
$40,306 |
$28,929 |
12/25 |
$28,345 |
$40,298 |
$28,950 |
01/26 |
$29,491 |
$40,923 |
$30,123 |
02/26 |
$30,696 |
$40,728 |
$31,364 |
|
| Average Annual Return [Table Text Block] |
|
Table Summary
Average Annual Total Returns (%) |
1 year |
5 years |
10 years |
Institutional 2 Class |
17.07 |
8.89 |
11.87 |
Russell 3000® Index |
17.02 |
12.80 |
15.08 |
S&P MidCap 400® Index |
17.24 |
9.10 |
12.11 | |
| No Deduction of Taxes [Text Block] |
|
Performance does not reflect the deduction of taxes that a shareholder may pay on fund distributions or on the redemptions of fund shares.
|
| Updated Performance Information Location [Text Block] |
|
columbiathreadneedleus.com/investment-products/mutual-funds
|
| AssetsNet |
|
$ 2,578,939,466
|
| Holdings Count | Holding |
|
402
|
| Advisory Fees Paid, Amount |
|
$ 4,949,801
|
| InvestmentCompanyPortfolioTurnover |
|
16.00%
|
| Additional Fund Statistics [Text Block] |
|
Table Summary
Fund net assets |
$2,578,939,466 |
Total number of portfolio holdings |
402 |
Management services fees (represents 0.20% of Fund average net assets) |
$4,949,801 |
Portfolio turnover for the reporting period |
16% | |
| Holdings [Text Block] |
|
Table Summary
Industrials |
25.2% |
Financials |
14.3% |
Information Technology |
13.9% |
Consumer Discretionary |
11.0% |
Health Care |
8.5% |
Real Estate |
6.5% |
Materials |
5.7% |
Energy |
4.5% |
Consumer Staples |
4.4% |
Utilities |
3.2% |
Other |
1.5% |
Table Summary
Common Stocks |
98.7% |
Money Market Funds |
1.2% | |
| Largest Holdings [Text Block] |
|
Table Summary
Lumentum Holdings, Inc. |
1.4% |
Coherent Corp. |
1.2% |
TechnipFMC PLC |
0.8% |
Curtiss-Wright Corp. |
0.7% |
Casey's General Stores, Inc. |
0.7% |
XPO, Inc. |
0.7% |
Royal Gold, Inc. |
0.7% |
Flex Ltd. |
0.7% |
Woodward, Inc. |
0.7% |
ATI, Inc. |
0.6% | |
| Material Fund Change [Text Block] |
|
|
| C000173200 |
|
|
| Shareholder Report [Line Items] |
|
|
| Fund Name |
|
Columbia Mid Cap Index Fund
|
| Class Name |
|
Institutional 3 Class
|
| Trading Symbol |
|
CMDYX
|
| Annual or Semi-Annual Statement [Text Block] |
|
This annual shareholder report contains important information about Columbia Mid Cap Index Fund (the Fund) for the period of March 1, 2025 to February 28, 2026.
|
| Additional Information [Text Block] |
|
You can find additional information about the Fund at columbiathreadneedleus.com/resources/literature. You can also request more information by contacting us at 1-800-345-6611.
|
| Additional Information Phone Number |
|
1-800-345-6611
|
| Additional Information Website |
|
columbiathreadneedleus.com/resources/literature
|
| Expenses [Text Block] |
|
What were the Fund costs for the reporting period? (Based on a hypothetical $10,000 investment)
Table Summary
Class |
Cost of a $10,000 investment |
Cost paid as a percentage of a $10,000 investment |
Institutional 3 Class |
$22 |
0.20% | |
| Expenses Paid, Amount |
|
$ 22
|
| Expense Ratio, Percent |
|
0.20%
|
| Factors Affecting Performance [Text Block] |
|
Management's Discussion of Fund Performance The performance of Institutional 3 Class shares for the period presented is shown in the Average Annual Total Returns table. Top Performance ContributorsSectors | The information technology, communication services and industrials sectors were the top performing sectors for the Fund, on an absolute basis, during the period. Individual holdings | Fund positions in Lumentum, an optical and photonics components manufacturer; Coherent Corp., a photonics, lasers, and advanced materials technology manufacturer; Ciena Corporation, an optical networking equipment and software company; Comfort Systems USA, a mechanical and electrical contracting services company; and Curtiss-Wright, an aerospace, defense, and industrial technology manufacturer, were among the top absolute contributors to Fund performance during the period. Top Performance DetractorsSectors | The real estate, financials and materials sectors were the weakest performing sectors for the Fund, on an absolute basis, during the period. Individual holdings | Fund positions in Berry Global, a global packaging and materials manufacturing company; Sarepta, a biotechnology company focused on rare diseases; Nutanix, an enterprise cloud infrastructure software company; Duolingo, an education technology software company; and Pinnacle Financial, a regional commercial bank and financial services firm, were among the top absolute detractors from Fund performance during the period. |
| Performance Past Does Not Indicate Future [Text] |
|
The Fund's past performance is not a good predictor of the Fund's future performance.
|
| Line Graph [Table Text Block] |
|
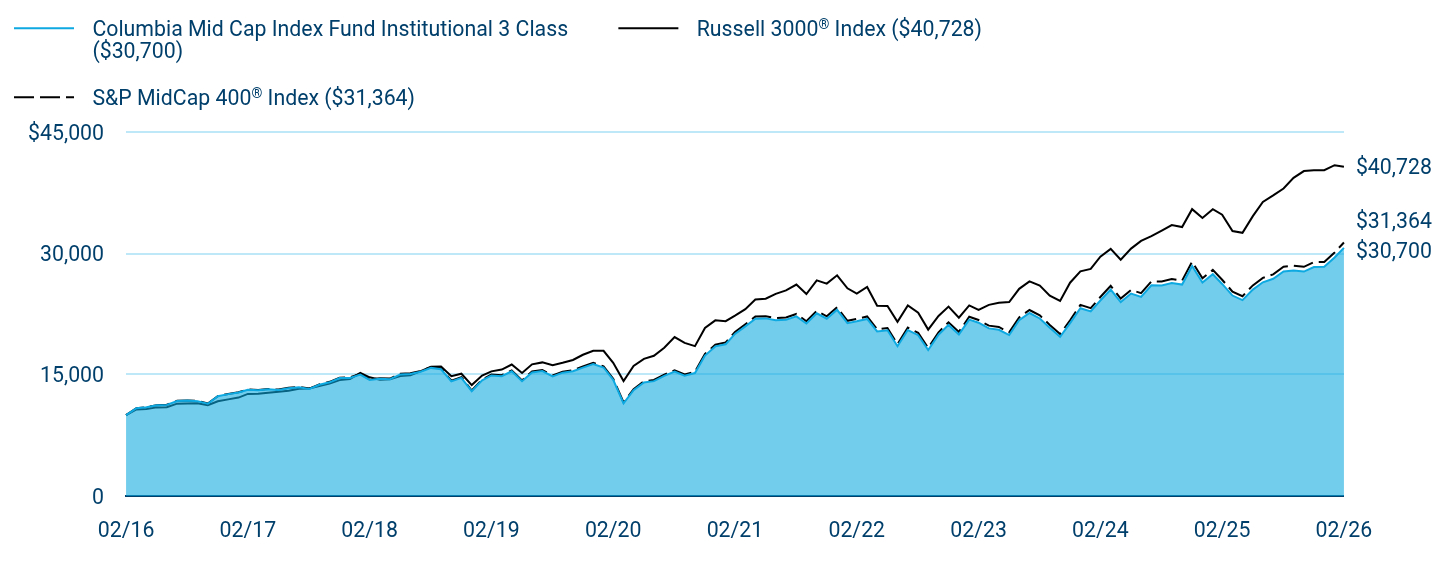
Table Summary
|
Columbia Mid Cap Index Fund Institutional 3 Class ($30,700) |
Russell 3000® Index ($40,728) |
S&P MidCap 400® Index ($31,364) |
02/16 |
$10,000 |
$10,000 |
$10,000 |
03/16 |
$10,850 |
$10,704 |
$10,852 |
04/16 |
$10,979 |
$10,770 |
$10,984 |
05/16 |
$11,229 |
$10,963 |
$11,238 |
06/16 |
$11,272 |
$10,986 |
$11,285 |
07/16 |
$11,757 |
$11,422 |
$11,769 |
08/16 |
$11,811 |
$11,451 |
$11,828 |
09/16 |
$11,734 |
$11,469 |
$11,753 |
10/16 |
$11,418 |
$11,221 |
$11,438 |
11/16 |
$12,334 |
$11,723 |
$12,354 |
12/16 |
$12,602 |
$11,952 |
$12,624 |
01/17 |
$12,807 |
$12,176 |
$12,836 |
02/17 |
$13,145 |
$12,629 |
$13,173 |
03/17 |
$13,083 |
$12,638 |
$13,122 |
04/17 |
$13,191 |
$12,772 |
$13,231 |
05/17 |
$13,124 |
$12,903 |
$13,167 |
06/17 |
$13,337 |
$13,019 |
$13,380 |
07/17 |
$13,455 |
$13,264 |
$13,498 |
08/17 |
$13,245 |
$13,290 |
$13,291 |
09/17 |
$13,759 |
$13,614 |
$13,811 |
10/17 |
$14,062 |
$13,911 |
$14,124 |
11/17 |
$14,585 |
$14,334 |
$14,643 |
12/17 |
$14,609 |
$14,477 |
$14,675 |
01/18 |
$15,024 |
$15,240 |
$15,097 |
02/18 |
$14,356 |
$14,678 |
$14,428 |
03/18 |
$14,491 |
$14,384 |
$14,562 |
04/18 |
$14,446 |
$14,438 |
$14,524 |
05/18 |
$15,042 |
$14,846 |
$15,123 |
06/18 |
$15,102 |
$14,943 |
$15,187 |
07/18 |
$15,366 |
$15,439 |
$15,455 |
08/18 |
$15,848 |
$15,981 |
$15,948 |
09/18 |
$15,675 |
$16,008 |
$15,774 |
10/18 |
$14,174 |
$14,829 |
$14,268 |
11/18 |
$14,620 |
$15,126 |
$14,713 |
12/18 |
$12,960 |
$13,718 |
$13,048 |
01/19 |
$14,313 |
$14,896 |
$14,413 |
02/19 |
$14,915 |
$15,419 |
$15,024 |
03/19 |
$14,826 |
$15,645 |
$14,939 |
04/19 |
$15,428 |
$16,269 |
$15,540 |
05/19 |
$14,194 |
$15,216 |
$14,301 |
06/19 |
$15,276 |
$16,285 |
$15,394 |
07/19 |
$15,458 |
$16,527 |
$15,577 |
08/19 |
$14,802 |
$16,190 |
$14,923 |
09/19 |
$15,256 |
$16,475 |
$15,381 |
10/19 |
$15,427 |
$16,829 |
$15,554 |
11/19 |
$15,881 |
$17,469 |
$16,017 |
12/19 |
$16,327 |
$17,973 |
$16,467 |
01/20 |
$15,897 |
$17,954 |
$16,037 |
02/20 |
$14,379 |
$16,484 |
$14,515 |
03/20 |
$11,457 |
$14,217 |
$11,576 |
04/20 |
$13,080 |
$16,100 |
$13,218 |
05/20 |
$14,044 |
$16,961 |
$14,185 |
06/20 |
$14,210 |
$17,349 |
$14,363 |
07/20 |
$14,868 |
$18,334 |
$15,025 |
08/20 |
$15,383 |
$19,662 |
$15,553 |
09/20 |
$14,879 |
$18,946 |
$15,048 |
10/20 |
$15,207 |
$18,537 |
$15,375 |
11/20 |
$17,377 |
$20,792 |
$17,570 |
12/20 |
$18,507 |
$21,728 |
$18,716 |
01/21 |
$18,774 |
$21,631 |
$18,998 |
02/21 |
$20,053 |
$22,307 |
$20,290 |
03/21 |
$20,983 |
$23,107 |
$21,237 |
04/21 |
$21,925 |
$24,298 |
$22,194 |
05/21 |
$21,971 |
$24,409 |
$22,237 |
06/21 |
$21,737 |
$25,010 |
$22,009 |
07/21 |
$21,810 |
$25,433 |
$22,085 |
08/21 |
$22,226 |
$26,159 |
$22,516 |
09/21 |
$21,346 |
$24,985 |
$21,622 |
10/21 |
$22,604 |
$26,675 |
$22,894 |
11/21 |
$21,932 |
$26,269 |
$22,222 |
12/21 |
$23,038 |
$27,303 |
$23,350 |
01/22 |
$21,379 |
$25,697 |
$21,667 |
02/22 |
$21,614 |
$25,049 |
$21,908 |
03/22 |
$21,904 |
$25,862 |
$22,212 |
04/22 |
$20,356 |
$23,541 |
$20,633 |
05/22 |
$20,494 |
$23,509 |
$20,787 |
06/22 |
$18,528 |
$21,543 |
$18,788 |
07/22 |
$20,536 |
$23,564 |
$20,826 |
08/22 |
$19,891 |
$22,684 |
$20,180 |
09/22 |
$18,059 |
$20,581 |
$18,325 |
10/22 |
$19,950 |
$22,269 |
$20,252 |
11/22 |
$21,166 |
$23,431 |
$21,491 |
12/22 |
$19,991 |
$22,059 |
$20,301 |
01/23 |
$21,825 |
$23,578 |
$22,174 |
02/23 |
$21,437 |
$23,027 |
$21,772 |
03/23 |
$20,737 |
$23,643 |
$21,074 |
04/23 |
$20,566 |
$23,895 |
$20,908 |
05/23 |
$19,913 |
$23,988 |
$20,242 |
06/23 |
$21,735 |
$25,626 |
$22,096 |
07/23 |
$22,634 |
$26,544 |
$23,007 |
08/23 |
$21,960 |
$26,032 |
$22,342 |
09/23 |
$20,803 |
$24,792 |
$21,167 |
10/23 |
$19,695 |
$24,135 |
$20,038 |
11/23 |
$21,381 |
$26,385 |
$21,742 |
12/23 |
$23,235 |
$27,785 |
$23,638 |
01/24 |
$22,829 |
$28,093 |
$23,233 |
02/24 |
$24,183 |
$29,613 |
$24,613 |
03/24 |
$25,537 |
$30,569 |
$25,990 |
04/24 |
$23,997 |
$29,224 |
$24,426 |
05/24 |
$25,046 |
$30,604 |
$25,498 |
06/24 |
$24,638 |
$31,552 |
$25,095 |
07/24 |
$26,072 |
$32,138 |
$26,552 |
08/24 |
$26,055 |
$32,838 |
$26,531 |
09/24 |
$26,352 |
$33,517 |
$26,838 |
10/24 |
$26,159 |
$33,271 |
$26,648 |
11/24 |
$28,450 |
$35,484 |
$28,996 |
12/24 |
$26,420 |
$34,400 |
$26,930 |
01/25 |
$27,439 |
$35,486 |
$27,967 |
02/25 |
$26,231 |
$34,806 |
$26,751 |
03/25 |
$24,797 |
$32,775 |
$25,287 |
04/25 |
$24,231 |
$32,556 |
$24,718 |
05/25 |
$25,533 |
$34,619 |
$26,052 |
06/25 |
$26,438 |
$36,378 |
$26,984 |
07/25 |
$26,866 |
$37,179 |
$27,421 |
08/25 |
$27,779 |
$38,039 |
$28,352 |
09/25 |
$27,896 |
$39,352 |
$28,482 |
10/25 |
$27,760 |
$40,196 |
$28,349 |
11/25 |
$28,324 |
$40,306 |
$28,929 |
12/25 |
$28,355 |
$40,298 |
$28,950 |
01/26 |
$29,496 |
$40,923 |
$30,123 |
02/26 |
$30,700 |
$40,728 |
$31,364 |
|
| Average Annual Return [Table Text Block] |
|
Table Summary
Average Annual Total Returns (%) |
1 year |
5 years |
10 years |
Institutional 3 ClassFootnote Reference(a) |
17.04 |
8.89 |
11.87 |
Russell 3000® Index |
17.02 |
12.80 |
15.08 |
S&P MidCap 400® Index |
17.24 |
9.10 |
12.11 | |
| No Deduction of Taxes [Text Block] |
|
Performance does not reflect the deduction of taxes that a shareholder may pay on fund distributions or on the redemptions of fund shares.
|
| Updated Performance Information Location [Text Block] |
|
columbiathreadneedleus.com/investment-products/mutual-funds
|
| AssetsNet |
|
$ 2,578,939,466
|
| Holdings Count | Holding |
|
402
|
| Advisory Fees Paid, Amount |
|
$ 4,949,801
|
| InvestmentCompanyPortfolioTurnover |
|
16.00%
|
| Additional Fund Statistics [Text Block] |
|
Table Summary
Fund net assets |
$2,578,939,466 |
Total number of portfolio holdings |
402 |
Management services fees (represents 0.20% of Fund average net assets) |
$4,949,801 |
Portfolio turnover for the reporting period |
16% | |
| Holdings [Text Block] |
|
Table Summary
Industrials |
25.2% |
Financials |
14.3% |
Information Technology |
13.9% |
Consumer Discretionary |
11.0% |
Health Care |
8.5% |
Real Estate |
6.5% |
Materials |
5.7% |
Energy |
4.5% |
Consumer Staples |
4.4% |
Utilities |
3.2% |
Other |
1.5% |
Table Summary
Common Stocks |
98.7% |
Money Market Funds |
1.2% | |
| Largest Holdings [Text Block] |
|
Table Summary
Lumentum Holdings, Inc. |
1.4% |
Coherent Corp. |
1.2% |
TechnipFMC PLC |
0.8% |
Curtiss-Wright Corp. |
0.7% |
Casey's General Stores, Inc. |
0.7% |
XPO, Inc. |
0.7% |
Royal Gold, Inc. |
0.7% |
Flex Ltd. |
0.7% |
Woodward, Inc. |
0.7% |
ATI, Inc. |
0.6% | |
| Material Fund Change [Text Block] |
|
|
| C000030055 |
|
|
| Shareholder Report [Line Items] |
|
|
| Fund Name |
|
Columbia Mid Cap Index Fund
|
| Class Name |
|
Institutional Class
|
| Trading Symbol |
|
NMPAX
|
| Annual or Semi-Annual Statement [Text Block] |
|
This annual shareholder report contains important information about Columbia Mid Cap Index Fund (the Fund) for the period of March 1, 2025 to February 28, 2026.
|
| Additional Information [Text Block] |
|
You can find additional information about the Fund at columbiathreadneedleus.com/resources/literature. You can also request more information by contacting us at 1-800-345-6611.
|
| Additional Information Phone Number |
|
1-800-345-6611
|
| Additional Information Website |
|
columbiathreadneedleus.com/resources/literature
|
| Expenses [Text Block] |
|
What were the Fund costs for the reporting period? (Based on a hypothetical $10,000 investment)
Table Summary
Class |
Cost of a $10,000 investment |
Cost paid as a percentage of a $10,000 investment |
Institutional Class |
$22 |
0.20% | |
| Expenses Paid, Amount |
|
$ 22
|
| Expense Ratio, Percent |
|
0.20%
|
| Factors Affecting Performance [Text Block] |
|
Management's Discussion of Fund Performance The performance of Institutional Class shares for the period presented is shown in the Average Annual Total Returns table. Top Performance ContributorsSectors | The information technology, communication services and industrials sectors were the top performing sectors for the Fund, on an absolute basis, during the period. Individual holdings | Fund positions in Lumentum, an optical and photonics components manufacturer; Coherent Corp., a photonics, lasers, and advanced materials technology manufacturer; Ciena Corporation, an optical networking equipment and software company; Comfort Systems USA, a mechanical and electrical contracting services company; and Curtiss-Wright, an aerospace, defense, and industrial technology manufacturer, were among the top absolute contributors to Fund performance during the period. Top Performance DetractorsSectors | The real estate, financials and materials sectors were the weakest performing sectors for the Fund, on an absolute basis, during the period. Individual holdings | Fund positions in Berry Global, a global packaging and materials manufacturing company; Sarepta, a biotechnology company focused on rare diseases; Nutanix, an enterprise cloud infrastructure software company; Duolingo, an education technology software company; and Pinnacle Financial, a regional commercial bank and financial services firm, were among the top absolute detractors from Fund performance during the period. |
| Performance Past Does Not Indicate Future [Text] |
|
The Fund's past performance is not a good predictor of the Fund's future performance.
|
| Line Graph [Table Text Block] |
|

Table Summary
|
Columbia Mid Cap Index Fund Institutional Class ($30,710) |
Russell 3000® Index ($40,728) |
S&P MidCap 400® Index ($31,364) |
02/16 |
$10,000 |
$10,000 |
$10,000 |
03/16 |
$10,850 |
$10,704 |
$10,852 |
04/16 |
$10,979 |
$10,770 |
$10,984 |
05/16 |
$11,229 |
$10,963 |
$11,238 |
06/16 |
$11,272 |
$10,986 |
$11,285 |
07/16 |
$11,757 |
$11,422 |
$11,769 |
08/16 |
$11,811 |
$11,451 |
$11,828 |
09/16 |
$11,734 |
$11,469 |
$11,753 |
10/16 |
$11,418 |
$11,221 |
$11,438 |
11/16 |
$12,334 |
$11,723 |
$12,354 |
12/16 |
$12,602 |
$11,952 |
$12,624 |
01/17 |
$12,807 |
$12,176 |
$12,836 |
02/17 |
$13,145 |
$12,629 |
$13,173 |
03/17 |
$13,087 |
$12,638 |
$13,122 |
04/17 |
$13,194 |
$12,772 |
$13,231 |
05/17 |
$13,128 |
$12,903 |
$13,167 |
06/17 |
$13,338 |
$13,019 |
$13,380 |
07/17 |
$13,454 |
$13,264 |
$13,498 |
08/17 |
$13,246 |
$13,290 |
$13,291 |
09/17 |
$13,761 |
$13,614 |
$13,811 |
10/17 |
$14,068 |
$13,911 |
$14,124 |
11/17 |
$14,583 |
$14,334 |
$14,643 |
12/17 |
$14,614 |
$14,477 |
$14,675 |
01/18 |
$15,031 |
$15,240 |
$15,097 |
02/18 |
$14,357 |
$14,678 |
$14,428 |
03/18 |
$14,490 |
$14,384 |
$14,562 |
04/18 |
$14,446 |
$14,438 |
$14,524 |
05/18 |
$15,040 |
$14,846 |
$15,123 |
06/18 |
$15,100 |
$14,943 |
$15,187 |
07/18 |
$15,368 |
$15,439 |
$15,455 |
08/18 |
$15,851 |
$15,981 |
$15,948 |
09/18 |
$15,681 |
$16,008 |
$15,774 |
10/18 |
$14,178 |
$14,829 |
$14,268 |
11/18 |
$14,617 |
$15,126 |
$14,713 |
12/18 |
$12,958 |
$13,718 |
$13,048 |
01/19 |
$14,315 |
$14,896 |
$14,413 |
02/19 |
$14,916 |
$15,419 |
$15,024 |
03/19 |
$14,829 |
$15,645 |
$14,939 |
04/19 |
$15,430 |
$16,269 |
$15,540 |
05/19 |
$14,189 |
$15,216 |
$14,301 |
06/19 |
$15,281 |
$16,285 |
$15,394 |
07/19 |
$15,459 |
$16,527 |
$15,577 |
08/19 |
$14,805 |
$16,190 |
$14,923 |
09/19 |
$15,251 |
$16,475 |
$15,381 |
10/19 |
$15,429 |
$16,829 |
$15,554 |
11/19 |
$15,884 |
$17,469 |
$16,017 |
12/19 |
$16,321 |
$17,973 |
$16,467 |
01/20 |
$15,900 |
$17,954 |
$16,037 |
02/20 |
$14,380 |
$16,484 |
$14,515 |
03/20 |
$11,463 |
$14,217 |
$11,576 |
04/20 |
$13,086 |
$16,100 |
$13,218 |
05/20 |
$14,041 |
$16,961 |
$14,185 |
06/20 |
$14,215 |
$17,349 |
$14,363 |
07/20 |
$14,870 |
$18,334 |
$15,025 |
08/20 |
$15,385 |
$19,662 |
$15,553 |
09/20 |
$14,880 |
$18,946 |
$15,048 |
10/20 |
$15,202 |
$18,537 |
$15,375 |
11/20 |
$17,371 |
$20,792 |
$17,570 |
12/20 |
$18,511 |
$21,728 |
$18,716 |
01/21 |
$18,784 |
$21,631 |
$18,998 |
02/21 |
$20,059 |
$22,307 |
$20,290 |
03/21 |
$20,992 |
$23,107 |
$21,237 |
04/21 |
$21,925 |
$24,298 |
$22,194 |
05/21 |
$21,970 |
$24,409 |
$22,237 |
06/21 |
$21,741 |
$25,010 |
$22,009 |
07/21 |
$21,813 |
$25,433 |
$22,085 |
08/21 |
$22,231 |
$26,159 |
$22,516 |
09/21 |
$21,347 |
$24,985 |
$21,622 |
10/21 |
$22,601 |
$26,675 |
$22,894 |
11/21 |
$21,932 |
$26,269 |
$22,222 |
12/21 |
$23,036 |
$27,303 |
$23,350 |
01/22 |
$21,378 |
$25,697 |
$21,667 |
02/22 |
$21,608 |
$25,049 |
$21,908 |
03/22 |
$21,904 |
$25,862 |
$22,212 |
04/22 |
$20,354 |
$23,541 |
$20,633 |
05/22 |
$20,502 |
$23,509 |
$20,787 |
06/22 |
$18,518 |
$21,543 |
$18,788 |
07/22 |
$20,530 |
$23,564 |
$20,826 |
08/22 |
$19,888 |
$22,684 |
$20,180 |
09/22 |
$18,062 |
$20,581 |
$18,325 |
10/22 |
$19,945 |
$22,269 |
$20,252 |
11/22 |
$21,172 |
$23,431 |
$21,491 |
12/22 |
$19,985 |
$22,059 |
$20,301 |
01/23 |
$21,828 |
$23,578 |
$22,174 |
02/23 |
$21,435 |
$23,027 |
$21,772 |
03/23 |
$20,740 |
$23,643 |
$21,074 |
04/23 |
$20,574 |
$23,895 |
$20,908 |
05/23 |
$19,909 |
$23,988 |
$20,242 |
06/23 |
$21,740 |
$25,626 |
$22,096 |
07/23 |
$22,629 |
$26,544 |
$23,007 |
08/23 |
$21,974 |
$26,032 |
$22,342 |
09/23 |
$20,820 |
$24,792 |
$21,167 |
10/23 |
$19,697 |
$24,135 |
$20,038 |
11/23 |
$21,381 |
$26,385 |
$21,742 |
12/23 |
$23,244 |
$27,785 |
$23,638 |
01/24 |
$22,834 |
$28,093 |
$23,233 |
02/24 |
$24,195 |
$29,613 |
$24,613 |
03/24 |
$25,540 |
$30,569 |
$25,990 |
04/24 |
$23,998 |
$29,224 |
$24,426 |
05/24 |
$25,048 |
$30,604 |
$25,498 |
06/24 |
$24,653 |
$31,552 |
$25,095 |
07/24 |
$26,075 |
$32,138 |
$26,552 |
08/24 |
$26,059 |
$32,838 |
$26,531 |
09/24 |
$26,346 |
$33,517 |
$26,838 |
10/24 |
$26,160 |
$33,271 |
$26,648 |
11/24 |
$28,463 |
$35,484 |
$28,996 |
12/24 |
$26,430 |
$34,400 |
$26,930 |
01/25 |
$27,432 |
$35,486 |
$27,967 |
02/25 |
$26,248 |
$34,806 |
$26,751 |
03/25 |
$24,808 |
$32,775 |
$25,287 |
04/25 |
$24,243 |
$32,556 |
$24,718 |
05/25 |
$25,537 |
$34,619 |
$26,052 |
06/25 |
$26,447 |
$36,378 |
$26,984 |
07/25 |
$26,879 |
$37,179 |
$27,421 |
08/25 |
$27,779 |
$38,039 |
$28,352 |
09/25 |
$27,911 |
$39,352 |
$28,482 |
10/25 |
$27,779 |
$40,196 |
$28,349 |
11/25 |
$28,342 |
$40,306 |
$28,929 |
12/25 |
$28,352 |
$40,298 |
$28,950 |
01/26 |
$29,491 |
$40,923 |
$30,123 |
02/26 |
$30,710 |
$40,728 |
$31,364 |
|
| Average Annual Return [Table Text Block] |
|
Table Summary
Average Annual Total Returns (%) |
1 year |
5 years |
10 years |
Institutional Class |
17.00 |
8.89 |
11.87 |
Russell 3000® Index |
17.02 |
12.80 |
15.08 |
S&P MidCap 400® Index |
17.24 |
9.10 |
12.11 | |
| No Deduction of Taxes [Text Block] |
|
Performance does not reflect the deduction of taxes that a shareholder may pay on fund distributions or on the redemptions of fund shares.
|
| Updated Performance Information Location [Text Block] |
|
columbiathreadneedleus.com/investment-products/mutual-funds
|
| AssetsNet |
|
$ 2,578,939,466
|
| Holdings Count | Holding |
|
402
|
| Advisory Fees Paid, Amount |
|
$ 4,949,801
|
| InvestmentCompanyPortfolioTurnover |
|
16.00%
|
| Additional Fund Statistics [Text Block] |
|
Table Summary
Fund net assets |
$2,578,939,466 |
Total number of portfolio holdings |
402 |
Management services fees (represents 0.20% of Fund average net assets) |
$4,949,801 |
Portfolio turnover for the reporting period |
16% | |
| Holdings [Text Block] |
|
Table Summary
Industrials |
25.2% |
Financials |
14.3% |
Information Technology |
13.9% |
Consumer Discretionary |
11.0% |
Health Care |
8.5% |
Real Estate |
6.5% |
Materials |
5.7% |
Energy |
4.5% |
Consumer Staples |
4.4% |
Utilities |
3.2% |
Other |
1.5% |
Table Summary
Common Stocks |
98.7% |
Money Market Funds |
1.2% | |
| Largest Holdings [Text Block] |
|
Table Summary
Lumentum Holdings, Inc. |
1.4% |
Coherent Corp. |
1.2% |
TechnipFMC PLC |
0.8% |
Curtiss-Wright Corp. |
0.7% |
Casey's General Stores, Inc. |
0.7% |
XPO, Inc. |
0.7% |
Royal Gold, Inc. |
0.7% |
Flex Ltd. |
0.7% |
Woodward, Inc. |
0.7% |
ATI, Inc. |
0.6% | |
| Material Fund Change [Text Block] |
|
|
| C000059843 |
|
|
| Shareholder Report [Line Items] |
|
|
| Fund Name |
|
Columbia Overseas Value Fund
|
| Class Name |
|
Class A
|
| Trading Symbol |
|
COAVX
|
| Annual or Semi-Annual Statement [Text Block] |
|
This annual shareholder report contains important information about Columbia Overseas Value Fund (the Fund) for the period of March 1, 2025 to February 28, 2026.
|
| Additional Information [Text Block] |
|
You can find additional information about the Fund at columbiathreadneedleus.com/resources/literature. You can also request more information by contacting us at 1-800-345-6611.
|
| Additional Information Phone Number |
|
1-800-345-6611
|
| Additional Information Website |
|
columbiathreadneedleus.com/resources/literature
|
| Expenses [Text Block] |
|
What were the Fund costs for the reporting period? (Based on a hypothetical $10,000 investment)
Table Summary
Class |
Cost of a $10,000 investment |
Cost paid as a percentage of a $10,000 investment |
Class A |
$144 |
1.15% | |
| Expenses Paid, Amount |
|
$ 144
|
| Expense Ratio, Percent |
|
1.15%
|
| Factors Affecting Performance [Text Block] |
|
Management's Discussion of Fund Performance The performance of Class A shares for the period presented is shown in the Average Annual Total Returns table. Top Performance ContributorsStock selection | Selections in the financials, energy and materials sectors boosted the Fund’s relative performance during the annual period. Allocations | Smaller allocations to the communication services and materials sectors buoyed the Fund’s relative performance during the annual period. Individual holdings | Positions in Energy Fuels, an American rare earths and uranium company; Northern Star Resources, an Australian gold miner; Piraeus Bank, a Greek bank; Pan American Silver, a Canadian silver miner; and Impala Platinum, a South African platinum miner, contributed to the Fund’s relative performance during the annual period. Top Performance DetractorsStock selection | Selections in the information technology, health care and consumer discretionary sectors hurt the Fund’s relative performance during the annual period. Allocations | Larger weightings in the information technology and consumer staples sectors and a smaller weighting in the financials sector detracted from the Fund’s relative performance during the annual period. Individual holdings | Positions in Check Point Software Technologies, an Israeli cybersecurity company; Burford Capital, a litigation finance company; Flutter Entertainment, an Irish-American gambling company; Sankyo, a Japanese pachinko machine maker; and an overweight in MatsukiyoCocokara, a Japanese pharmacy chain, detracted from the Fund’s relative performance during the annual period. |
| Performance Past Does Not Indicate Future [Text] |
|
The Fund's past performance is not a good predictor of the Fund's future performance.
|
| Line Graph [Table Text Block] |
|
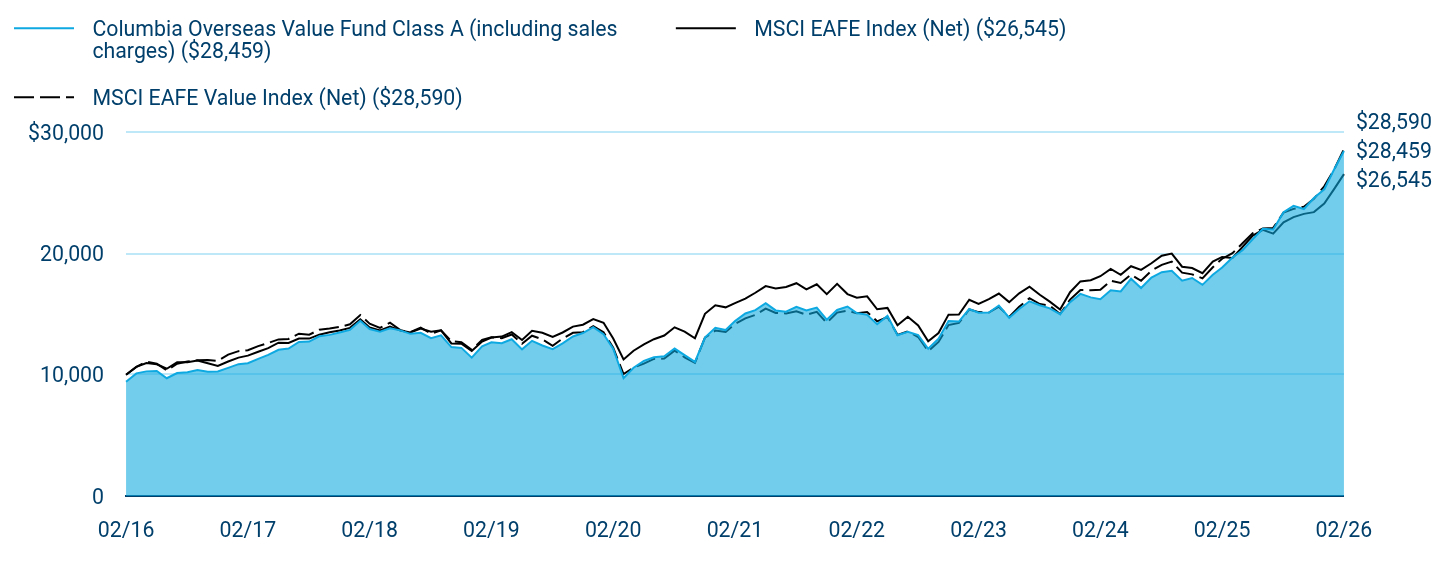
Table Summary
|
Columbia Overseas Value Fund Class A (including sales charges) ($28,459) |
MSCI EAFE Index (Net) ($26,545) |
MSCI EAFE Value Index (Net) ($28,590) |
02/16 |
$9,419 |
$10,000 |
$10,000 |
03/16 |
$10,114 |
$10,651 |
$10,660 |
04/16 |
$10,278 |
$10,959 |
$11,080 |
05/16 |
$10,316 |
$10,859 |
$10,904 |
06/16 |
$9,710 |
$10,495 |
$10,362 |
07/16 |
$10,139 |
$11,027 |
$10,907 |
08/16 |
$10,215 |
$11,035 |
$11,083 |
09/16 |
$10,391 |
$11,170 |
$11,191 |
10/16 |
$10,253 |
$10,942 |
$11,217 |
11/16 |
$10,265 |
$10,724 |
$11,148 |
12/16 |
$10,564 |
$11,091 |
$11,658 |
01/17 |
$10,872 |
$11,412 |
$11,945 |
02/17 |
$10,949 |
$11,575 |
$12,027 |
03/17 |
$11,309 |
$11,894 |
$12,363 |
04/17 |
$11,643 |
$12,197 |
$12,622 |
05/17 |
$12,055 |
$12,644 |
$12,915 |
06/17 |
$12,157 |
$12,622 |
$12,954 |
07/17 |
$12,710 |
$12,986 |
$13,387 |
08/17 |
$12,736 |
$12,981 |
$13,303 |
09/17 |
$13,173 |
$13,304 |
$13,714 |
10/17 |
$13,288 |
$13,506 |
$13,820 |
11/17 |
$13,481 |
$13,648 |
$13,944 |
12/17 |
$13,700 |
$13,867 |
$14,158 |
01/18 |
$14,443 |
$14,563 |
$14,922 |
02/18 |
$13,766 |
$13,905 |
$14,213 |
03/18 |
$13,554 |
$13,655 |
$13,870 |
04/18 |
$13,832 |
$13,966 |
$14,298 |
05/18 |
$13,660 |
$13,652 |
$13,678 |
06/18 |
$13,373 |
$13,486 |
$13,505 |
07/18 |
$13,453 |
$13,818 |
$13,892 |
08/18 |
$13,009 |
$13,551 |
$13,387 |
09/18 |
$13,251 |
$13,668 |
$13,664 |
10/18 |
$12,282 |
$12,580 |
$12,757 |
11/18 |
$12,214 |
$12,565 |
$12,686 |
12/18 |
$11,409 |
$11,955 |
$12,065 |
01/19 |
$12,341 |
$12,740 |
$12,873 |
02/19 |
$12,671 |
$13,065 |
$13,087 |
03/19 |
$12,602 |
$13,147 |
$13,020 |
04/19 |
$12,931 |
$13,517 |
$13,324 |
05/19 |
$12,095 |
$12,868 |
$12,552 |
06/19 |
$12,797 |
$13,631 |
$13,221 |
07/19 |
$12,413 |
$13,458 |
$12,924 |
08/19 |
$12,111 |
$13,110 |
$12,393 |
09/19 |
$12,591 |
$13,485 |
$12,991 |
10/19 |
$13,153 |
$13,970 |
$13,460 |
11/19 |
$13,441 |
$14,127 |
$13,513 |
12/19 |
$13,928 |
$14,586 |
$14,006 |
01/20 |
$13,345 |
$14,282 |
$13,500 |
02/20 |
$12,151 |
$12,991 |
$12,222 |
03/20 |
$9,721 |
$11,257 |
$10,057 |
04/20 |
$10,574 |
$11,984 |
$10,595 |
05/20 |
$11,142 |
$12,506 |
$10,917 |
06/20 |
$11,446 |
$12,932 |
$11,307 |
07/20 |
$11,518 |
$13,233 |
$11,329 |
08/20 |
$12,161 |
$13,914 |
$11,992 |
09/20 |
$11,618 |
$13,552 |
$11,441 |
10/20 |
$11,061 |
$13,011 |
$10,980 |
11/20 |
$13,061 |
$15,028 |
$13,060 |
12/20 |
$13,872 |
$15,726 |
$13,638 |
01/21 |
$13,685 |
$15,559 |
$13,532 |
02/21 |
$14,421 |
$15,908 |
$14,177 |
03/21 |
$15,056 |
$16,274 |
$14,654 |
04/21 |
$15,330 |
$16,763 |
$14,934 |
05/21 |
$15,908 |
$17,310 |
$15,451 |
06/21 |
$15,305 |
$17,115 |
$15,095 |
07/21 |
$15,204 |
$17,244 |
$15,058 |
08/21 |
$15,609 |
$17,548 |
$15,229 |
09/21 |
$15,305 |
$17,039 |
$14,949 |
10/21 |
$15,537 |
$17,458 |
$15,187 |
11/21 |
$14,538 |
$16,645 |
$14,274 |
12/21 |
$15,345 |
$17,498 |
$15,124 |
01/22 |
$15,628 |
$16,652 |
$15,281 |
02/22 |
$15,091 |
$16,358 |
$15,074 |
03/22 |
$14,942 |
$16,463 |
$15,174 |
04/22 |
$14,166 |
$15,398 |
$14,407 |
05/22 |
$14,852 |
$15,513 |
$14,761 |
06/22 |
$13,255 |
$14,074 |
$13,291 |
07/22 |
$13,542 |
$14,775 |
$13,568 |
08/22 |
$13,271 |
$14,073 |
$13,110 |
09/22 |
$12,138 |
$12,757 |
$11,935 |
10/22 |
$12,969 |
$13,443 |
$12,705 |
11/22 |
$14,433 |
$14,957 |
$14,101 |
12/22 |
$14,385 |
$14,969 |
$14,279 |
01/23 |
$15,418 |
$16,181 |
$15,382 |
02/23 |
$15,114 |
$15,844 |
$15,166 |
03/23 |
$15,130 |
$16,236 |
$15,127 |
04/23 |
$15,707 |
$16,695 |
$15,614 |
05/23 |
$14,704 |
$15,988 |
$14,773 |
06/23 |
$15,426 |
$16,716 |
$15,604 |
07/23 |
$16,056 |
$17,257 |
$16,314 |
08/23 |
$15,734 |
$16,595 |
$15,830 |
09/23 |
$15,473 |
$16,029 |
$15,696 |
10/23 |
$14,996 |
$15,379 |
$15,005 |
11/23 |
$15,980 |
$16,806 |
$16,194 |
12/23 |
$16,665 |
$17,699 |
$16,985 |
01/24 |
$16,381 |
$17,801 |
$16,974 |
02/24 |
$16,223 |
$18,127 |
$17,005 |
03/24 |
$16,965 |
$18,723 |
$17,747 |
04/24 |
$16,870 |
$18,244 |
$17,565 |
05/24 |
$17,912 |
$18,950 |
$18,257 |
06/24 |
$17,148 |
$18,644 |
$17,749 |
07/24 |
$18,014 |
$19,191 |
$18,581 |
08/24 |
$18,462 |
$19,815 |
$19,057 |
09/24 |
$18,574 |
$19,998 |
$19,327 |
10/24 |
$17,757 |
$18,911 |
$18,419 |
11/24 |
$17,981 |
$18,803 |
$18,277 |
12/24 |
$17,414 |
$18,376 |
$17,951 |
01/25 |
$18,243 |
$19,341 |
$18,867 |
02/25 |
$18,840 |
$19,717 |
$19,570 |
03/25 |
$19,670 |
$19,637 |
$20,027 |
04/25 |
$20,267 |
$20,536 |
$20,839 |
05/25 |
$21,195 |
$21,476 |
$21,675 |
06/25 |
$22,041 |
$21,949 |
$22,052 |
07/25 |
$21,975 |
$21,641 |
$22,108 |
08/25 |
$23,401 |
$22,564 |
$23,374 |
09/25 |
$23,932 |
$22,996 |
$23,681 |
10/25 |
$23,667 |
$23,266 |
$23,861 |
11/25 |
$24,579 |
$23,411 |
$24,510 |
12/25 |
$25,295 |
$24,113 |
$25,535 |
01/26 |
$27,011 |
$25,371 |
$26,990 |
02/26 |
$28,459 |
$26,545 |
$28,590 |
|
| Average Annual Return [Table Text Block] |
|
Table Summary
Average Annual Total Returns (%) |
1 year |
5 years |
10 years |
Class A (excluding sales charges) |
51.05 |
14.56 |
11.69 |
Class A (including sales charges) |
42.40 |
13.21 |
11.03 |
MSCI EAFE Index (Net) |
34.63 |
10.78 |
10.26 |
MSCI EAFE Value Index (Net) |
46.09 |
15.06 |
11.08 | |
| No Deduction of Taxes [Text Block] |
|
Performance does not reflect the deduction of taxes that a shareholder may pay on fund distributions or on the redemptions of fund shares.
|
| Updated Performance Information Location [Text Block] |
|
columbiathreadneedleus.com/investment-products/mutual-funds
|
| AssetsNet |
|
$ 6,862,784,805
|
| Holdings Count | Holding |
|
122
|
| Advisory Fees Paid, Amount |
|
$ 36,638,729
|
| InvestmentCompanyPortfolioTurnover |
|
57.00%
|
| Additional Fund Statistics [Text Block] |
|
Table Summary
Fund net assets |
$6,862,784,805 |
Total number of portfolio holdings |
122 |
Management services fees (represents 0.74% of Fund average net assets) |
$36,638,729 |
Portfolio turnover for the reporting period |
57% | |
| Holdings [Text Block] |
|
Table Summary
Japan |
21.9% |
|
United States |
12.4% |
|
France |
8.4% |
|
United Kingdom |
7.8% |
|
Netherlands |
5.0% |
|
Canada |
4.4% |
|
Hong Kong |
4.4% |
|
Spain |
4.0% |
|
Australia |
3.7% |
|
Germany |
3.5% |
|
Other |
24.7% |
|
Table Summary
Financials |
33.5% |
Consumer Staples |
12.2% |
Energy |
12.1% |
Industrials |
7.4% |
Materials |
7.2% |
Health Care |
6.2% |
Consumer Discretionary |
6.0% |
Information Technology |
4.6% |
Real Estate |
4.5% |
Utilities |
2.9% |
Other |
1.1% | |
| Largest Holdings [Text Block] |
|
Table Summary
Shell PLC |
3.1% |
Banco Santander SA |
3.0% |
TotalEnergies SE |
2.6% |
AXA SA |
2.4% |
Imperial Brands PLC |
2.3% |
Sumitomo Mitsui Financial Group, Inc. |
2.3% |
Northern Star Resources Ltd. |
2.1% |
Primo Brands Corp., Class A |
2.0% |
ASR Nederland NV |
1.9% |
Ping An Insurance Group Co. of China Ltd., Class H |
1.9% | |
| Material Fund Change [Text Block] |
|
|
| C000059844 |
|
|
| Shareholder Report [Line Items] |
|
|
| Fund Name |
|
Columbia Overseas Value Fund
|
| Class Name |
|
Class C
|
| Trading Symbol |
|
COCVX
|
| Annual or Semi-Annual Statement [Text Block] |
|
This annual shareholder report contains important information about Columbia Overseas Value Fund (the Fund) for the period of March 1, 2025 to February 28, 2026.
|
| Additional Information [Text Block] |
|
You can find additional information about the Fund at columbiathreadneedleus.com/resources/literature. You can also request more information by contacting us at 1-800-345-6611.
|
| Additional Information Phone Number |
|
1-800-345-6611
|
| Additional Information Website |
|
columbiathreadneedleus.com/resources/literature
|
| Expenses [Text Block] |
|
What were the Fund costs for the reporting period? (Based on a hypothetical $10,000 investment)
Table Summary
Class |
Cost of a $10,000 investment |
Cost paid as a percentage of a $10,000 investment |
Class C |
$237 |
1.90% | |
| Expenses Paid, Amount |
|
$ 237
|
| Expense Ratio, Percent |
|
1.90%
|
| Factors Affecting Performance [Text Block] |
|
Management's Discussion of Fund Performance The performance of Class C shares for the period presented is shown in the Average Annual Total Returns table. Top Performance ContributorsStock selection | Selections in the financials, energy and materials sectors boosted the Fund’s relative performance during the annual period. Allocations | Smaller allocations to the communication services and materials sectors buoyed the Fund’s relative performance during the annual period. Individual holdings | Positions in Energy Fuels, an American rare earths and uranium company; Northern Star Resources, an Australian gold miner; Piraeus Bank, a Greek bank; Pan American Silver, a Canadian silver miner; and Impala Platinum, a South African platinum miner, contributed to the Fund’s relative performance during the annual period. Top Performance DetractorsStock selection | Selections in the information technology, health care and consumer discretionary sectors hurt the Fund’s relative performance during the annual period. Allocations | Larger weightings in the information technology and consumer staples sectors and a smaller weighting in the financials sector detracted from the Fund’s relative performance during the annual period. Individual holdings | Positions in Check Point Software Technologies, an Israeli cybersecurity company; Burford Capital, a litigation finance company; Flutter Entertainment, an Irish-American gambling company; Sankyo, a Japanese pachinko machine maker; and an overweight in MatsukiyoCocokara, a Japanese pharmacy chain, detracted from the Fund’s relative performance during the annual period. |
| Performance Past Does Not Indicate Future [Text] |
|
The Fund's past performance is not a good predictor of the Fund's future performance.
|
| Line Graph [Table Text Block] |
|
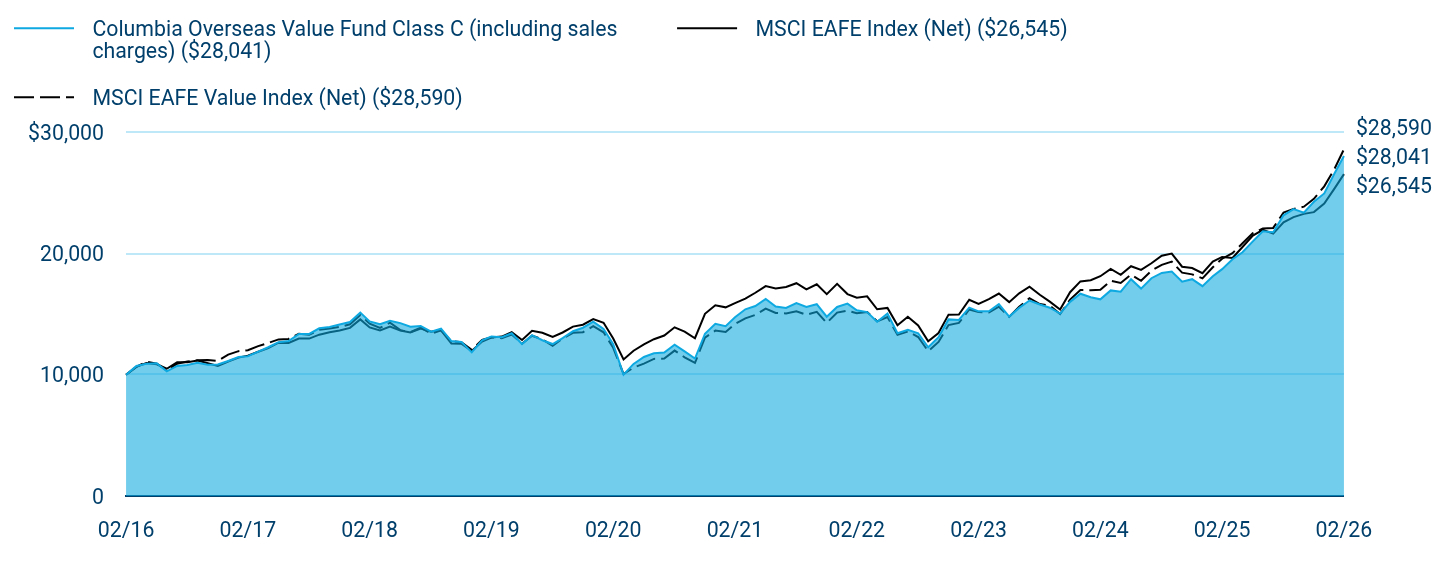
Table Summary
|
Columbia Overseas Value Fund Class C (including sales charges) ($28,041) |
MSCI EAFE Index (Net) ($26,545) |
MSCI EAFE Value Index (Net) ($28,590) |
02/16 |
$10,000 |
$10,000 |
$10,000 |
03/16 |
$10,726 |
$10,651 |
$10,660 |
04/16 |
$10,901 |
$10,959 |
$11,080 |
05/16 |
$10,941 |
$10,859 |
$10,904 |
06/16 |
$10,282 |
$10,495 |
$10,362 |
07/16 |
$10,726 |
$11,027 |
$10,907 |
08/16 |
$10,806 |
$11,035 |
$11,083 |
09/16 |
$10,995 |
$11,170 |
$11,191 |
10/16 |
$10,833 |
$10,942 |
$11,217 |
11/16 |
$10,847 |
$10,724 |
$11,148 |
12/16 |
$11,138 |
$11,091 |
$11,658 |
01/17 |
$11,464 |
$11,412 |
$11,945 |
02/17 |
$11,532 |
$11,575 |
$12,027 |
03/17 |
$11,913 |
$11,894 |
$12,363 |
04/17 |
$12,266 |
$12,197 |
$12,622 |
05/17 |
$12,688 |
$12,644 |
$12,915 |
06/17 |
$12,783 |
$12,622 |
$12,954 |
07/17 |
$13,368 |
$12,986 |
$13,387 |
08/17 |
$13,368 |
$12,981 |
$13,303 |
09/17 |
$13,830 |
$13,304 |
$13,714 |
10/17 |
$13,939 |
$13,506 |
$13,820 |
11/17 |
$14,143 |
$13,648 |
$13,944 |
12/17 |
$14,344 |
$13,867 |
$14,158 |
01/18 |
$15,126 |
$14,563 |
$14,922 |
02/18 |
$14,400 |
$13,905 |
$14,213 |
03/18 |
$14,176 |
$13,655 |
$13,870 |
04/18 |
$14,456 |
$13,966 |
$14,298 |
05/18 |
$14,260 |
$13,652 |
$13,678 |
06/18 |
$13,954 |
$13,486 |
$13,505 |
07/18 |
$14,025 |
$13,818 |
$13,892 |
08/18 |
$13,558 |
$13,551 |
$13,387 |
09/18 |
$13,799 |
$13,668 |
$13,664 |
10/18 |
$12,780 |
$12,580 |
$12,757 |
11/18 |
$12,709 |
$12,565 |
$12,686 |
12/18 |
$11,860 |
$11,955 |
$12,065 |
01/19 |
$12,833 |
$12,740 |
$12,873 |
02/19 |
$13,162 |
$13,065 |
$13,087 |
03/19 |
$13,091 |
$13,147 |
$13,020 |
04/19 |
$13,420 |
$13,517 |
$13,324 |
05/19 |
$12,533 |
$12,868 |
$12,552 |
06/19 |
$13,262 |
$13,631 |
$13,221 |
07/19 |
$12,847 |
$13,458 |
$12,924 |
08/19 |
$12,533 |
$13,110 |
$12,393 |
09/19 |
$13,019 |
$13,485 |
$12,991 |
10/19 |
$13,591 |
$13,970 |
$13,460 |
11/19 |
$13,877 |
$14,127 |
$13,513 |
12/19 |
$14,372 |
$14,586 |
$14,006 |
01/20 |
$13,768 |
$14,282 |
$13,500 |
02/20 |
$12,530 |
$12,991 |
$12,222 |
03/20 |
$10,009 |
$11,257 |
$10,057 |
04/20 |
$10,893 |
$11,984 |
$10,595 |
05/20 |
$11,468 |
$12,506 |
$10,917 |
06/20 |
$11,769 |
$12,932 |
$11,307 |
07/20 |
$11,828 |
$13,233 |
$11,329 |
08/20 |
$12,481 |
$13,914 |
$11,992 |
09/20 |
$11,932 |
$13,552 |
$11,441 |
10/20 |
$11,339 |
$13,011 |
$10,980 |
11/20 |
$13,385 |
$15,028 |
$13,060 |
12/20 |
$14,207 |
$15,726 |
$13,638 |
01/21 |
$13,999 |
$15,559 |
$13,532 |
02/21 |
$14,743 |
$15,908 |
$14,177 |
03/21 |
$15,397 |
$16,274 |
$14,654 |
04/21 |
$15,665 |
$16,763 |
$14,934 |
05/21 |
$16,245 |
$17,310 |
$15,451 |
06/21 |
$15,622 |
$17,115 |
$15,095 |
07/21 |
$15,503 |
$17,244 |
$15,058 |
08/21 |
$15,906 |
$17,548 |
$15,229 |
09/21 |
$15,593 |
$17,039 |
$14,949 |
10/21 |
$15,816 |
$17,458 |
$15,187 |
11/21 |
$14,788 |
$16,645 |
$14,274 |
12/21 |
$15,590 |
$17,498 |
$15,124 |
01/22 |
$15,865 |
$16,652 |
$15,281 |
02/22 |
$15,315 |
$16,358 |
$15,074 |
03/22 |
$15,163 |
$16,463 |
$15,174 |
04/22 |
$14,369 |
$15,398 |
$14,407 |
05/22 |
$15,040 |
$15,513 |
$14,761 |
06/22 |
$13,422 |
$14,074 |
$13,291 |
07/22 |
$13,716 |
$14,775 |
$13,568 |
08/22 |
$13,422 |
$14,073 |
$13,110 |
09/22 |
$12,264 |
$12,757 |
$11,935 |
10/22 |
$13,098 |
$13,443 |
$12,705 |
11/22 |
$14,565 |
$14,957 |
$14,101 |
12/22 |
$14,519 |
$14,969 |
$14,279 |
01/23 |
$15,538 |
$16,181 |
$15,382 |
02/23 |
$15,230 |
$15,844 |
$15,166 |
03/23 |
$15,230 |
$16,236 |
$15,127 |
04/23 |
$15,816 |
$16,695 |
$15,614 |
05/23 |
$14,797 |
$15,988 |
$14,773 |
06/23 |
$15,513 |
$16,716 |
$15,604 |
07/23 |
$16,121 |
$17,257 |
$16,314 |
08/23 |
$15,794 |
$16,595 |
$15,830 |
09/23 |
$15,528 |
$16,029 |
$15,696 |
10/23 |
$15,045 |
$15,379 |
$15,005 |
11/23 |
$16,012 |
$16,806 |
$16,194 |
12/23 |
$16,684 |
$17,699 |
$16,985 |
01/24 |
$16,397 |
$17,801 |
$16,974 |
02/24 |
$16,222 |
$18,127 |
$17,005 |
03/24 |
$16,955 |
$18,723 |
$17,747 |
04/24 |
$16,844 |
$18,244 |
$17,565 |
05/24 |
$17,879 |
$18,950 |
$18,257 |
06/24 |
$17,104 |
$18,644 |
$17,749 |
07/24 |
$17,961 |
$19,191 |
$18,581 |
08/24 |
$18,397 |
$19,815 |
$19,057 |
09/24 |
$18,510 |
$19,998 |
$19,327 |
10/24 |
$17,670 |
$18,911 |
$18,419 |
11/24 |
$17,880 |
$18,803 |
$18,277 |
12/24 |
$17,310 |
$18,376 |
$17,951 |
01/25 |
$18,125 |
$19,341 |
$18,867 |
02/25 |
$18,707 |
$19,717 |
$19,570 |
03/25 |
$19,522 |
$19,637 |
$20,027 |
04/25 |
$20,104 |
$20,536 |
$20,839 |
05/25 |
$21,002 |
$21,476 |
$21,675 |
06/25 |
$21,833 |
$21,949 |
$22,052 |
07/25 |
$21,750 |
$21,641 |
$22,108 |
08/25 |
$23,147 |
$22,564 |
$23,374 |
09/25 |
$23,662 |
$22,996 |
$23,681 |
10/25 |
$23,363 |
$23,266 |
$23,861 |
11/25 |
$24,261 |
$23,411 |
$24,510 |
12/25 |
$24,955 |
$24,113 |
$25,535 |
01/26 |
$26,614 |
$25,371 |
$26,990 |
02/26 |
$28,041 |
$26,545 |
$28,590 |
|
| Average Annual Return [Table Text Block] |
|
Table Summary
Average Annual Total Returns (%) |
1 year |
5 years |
10 years |
Class C (excluding sales charges) |
49.89 |
13.72 |
10.86 |
Class C (including sales charges) |
48.89 |
13.72 |
10.86 |
MSCI EAFE Index (Net) |
34.63 |
10.78 |
10.26 |
MSCI EAFE Value Index (Net) |
46.09 |
15.06 |
11.08 | |
| No Deduction of Taxes [Text Block] |
|
Performance does not reflect the deduction of taxes that a shareholder may pay on fund distributions or on the redemptions of fund shares.
|
| Updated Performance Information Location [Text Block] |
|
columbiathreadneedleus.com/investment-products/mutual-funds
|
| AssetsNet |
|
$ 6,862,784,805
|
| Holdings Count | Holding |
|
122
|
| Advisory Fees Paid, Amount |
|
$ 36,638,729
|
| InvestmentCompanyPortfolioTurnover |
|
57.00%
|
| Additional Fund Statistics [Text Block] |
|
Table Summary
Fund net assets |
$6,862,784,805 |
Total number of portfolio holdings |
122 |
Management services fees (represents 0.74% of Fund average net assets) |
$36,638,729 |
Portfolio turnover for the reporting period |
57% | |
| Holdings [Text Block] |
|
Table Summary
Japan |
21.9% |
|
United States |
12.4% |
|
France |
8.4% |
|
United Kingdom |
7.8% |
|
Netherlands |
5.0% |
|
Canada |
4.4% |
|
Hong Kong |
4.4% |
|
Spain |
4.0% |
|
Australia |
3.7% |
|
Germany |
3.5% |
|
Other |
24.7% |
|
Table Summary
Financials |
33.5% |
Consumer Staples |
12.2% |
Energy |
12.1% |
Industrials |
7.4% |
Materials |
7.2% |
Health Care |
6.2% |
Consumer Discretionary |
6.0% |
Information Technology |
4.6% |
Real Estate |
4.5% |
Utilities |
2.9% |
Other |
1.1% | |
| Largest Holdings [Text Block] |
|
Table Summary
Shell PLC |
3.1% |
Banco Santander SA |
3.0% |
TotalEnergies SE |
2.6% |
AXA SA |
2.4% |
Imperial Brands PLC |
2.3% |
Sumitomo Mitsui Financial Group, Inc. |
2.3% |
Northern Star Resources Ltd. |
2.1% |
Primo Brands Corp., Class A |
2.0% |
ASR Nederland NV |
1.9% |
Ping An Insurance Group Co. of China Ltd., Class H |
1.9% | |
| Material Fund Change [Text Block] |
|
|
| C000059845 |
|
|
| Shareholder Report [Line Items] |
|
|
| Fund Name |
|
Columbia Overseas Value Fund
|
| Class Name |
|
Class R
|
| Trading Symbol |
|
COVUX
|
| Annual or Semi-Annual Statement [Text Block] |
|
This annual shareholder report contains important information about Columbia Overseas Value Fund (the Fund) for the period of March 1, 2025 to February 28, 2026.
|
| Additional Information [Text Block] |
|
You can find additional information about the Fund at columbiathreadneedleus.com/resources/literature. You can also request more information by contacting us at 1-800-345-6611.
|
| Additional Information Phone Number |
|
1-800-345-6611
|
| Additional Information Website |
|
columbiathreadneedleus.com/resources/literature
|
| Expenses [Text Block] |
|
What were the Fund costs for the reporting period? (Based on a hypothetical $10,000 investment)
Table Summary
Class |
Cost of a $10,000 investment |
Cost paid as a percentage of a $10,000 investment |
Class R |
$175 |
1.40% | |
| Expenses Paid, Amount |
|
$ 175
|
| Expense Ratio, Percent |
|
1.40%
|
| Factors Affecting Performance [Text Block] |
|
Management's Discussion of Fund Performance The performance of Class R shares for the period presented is shown in the Average Annual Total Returns table. Top Performance ContributorsStock selection | Selections in the financials, energy and materials sectors boosted the Fund’s relative performance during the annual period. Allocations | Smaller allocations to the communication services and materials sectors buoyed the Fund’s relative performance during the annual period. Individual holdings | Positions in Energy Fuels, an American rare earths and uranium company; Northern Star Resources, an Australian gold miner; Piraeus Bank, a Greek bank; Pan American Silver, a Canadian silver miner; and Impala Platinum, a South African platinum miner, contributed to the Fund’s relative performance during the annual period. Top Performance DetractorsStock selection | Selections in the information technology, health care and consumer discretionary sectors hurt the Fund’s relative performance during the annual period. Allocations | Larger weightings in the information technology and consumer staples sectors and a smaller weighting in the financials sector detracted from the Fund’s relative performance during the annual period. Individual holdings | Positions in Check Point Software Technologies, an Israeli cybersecurity company; Burford Capital, a litigation finance company; Flutter Entertainment, an Irish-American gambling company; Sankyo, a Japanese pachinko machine maker; and an overweight in MatsukiyoCocokara, a Japanese pharmacy chain, detracted from the Fund’s relative performance during the annual period. |
| Performance Past Does Not Indicate Future [Text] |
|
The Fund's past performance is not a good predictor of the Fund's future performance.
|
| Line Graph [Table Text Block] |
|
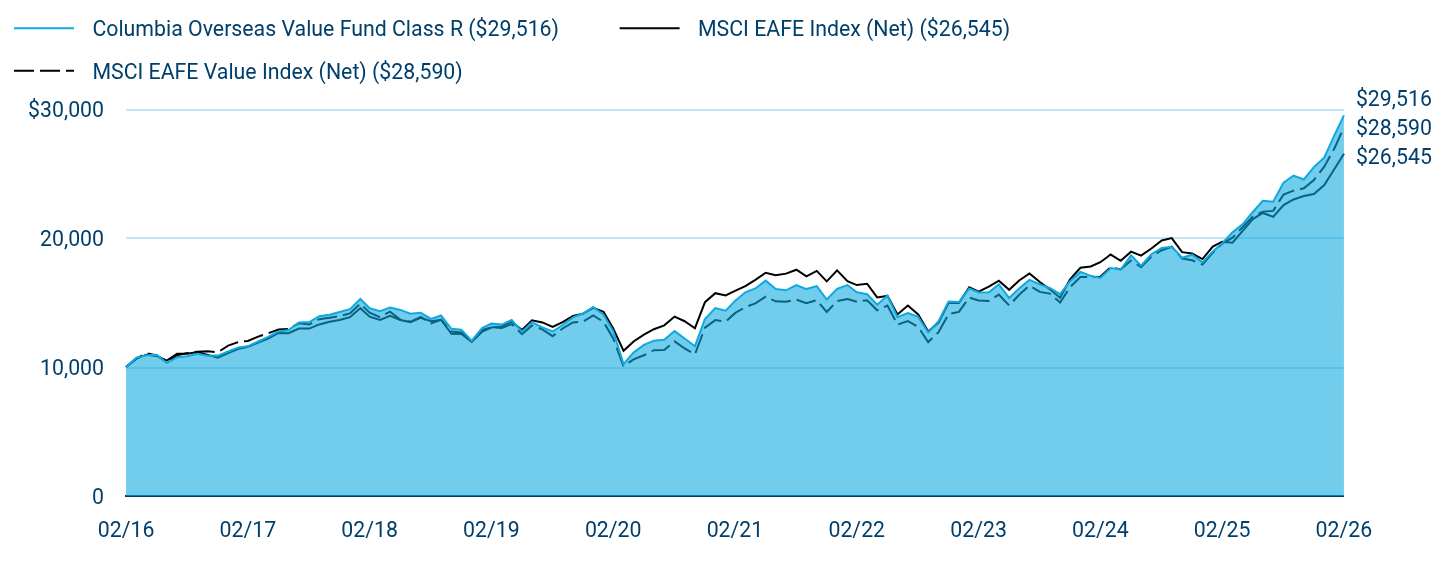
Table Summary
|
Columbia Overseas Value Fund Class R ($29,516) |
MSCI EAFE Index (Net) ($26,545) |
MSCI EAFE Value Index (Net) ($28,590) |
02/16 |
$10,000 |
$10,000 |
$10,000 |
03/16 |
$10,735 |
$10,651 |
$10,660 |
04/16 |
$10,913 |
$10,959 |
$11,080 |
05/16 |
$10,954 |
$10,859 |
$10,904 |
06/16 |
$10,310 |
$10,495 |
$10,362 |
07/16 |
$10,762 |
$11,027 |
$10,907 |
08/16 |
$10,845 |
$11,035 |
$11,083 |
09/16 |
$11,037 |
$11,170 |
$11,191 |
10/16 |
$10,872 |
$10,942 |
$11,217 |
11/16 |
$10,886 |
$10,724 |
$11,148 |
12/16 |
$11,202 |
$11,091 |
$11,658 |
01/17 |
$11,522 |
$11,412 |
$11,945 |
02/17 |
$11,606 |
$11,575 |
$12,027 |
03/17 |
$11,982 |
$11,894 |
$12,363 |
04/17 |
$12,344 |
$12,197 |
$12,622 |
05/17 |
$12,762 |
$12,644 |
$12,915 |
06/17 |
$12,873 |
$12,622 |
$12,954 |
07/17 |
$13,459 |
$12,986 |
$13,387 |
08/17 |
$13,487 |
$12,981 |
$13,303 |
09/17 |
$13,946 |
$13,304 |
$13,714 |
10/17 |
$14,058 |
$13,506 |
$13,820 |
11/17 |
$14,267 |
$13,648 |
$13,944 |
12/17 |
$14,489 |
$13,867 |
$14,158 |
01/18 |
$15,279 |
$14,563 |
$14,922 |
02/18 |
$14,561 |
$13,905 |
$14,213 |
03/18 |
$14,331 |
$13,655 |
$13,870 |
04/18 |
$14,618 |
$13,966 |
$14,298 |
05/18 |
$14,431 |
$13,652 |
$13,678 |
06/18 |
$14,129 |
$13,486 |
$13,505 |
07/18 |
$14,202 |
$13,818 |
$13,892 |
08/18 |
$13,735 |
$13,551 |
$13,387 |
09/18 |
$13,998 |
$13,668 |
$13,664 |
10/18 |
$12,962 |
$12,580 |
$12,757 |
11/18 |
$12,904 |
$12,565 |
$12,686 |
12/18 |
$12,032 |
$11,955 |
$12,065 |
01/19 |
$13,025 |
$12,740 |
$12,873 |
02/19 |
$13,366 |
$13,065 |
$13,087 |
03/19 |
$13,292 |
$13,147 |
$13,020 |
04/19 |
$13,648 |
$13,517 |
$13,324 |
05/19 |
$12,744 |
$12,868 |
$12,552 |
06/19 |
$13,485 |
$13,631 |
$13,221 |
07/19 |
$13,070 |
$13,458 |
$12,924 |
08/19 |
$12,758 |
$13,110 |
$12,393 |
09/19 |
$13,262 |
$13,485 |
$12,991 |
10/19 |
$13,855 |
$13,970 |
$13,460 |
11/19 |
$14,151 |
$14,127 |
$13,513 |
12/19 |
$14,663 |
$14,586 |
$14,006 |
01/20 |
$14,049 |
$14,282 |
$13,500 |
02/20 |
$12,792 |
$12,991 |
$12,222 |
03/20 |
$10,230 |
$11,257 |
$10,057 |
04/20 |
$11,120 |
$11,984 |
$10,595 |
05/20 |
$11,718 |
$12,506 |
$10,917 |
06/20 |
$12,046 |
$12,932 |
$11,307 |
07/20 |
$12,108 |
$13,233 |
$11,329 |
08/20 |
$12,787 |
$13,914 |
$11,992 |
09/20 |
$12,216 |
$13,552 |
$11,441 |
10/20 |
$11,615 |
$13,011 |
$10,980 |
11/20 |
$13,728 |
$15,028 |
$13,060 |
12/20 |
$14,571 |
$15,726 |
$13,638 |
01/21 |
$14,369 |
$15,559 |
$13,532 |
02/21 |
$15,131 |
$15,908 |
$14,177 |
03/21 |
$15,799 |
$16,274 |
$14,654 |
04/21 |
$16,095 |
$16,763 |
$14,934 |
05/21 |
$16,701 |
$17,310 |
$15,451 |
06/21 |
$16,046 |
$17,115 |
$15,095 |
07/21 |
$15,953 |
$17,244 |
$15,058 |
08/21 |
$16,358 |
$17,548 |
$15,229 |
09/21 |
$16,046 |
$17,039 |
$14,949 |
10/21 |
$16,280 |
$17,458 |
$15,187 |
11/21 |
$15,236 |
$16,645 |
$14,274 |
12/21 |
$16,069 |
$17,498 |
$15,124 |
01/22 |
$16,358 |
$16,652 |
$15,281 |
02/22 |
$15,796 |
$16,358 |
$15,074 |
03/22 |
$15,651 |
$16,463 |
$15,174 |
04/22 |
$14,833 |
$15,398 |
$14,407 |
05/22 |
$15,539 |
$15,513 |
$14,761 |
06/22 |
$13,870 |
$14,074 |
$13,291 |
07/22 |
$14,178 |
$14,775 |
$13,568 |
08/22 |
$13,886 |
$14,073 |
$13,110 |
09/22 |
$12,684 |
$12,757 |
$11,935 |
10/22 |
$13,561 |
$13,443 |
$12,705 |
11/22 |
$15,088 |
$14,957 |
$14,101 |
12/22 |
$15,038 |
$14,969 |
$14,279 |
01/23 |
$16,098 |
$16,181 |
$15,382 |
02/23 |
$15,788 |
$15,844 |
$15,166 |
03/23 |
$15,804 |
$16,236 |
$15,127 |
04/23 |
$16,408 |
$16,695 |
$15,614 |
05/23 |
$15,347 |
$15,988 |
$14,773 |
06/23 |
$16,100 |
$16,716 |
$15,604 |
07/23 |
$16,760 |
$17,257 |
$16,314 |
08/23 |
$16,413 |
$16,595 |
$15,830 |
09/23 |
$16,133 |
$16,029 |
$15,696 |
10/23 |
$15,654 |
$15,379 |
$15,005 |
11/23 |
$16,661 |
$16,806 |
$16,194 |
12/23 |
$17,377 |
$17,699 |
$16,985 |
01/24 |
$17,072 |
$17,801 |
$16,974 |
02/24 |
$16,903 |
$18,127 |
$17,005 |
03/24 |
$17,681 |
$18,723 |
$17,747 |
04/24 |
$17,563 |
$18,244 |
$17,565 |
05/24 |
$18,663 |
$18,950 |
$18,257 |
06/24 |
$17,854 |
$18,644 |
$17,749 |
07/24 |
$18,748 |
$19,191 |
$18,581 |
08/24 |
$19,229 |
$19,815 |
$19,057 |
09/24 |
$19,332 |
$19,998 |
$19,327 |
10/24 |
$18,473 |
$18,911 |
$18,419 |
11/24 |
$18,713 |
$18,803 |
$18,277 |
12/24 |
$18,118 |
$18,376 |
$17,951 |
01/25 |
$18,970 |
$19,341 |
$18,867 |
02/25 |
$19,592 |
$19,717 |
$19,570 |
03/25 |
$20,444 |
$19,637 |
$20,027 |
04/25 |
$21,066 |
$20,536 |
$20,839 |
05/25 |
$22,025 |
$21,476 |
$21,675 |
06/25 |
$22,896 |
$21,949 |
$22,052 |
07/25 |
$22,825 |
$21,641 |
$22,108 |
08/25 |
$24,299 |
$22,564 |
$23,374 |
09/25 |
$24,850 |
$22,996 |
$23,681 |
10/25 |
$24,548 |
$23,266 |
$23,861 |
11/25 |
$25,507 |
$23,411 |
$24,510 |
12/25 |
$26,241 |
$24,113 |
$25,535 |
01/26 |
$28,003 |
$25,371 |
$26,990 |
02/26 |
$29,516 |
$26,545 |
$28,590 |
|
| Average Annual Return [Table Text Block] |
|
Table Summary
Average Annual Total Returns (%) |
1 year |
5 years |
10 years |
Class RFootnote Reference(a) |
50.66 |
14.30 |
11.43 |
MSCI EAFE Index (Net) |
34.63 |
10.78 |
10.26 |
MSCI EAFE Value Index (Net) |
46.09 |
15.06 |
11.08 | |
| No Deduction of Taxes [Text Block] |
|
Performance does not reflect the deduction of taxes that a shareholder may pay on fund distributions or on the redemptions of fund shares.
|
| Updated Performance Information Location [Text Block] |
|
columbiathreadneedleus.com/investment-products/mutual-funds
|
| AssetsNet |
|
$ 6,862,784,805
|
| Holdings Count | Holding |
|
122
|
| Advisory Fees Paid, Amount |
|
$ 36,638,729
|
| InvestmentCompanyPortfolioTurnover |
|
57.00%
|
| Additional Fund Statistics [Text Block] |
|
Table Summary
Fund net assets |
$6,862,784,805 |
Total number of portfolio holdings |
122 |
Management services fees (represents 0.74% of Fund average net assets) |
$36,638,729 |
Portfolio turnover for the reporting period |
57% | |
| Holdings [Text Block] |
|
Table Summary
Japan |
21.9% |
|
United States |
12.4% |
|
France |
8.4% |
|
United Kingdom |
7.8% |
|
Netherlands |
5.0% |
|
Canada |
4.4% |
|
Hong Kong |
4.4% |
|
Spain |
4.0% |
|
Australia |
3.7% |
|
Germany |
3.5% |
|
Other |
24.7% |
|
Table Summary
Financials |
33.5% |
Consumer Staples |
12.2% |
Energy |
12.1% |
Industrials |
7.4% |
Materials |
7.2% |
Health Care |
6.2% |
Consumer Discretionary |
6.0% |
Information Technology |
4.6% |
Real Estate |
4.5% |
Utilities |
2.9% |
Other |
1.1% | |
| Largest Holdings [Text Block] |
|
Table Summary
Shell PLC |
3.1% |
Banco Santander SA |
3.0% |
TotalEnergies SE |
2.6% |
AXA SA |
2.4% |
Imperial Brands PLC |
2.3% |
Sumitomo Mitsui Financial Group, Inc. |
2.3% |
Northern Star Resources Ltd. |
2.1% |
Primo Brands Corp., Class A |
2.0% |
ASR Nederland NV |
1.9% |
Ping An Insurance Group Co. of China Ltd., Class H |
1.9% | |
| Material Fund Change [Text Block] |
|
|
| C000253709 |
|
|
| Shareholder Report [Line Items] |
|
|
| Fund Name |
|
Columbia Overseas Value Fund
|
| Class Name |
|
Class S
|
| Trading Symbol |
|
COSBX
|
| Annual or Semi-Annual Statement [Text Block] |
|
This annual shareholder report contains important information about Columbia Overseas Value Fund (the Fund) for the period of March 1, 2025 to February 28, 2026.
|
| Additional Information [Text Block] |
|
You can find additional information about the Fund at columbiathreadneedleus.com/resources/literature. You can also request more information by contacting us at 1-800-345-6611.
|
| Additional Information Phone Number |
|
1-800-345-6611
|
| Additional Information Website |
|
columbiathreadneedleus.com/resources/literature
|
| Expenses [Text Block] |
|
What were the Fund costs for the reporting period? (Based on a hypothetical $10,000 investment)
Table Summary
Class |
Cost of a $10,000 investment |
Cost paid as a percentage of a $10,000 investment |
Class S |
$113 |
0.90% | |
| Expenses Paid, Amount |
|
$ 113
|
| Expense Ratio, Percent |
|
0.90%
|
| Factors Affecting Performance [Text Block] |
|
Management's Discussion of Fund Performance The performance of Class S shares for the period presented is shown in the Average Annual Total Returns table. Top Performance ContributorsStock selection | Selections in the financials, energy and materials sectors boosted the Fund’s relative performance during the annual period. Allocations | Smaller allocations to the communication services and materials sectors buoyed the Fund’s relative performance during the annual period. Individual holdings | Positions in Energy Fuels, an American rare earths and uranium company; Northern Star Resources, an Australian gold miner; Piraeus Bank, a Greek bank; Pan American Silver, a Canadian silver miner; and Impala Platinum, a South African platinum miner, contributed to the Fund’s relative performance during the annual period. Top Performance DetractorsStock selection | Selections in the information technology, health care and consumer discretionary sectors hurt the Fund’s relative performance during the annual period. Allocations | Larger weightings in the information technology and consumer staples sectors and a smaller weighting in the financials sector detracted from the Fund’s relative performance during the annual period. Individual holdings | Positions in Check Point Software Technologies, an Israeli cybersecurity company; Burford Capital, a litigation finance company; Flutter Entertainment, an Irish-American gambling company; Sankyo, a Japanese pachinko machine maker; and an overweight in MatsukiyoCocokara, a Japanese pharmacy chain, detracted from the Fund’s relative performance during the annual period. |
| Performance Past Does Not Indicate Future [Text] |
|
The Fund's past performance is not a good predictor of the Fund's future performance.
|
| Line Graph [Table Text Block] |
|
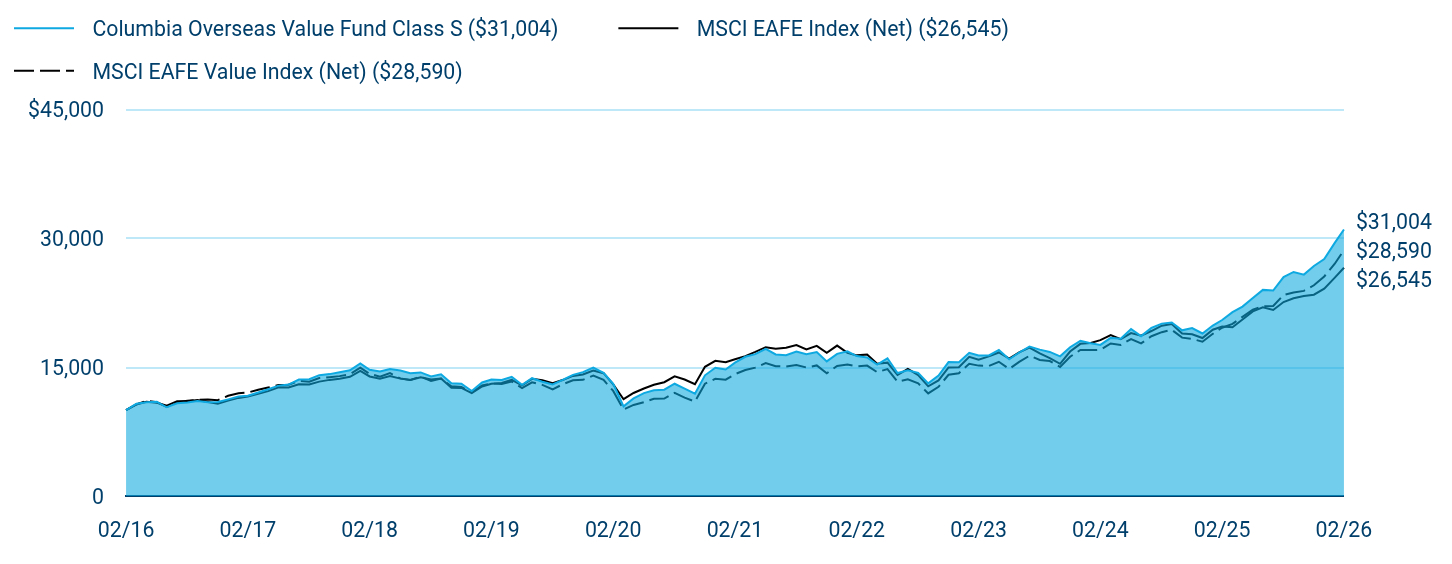
Table Summary
|
Columbia Overseas Value Fund Class S ($31,004) |
MSCI EAFE Index (Net) ($26,545) |
MSCI EAFE Value Index (Net) ($28,590) |
02/16 |
$10,000 |
$10,000 |
$10,000 |
03/16 |
$10,737 |
$10,651 |
$10,660 |
04/16 |
$10,912 |
$10,959 |
$11,080 |
05/16 |
$10,965 |
$10,859 |
$10,904 |
06/16 |
$10,322 |
$10,495 |
$10,362 |
07/16 |
$10,777 |
$11,027 |
$10,907 |
08/16 |
$10,871 |
$11,035 |
$11,083 |
09/16 |
$11,059 |
$11,170 |
$11,191 |
10/16 |
$10,912 |
$10,942 |
$11,217 |
11/16 |
$10,925 |
$10,724 |
$11,148 |
12/16 |
$11,239 |
$11,091 |
$11,658 |
01/17 |
$11,581 |
$11,412 |
$11,945 |
02/17 |
$11,663 |
$11,575 |
$12,027 |
03/17 |
$12,046 |
$11,894 |
$12,363 |
04/17 |
$12,415 |
$12,197 |
$12,622 |
05/17 |
$12,839 |
$12,644 |
$12,915 |
06/17 |
$12,962 |
$12,622 |
$12,954 |
07/17 |
$13,550 |
$12,986 |
$13,387 |
08/17 |
$13,577 |
$12,981 |
$13,303 |
09/17 |
$14,055 |
$13,304 |
$13,714 |
10/17 |
$14,178 |
$13,506 |
$13,820 |
11/17 |
$14,384 |
$13,648 |
$13,944 |
12/17 |
$14,617 |
$13,867 |
$14,158 |
01/18 |
$15,423 |
$14,563 |
$14,922 |
02/18 |
$14,688 |
$13,905 |
$14,213 |
03/18 |
$14,475 |
$13,655 |
$13,870 |
04/18 |
$14,773 |
$13,966 |
$14,298 |
05/18 |
$14,589 |
$13,652 |
$13,678 |
06/18 |
$14,289 |
$13,486 |
$13,505 |
07/18 |
$14,375 |
$13,818 |
$13,892 |
08/18 |
$13,901 |
$13,551 |
$13,387 |
09/18 |
$14,159 |
$13,668 |
$13,664 |
10/18 |
$13,125 |
$12,580 |
$12,757 |
11/18 |
$13,068 |
$12,565 |
$12,686 |
12/18 |
$12,210 |
$11,955 |
$12,065 |
01/19 |
$13,207 |
$12,740 |
$12,873 |
02/19 |
$13,559 |
$13,065 |
$13,087 |
03/19 |
$13,500 |
$13,147 |
$13,020 |
04/19 |
$13,852 |
$13,517 |
$13,324 |
05/19 |
$12,943 |
$12,868 |
$12,552 |
06/19 |
$13,699 |
$13,631 |
$13,221 |
07/19 |
$13,288 |
$13,458 |
$12,924 |
08/19 |
$12,980 |
$13,110 |
$12,393 |
09/19 |
$13,508 |
$13,485 |
$12,991 |
10/19 |
$14,095 |
$13,970 |
$13,460 |
11/19 |
$14,403 |
$14,127 |
$13,513 |
12/19 |
$14,937 |
$14,586 |
$14,006 |
01/20 |
$14,328 |
$14,282 |
$13,500 |
02/20 |
$13,049 |
$12,991 |
$12,222 |
03/20 |
$10,430 |
$11,257 |
$10,057 |
04/20 |
$11,359 |
$11,984 |
$10,595 |
05/20 |
$11,968 |
$12,506 |
$10,917 |
06/20 |
$12,294 |
$12,932 |
$11,307 |
07/20 |
$12,370 |
$13,233 |
$11,329 |
08/20 |
$13,059 |
$13,914 |
$11,992 |
09/20 |
$12,493 |
$13,552 |
$11,441 |
10/20 |
$11,896 |
$13,011 |
$10,980 |
11/20 |
$14,039 |
$15,028 |
$13,060 |
12/20 |
$14,925 |
$15,726 |
$13,638 |
01/21 |
$14,708 |
$15,559 |
$13,532 |
02/21 |
$15,514 |
$15,908 |
$14,177 |
03/21 |
$16,196 |
$16,274 |
$14,654 |
04/21 |
$16,506 |
$16,763 |
$14,934 |
05/21 |
$17,126 |
$17,310 |
$15,451 |
06/21 |
$16,469 |
$17,115 |
$15,095 |
07/21 |
$16,376 |
$17,244 |
$15,058 |
08/21 |
$16,811 |
$17,548 |
$15,229 |
09/21 |
$16,500 |
$17,039 |
$14,949 |
10/21 |
$16,734 |
$17,458 |
$15,187 |
11/21 |
$15,661 |
$16,645 |
$14,274 |
12/21 |
$16,532 |
$17,498 |
$15,124 |
01/22 |
$16,837 |
$16,652 |
$15,281 |
02/22 |
$16,275 |
$16,358 |
$15,074 |
03/22 |
$16,114 |
$16,463 |
$15,174 |
04/22 |
$15,279 |
$15,398 |
$14,407 |
05/22 |
$16,018 |
$15,513 |
$14,761 |
06/22 |
$14,299 |
$14,074 |
$13,291 |
07/22 |
$14,624 |
$14,775 |
$13,568 |
08/22 |
$14,332 |
$14,073 |
$13,110 |
09/22 |
$13,097 |
$12,757 |
$11,935 |
10/22 |
$14,007 |
$13,443 |
$12,705 |
11/22 |
$15,583 |
$14,957 |
$14,101 |
12/22 |
$15,547 |
$14,969 |
$14,279 |
01/23 |
$16,661 |
$16,181 |
$15,382 |
02/23 |
$16,350 |
$15,844 |
$15,166 |
03/23 |
$16,350 |
$16,236 |
$15,127 |
04/23 |
$16,988 |
$16,695 |
$15,614 |
05/23 |
$15,907 |
$15,988 |
$14,773 |
06/23 |
$16,693 |
$16,716 |
$15,604 |
07/23 |
$17,372 |
$17,257 |
$16,314 |
08/23 |
$17,024 |
$16,595 |
$15,830 |
09/23 |
$16,759 |
$16,029 |
$15,696 |
10/23 |
$16,245 |
$15,379 |
$15,005 |
11/23 |
$17,306 |
$16,806 |
$16,194 |
12/23 |
$18,050 |
$17,699 |
$16,985 |
01/24 |
$17,760 |
$17,801 |
$16,974 |
02/24 |
$17,572 |
$18,127 |
$17,005 |
03/24 |
$18,391 |
$18,723 |
$17,747 |
04/24 |
$18,288 |
$18,244 |
$17,565 |
05/24 |
$19,431 |
$18,950 |
$18,257 |
06/24 |
$18,596 |
$18,644 |
$17,749 |
07/24 |
$19,550 |
$19,191 |
$18,581 |
08/24 |
$20,052 |
$19,815 |
$19,057 |
09/24 |
$20,173 |
$19,998 |
$19,327 |
10/24 |
$19,272 |
$18,911 |
$18,419 |
11/24 |
$19,532 |
$18,803 |
$18,277 |
12/24 |
$18,906 |
$18,376 |
$17,951 |
01/25 |
$19,823 |
$19,341 |
$18,867 |
02/25 |
$20,470 |
$19,717 |
$19,570 |
03/25 |
$21,386 |
$19,637 |
$20,027 |
04/25 |
$22,033 |
$20,536 |
$20,839 |
05/25 |
$23,039 |
$21,476 |
$21,675 |
06/25 |
$23,974 |
$21,949 |
$22,052 |
07/25 |
$23,902 |
$21,641 |
$22,108 |
08/25 |
$25,466 |
$22,564 |
$23,374 |
09/25 |
$26,059 |
$22,996 |
$23,681 |
10/25 |
$25,753 |
$23,266 |
$23,861 |
11/25 |
$26,760 |
$23,411 |
$24,510 |
12/25 |
$27,550 |
$24,113 |
$25,535 |
01/26 |
$29,413 |
$25,371 |
$26,990 |
02/26 |
$31,004 |
$26,545 |
$28,590 |
|
| Average Annual Return [Table Text Block] |
|
Table Summary
Average Annual Total Returns (%) |
1 year |
5 years |
10 years |
Class SFootnote Reference(a) |
51.46 |
14.85 |
11.98 |
MSCI EAFE Index (Net) |
34.63 |
10.78 |
10.26 |
MSCI EAFE Value Index (Net) |
46.09 |
15.06 |
11.08 | |
| No Deduction of Taxes [Text Block] |
|
Performance does not reflect the deduction of taxes that a shareholder may pay on fund distributions or on the redemptions of fund shares.
|
| Updated Performance Information Location [Text Block] |
|
columbiathreadneedleus.com/investment-products/mutual-funds
|
| AssetsNet |
|
$ 6,862,784,805
|
| Holdings Count | Holding |
|
122
|
| Advisory Fees Paid, Amount |
|
$ 36,638,729
|
| InvestmentCompanyPortfolioTurnover |
|
57.00%
|
| Additional Fund Statistics [Text Block] |
|
Table Summary
Fund net assets |
$6,862,784,805 |
Total number of portfolio holdings |
122 |
Management services fees (represents 0.74% of Fund average net assets) |
$36,638,729 |
Portfolio turnover for the reporting period |
57% | |
| Holdings [Text Block] |
|
Table Summary
Japan |
21.9% |
|
United States |
12.4% |
|
France |
8.4% |
|
United Kingdom |
7.8% |
|
Netherlands |
5.0% |
|
Canada |
4.4% |
|
Hong Kong |
4.4% |
|
Spain |
4.0% |
|
Australia |
3.7% |
|
Germany |
3.5% |
|
Other |
24.7% |
|
Table Summary
Financials |
33.5% |
Consumer Staples |
12.2% |
Energy |
12.1% |
Industrials |
7.4% |
Materials |
7.2% |
Health Care |
6.2% |
Consumer Discretionary |
6.0% |
Information Technology |
4.6% |
Real Estate |
4.5% |
Utilities |
2.9% |
Other |
1.1% | |
| Largest Holdings [Text Block] |
|
Table Summary
Shell PLC |
3.1% |
Banco Santander SA |
3.0% |
TotalEnergies SE |
2.6% |
AXA SA |
2.4% |
Imperial Brands PLC |
2.3% |
Sumitomo Mitsui Financial Group, Inc. |
2.3% |
Northern Star Resources Ltd. |
2.1% |
Primo Brands Corp., Class A |
2.0% |
ASR Nederland NV |
1.9% |
Ping An Insurance Group Co. of China Ltd., Class H |
1.9% | |
| Material Fund Change [Text Block] |
|
|
| C000159975 |
|
|
| Shareholder Report [Line Items] |
|
|
| Fund Name |
|
Columbia Overseas Value Fund
|
| Class Name |
|
Institutional 2 Class
|
| Trading Symbol |
|
COSSX
|
| Annual or Semi-Annual Statement [Text Block] |
|
This annual shareholder report contains important information about Columbia Overseas Value Fund (the Fund) for the period of March 1, 2025 to February 28, 2026.
|
| Additional Information [Text Block] |
|
You can find additional information about the Fund at columbiathreadneedleus.com/resources/literature. You can also request more information by contacting us at 1-800-345-6611.
|
| Additional Information Phone Number |
|
1-800-345-6611
|
| Additional Information Website |
|
columbiathreadneedleus.com/resources/literature
|
| Expenses [Text Block] |
|
What were the Fund costs for the reporting period? (Based on a hypothetical $10,000 investment)
Table Summary
Class |
Cost of a $10,000 investment |
Cost paid as a percentage of a $10,000 investment |
Institutional 2 Class |
$103 |
0.82% | |
| Expenses Paid, Amount |
|
$ 103
|
| Expense Ratio, Percent |
|
0.82%
|
| Factors Affecting Performance [Text Block] |
|
Management's Discussion of Fund Performance The performance of Institutional 2 Class shares for the period presented is shown in the Average Annual Total Returns table. Top Performance ContributorsStock selection | Selections in the financials, energy and materials sectors boosted the Fund’s relative performance during the annual period. Allocations | Smaller allocations to the communication services and materials sectors buoyed the Fund’s relative performance during the annual period. Individual holdings | Positions in Energy Fuels, an American rare earths and uranium company; Northern Star Resources, an Australian gold miner; Piraeus Bank, a Greek bank; Pan American Silver, a Canadian silver miner; and Impala Platinum, a South African platinum miner, contributed to the Fund’s relative performance during the annual period. Top Performance DetractorsStock selection | Selections in the information technology, health care and consumer discretionary sectors hurt the Fund’s relative performance during the annual period. Allocations | Larger weightings in the information technology and consumer staples sectors and a smaller weighting in the financials sector detracted from the Fund’s relative performance during the annual period. Individual holdings | Positions in Check Point Software Technologies, an Israeli cybersecurity company; Burford Capital, a litigation finance company; Flutter Entertainment, an Irish-American gambling company; Sankyo, a Japanese pachinko machine maker; and an overweight in MatsukiyoCocokara, a Japanese pharmacy chain, detracted from the Fund’s relative performance during the annual period. |
| Performance Past Does Not Indicate Future [Text] |
|
The Fund's past performance is not a good predictor of the Fund's future performance.
|
| Line Graph [Table Text Block] |
|

Table Summary
|
Columbia Overseas Value Fund Institutional 2 Class ($31,332) |
MSCI EAFE Index (Net) ($26,545) |
MSCI EAFE Value Index (Net) ($28,590) |
02/16 |
$10,000 |
$10,000 |
$10,000 |
03/16 |
$10,741 |
$10,651 |
$10,660 |
04/16 |
$10,930 |
$10,959 |
$11,080 |
05/16 |
$10,970 |
$10,859 |
$10,904 |
06/16 |
$10,337 |
$10,495 |
$10,362 |
07/16 |
$10,795 |
$11,027 |
$10,907 |
08/16 |
$10,889 |
$11,035 |
$11,083 |
09/16 |
$11,078 |
$11,170 |
$11,191 |
10/16 |
$10,930 |
$10,942 |
$11,217 |
11/16 |
$10,943 |
$10,724 |
$11,148 |
12/16 |
$11,266 |
$11,091 |
$11,658 |
01/17 |
$11,596 |
$11,412 |
$11,945 |
02/17 |
$11,679 |
$11,575 |
$12,027 |
03/17 |
$12,078 |
$11,894 |
$12,363 |
04/17 |
$12,450 |
$12,197 |
$12,622 |
05/17 |
$12,877 |
$12,644 |
$12,915 |
06/17 |
$13,001 |
$12,622 |
$12,954 |
07/17 |
$13,593 |
$12,986 |
$13,387 |
08/17 |
$13,621 |
$12,981 |
$13,303 |
09/17 |
$14,103 |
$13,304 |
$13,714 |
10/17 |
$14,227 |
$13,506 |
$13,820 |
11/17 |
$14,433 |
$13,648 |
$13,944 |
12/17 |
$14,670 |
$13,867 |
$14,158 |
01/18 |
$15,484 |
$14,563 |
$14,922 |
02/18 |
$14,742 |
$13,905 |
$14,213 |
03/18 |
$14,528 |
$13,655 |
$13,870 |
04/18 |
$14,827 |
$13,966 |
$14,298 |
05/18 |
$14,642 |
$13,652 |
$13,678 |
06/18 |
$14,342 |
$13,486 |
$13,505 |
07/18 |
$14,429 |
$13,818 |
$13,892 |
08/18 |
$13,966 |
$13,551 |
$13,387 |
09/18 |
$14,226 |
$13,668 |
$13,664 |
10/18 |
$13,183 |
$12,580 |
$12,757 |
11/18 |
$13,125 |
$12,565 |
$12,686 |
12/18 |
$12,259 |
$11,955 |
$12,065 |
01/19 |
$13,265 |
$12,740 |
$12,873 |
02/19 |
$13,621 |
$13,065 |
$13,087 |
03/19 |
$13,561 |
$13,147 |
$13,020 |
04/19 |
$13,917 |
$13,517 |
$13,324 |
05/19 |
$13,014 |
$12,868 |
$12,552 |
06/19 |
$13,765 |
$13,631 |
$13,221 |
07/19 |
$13,350 |
$13,458 |
$12,924 |
08/19 |
$13,039 |
$13,110 |
$12,393 |
09/19 |
$13,572 |
$13,485 |
$12,991 |
10/19 |
$14,165 |
$13,970 |
$13,460 |
11/19 |
$14,476 |
$14,127 |
$13,513 |
12/19 |
$15,014 |
$14,586 |
$14,006 |
01/20 |
$14,398 |
$14,282 |
$13,500 |
02/20 |
$13,120 |
$12,991 |
$12,222 |
03/20 |
$10,486 |
$11,257 |
$10,057 |
04/20 |
$11,410 |
$11,984 |
$10,595 |
05/20 |
$12,026 |
$12,506 |
$10,917 |
06/20 |
$12,371 |
$12,932 |
$11,307 |
07/20 |
$12,449 |
$13,233 |
$11,329 |
08/20 |
$13,146 |
$13,914 |
$11,992 |
09/20 |
$12,557 |
$13,552 |
$11,441 |
10/20 |
$11,953 |
$13,011 |
$10,980 |
11/20 |
$14,136 |
$15,028 |
$13,060 |
12/20 |
$15,014 |
$15,726 |
$13,638 |
01/21 |
$14,810 |
$15,559 |
$13,532 |
02/21 |
$15,610 |
$15,908 |
$14,177 |
03/21 |
$16,301 |
$16,274 |
$14,654 |
04/21 |
$16,614 |
$16,763 |
$14,934 |
05/21 |
$17,242 |
$17,310 |
$15,451 |
06/21 |
$16,580 |
$17,115 |
$15,095 |
07/21 |
$16,485 |
$17,244 |
$15,058 |
08/21 |
$16,926 |
$17,548 |
$15,229 |
09/21 |
$16,611 |
$17,039 |
$14,949 |
10/21 |
$16,847 |
$17,458 |
$15,187 |
11/21 |
$15,777 |
$16,645 |
$14,274 |
12/21 |
$16,655 |
$17,498 |
$15,124 |
01/22 |
$16,964 |
$16,652 |
$15,281 |
02/22 |
$16,394 |
$16,358 |
$15,074 |
03/22 |
$16,231 |
$16,463 |
$15,174 |
04/22 |
$15,401 |
$15,398 |
$14,407 |
05/22 |
$16,134 |
$15,513 |
$14,761 |
06/22 |
$14,408 |
$14,074 |
$13,291 |
07/22 |
$14,738 |
$14,775 |
$13,568 |
08/22 |
$14,441 |
$14,073 |
$13,110 |
09/22 |
$13,206 |
$12,757 |
$11,935 |
10/22 |
$14,112 |
$13,443 |
$12,705 |
11/22 |
$15,709 |
$14,957 |
$14,101 |
12/22 |
$15,668 |
$14,969 |
$14,279 |
01/23 |
$16,798 |
$16,181 |
$15,382 |
02/23 |
$16,482 |
$15,844 |
$15,166 |
03/23 |
$16,482 |
$16,236 |
$15,127 |
04/23 |
$17,130 |
$16,695 |
$15,614 |
05/23 |
$16,033 |
$15,988 |
$14,773 |
06/23 |
$16,832 |
$16,716 |
$15,604 |
07/23 |
$17,522 |
$17,257 |
$16,314 |
08/23 |
$17,169 |
$16,595 |
$15,830 |
09/23 |
$16,900 |
$16,029 |
$15,696 |
10/23 |
$16,395 |
$15,379 |
$15,005 |
11/23 |
$17,471 |
$16,806 |
$16,194 |
12/23 |
$18,203 |
$17,699 |
$16,985 |
01/24 |
$17,909 |
$17,801 |
$16,974 |
02/24 |
$17,736 |
$18,127 |
$17,005 |
03/24 |
$18,567 |
$18,723 |
$17,747 |
04/24 |
$18,446 |
$18,244 |
$17,565 |
05/24 |
$19,606 |
$18,950 |
$18,257 |
06/24 |
$18,760 |
$18,644 |
$17,749 |
07/24 |
$19,728 |
$19,191 |
$18,581 |
08/24 |
$20,239 |
$19,815 |
$19,057 |
09/24 |
$20,362 |
$19,998 |
$19,327 |
10/24 |
$19,464 |
$18,911 |
$18,419 |
11/24 |
$19,711 |
$18,803 |
$18,277 |
12/24 |
$19,089 |
$18,376 |
$17,951 |
01/25 |
$20,003 |
$19,341 |
$18,867 |
02/25 |
$20,678 |
$19,717 |
$19,570 |
03/25 |
$21,592 |
$19,637 |
$20,027 |
04/25 |
$22,249 |
$20,536 |
$20,839 |
05/25 |
$23,272 |
$21,476 |
$21,675 |
06/25 |
$24,222 |
$21,949 |
$22,052 |
07/25 |
$24,149 |
$21,641 |
$22,108 |
08/25 |
$25,720 |
$22,564 |
$23,374 |
09/25 |
$26,323 |
$22,996 |
$23,681 |
10/25 |
$26,012 |
$23,266 |
$23,861 |
11/25 |
$27,035 |
$23,411 |
$24,510 |
12/25 |
$27,837 |
$24,113 |
$25,535 |
01/26 |
$29,713 |
$25,371 |
$26,990 |
02/26 |
$31,332 |
$26,545 |
$28,590 |
|
| Average Annual Return [Table Text Block] |
|
Table Summary
Average Annual Total Returns (%) |
1 year |
5 years |
10 years |
Institutional 2 Class |
51.52 |
14.95 |
12.10 |
MSCI EAFE Index (Net) |
34.63 |
10.78 |
10.26 |
MSCI EAFE Value Index (Net) |
46.09 |
15.06 |
11.08 | |
| No Deduction of Taxes [Text Block] |
|
Performance does not reflect the deduction of taxes that a shareholder may pay on fund distributions or on the redemptions of fund shares.
|
| Updated Performance Information Location [Text Block] |
|
columbiathreadneedleus.com/investment-products/mutual-funds
|
| AssetsNet |
|
$ 6,862,784,805
|
| Holdings Count | Holding |
|
122
|
| Advisory Fees Paid, Amount |
|
$ 36,638,729
|
| InvestmentCompanyPortfolioTurnover |
|
57.00%
|
| Additional Fund Statistics [Text Block] |
|
Table Summary
Fund net assets |
$6,862,784,805 |
Total number of portfolio holdings |
122 |
Management services fees (represents 0.74% of Fund average net assets) |
$36,638,729 |
Portfolio turnover for the reporting period |
57% | |
| Holdings [Text Block] |
|
Table Summary
Japan |
21.9% |
|
United States |
12.4% |
|
France |
8.4% |
|
United Kingdom |
7.8% |
|
Netherlands |
5.0% |
|
Canada |
4.4% |
|
Hong Kong |
4.4% |
|
Spain |
4.0% |
|
Australia |
3.7% |
|
Germany |
3.5% |
|
Other |
24.7% |
|
Table Summary
Financials |
33.5% |
Consumer Staples |
12.2% |
Energy |
12.1% |
Industrials |
7.4% |
Materials |
7.2% |
Health Care |
6.2% |
Consumer Discretionary |
6.0% |
Information Technology |
4.6% |
Real Estate |
4.5% |
Utilities |
2.9% |
Other |
1.1% | |
| Largest Holdings [Text Block] |
|
Table Summary
Shell PLC |
3.1% |
Banco Santander SA |
3.0% |
TotalEnergies SE |
2.6% |
AXA SA |
2.4% |
Imperial Brands PLC |
2.3% |
Sumitomo Mitsui Financial Group, Inc. |
2.3% |
Northern Star Resources Ltd. |
2.1% |
Primo Brands Corp., Class A |
2.0% |
ASR Nederland NV |
1.9% |
Ping An Insurance Group Co. of China Ltd., Class H |
1.9% | |
| Material Fund Change [Text Block] |
|
|
| C000159976 |
|
|
| Shareholder Report [Line Items] |
|
|
| Fund Name |
|
Columbia Overseas Value Fund
|
| Class Name |
|
Institutional 3 Class
|
| Trading Symbol |
|
COSYX
|
| Annual or Semi-Annual Statement [Text Block] |
|
This annual shareholder report contains important information about Columbia Overseas Value Fund (the Fund) for the period of March 1, 2025 to February 28, 2026.
|
| Additional Information [Text Block] |
|
You can find additional information about the Fund at columbiathreadneedleus.com/resources/literature. You can also request more information by contacting us at 1-800-345-6611.
|
| Additional Information Phone Number |
|
1-800-345-6611
|
| Additional Information Website |
|
columbiathreadneedleus.com/resources/literature
|
| Expenses [Text Block] |
|
What were the Fund costs for the reporting period? (Based on a hypothetical $10,000 investment)
Table Summary
Class |
Cost of a $10,000 investment |
Cost paid as a percentage of a $10,000 investment |
Institutional 3 Class |
$97 |
0.77% | |
| Expenses Paid, Amount |
|
$ 97
|
| Expense Ratio, Percent |
|
0.77%
|
| Factors Affecting Performance [Text Block] |
|
Management's Discussion of Fund Performance The performance of Institutional 3 Class shares for the period presented is shown in the Average Annual Total Returns table. Top Performance ContributorsStock selection | Selections in the financials, energy and materials sectors boosted the Fund’s relative performance during the annual period. Allocations | Smaller allocations to the communication services and materials sectors buoyed the Fund’s relative performance during the annual period. Individual holdings | Positions in Energy Fuels, an American rare earths and uranium company; Northern Star Resources, an Australian gold miner; Piraeus Bank, a Greek bank; Pan American Silver, a Canadian silver miner; and Impala Platinum, a South African platinum miner, contributed to the Fund’s relative performance during the annual period. Top Performance DetractorsStock selection | Selections in the information technology, health care and consumer discretionary sectors hurt the Fund’s relative performance during the annual period. Allocations | Larger weightings in the information technology and consumer staples sectors and a smaller weighting in the financials sector detracted from the Fund’s relative performance during the annual period. Individual holdings | Positions in Check Point Software Technologies, an Israeli cybersecurity company; Burford Capital, a litigation finance company; Flutter Entertainment, an Irish-American gambling company; Sankyo, a Japanese pachinko machine maker; and an overweight in MatsukiyoCocokara, a Japanese pharmacy chain, detracted from the Fund’s relative performance during the annual period. |
| Performance Past Does Not Indicate Future [Text] |
|
The Fund's past performance is not a good predictor of the Fund's future performance.
|
| Line Graph [Table Text Block] |
|
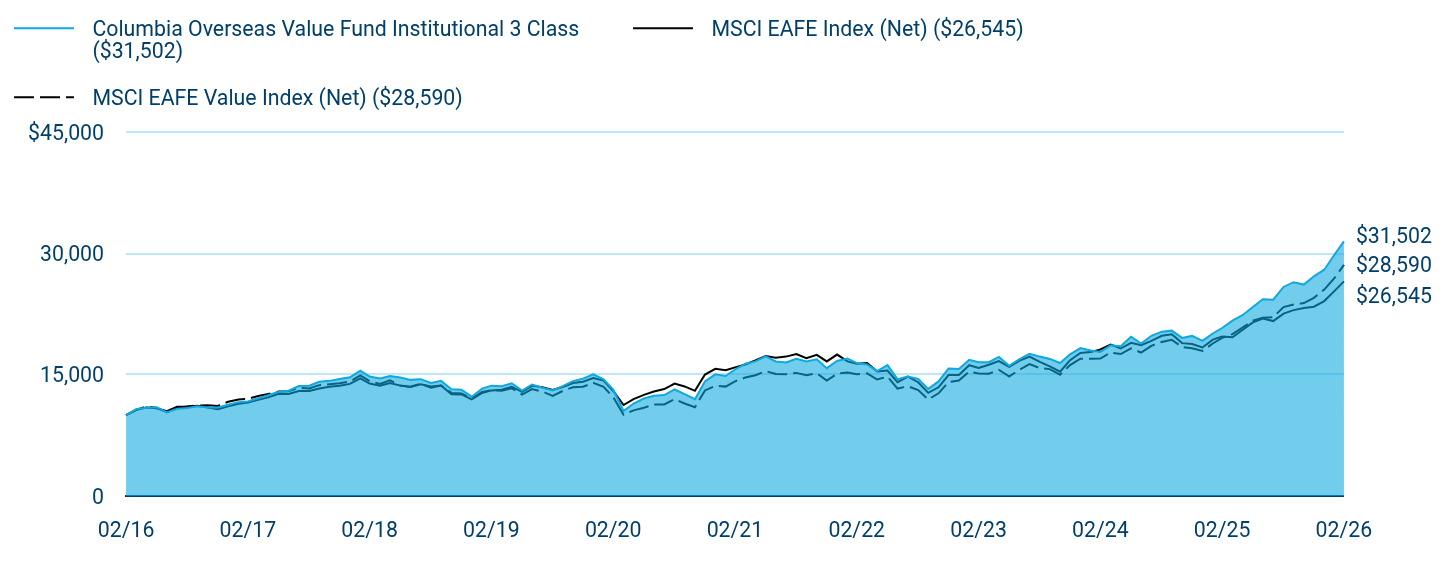
Table Summary
|
Columbia Overseas Value Fund Institutional 3 Class ($31,502) |
MSCI EAFE Index (Net) ($26,545) |
MSCI EAFE Value Index (Net) ($28,590) |
02/16 |
$10,000 |
$10,000 |
$10,000 |
03/16 |
$10,755 |
$10,651 |
$10,660 |
04/16 |
$10,930 |
$10,959 |
$11,080 |
05/16 |
$10,984 |
$10,859 |
$10,904 |
06/16 |
$10,337 |
$10,495 |
$10,362 |
07/16 |
$10,795 |
$11,027 |
$10,907 |
08/16 |
$10,889 |
$11,035 |
$11,083 |
09/16 |
$11,092 |
$11,170 |
$11,191 |
10/16 |
$10,943 |
$10,942 |
$11,217 |
11/16 |
$10,957 |
$10,724 |
$11,148 |
12/16 |
$11,282 |
$11,091 |
$11,658 |
01/17 |
$11,612 |
$11,412 |
$11,945 |
02/17 |
$11,695 |
$11,575 |
$12,027 |
03/17 |
$12,095 |
$11,894 |
$12,363 |
04/17 |
$12,467 |
$12,197 |
$12,622 |
05/17 |
$12,894 |
$12,644 |
$12,915 |
06/17 |
$13,018 |
$12,622 |
$12,954 |
07/17 |
$13,610 |
$12,986 |
$13,387 |
08/17 |
$13,637 |
$12,981 |
$13,303 |
09/17 |
$14,120 |
$13,304 |
$13,714 |
10/17 |
$14,243 |
$13,506 |
$13,820 |
11/17 |
$14,464 |
$13,648 |
$13,944 |
12/17 |
$14,693 |
$13,867 |
$14,158 |
01/18 |
$15,507 |
$14,563 |
$14,922 |
02/18 |
$14,779 |
$13,905 |
$14,213 |
03/18 |
$14,550 |
$13,655 |
$13,870 |
04/18 |
$14,850 |
$13,966 |
$14,298 |
05/18 |
$14,665 |
$13,652 |
$13,678 |
06/18 |
$14,366 |
$13,486 |
$13,505 |
07/18 |
$14,453 |
$13,818 |
$13,892 |
08/18 |
$13,989 |
$13,551 |
$13,387 |
09/18 |
$14,250 |
$13,668 |
$13,664 |
10/18 |
$13,206 |
$12,580 |
$12,757 |
11/18 |
$13,148 |
$12,565 |
$12,686 |
12/18 |
$12,286 |
$11,955 |
$12,065 |
01/19 |
$13,293 |
$12,740 |
$12,873 |
02/19 |
$13,649 |
$13,065 |
$13,087 |
03/19 |
$13,590 |
$13,147 |
$13,020 |
04/19 |
$13,946 |
$13,517 |
$13,324 |
05/19 |
$13,042 |
$12,868 |
$12,552 |
06/19 |
$13,794 |
$13,631 |
$13,221 |
07/19 |
$13,393 |
$13,458 |
$12,924 |
08/19 |
$13,067 |
$13,110 |
$12,393 |
09/19 |
$13,601 |
$13,485 |
$12,991 |
10/19 |
$14,209 |
$13,970 |
$13,460 |
11/19 |
$14,521 |
$14,127 |
$13,513 |
12/19 |
$15,063 |
$14,586 |
$14,006 |
01/20 |
$14,431 |
$14,282 |
$13,500 |
02/20 |
$13,151 |
$12,991 |
$12,222 |
03/20 |
$10,515 |
$11,257 |
$10,057 |
04/20 |
$11,440 |
$11,984 |
$10,595 |
05/20 |
$12,057 |
$12,506 |
$10,917 |
06/20 |
$12,402 |
$12,932 |
$11,307 |
07/20 |
$12,480 |
$13,233 |
$11,329 |
08/20 |
$13,177 |
$13,914 |
$11,992 |
09/20 |
$12,604 |
$13,552 |
$11,441 |
10/20 |
$11,984 |
$13,011 |
$10,980 |
11/20 |
$14,169 |
$15,028 |
$13,060 |
12/20 |
$15,053 |
$15,726 |
$13,638 |
01/21 |
$14,849 |
$15,559 |
$13,532 |
02/21 |
$15,650 |
$15,908 |
$14,177 |
03/21 |
$16,358 |
$16,274 |
$14,654 |
04/21 |
$16,656 |
$16,763 |
$14,934 |
05/21 |
$17,285 |
$17,310 |
$15,451 |
06/21 |
$16,638 |
$17,115 |
$15,095 |
07/21 |
$16,528 |
$17,244 |
$15,058 |
08/21 |
$16,970 |
$17,548 |
$15,229 |
09/21 |
$16,654 |
$17,039 |
$14,949 |
10/21 |
$16,907 |
$17,458 |
$15,187 |
11/21 |
$15,818 |
$16,645 |
$14,274 |
12/21 |
$16,705 |
$17,498 |
$15,124 |
01/22 |
$17,015 |
$16,652 |
$15,281 |
02/22 |
$16,444 |
$16,358 |
$15,074 |
03/22 |
$16,281 |
$16,463 |
$15,174 |
04/22 |
$15,449 |
$15,398 |
$14,407 |
05/22 |
$16,199 |
$15,513 |
$14,761 |
06/22 |
$14,454 |
$14,074 |
$13,291 |
07/22 |
$14,784 |
$14,775 |
$13,568 |
08/22 |
$14,487 |
$14,073 |
$13,110 |
09/22 |
$13,250 |
$12,757 |
$11,935 |
10/22 |
$14,174 |
$13,443 |
$12,705 |
11/22 |
$15,774 |
$14,957 |
$14,101 |
12/22 |
$15,722 |
$14,969 |
$14,279 |
01/23 |
$16,855 |
$16,181 |
$15,382 |
02/23 |
$16,538 |
$15,844 |
$15,166 |
03/23 |
$16,555 |
$16,236 |
$15,127 |
04/23 |
$17,205 |
$16,695 |
$15,614 |
05/23 |
$16,105 |
$15,988 |
$14,773 |
06/23 |
$16,908 |
$16,716 |
$15,604 |
07/23 |
$17,599 |
$17,257 |
$16,314 |
08/23 |
$17,245 |
$16,595 |
$15,830 |
09/23 |
$16,958 |
$16,029 |
$15,696 |
10/23 |
$16,453 |
$15,379 |
$15,005 |
11/23 |
$17,531 |
$16,806 |
$16,194 |
12/23 |
$18,290 |
$17,699 |
$16,985 |
01/24 |
$17,995 |
$17,801 |
$16,974 |
02/24 |
$17,821 |
$18,127 |
$17,005 |
03/24 |
$18,637 |
$18,723 |
$17,747 |
04/24 |
$18,533 |
$18,244 |
$17,565 |
05/24 |
$19,697 |
$18,950 |
$18,257 |
06/24 |
$18,850 |
$18,644 |
$17,749 |
07/24 |
$19,821 |
$19,191 |
$18,581 |
08/24 |
$20,333 |
$19,815 |
$19,057 |
09/24 |
$20,457 |
$19,998 |
$19,327 |
10/24 |
$19,556 |
$18,911 |
$18,419 |
11/24 |
$19,804 |
$18,803 |
$18,277 |
12/24 |
$19,188 |
$18,376 |
$17,951 |
01/25 |
$20,104 |
$19,341 |
$18,867 |
02/25 |
$20,783 |
$19,717 |
$19,570 |
03/25 |
$21,699 |
$19,637 |
$20,027 |
04/25 |
$22,359 |
$20,536 |
$20,839 |
05/25 |
$23,385 |
$21,476 |
$21,675 |
06/25 |
$24,338 |
$21,949 |
$22,052 |
07/25 |
$24,283 |
$21,641 |
$22,108 |
08/25 |
$25,859 |
$22,564 |
$23,374 |
09/25 |
$26,446 |
$22,996 |
$23,681 |
10/25 |
$26,152 |
$23,266 |
$23,861 |
11/25 |
$27,179 |
$23,411 |
$24,510 |
12/25 |
$27,995 |
$24,113 |
$25,535 |
01/26 |
$29,877 |
$25,371 |
$26,990 |
02/26 |
$31,502 |
$26,545 |
$28,590 |
|
| Average Annual Return [Table Text Block] |
|
Table Summary
Average Annual Total Returns (%) |
1 year |
5 years |
10 years |
Institutional 3 Class |
51.58 |
15.02 |
12.16 |
MSCI EAFE Index (Net) |
34.63 |
10.78 |
10.26 |
MSCI EAFE Value Index (Net) |
46.09 |
15.06 |
11.08 | |
| No Deduction of Taxes [Text Block] |
|
Performance does not reflect the deduction of taxes that a shareholder may pay on fund distributions or on the redemptions of fund shares.
|
| Updated Performance Information Location [Text Block] |
|
columbiathreadneedleus.com/investment-products/mutual-funds
|
| AssetsNet |
|
$ 6,862,784,805
|
| Holdings Count | Holding |
|
122
|
| Advisory Fees Paid, Amount |
|
$ 36,638,729
|
| InvestmentCompanyPortfolioTurnover |
|
57.00%
|
| Additional Fund Statistics [Text Block] |
|
Table Summary
Fund net assets |
$6,862,784,805 |
Total number of portfolio holdings |
122 |
Management services fees (represents 0.74% of Fund average net assets) |
$36,638,729 |
Portfolio turnover for the reporting period |
57% | |
| Holdings [Text Block] |
|
Table Summary
Japan |
21.9% |
|
United States |
12.4% |
|
France |
8.4% |
|
United Kingdom |
7.8% |
|
Netherlands |
5.0% |
|
Canada |
4.4% |
|
Hong Kong |
4.4% |
|
Spain |
4.0% |
|
Australia |
3.7% |
|
Germany |
3.5% |
|
Other |
24.7% |
|
Table Summary
Financials |
33.5% |
Consumer Staples |
12.2% |
Energy |
12.1% |
Industrials |
7.4% |
Materials |
7.2% |
Health Care |
6.2% |
Consumer Discretionary |
6.0% |
Information Technology |
4.6% |
Real Estate |
4.5% |
Utilities |
2.9% |
Other |
1.1% | |
| Largest Holdings [Text Block] |
|
Table Summary
Shell PLC |
3.1% |
Banco Santander SA |
3.0% |
TotalEnergies SE |
2.6% |
AXA SA |
2.4% |
Imperial Brands PLC |
2.3% |
Sumitomo Mitsui Financial Group, Inc. |
2.3% |
Northern Star Resources Ltd. |
2.1% |
Primo Brands Corp., Class A |
2.0% |
ASR Nederland NV |
1.9% |
Ping An Insurance Group Co. of China Ltd., Class H |
1.9% | |
| Material Fund Change [Text Block] |
|
|
| C000059846 |
|
|
| Shareholder Report [Line Items] |
|
|
| Fund Name |
|
Columbia Overseas Value Fund
|
| Class Name |
|
Institutional Class
|
| Trading Symbol |
|
COSZX
|
| Annual or Semi-Annual Statement [Text Block] |
|
This annual shareholder report contains important information about Columbia Overseas Value Fund (the Fund) for the period of March 1, 2025 to February 28, 2026.
|
| Additional Information [Text Block] |
|
You can find additional information about the Fund at columbiathreadneedleus.com/resources/literature. You can also request more information by contacting us at 1-800-345-6611.
|
| Additional Information Phone Number |
|
1-800-345-6611
|
| Additional Information Website |
|
columbiathreadneedleus.com/resources/literature
|
| Expenses [Text Block] |
|
What were the Fund costs for the reporting period? (Based on a hypothetical $10,000 investment)
Table Summary
Class |
Cost of a $10,000 investment |
Cost paid as a percentage of a $10,000 investment |
Institutional Class |
$113 |
0.90% | |
| Expenses Paid, Amount |
|
$ 113
|
| Expense Ratio, Percent |
|
0.90%
|
| Factors Affecting Performance [Text Block] |
|
Management's Discussion of Fund Performance The performance of Institutional Class shares for the period presented is shown in the Average Annual Total Returns table. Top Performance ContributorsStock selection | Selections in the financials, energy and materials sectors boosted the Fund’s relative performance during the annual period. Allocations | Smaller allocations to the communication services and materials sectors buoyed the Fund’s relative performance during the annual period. Individual holdings | Positions in Energy Fuels, an American rare earths and uranium company; Northern Star Resources, an Australian gold miner; Piraeus Bank, a Greek bank; Pan American Silver, a Canadian silver miner; and Impala Platinum, a South African platinum miner, contributed to the Fund’s relative performance during the annual period. Top Performance DetractorsStock selection | Selections in the information technology, health care and consumer discretionary sectors hurt the Fund’s relative performance during the annual period. Allocations | Larger weightings in the information technology and consumer staples sectors and a smaller weighting in the financials sector detracted from the Fund’s relative performance during the annual period. Individual holdings | Positions in Check Point Software Technologies, an Israeli cybersecurity company; Burford Capital, a litigation finance company; Flutter Entertainment, an Irish-American gambling company; Sankyo, a Japanese pachinko machine maker; and an overweight in MatsukiyoCocokara, a Japanese pharmacy chain, detracted from the Fund’s relative performance during the annual period. |
| Performance Past Does Not Indicate Future [Text] |
|
The Fund's past performance is not a good predictor of the Fund's future performance.
|
| Line Graph [Table Text Block] |
|
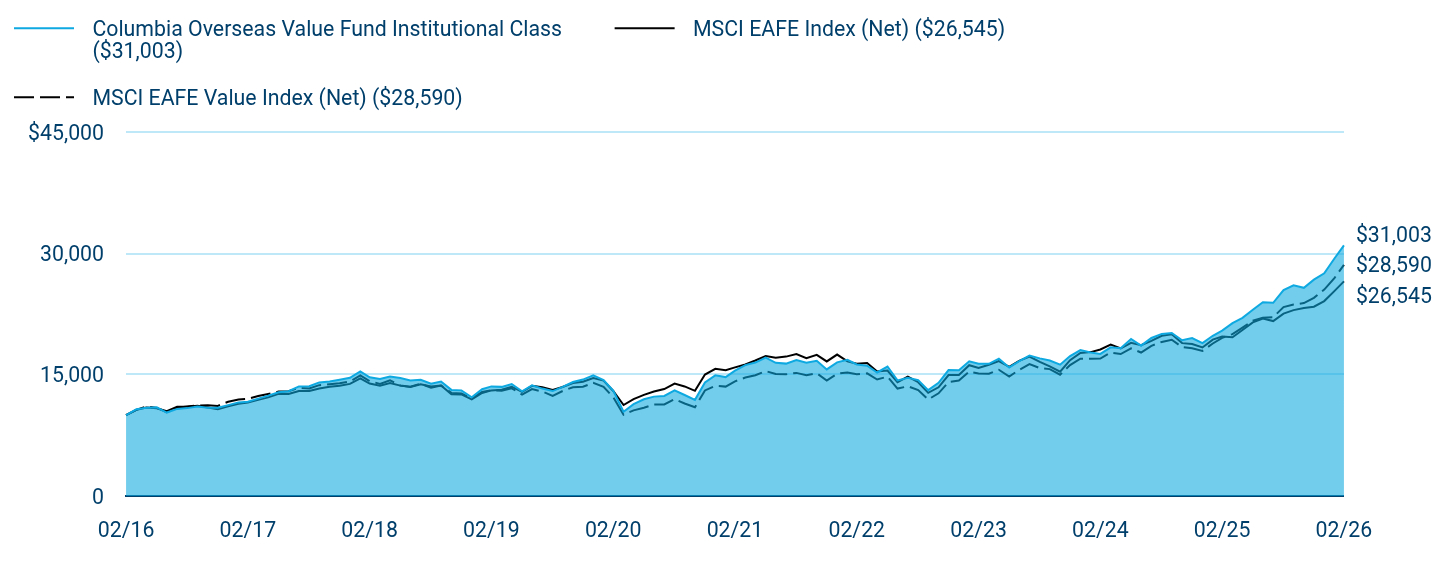
Table Summary
|
Columbia Overseas Value Fund Institutional Class ($31,003) |
MSCI EAFE Index (Net) ($26,545) |
MSCI EAFE Value Index (Net) ($28,590) |
02/16 |
$10,000 |
$10,000 |
$10,000 |
03/16 |
$10,737 |
$10,651 |
$10,660 |
04/16 |
$10,912 |
$10,959 |
$11,080 |
05/16 |
$10,965 |
$10,859 |
$10,904 |
06/16 |
$10,322 |
$10,495 |
$10,362 |
07/16 |
$10,777 |
$11,027 |
$10,907 |
08/16 |
$10,871 |
$11,035 |
$11,083 |
09/16 |
$11,059 |
$11,170 |
$11,191 |
10/16 |
$10,912 |
$10,942 |
$11,217 |
11/16 |
$10,925 |
$10,724 |
$11,148 |
12/16 |
$11,239 |
$11,091 |
$11,658 |
01/17 |
$11,581 |
$11,412 |
$11,945 |
02/17 |
$11,663 |
$11,575 |
$12,027 |
03/17 |
$12,046 |
$11,894 |
$12,363 |
04/17 |
$12,415 |
$12,197 |
$12,622 |
05/17 |
$12,839 |
$12,644 |
$12,915 |
06/17 |
$12,962 |
$12,622 |
$12,954 |
07/17 |
$13,550 |
$12,986 |
$13,387 |
08/17 |
$13,577 |
$12,981 |
$13,303 |
09/17 |
$14,055 |
$13,304 |
$13,714 |
10/17 |
$14,178 |
$13,506 |
$13,820 |
11/17 |
$14,384 |
$13,648 |
$13,944 |
12/17 |
$14,617 |
$13,867 |
$14,158 |
01/18 |
$15,423 |
$14,563 |
$14,922 |
02/18 |
$14,688 |
$13,905 |
$14,213 |
03/18 |
$14,475 |
$13,655 |
$13,870 |
04/18 |
$14,773 |
$13,966 |
$14,298 |
05/18 |
$14,589 |
$13,652 |
$13,678 |
06/18 |
$14,289 |
$13,486 |
$13,505 |
07/18 |
$14,375 |
$13,818 |
$13,892 |
08/18 |
$13,901 |
$13,551 |
$13,387 |
09/18 |
$14,159 |
$13,668 |
$13,664 |
10/18 |
$13,125 |
$12,580 |
$12,757 |
11/18 |
$13,068 |
$12,565 |
$12,686 |
12/18 |
$12,210 |
$11,955 |
$12,065 |
01/19 |
$13,207 |
$12,740 |
$12,873 |
02/19 |
$13,559 |
$13,065 |
$13,087 |
03/19 |
$13,500 |
$13,147 |
$13,020 |
04/19 |
$13,852 |
$13,517 |
$13,324 |
05/19 |
$12,943 |
$12,868 |
$12,552 |
06/19 |
$13,699 |
$13,631 |
$13,221 |
07/19 |
$13,288 |
$13,458 |
$12,924 |
08/19 |
$12,980 |
$13,110 |
$12,393 |
09/19 |
$13,508 |
$13,485 |
$12,991 |
10/19 |
$14,095 |
$13,970 |
$13,460 |
11/19 |
$14,403 |
$14,127 |
$13,513 |
12/19 |
$14,937 |
$14,586 |
$14,006 |
01/20 |
$14,328 |
$14,282 |
$13,500 |
02/20 |
$13,049 |
$12,991 |
$12,222 |
03/20 |
$10,430 |
$11,257 |
$10,057 |
04/20 |
$11,359 |
$11,984 |
$10,595 |
05/20 |
$11,968 |
$12,506 |
$10,917 |
06/20 |
$12,294 |
$12,932 |
$11,307 |
07/20 |
$12,370 |
$13,233 |
$11,329 |
08/20 |
$13,059 |
$13,914 |
$11,992 |
09/20 |
$12,493 |
$13,552 |
$11,441 |
10/20 |
$11,896 |
$13,011 |
$10,980 |
11/20 |
$14,039 |
$15,028 |
$13,060 |
12/20 |
$14,925 |
$15,726 |
$13,638 |
01/21 |
$14,708 |
$15,559 |
$13,532 |
02/21 |
$15,514 |
$15,908 |
$14,177 |
03/21 |
$16,196 |
$16,274 |
$14,654 |
04/21 |
$16,506 |
$16,763 |
$14,934 |
05/21 |
$17,126 |
$17,310 |
$15,451 |
06/21 |
$16,469 |
$17,115 |
$15,095 |
07/21 |
$16,376 |
$17,244 |
$15,058 |
08/21 |
$16,811 |
$17,548 |
$15,229 |
09/21 |
$16,500 |
$17,039 |
$14,949 |
10/21 |
$16,734 |
$17,458 |
$15,187 |
11/21 |
$15,661 |
$16,645 |
$14,274 |
12/21 |
$16,532 |
$17,498 |
$15,124 |
01/22 |
$16,837 |
$16,652 |
$15,281 |
02/22 |
$16,275 |
$16,358 |
$15,074 |
03/22 |
$16,114 |
$16,463 |
$15,174 |
04/22 |
$15,279 |
$15,398 |
$14,407 |
05/22 |
$16,018 |
$15,513 |
$14,761 |
06/22 |
$14,299 |
$14,074 |
$13,291 |
07/22 |
$14,624 |
$14,775 |
$13,568 |
08/22 |
$14,332 |
$14,073 |
$13,110 |
09/22 |
$13,097 |
$12,757 |
$11,935 |
10/22 |
$14,007 |
$13,443 |
$12,705 |
11/22 |
$15,583 |
$14,957 |
$14,101 |
12/22 |
$15,547 |
$14,969 |
$14,279 |
01/23 |
$16,661 |
$16,181 |
$15,382 |
02/23 |
$16,350 |
$15,844 |
$15,166 |
03/23 |
$16,350 |
$16,236 |
$15,127 |
04/23 |
$16,988 |
$16,695 |
$15,614 |
05/23 |
$15,907 |
$15,988 |
$14,773 |
06/23 |
$16,693 |
$16,716 |
$15,604 |
07/23 |
$17,372 |
$17,257 |
$16,314 |
08/23 |
$17,024 |
$16,595 |
$15,830 |
09/23 |
$16,759 |
$16,029 |
$15,696 |
10/23 |
$16,245 |
$15,379 |
$15,005 |
11/23 |
$17,306 |
$16,806 |
$16,194 |
12/23 |
$18,050 |
$17,699 |
$16,985 |
01/24 |
$17,760 |
$17,801 |
$16,974 |
02/24 |
$17,572 |
$18,127 |
$17,005 |
03/24 |
$18,391 |
$18,723 |
$17,747 |
04/24 |
$18,288 |
$18,244 |
$17,565 |
05/24 |
$19,431 |
$18,950 |
$18,257 |
06/24 |
$18,596 |
$18,644 |
$17,749 |
07/24 |
$19,550 |
$19,191 |
$18,581 |
08/24 |
$20,052 |
$19,815 |
$19,057 |
09/24 |
$20,173 |
$19,998 |
$19,327 |
10/24 |
$19,272 |
$18,911 |
$18,419 |
11/24 |
$19,532 |
$18,803 |
$18,277 |
12/24 |
$18,905 |
$18,376 |
$17,951 |
01/25 |
$19,822 |
$19,341 |
$18,867 |
02/25 |
$20,469 |
$19,717 |
$19,570 |
03/25 |
$21,385 |
$19,637 |
$20,027 |
04/25 |
$22,032 |
$20,536 |
$20,839 |
05/25 |
$23,039 |
$21,476 |
$21,675 |
06/25 |
$23,973 |
$21,949 |
$22,052 |
07/25 |
$23,901 |
$21,641 |
$22,108 |
08/25 |
$25,465 |
$22,564 |
$23,374 |
09/25 |
$26,058 |
$22,996 |
$23,681 |
10/25 |
$25,752 |
$23,266 |
$23,861 |
11/25 |
$26,759 |
$23,411 |
$24,510 |
12/25 |
$27,549 |
$24,113 |
$25,535 |
01/26 |
$29,412 |
$25,371 |
$26,990 |
02/26 |
$31,003 |
$26,545 |
$28,590 |
|
| Average Annual Return [Table Text Block] |
|
Table Summary
Average Annual Total Returns (%) |
1 year |
5 years |
10 years |
Institutional Class |
51.46 |
14.85 |
11.98 |
MSCI EAFE Index (Net) |
34.63 |
10.78 |
10.26 |
MSCI EAFE Value Index (Net) |
46.09 |
15.06 |
11.08 | |
| No Deduction of Taxes [Text Block] |
|
Performance does not reflect the deduction of taxes that a shareholder may pay on fund distributions or on the redemptions of fund shares.
|
| Updated Performance Information Location [Text Block] |
|
columbiathreadneedleus.com/investment-products/mutual-funds
|
| AssetsNet |
|
$ 6,862,784,805
|
| Holdings Count | Holding |
|
122
|
| Advisory Fees Paid, Amount |
|
$ 36,638,729
|
| InvestmentCompanyPortfolioTurnover |
|
57.00%
|
| Additional Fund Statistics [Text Block] |
|
Table Summary
Fund net assets |
$6,862,784,805 |
Total number of portfolio holdings |
122 |
Management services fees (represents 0.74% of Fund average net assets) |
$36,638,729 |
Portfolio turnover for the reporting period |
57% | |
| Holdings [Text Block] |
|
Table Summary
Japan |
21.9% |
|
United States |
12.4% |
|
France |
8.4% |
|
United Kingdom |
7.8% |
|
Netherlands |
5.0% |
|
Canada |
4.4% |
|
Hong Kong |
4.4% |
|
Spain |
4.0% |
|
Australia |
3.7% |
|
Germany |
3.5% |
|
Other |
24.7% |
|
Table Summary
Financials |
33.5% |
Consumer Staples |
12.2% |
Energy |
12.1% |
Industrials |
7.4% |
Materials |
7.2% |
Health Care |
6.2% |
Consumer Discretionary |
6.0% |
Information Technology |
4.6% |
Real Estate |
4.5% |
Utilities |
2.9% |
Other |
1.1% | |
| Largest Holdings [Text Block] |
|
Table Summary
Shell PLC |
3.1% |
Banco Santander SA |
3.0% |
TotalEnergies SE |
2.6% |
AXA SA |
2.4% |
Imperial Brands PLC |
2.3% |
Sumitomo Mitsui Financial Group, Inc. |
2.3% |
Northern Star Resources Ltd. |
2.1% |
Primo Brands Corp., Class A |
2.0% |
ASR Nederland NV |
1.9% |
Ping An Insurance Group Co. of China Ltd., Class H |
1.9% | |
| Material Fund Change [Text Block] |
|
|
| C000029850 |
|
|
| Shareholder Report [Line Items] |
|
|
| Fund Name |
|
Columbia Select Mid Cap Value Fund
|
| Class Name |
|
Class A
|
| Trading Symbol |
|
CMUAX
|
| Annual or Semi-Annual Statement [Text Block] |
|
This annual shareholder report contains important information about Columbia Select Mid Cap Value Fund (the Fund) for the period of March 1, 2025 to February 28, 2026.
|
| Additional Information [Text Block] |
|
You can find additional information about the Fund at columbiathreadneedleus.com/resources/literature. You can also request more information by contacting us at 1-800-345-6611.
|
| Additional Information Phone Number |
|
1-800-345-6611
|
| Additional Information Website |
|
columbiathreadneedleus.com/resources/literature
|
| Expenses [Text Block] |
|
What were the Fund costs for the reporting period? (Based on a hypothetical $10,000 investment)
Table Summary
Class |
Cost of a $10,000 investment |
Cost paid as a percentage of a $10,000 investment |
Class A |
$129 |
1.13% | |
| Expenses Paid, Amount |
|
$ 129
|
| Expense Ratio, Percent |
|
1.13%
|
| Factors Affecting Performance [Text Block] |
|
Management's Discussion of Fund Performance The performance of Class A shares for the period presented is shown in the Average Annual Total Returns table. Top Performance ContributorsStock selection | Selections in the industrials, information technology and real estate sectors contributed to the Fund’s relative performance during the annual period. Allocations | Allocations to the consumer staples, materials and industrials sectors lifted the Fund’s relative performance during the annual period. Individual holdings | Positions in Corning, a manufacturer of specialty glass, ceramics, and optical materials; Teradyne, a leading supplier of automated test equipment used across semiconductor and electronics markets; ATI, a producer of high performance materials and components for aerospace and defense applications; CACI, a provider of information technology and professional services for government clients; and Freeport-McMoRan, Inc., one of the world’s largest publicly traded producers of copper and other critical minerals, were top contributors during the period. Top Performance DetractorsStock selection | Selections in the health care, financials and utilities sectors hurt the Fund’s relative performance during the annual period. Allocations | Allocations to the information technology, financials and energy sectors detracted from the Fund’s relative performance. Individual holdings | Positions in Kemper, a provider of insurance products across property, casualty, and life markets; SanDisk, a global manufacturer of flash memory storage solutions; Western Digital, a leading developer of hard disk drives and data storage technologies; Global Payments, a provider of payment technology and software solutions to merchants worldwide; and Voya Financial, a diversified financial services company specializing in retirement, investment, and insurance products, were top detractors during the period. |
| Performance Past Does Not Indicate Future [Text] |
|
The Fund's past performance is not a good predictor of the Fund's future performance.
|
| Line Graph [Table Text Block] |
|

Table Summary
|
Columbia Select Mid Cap Value Fund Class A (including sales charges) ($30,402) |
Russell 3000® Index ($40,728) |
Russell Midcap® Value Index ($29,181) |
02/16 |
$9,422 |
$10,000 |
$10,000 |
03/16 |
$10,244 |
$10,704 |
$10,923 |
04/16 |
$10,412 |
$10,770 |
$11,158 |
05/16 |
$10,603 |
$10,963 |
$11,340 |
06/16 |
$10,588 |
$10,986 |
$11,444 |
07/16 |
$10,888 |
$11,422 |
$11,929 |
08/16 |
$10,925 |
$11,451 |
$11,903 |
09/16 |
$10,942 |
$11,469 |
$11,953 |
10/16 |
$10,649 |
$11,221 |
$11,663 |
11/16 |
$11,302 |
$11,723 |
$12,393 |
12/16 |
$11,562 |
$11,952 |
$12,613 |
01/17 |
$11,712 |
$12,176 |
$12,825 |
02/17 |
$12,005 |
$12,629 |
$13,184 |
03/17 |
$11,963 |
$12,638 |
$13,088 |
04/17 |
$11,987 |
$12,772 |
$13,112 |
05/17 |
$12,058 |
$12,903 |
$13,072 |
06/17 |
$12,175 |
$13,019 |
$13,266 |
07/17 |
$12,240 |
$13,264 |
$13,442 |
08/17 |
$12,003 |
$13,290 |
$13,191 |
09/17 |
$12,403 |
$13,614 |
$13,551 |
10/17 |
$12,583 |
$13,911 |
$13,660 |
11/17 |
$12,969 |
$14,334 |
$14,122 |
12/17 |
$13,104 |
$14,477 |
$14,296 |
01/18 |
$13,362 |
$15,240 |
$14,625 |
02/18 |
$12,720 |
$14,678 |
$13,904 |
03/18 |
$12,727 |
$14,384 |
$13,938 |
04/18 |
$12,813 |
$14,438 |
$14,008 |
05/18 |
$12,938 |
$14,846 |
$14,160 |
06/18 |
$12,970 |
$14,943 |
$14,274 |
07/18 |
$13,337 |
$15,439 |
$14,662 |
08/18 |
$13,439 |
$15,981 |
$14,862 |
09/18 |
$13,379 |
$16,008 |
$14,744 |
10/18 |
$12,360 |
$14,829 |
$13,682 |
11/18 |
$12,553 |
$15,126 |
$14,010 |
12/18 |
$11,340 |
$13,718 |
$12,539 |
01/19 |
$12,614 |
$14,896 |
$13,830 |
02/19 |
$13,175 |
$15,419 |
$14,270 |
03/19 |
$13,189 |
$15,645 |
$14,342 |
04/19 |
$13,802 |
$16,269 |
$14,814 |
05/19 |
$12,806 |
$15,216 |
$13,863 |
06/19 |
$13,687 |
$16,285 |
$14,799 |
07/19 |
$13,892 |
$16,527 |
$14,922 |
08/19 |
$13,482 |
$16,190 |
$14,396 |
09/19 |
$13,961 |
$16,475 |
$14,980 |
10/19 |
$13,858 |
$16,829 |
$15,061 |
11/19 |
$14,282 |
$17,469 |
$15,462 |
12/19 |
$14,890 |
$17,973 |
$15,933 |
01/20 |
$14,455 |
$17,954 |
$15,623 |
02/20 |
$12,849 |
$16,484 |
$14,076 |
03/20 |
$9,992 |
$14,217 |
$10,881 |
04/20 |
$11,340 |
$16,100 |
$12,334 |
05/20 |
$11,776 |
$16,961 |
$12,906 |
06/20 |
$11,870 |
$17,349 |
$13,051 |
07/20 |
$12,539 |
$18,334 |
$13,668 |
08/20 |
$13,099 |
$19,662 |
$14,209 |
09/20 |
$12,940 |
$18,946 |
$13,887 |
10/20 |
$13,104 |
$18,537 |
$14,016 |
11/20 |
$15,224 |
$20,792 |
$15,984 |
12/20 |
$15,855 |
$21,728 |
$16,724 |
01/21 |
$15,649 |
$21,631 |
$16,685 |
02/21 |
$17,114 |
$22,307 |
$17,978 |
03/21 |
$17,988 |
$23,107 |
$18,906 |
04/21 |
$18,851 |
$24,298 |
$19,821 |
05/21 |
$19,208 |
$24,409 |
$20,212 |
06/21 |
$18,808 |
$25,010 |
$19,977 |
07/21 |
$18,780 |
$25,433 |
$20,100 |
08/21 |
$19,016 |
$26,159 |
$20,531 |
09/21 |
$18,479 |
$24,985 |
$19,775 |
10/21 |
$19,480 |
$26,675 |
$20,828 |
11/21 |
$19,507 |
$26,269 |
$20,195 |
12/21 |
$20,922 |
$27,303 |
$21,463 |
01/22 |
$19,922 |
$25,697 |
$20,547 |
02/22 |
$20,220 |
$25,049 |
$20,451 |
03/22 |
$20,391 |
$25,862 |
$21,072 |
04/22 |
$19,150 |
$23,541 |
$19,820 |
05/22 |
$19,703 |
$23,509 |
$20,201 |
06/22 |
$17,570 |
$21,543 |
$17,980 |
07/22 |
$19,130 |
$23,564 |
$19,527 |
08/22 |
$18,693 |
$22,684 |
$18,930 |
09/22 |
$16,972 |
$20,581 |
$17,094 |
10/22 |
$18,769 |
$22,269 |
$18,708 |
11/22 |
$19,894 |
$23,431 |
$19,891 |
12/22 |
$18,945 |
$22,059 |
$18,880 |
01/23 |
$20,408 |
$23,578 |
$20,406 |
02/23 |
$19,836 |
$23,027 |
$19,752 |
03/23 |
$19,061 |
$23,643 |
$19,130 |
04/23 |
$19,108 |
$23,895 |
$19,131 |
05/23 |
$18,152 |
$23,988 |
$18,283 |
06/23 |
$19,837 |
$25,626 |
$19,868 |
07/23 |
$20,463 |
$26,544 |
$20,733 |
08/23 |
$19,645 |
$26,032 |
$20,000 |
09/23 |
$18,537 |
$24,792 |
$18,982 |
10/23 |
$17,604 |
$24,135 |
$18,042 |
11/23 |
$19,485 |
$26,385 |
$19,743 |
12/23 |
$20,887 |
$27,785 |
$21,281 |
01/24 |
$20,774 |
$28,093 |
$20,900 |
02/24 |
$21,580 |
$29,613 |
$21,898 |
03/24 |
$22,806 |
$30,569 |
$23,031 |
04/24 |
$22,014 |
$29,224 |
$21,826 |
05/24 |
$22,644 |
$30,604 |
$22,610 |
06/24 |
$22,268 |
$31,552 |
$22,248 |
07/24 |
$23,692 |
$32,138 |
$23,592 |
08/24 |
$24,020 |
$32,838 |
$24,037 |
09/24 |
$24,365 |
$33,517 |
$24,490 |
10/24 |
$23,889 |
$33,271 |
$24,182 |
11/24 |
$25,300 |
$35,484 |
$25,962 |
12/24 |
$23,573 |
$34,400 |
$24,062 |
01/25 |
$24,209 |
$35,486 |
$24,908 |
02/25 |
$23,797 |
$34,806 |
$24,454 |
03/25 |
$22,951 |
$32,775 |
$23,554 |
04/25 |
$22,262 |
$32,556 |
$22,970 |
05/25 |
$23,382 |
$34,619 |
$23,972 |
06/25 |
$24,257 |
$36,378 |
$24,814 |
07/25 |
$24,768 |
$37,179 |
$25,259 |
08/25 |
$25,842 |
$38,039 |
$26,017 |
09/25 |
$26,144 |
$39,352 |
$26,347 |
10/25 |
$26,038 |
$40,196 |
$26,083 |
11/25 |
$26,743 |
$40,306 |
$26,705 |
12/25 |
$26,783 |
$40,298 |
$26,721 |
01/26 |
$28,032 |
$40,923 |
$27,866 |
02/26 |
$30,402 |
$40,728 |
$29,181 |
|
| Average Annual Return [Table Text Block] |
|
Table Summary
Average Annual Total Returns (%) |
1 year |
5 years |
10 years |
Class A (excluding sales charges) |
27.76 |
12.18 |
12.43 |
Class A (including sales charges) |
20.45 |
10.86 |
11.76 |
Russell 3000® Index |
17.02 |
12.80 |
15.08 |
Russell Midcap® Value Index |
19.33 |
10.17 |
11.30 | |
| No Deduction of Taxes [Text Block] |
|
Performance does not reflect the deduction of taxes that a shareholder may pay on fund distributions or on the redemptions of fund shares.
|
| Updated Performance Information Location [Text Block] |
|
columbiathreadneedleus.com/investment-products/mutual-funds
|
| AssetsNet |
|
$ 2,904,196,404
|
| Holdings Count | Holding |
|
49
|
| Advisory Fees Paid, Amount |
|
$ 18,121,891
|
| InvestmentCompanyPortfolioTurnover |
|
15.00%
|
| Additional Fund Statistics [Text Block] |
|
Table Summary
Fund net assets |
$2,904,196,404 |
Total number of portfolio holdings |
49 |
Management services fees (represents 0.73% of Fund average net assets) |
$18,121,891 |
Portfolio turnover for the reporting period |
15% | |
| Holdings [Text Block] |
|
Table Summary
Industrials |
17.6% |
Financials |
15.7% |
Information Technology |
10.7% |
Consumer Discretionary |
9.5% |
Real Estate |
8.3% |
Utilities |
8.1% |
Health Care |
7.6% |
Consumer Staples |
5.6% |
Materials |
5.6% |
Energy |
5.5% |
Other |
4.3% |
Table Summary
Common Stocks |
98.5% |
Money Market Funds |
1.8% | |
| Largest Holdings [Text Block] |
|
Table Summary
Corning, Inc. |
3.5% |
Entergy Corp. |
3.3% |
AMETEK, Inc. |
2.9% |
ITT, Inc. |
2.9% |
Ameren Corp. |
2.9% |
Marathon Petroleum Corp. |
2.9% |
Southwest Airlines Co. |
2.7% |
Welltower, Inc. |
2.7% |
Devon Energy Corp. |
2.6% |
Quest Diagnostics, Inc. |
2.5% | |
| Material Fund Change [Text Block] |
|
|
| C000029852 |
|
|
| Shareholder Report [Line Items] |
|
|
| Fund Name |
|
Columbia Select Mid Cap Value Fund
|
| Class Name |
|
Class C
|
| Trading Symbol |
|
CMUCX
|
| Annual or Semi-Annual Statement [Text Block] |
|
This annual shareholder report contains important information about Columbia Select Mid Cap Value Fund (the Fund) for the period of March 1, 2025 to February 28, 2026.
|
| Additional Information [Text Block] |
|
You can find additional information about the Fund at columbiathreadneedleus.com/resources/literature. You can also request more information by contacting us at 1-800-345-6611.
|
| Additional Information Phone Number |
|
1-800-345-6611
|
| Additional Information Website |
|
columbiathreadneedleus.com/resources/literature
|
| Expenses [Text Block] |
|
What were the Fund costs for the reporting period? (Based on a hypothetical $10,000 investment)
Table Summary
Class |
Cost of a $10,000 investment |
Cost paid as a percentage of a $10,000 investment |
Class C |
$213 |
1.88% | |
| Expenses Paid, Amount |
|
$ 213
|
| Expense Ratio, Percent |
|
1.88%
|
| Factors Affecting Performance [Text Block] |
|
Management's Discussion of Fund Performance The performance of Class C shares for the period presented is shown in the Average Annual Total Returns table. Top Performance ContributorsStock selection | Selections in the industrials, information technology and real estate sectors contributed to the Fund’s relative performance during the annual period. Allocations | Allocations to the consumer staples, materials and industrials sectors lifted the Fund’s relative performance during the annual period. Individual holdings | Positions in Corning, a manufacturer of specialty glass, ceramics, and optical materials; Teradyne, a leading supplier of automated test equipment used across semiconductor and electronics markets; ATI, a producer of high performance materials and components for aerospace and defense applications; CACI, a provider of information technology and professional services for government clients; and Freeport-McMoRan, Inc., one of the world’s largest publicly traded producers of copper and other critical minerals, were top contributors during the period. Top Performance DetractorsStock selection | Selections in the health care, financials and utilities sectors hurt the Fund’s relative performance during the annual period. Allocations | Allocations to the information technology, financials and energy sectors detracted from the Fund’s relative performance. Individual holdings | Positions in Kemper, a provider of insurance products across property, casualty, and life markets; SanDisk, a global manufacturer of flash memory storage solutions; Western Digital, a leading developer of hard disk drives and data storage technologies; Global Payments, a provider of payment technology and software solutions to merchants worldwide; and Voya Financial, a diversified financial services company specializing in retirement, investment, and insurance products, were top detractors during the period. |
| Performance Past Does Not Indicate Future [Text] |
|
The Fund's past performance is not a good predictor of the Fund's future performance.
|
| Line Graph [Table Text Block] |
|

Table Summary
|
Columbia Select Mid Cap Value Fund Class C (including sales charges) ($29,943) |
Russell 3000® Index ($40,728) |
Russell Midcap® Value Index ($29,181) |
02/16 |
$10,000 |
$10,000 |
$10,000 |
03/16 |
$10,861 |
$10,704 |
$10,923 |
04/16 |
$11,033 |
$10,770 |
$11,158 |
05/16 |
$11,230 |
$10,963 |
$11,340 |
06/16 |
$11,206 |
$10,986 |
$11,444 |
07/16 |
$11,517 |
$11,422 |
$11,929 |
08/16 |
$11,542 |
$11,451 |
$11,903 |
09/16 |
$11,558 |
$11,469 |
$11,953 |
10/16 |
$11,248 |
$11,221 |
$11,663 |
11/16 |
$11,928 |
$11,723 |
$12,393 |
12/16 |
$12,188 |
$11,952 |
$12,613 |
01/17 |
$12,338 |
$12,176 |
$12,825 |
02/17 |
$12,648 |
$12,629 |
$13,184 |
03/17 |
$12,595 |
$12,638 |
$13,088 |
04/17 |
$12,613 |
$12,772 |
$13,112 |
05/17 |
$12,675 |
$12,903 |
$13,072 |
06/17 |
$12,793 |
$13,019 |
$13,266 |
07/17 |
$12,848 |
$13,264 |
$13,442 |
08/17 |
$12,591 |
$13,290 |
$13,191 |
09/17 |
$13,003 |
$13,614 |
$13,551 |
10/17 |
$13,187 |
$13,911 |
$13,660 |
11/17 |
$13,581 |
$14,334 |
$14,122 |
12/17 |
$13,713 |
$14,477 |
$14,296 |
01/18 |
$13,973 |
$15,240 |
$14,625 |
02/18 |
$13,292 |
$14,678 |
$13,904 |
03/18 |
$13,303 |
$14,384 |
$13,938 |
04/18 |
$13,367 |
$14,438 |
$14,008 |
05/18 |
$13,497 |
$14,846 |
$14,160 |
06/18 |
$13,526 |
$14,943 |
$14,274 |
07/18 |
$13,894 |
$15,439 |
$14,662 |
08/18 |
$13,998 |
$15,981 |
$14,862 |
09/18 |
$13,917 |
$16,008 |
$14,744 |
10/18 |
$12,846 |
$14,829 |
$13,682 |
11/18 |
$13,042 |
$15,126 |
$14,010 |
12/18 |
$11,781 |
$13,718 |
$12,539 |
01/19 |
$13,088 |
$14,896 |
$13,830 |
02/19 |
$13,661 |
$15,419 |
$14,270 |
03/19 |
$13,665 |
$15,645 |
$14,342 |
04/19 |
$14,297 |
$16,269 |
$14,814 |
05/19 |
$13,269 |
$15,216 |
$13,863 |
06/19 |
$14,165 |
$16,285 |
$14,799 |
07/19 |
$14,372 |
$16,527 |
$14,922 |
08/19 |
$13,929 |
$16,190 |
$14,396 |
09/19 |
$14,421 |
$16,475 |
$14,980 |
10/19 |
$14,303 |
$16,829 |
$15,061 |
11/19 |
$14,730 |
$17,469 |
$15,462 |
12/19 |
$15,336 |
$17,973 |
$15,933 |
01/20 |
$14,883 |
$17,954 |
$15,623 |
02/20 |
$13,236 |
$16,484 |
$14,076 |
03/20 |
$10,301 |
$14,217 |
$10,881 |
04/20 |
$11,662 |
$16,100 |
$12,334 |
05/20 |
$12,101 |
$16,961 |
$12,906 |
06/20 |
$12,201 |
$17,349 |
$13,051 |
07/20 |
$12,890 |
$18,334 |
$13,668 |
08/20 |
$13,454 |
$19,662 |
$14,209 |
09/20 |
$13,266 |
$18,946 |
$13,887 |
10/20 |
$13,423 |
$18,537 |
$14,016 |
11/20 |
$15,600 |
$20,792 |
$15,984 |
12/20 |
$16,242 |
$21,728 |
$16,724 |
01/21 |
$16,007 |
$21,631 |
$16,685 |
02/21 |
$17,511 |
$22,307 |
$17,978 |
03/21 |
$18,388 |
$23,107 |
$18,906 |
04/21 |
$19,249 |
$24,298 |
$19,821 |
05/21 |
$19,609 |
$24,409 |
$20,212 |
06/21 |
$19,187 |
$25,010 |
$19,977 |
07/21 |
$19,139 |
$25,433 |
$20,100 |
08/21 |
$19,362 |
$26,159 |
$20,531 |
09/21 |
$18,806 |
$24,985 |
$19,775 |
10/21 |
$19,823 |
$26,675 |
$20,828 |
11/21 |
$19,839 |
$26,269 |
$20,195 |
12/21 |
$21,243 |
$27,303 |
$21,463 |
01/22 |
$20,228 |
$25,697 |
$20,547 |
02/22 |
$20,520 |
$25,049 |
$20,451 |
03/22 |
$20,675 |
$25,862 |
$21,072 |
04/22 |
$19,401 |
$23,541 |
$19,820 |
05/22 |
$19,952 |
$23,509 |
$20,201 |
06/22 |
$17,788 |
$21,543 |
$17,980 |
07/22 |
$19,358 |
$23,564 |
$19,527 |
08/22 |
$18,888 |
$22,684 |
$18,930 |
09/22 |
$17,139 |
$20,581 |
$17,094 |
10/22 |
$18,943 |
$22,269 |
$18,708 |
11/22 |
$20,061 |
$23,431 |
$19,891 |
12/22 |
$19,113 |
$22,059 |
$18,880 |
01/23 |
$20,564 |
$23,578 |
$20,406 |
02/23 |
$19,995 |
$23,027 |
$19,752 |
03/23 |
$19,186 |
$23,643 |
$19,130 |
04/23 |
$19,223 |
$23,895 |
$19,131 |
05/23 |
$18,249 |
$23,988 |
$18,283 |
06/23 |
$19,930 |
$25,626 |
$19,868 |
07/23 |
$20,559 |
$26,544 |
$20,733 |
08/23 |
$19,727 |
$26,032 |
$20,000 |
09/23 |
$18,580 |
$24,792 |
$18,982 |
10/23 |
$17,637 |
$24,135 |
$18,042 |
11/23 |
$19,523 |
$26,385 |
$19,743 |
12/23 |
$20,908 |
$27,785 |
$21,281 |
01/24 |
$20,778 |
$28,093 |
$20,900 |
02/24 |
$21,574 |
$29,613 |
$21,898 |
03/24 |
$22,785 |
$30,569 |
$23,031 |
04/24 |
$21,971 |
$29,224 |
$21,826 |
05/24 |
$22,600 |
$30,604 |
$22,610 |
06/24 |
$22,194 |
$31,552 |
$22,248 |
07/24 |
$23,602 |
$32,138 |
$23,592 |
08/24 |
$23,921 |
$32,838 |
$24,037 |
09/24 |
$24,246 |
$33,517 |
$24,490 |
10/24 |
$23,758 |
$33,271 |
$24,182 |
11/24 |
$25,147 |
$35,484 |
$25,962 |
12/24 |
$23,432 |
$34,400 |
$24,062 |
01/25 |
$24,025 |
$35,486 |
$24,908 |
02/25 |
$23,610 |
$34,806 |
$24,454 |
03/25 |
$22,765 |
$32,775 |
$23,554 |
04/25 |
$22,073 |
$32,556 |
$22,970 |
05/25 |
$23,161 |
$34,619 |
$23,972 |
06/25 |
$24,004 |
$36,378 |
$24,814 |
07/25 |
$24,510 |
$37,179 |
$25,259 |
08/25 |
$25,542 |
$38,039 |
$26,017 |
09/25 |
$25,826 |
$39,352 |
$26,347 |
10/25 |
$25,704 |
$40,196 |
$26,083 |
11/25 |
$26,392 |
$40,306 |
$26,705 |
12/25 |
$26,401 |
$40,298 |
$26,721 |
01/26 |
$27,631 |
$40,923 |
$27,866 |
02/26 |
$29,943 |
$40,728 |
$29,181 |
|
| Average Annual Return [Table Text Block] |
|
Table Summary
Average Annual Total Returns (%) |
1 year |
5 years |
10 years |
Class C (excluding sales charges) |
26.82 |
11.33 |
11.59 |
Class C (including sales charges) |
25.82 |
11.33 |
11.59 |
Russell 3000® Index |
17.02 |
12.80 |
15.08 |
Russell Midcap® Value Index |
19.33 |
10.17 |
11.30 | |
| No Deduction of Taxes [Text Block] |
|
Performance does not reflect the deduction of taxes that a shareholder may pay on fund distributions or on the redemptions of fund shares.
|
| Updated Performance Information Location [Text Block] |
|
columbiathreadneedleus.com/investment-products/mutual-funds
|
| AssetsNet |
|
$ 2,904,196,404
|
| Holdings Count | Holding |
|
49
|
| Advisory Fees Paid, Amount |
|
$ 18,121,891
|
| InvestmentCompanyPortfolioTurnover |
|
15.00%
|
| Additional Fund Statistics [Text Block] |
|
Table Summary
Fund net assets |
$2,904,196,404 |
Total number of portfolio holdings |
49 |
Management services fees (represents 0.73% of Fund average net assets) |
$18,121,891 |
Portfolio turnover for the reporting period |
15% | |
| Holdings [Text Block] |
|
Table Summary
Industrials |
17.6% |
Financials |
15.7% |
Information Technology |
10.7% |
Consumer Discretionary |
9.5% |
Real Estate |
8.3% |
Utilities |
8.1% |
Health Care |
7.6% |
Consumer Staples |
5.6% |
Materials |
5.6% |
Energy |
5.5% |
Other |
4.3% |
Table Summary
Common Stocks |
98.5% |
Money Market Funds |
1.8% | |
| Largest Holdings [Text Block] |
|
Table Summary
Corning, Inc. |
3.5% |
Entergy Corp. |
3.3% |
AMETEK, Inc. |
2.9% |
ITT, Inc. |
2.9% |
Ameren Corp. |
2.9% |
Marathon Petroleum Corp. |
2.9% |
Southwest Airlines Co. |
2.7% |
Welltower, Inc. |
2.7% |
Devon Energy Corp. |
2.6% |
Quest Diagnostics, Inc. |
2.5% | |
| Material Fund Change [Text Block] |
|
|
| C000029853 |
|
|
| Shareholder Report [Line Items] |
|
|
| Fund Name |
|
Columbia Select Mid Cap Value Fund
|
| Class Name |
|
Class R
|
| Trading Symbol |
|
CMVRX
|
| Annual or Semi-Annual Statement [Text Block] |
|
This annual shareholder report contains important information about Columbia Select Mid Cap Value Fund (the Fund) for the period of March 1, 2025 to February 28, 2026.
|
| Additional Information [Text Block] |
|
You can find additional information about the Fund at columbiathreadneedleus.com/resources/literature. You can also request more information by contacting us at 1-800-345-6611.
|
| Additional Information Phone Number |
|
1-800-345-6611
|
| Additional Information Website |
|
columbiathreadneedleus.com/resources/literature
|
| Expenses [Text Block] |
|
What were the Fund costs for the reporting period? (Based on a hypothetical $10,000 investment)
Table Summary
Class |
Cost of a $10,000 investment |
Cost paid as a percentage of a $10,000 investment |
Class R |
$157 |
1.38% | |
| Expenses Paid, Amount |
|
$ 157
|
| Expense Ratio, Percent |
|
1.38%
|
| Factors Affecting Performance [Text Block] |
|
Management's Discussion of Fund Performance The performance of Class R shares for the period presented is shown in the Average Annual Total Returns table. Top Performance ContributorsStock selection | Selections in the industrials, information technology and real estate sectors contributed to the Fund’s relative performance during the annual period. Allocations | Allocations to the consumer staples, materials and industrials sectors lifted the Fund’s relative performance during the annual period. Individual holdings | Positions in Corning, a manufacturer of specialty glass, ceramics, and optical materials; Teradyne, a leading supplier of automated test equipment used across semiconductor and electronics markets; ATI, a producer of high performance materials and components for aerospace and defense applications; CACI, a provider of information technology and professional services for government clients; and Freeport-McMoRan, Inc., one of the world’s largest publicly traded producers of copper and other critical minerals, were top contributors during the period. Top Performance DetractorsStock selection | Selections in the health care, financials and utilities sectors hurt the Fund’s relative performance during the annual period. Allocations | Allocations to the information technology, financials and energy sectors detracted from the Fund’s relative performance. Individual holdings | Positions in Kemper, a provider of insurance products across property, casualty, and life markets; SanDisk, a global manufacturer of flash memory storage solutions; Western Digital, a leading developer of hard disk drives and data storage technologies; Global Payments, a provider of payment technology and software solutions to merchants worldwide; and Voya Financial, a diversified financial services company specializing in retirement, investment, and insurance products, were top detractors during the period. |
| Performance Past Does Not Indicate Future [Text] |
|
The Fund's past performance is not a good predictor of the Fund's future performance.
|
| Line Graph [Table Text Block] |
|

Table Summary
|
Columbia Select Mid Cap Value Fund Class R ($31,469) |
Russell 3000® Index ($40,728) |
Russell Midcap® Value Index ($29,181) |
02/16 |
$10,000 |
$10,000 |
$10,000 |
03/16 |
$10,869 |
$10,704 |
$10,923 |
04/16 |
$11,048 |
$10,770 |
$11,158 |
05/16 |
$11,250 |
$10,963 |
$11,340 |
06/16 |
$11,228 |
$10,986 |
$11,444 |
07/16 |
$11,547 |
$11,422 |
$11,929 |
08/16 |
$11,579 |
$11,451 |
$11,903 |
09/16 |
$11,596 |
$11,469 |
$11,953 |
10/16 |
$11,286 |
$11,221 |
$11,663 |
11/16 |
$11,979 |
$11,723 |
$12,393 |
12/16 |
$12,249 |
$11,952 |
$12,613 |
01/17 |
$12,400 |
$12,176 |
$12,825 |
02/17 |
$12,710 |
$12,629 |
$13,184 |
03/17 |
$12,667 |
$12,638 |
$13,088 |
04/17 |
$12,684 |
$12,772 |
$13,112 |
05/17 |
$12,759 |
$12,903 |
$13,072 |
06/17 |
$12,884 |
$13,019 |
$13,266 |
07/17 |
$12,945 |
$13,264 |
$13,442 |
08/17 |
$12,693 |
$13,290 |
$13,191 |
09/17 |
$13,118 |
$13,614 |
$13,551 |
10/17 |
$13,300 |
$13,911 |
$13,660 |
11/17 |
$13,700 |
$14,334 |
$14,122 |
12/17 |
$13,843 |
$14,477 |
$14,296 |
01/18 |
$14,118 |
$15,240 |
$14,625 |
02/18 |
$13,437 |
$14,678 |
$13,904 |
03/18 |
$13,446 |
$14,384 |
$13,938 |
04/18 |
$13,517 |
$14,438 |
$14,008 |
05/18 |
$13,660 |
$14,846 |
$14,160 |
06/18 |
$13,686 |
$14,943 |
$14,274 |
07/18 |
$14,063 |
$15,439 |
$14,662 |
08/18 |
$14,182 |
$15,981 |
$14,862 |
09/18 |
$14,110 |
$16,008 |
$14,744 |
10/18 |
$13,030 |
$14,829 |
$13,682 |
11/18 |
$13,235 |
$15,126 |
$14,010 |
12/18 |
$11,942 |
$13,718 |
$12,539 |
01/19 |
$13,292 |
$14,896 |
$13,830 |
02/19 |
$13,885 |
$15,419 |
$14,270 |
03/19 |
$13,892 |
$15,645 |
$14,342 |
04/19 |
$14,541 |
$16,269 |
$14,814 |
05/19 |
$13,487 |
$15,216 |
$13,863 |
06/19 |
$14,410 |
$16,285 |
$14,799 |
07/19 |
$14,614 |
$16,527 |
$14,922 |
08/19 |
$14,180 |
$16,190 |
$14,396 |
09/19 |
$14,691 |
$16,475 |
$14,980 |
10/19 |
$14,569 |
$16,829 |
$15,061 |
11/19 |
$15,017 |
$17,469 |
$15,462 |
12/19 |
$15,650 |
$17,973 |
$15,933 |
01/20 |
$15,191 |
$17,954 |
$15,623 |
02/20 |
$13,507 |
$16,484 |
$14,076 |
03/20 |
$10,506 |
$14,217 |
$10,881 |
04/20 |
$11,901 |
$16,100 |
$12,334 |
05/20 |
$12,362 |
$16,961 |
$12,906 |
06/20 |
$12,468 |
$17,349 |
$13,051 |
07/20 |
$13,174 |
$18,334 |
$13,668 |
08/20 |
$13,751 |
$19,662 |
$14,209 |
09/20 |
$13,574 |
$18,946 |
$13,887 |
10/20 |
$13,747 |
$18,537 |
$14,016 |
11/20 |
$15,969 |
$20,792 |
$15,984 |
12/20 |
$16,639 |
$21,728 |
$16,724 |
01/21 |
$16,408 |
$21,631 |
$16,685 |
02/21 |
$17,952 |
$22,307 |
$17,978 |
03/21 |
$18,862 |
$23,107 |
$18,906 |
04/21 |
$19,757 |
$24,298 |
$19,821 |
05/21 |
$20,118 |
$24,409 |
$20,212 |
06/21 |
$19,700 |
$25,010 |
$19,977 |
07/21 |
$19,671 |
$25,433 |
$20,100 |
08/21 |
$19,905 |
$26,159 |
$20,531 |
09/21 |
$19,341 |
$24,985 |
$19,775 |
10/21 |
$20,394 |
$26,675 |
$20,828 |
11/21 |
$20,409 |
$26,269 |
$20,195 |
12/21 |
$21,884 |
$27,303 |
$21,463 |
01/22 |
$20,831 |
$25,697 |
$20,547 |
02/22 |
$21,145 |
$25,049 |
$20,451 |
03/22 |
$21,312 |
$25,862 |
$21,072 |
04/22 |
$20,007 |
$23,541 |
$19,820 |
05/22 |
$20,589 |
$23,509 |
$20,201 |
06/22 |
$18,364 |
$21,543 |
$17,980 |
07/22 |
$19,987 |
$23,564 |
$19,527 |
08/22 |
$19,512 |
$22,684 |
$18,930 |
09/22 |
$17,724 |
$20,581 |
$17,094 |
10/22 |
$19,578 |
$22,269 |
$18,708 |
11/22 |
$20,760 |
$23,431 |
$19,891 |
12/22 |
$19,768 |
$22,059 |
$18,880 |
01/23 |
$21,287 |
$23,578 |
$20,406 |
02/23 |
$20,703 |
$23,027 |
$19,752 |
03/23 |
$19,876 |
$23,643 |
$19,130 |
04/23 |
$19,926 |
$23,895 |
$19,131 |
05/23 |
$18,906 |
$23,988 |
$18,283 |
06/23 |
$20,661 |
$25,626 |
$19,868 |
07/23 |
$21,334 |
$26,544 |
$20,733 |
08/23 |
$20,476 |
$26,032 |
$20,000 |
09/23 |
$19,302 |
$24,792 |
$18,982 |
10/23 |
$18,325 |
$24,135 |
$18,042 |
11/23 |
$20,295 |
$26,385 |
$19,743 |
12/23 |
$21,751 |
$27,785 |
$21,281 |
01/24 |
$21,616 |
$28,093 |
$20,900 |
02/24 |
$22,443 |
$29,613 |
$21,898 |
03/24 |
$23,728 |
$30,569 |
$23,031 |
04/24 |
$22,900 |
$29,224 |
$21,826 |
05/24 |
$23,542 |
$30,604 |
$22,610 |
06/24 |
$23,133 |
$31,552 |
$22,248 |
07/24 |
$24,623 |
$32,138 |
$23,592 |
08/24 |
$24,966 |
$32,838 |
$24,037 |
09/24 |
$25,311 |
$33,517 |
$24,490 |
10/24 |
$24,814 |
$33,271 |
$24,182 |
11/24 |
$26,271 |
$35,484 |
$25,962 |
12/24 |
$24,486 |
$34,400 |
$24,062 |
01/25 |
$25,133 |
$35,486 |
$24,908 |
02/25 |
$24,702 |
$34,806 |
$24,454 |
03/25 |
$23,821 |
$32,775 |
$23,554 |
04/25 |
$23,101 |
$32,556 |
$22,970 |
05/25 |
$24,253 |
$34,619 |
$23,972 |
06/25 |
$25,151 |
$36,378 |
$24,814 |
07/25 |
$25,684 |
$37,179 |
$25,259 |
08/25 |
$26,786 |
$38,039 |
$26,017 |
09/25 |
$27,085 |
$39,352 |
$26,347 |
10/25 |
$26,975 |
$40,196 |
$26,083 |
11/25 |
$27,710 |
$40,306 |
$26,705 |
12/25 |
$27,734 |
$40,298 |
$26,721 |
01/26 |
$29,017 |
$40,923 |
$27,866 |
02/26 |
$31,469 |
$40,728 |
$29,181 |
|
| Average Annual Return [Table Text Block] |
|
Table Summary
Average Annual Total Returns (%) |
1 year |
5 years |
10 years |
Class R |
27.40 |
11.88 |
12.15 |
Russell 3000® Index |
17.02 |
12.80 |
15.08 |
Russell Midcap® Value Index |
19.33 |
10.17 |
11.30 | |
| No Deduction of Taxes [Text Block] |
|
Performance does not reflect the deduction of taxes that a shareholder may pay on fund distributions or on the redemptions of fund shares.
|
| Updated Performance Information Location [Text Block] |
|
columbiathreadneedleus.com/investment-products/mutual-funds
|
| AssetsNet |
|
$ 2,904,196,404
|
| Holdings Count | Holding |
|
49
|
| Advisory Fees Paid, Amount |
|
$ 18,121,891
|
| InvestmentCompanyPortfolioTurnover |
|
15.00%
|
| Additional Fund Statistics [Text Block] |
|
Table Summary
Fund net assets |
$2,904,196,404 |
Total number of portfolio holdings |
49 |
Management services fees (represents 0.73% of Fund average net assets) |
$18,121,891 |
Portfolio turnover for the reporting period |
15% | |
| Holdings [Text Block] |
|
Table Summary
Industrials |
17.6% |
Financials |
15.7% |
Information Technology |
10.7% |
Consumer Discretionary |
9.5% |
Real Estate |
8.3% |
Utilities |
8.1% |
Health Care |
7.6% |
Consumer Staples |
5.6% |
Materials |
5.6% |
Energy |
5.5% |
Other |
4.3% |
Table Summary
Common Stocks |
98.5% |
Money Market Funds |
1.8% | |
| Largest Holdings [Text Block] |
|
Table Summary
Corning, Inc. |
3.5% |
Entergy Corp. |
3.3% |
AMETEK, Inc. |
2.9% |
ITT, Inc. |
2.9% |
Ameren Corp. |
2.9% |
Marathon Petroleum Corp. |
2.9% |
Southwest Airlines Co. |
2.7% |
Welltower, Inc. |
2.7% |
Devon Energy Corp. |
2.6% |
Quest Diagnostics, Inc. |
2.5% | |
| Material Fund Change [Text Block] |
|
|
| C000253704 |
|
|
| Shareholder Report [Line Items] |
|
|
| Fund Name |
|
Columbia Select Mid Cap Value Fund
|
| Class Name |
|
Class S
|
| Trading Symbol |
|
NAMBX
|
| Annual or Semi-Annual Statement [Text Block] |
|
This annual shareholder report contains important information about Columbia Select Mid Cap Value Fund (the Fund) for the period of March 1, 2025 to February 28, 2026.
|
| Additional Information [Text Block] |
|
You can find additional information about the Fund at columbiathreadneedleus.com/resources/literature. You can also request more information by contacting us at 1-800-345-6611.
|
| Additional Information Phone Number |
|
1-800-345-6611
|
| Additional Information Website |
|
columbiathreadneedleus.com/resources/literature
|
| Expenses [Text Block] |
|
What were the Fund costs for the reporting period? (Based on a hypothetical $10,000 investment)
Table Summary
Class |
Cost of a $10,000 investment |
Cost paid as a percentage of a $10,000 investment |
Class S |
$100 |
0.88% | |
| Expenses Paid, Amount |
|
$ 100
|
| Expense Ratio, Percent |
|
0.88%
|
| Factors Affecting Performance [Text Block] |
|
Management's Discussion of Fund Performance The performance of Class S shares for the period presented is shown in the Average Annual Total Returns table. Top Performance ContributorsStock selection | Selections in the industrials, information technology and real estate sectors contributed to the Fund’s relative performance during the annual period. Allocations | Allocations to the consumer staples, materials and industrials sectors lifted the Fund’s relative performance during the annual period. Individual holdings | Positions in Corning, a manufacturer of specialty glass, ceramics, and optical materials; Teradyne, a leading supplier of automated test equipment used across semiconductor and electronics markets; ATI, a producer of high performance materials and components for aerospace and defense applications; CACI, a provider of information technology and professional services for government clients; and Freeport-McMoRan, Inc., one of the world’s largest publicly traded producers of copper and other critical minerals, were top contributors during the period. Top Performance DetractorsStock selection | Selections in the health care, financials and utilities sectors hurt the Fund’s relative performance during the annual period. Allocations | Allocations to the information technology, financials and energy sectors detracted from the Fund’s relative performance. Individual holdings | Positions in Kemper, a provider of insurance products across property, casualty, and life markets; SanDisk, a global manufacturer of flash memory storage solutions; Western Digital, a leading developer of hard disk drives and data storage technologies; Global Payments, a provider of payment technology and software solutions to merchants worldwide; and Voya Financial, a diversified financial services company specializing in retirement, investment, and insurance products, were top detractors during the period. |
| Performance Past Does Not Indicate Future [Text] |
|
The Fund's past performance is not a good predictor of the Fund's future performance.
|
| Line Graph [Table Text Block] |
|
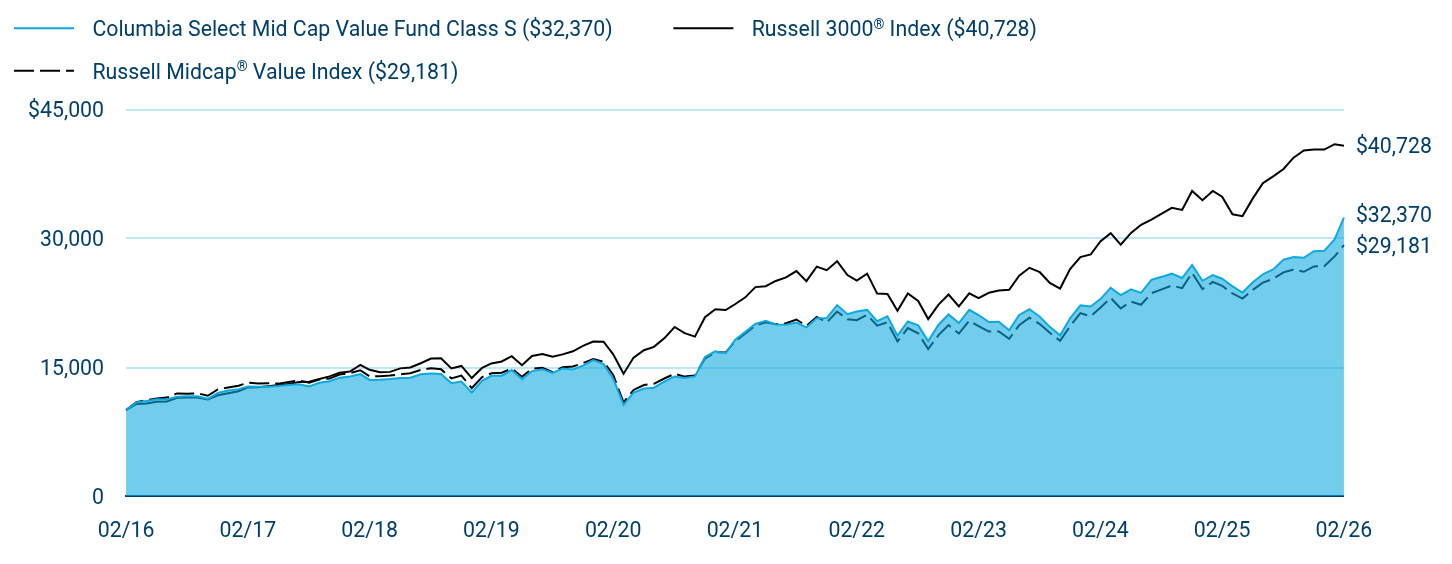
Table Summary
|
Columbia Select Mid Cap Value Fund Class S ($32,370) |
Russell 3000® Index ($40,728) |
Russell Midcap® Value Index ($29,181) |
02/16 |
$10,000 |
$10,000 |
$10,000 |
03/16 |
$10,872 |
$10,704 |
$10,923 |
04/16 |
$11,051 |
$10,770 |
$11,158 |
05/16 |
$11,253 |
$10,963 |
$11,340 |
06/16 |
$11,238 |
$10,986 |
$11,444 |
07/16 |
$11,556 |
$11,422 |
$11,929 |
08/16 |
$11,596 |
$11,451 |
$11,903 |
09/16 |
$11,613 |
$11,469 |
$11,953 |
10/16 |
$11,302 |
$11,221 |
$11,663 |
11/16 |
$11,995 |
$11,723 |
$12,393 |
12/16 |
$12,271 |
$11,952 |
$12,613 |
01/17 |
$12,431 |
$12,176 |
$12,825 |
02/17 |
$12,741 |
$12,629 |
$13,184 |
03/17 |
$12,697 |
$12,638 |
$13,088 |
04/17 |
$12,722 |
$12,772 |
$13,112 |
05/17 |
$12,798 |
$12,903 |
$13,072 |
06/17 |
$12,922 |
$13,019 |
$13,266 |
07/17 |
$12,991 |
$13,264 |
$13,442 |
08/17 |
$12,739 |
$13,290 |
$13,191 |
09/17 |
$13,164 |
$13,614 |
$13,551 |
10/17 |
$13,355 |
$13,911 |
$13,660 |
11/17 |
$13,764 |
$14,334 |
$14,122 |
12/17 |
$13,907 |
$14,477 |
$14,296 |
01/18 |
$14,182 |
$15,240 |
$14,625 |
02/18 |
$13,500 |
$14,678 |
$13,904 |
03/18 |
$13,508 |
$14,384 |
$13,938 |
04/18 |
$13,599 |
$14,438 |
$14,008 |
05/18 |
$13,732 |
$14,846 |
$14,160 |
06/18 |
$13,766 |
$14,943 |
$14,274 |
07/18 |
$14,155 |
$15,439 |
$14,662 |
08/18 |
$14,263 |
$15,981 |
$14,862 |
09/18 |
$14,200 |
$16,008 |
$14,744 |
10/18 |
$13,118 |
$14,829 |
$13,682 |
11/18 |
$13,323 |
$15,126 |
$14,010 |
12/18 |
$12,036 |
$13,718 |
$12,539 |
01/19 |
$13,388 |
$14,896 |
$13,830 |
02/19 |
$13,983 |
$15,419 |
$14,270 |
03/19 |
$13,998 |
$15,645 |
$14,342 |
04/19 |
$14,648 |
$16,269 |
$14,814 |
05/19 |
$13,591 |
$15,216 |
$13,863 |
06/19 |
$14,527 |
$16,285 |
$14,799 |
07/19 |
$14,744 |
$16,527 |
$14,922 |
08/19 |
$14,309 |
$16,190 |
$14,396 |
09/19 |
$14,817 |
$16,475 |
$14,980 |
10/19 |
$14,708 |
$16,829 |
$15,061 |
11/19 |
$15,158 |
$17,469 |
$15,462 |
12/19 |
$15,803 |
$17,973 |
$15,933 |
01/20 |
$15,342 |
$17,954 |
$15,623 |
02/20 |
$13,637 |
$16,484 |
$14,076 |
03/20 |
$10,605 |
$14,217 |
$10,881 |
04/20 |
$12,035 |
$16,100 |
$12,334 |
05/20 |
$12,498 |
$16,961 |
$12,906 |
06/20 |
$12,598 |
$17,349 |
$13,051 |
07/20 |
$13,308 |
$18,334 |
$13,668 |
08/20 |
$13,903 |
$19,662 |
$14,209 |
09/20 |
$13,734 |
$18,946 |
$13,887 |
10/20 |
$13,908 |
$18,537 |
$14,016 |
11/20 |
$16,158 |
$20,792 |
$15,984 |
12/20 |
$16,827 |
$21,728 |
$16,724 |
01/21 |
$16,609 |
$21,631 |
$16,685 |
02/21 |
$18,164 |
$22,307 |
$17,978 |
03/21 |
$19,092 |
$23,107 |
$18,906 |
04/21 |
$20,008 |
$24,298 |
$19,821 |
05/21 |
$20,386 |
$24,409 |
$20,212 |
06/21 |
$19,961 |
$25,010 |
$19,977 |
07/21 |
$19,932 |
$25,433 |
$20,100 |
08/21 |
$20,183 |
$26,159 |
$20,531 |
09/21 |
$19,612 |
$24,985 |
$19,775 |
10/21 |
$20,674 |
$26,675 |
$20,828 |
11/21 |
$20,704 |
$26,269 |
$20,195 |
12/21 |
$22,205 |
$27,303 |
$21,463 |
01/22 |
$21,143 |
$25,697 |
$20,547 |
02/22 |
$21,460 |
$25,049 |
$20,451 |
03/22 |
$21,642 |
$25,862 |
$21,072 |
04/22 |
$20,325 |
$23,541 |
$19,820 |
05/22 |
$20,912 |
$23,509 |
$20,201 |
06/22 |
$18,648 |
$21,543 |
$17,980 |
07/22 |
$20,304 |
$23,564 |
$19,527 |
08/22 |
$19,840 |
$22,684 |
$18,930 |
09/22 |
$18,012 |
$20,581 |
$17,094 |
10/22 |
$19,920 |
$22,269 |
$18,708 |
11/22 |
$21,114 |
$23,431 |
$19,891 |
12/22 |
$20,107 |
$22,059 |
$18,880 |
01/23 |
$21,660 |
$23,578 |
$20,406 |
02/23 |
$21,052 |
$23,027 |
$19,752 |
03/23 |
$20,230 |
$23,643 |
$19,130 |
04/23 |
$20,280 |
$23,895 |
$19,131 |
05/23 |
$19,266 |
$23,988 |
$18,283 |
06/23 |
$21,054 |
$25,626 |
$19,868 |
07/23 |
$21,718 |
$26,544 |
$20,733 |
08/23 |
$20,849 |
$26,032 |
$20,000 |
09/23 |
$19,674 |
$24,792 |
$18,982 |
10/23 |
$18,684 |
$24,135 |
$18,042 |
11/23 |
$20,680 |
$26,385 |
$19,743 |
12/23 |
$22,168 |
$27,785 |
$21,281 |
01/24 |
$22,049 |
$28,093 |
$20,900 |
02/24 |
$22,904 |
$29,613 |
$21,898 |
03/24 |
$24,204 |
$30,569 |
$23,031 |
04/24 |
$23,364 |
$29,224 |
$21,826 |
05/24 |
$24,033 |
$30,604 |
$22,610 |
06/24 |
$23,633 |
$31,552 |
$22,248 |
07/24 |
$25,145 |
$32,138 |
$23,592 |
08/24 |
$25,493 |
$32,838 |
$24,037 |
09/24 |
$25,859 |
$33,517 |
$24,490 |
10/24 |
$25,355 |
$33,271 |
$24,182 |
11/24 |
$26,864 |
$35,484 |
$25,962 |
12/24 |
$25,035 |
$34,400 |
$24,062 |
01/25 |
$25,708 |
$35,486 |
$24,908 |
02/25 |
$25,272 |
$34,806 |
$24,454 |
03/25 |
$24,392 |
$32,775 |
$23,554 |
04/25 |
$23,663 |
$32,556 |
$22,970 |
05/25 |
$24,866 |
$34,619 |
$23,972 |
06/25 |
$25,789 |
$36,378 |
$24,814 |
07/25 |
$26,348 |
$37,179 |
$25,259 |
08/25 |
$27,485 |
$38,039 |
$26,017 |
09/25 |
$27,803 |
$39,352 |
$26,347 |
10/25 |
$27,710 |
$40,196 |
$26,083 |
11/25 |
$28,475 |
$40,306 |
$26,705 |
12/25 |
$28,516 |
$40,298 |
$26,721 |
01/26 |
$29,840 |
$40,923 |
$27,866 |
02/26 |
$32,370 |
$40,728 |
$29,181 |
|
| Average Annual Return [Table Text Block] |
|
Table Summary
Average Annual Total Returns (%) |
1 year |
5 years |
10 years |
Class SFootnote Reference(a) |
28.09 |
12.25 |
12.46 |
Russell 3000® Index |
17.02 |
12.80 |
15.08 |
Russell Midcap® Value Index |
19.33 |
10.17 |
11.30 | |
| No Deduction of Taxes [Text Block] |
|
Performance does not reflect the deduction of taxes that a shareholder may pay on fund distributions or on the redemptions of fund shares.
|
| Updated Performance Information Location [Text Block] |
|
columbiathreadneedleus.com/investment-products/mutual-funds
|
| AssetsNet |
|
$ 2,904,196,404
|
| Holdings Count | Holding |
|
49
|
| Advisory Fees Paid, Amount |
|
$ 18,121,891
|
| InvestmentCompanyPortfolioTurnover |
|
15.00%
|
| Additional Fund Statistics [Text Block] |
|
Table Summary
Fund net assets |
$2,904,196,404 |
Total number of portfolio holdings |
49 |
Management services fees (represents 0.73% of Fund average net assets) |
$18,121,891 |
Portfolio turnover for the reporting period |
15% | |
| Holdings [Text Block] |
|
Table Summary
Industrials |
17.6% |
Financials |
15.7% |
Information Technology |
10.7% |
Consumer Discretionary |
9.5% |
Real Estate |
8.3% |
Utilities |
8.1% |
Health Care |
7.6% |
Consumer Staples |
5.6% |
Materials |
5.6% |
Energy |
5.5% |
Other |
4.3% |
Table Summary
Common Stocks |
98.5% |
Money Market Funds |
1.8% | |
| Largest Holdings [Text Block] |
|
Table Summary
Corning, Inc. |
3.5% |
Entergy Corp. |
3.3% |
AMETEK, Inc. |
2.9% |
ITT, Inc. |
2.9% |
Ameren Corp. |
2.9% |
Marathon Petroleum Corp. |
2.9% |
Southwest Airlines Co. |
2.7% |
Welltower, Inc. |
2.7% |
Devon Energy Corp. |
2.6% |
Quest Diagnostics, Inc. |
2.5% | |
| Material Fund Change [Text Block] |
|
|
| C000122577 |
|
|
| Shareholder Report [Line Items] |
|
|
| Fund Name |
|
Columbia Select Mid Cap Value Fund
|
| Class Name |
|
Institutional 2 Class
|
| Trading Symbol |
|
CVERX
|
| Annual or Semi-Annual Statement [Text Block] |
|
This annual shareholder report contains important information about Columbia Select Mid Cap Value Fund (the Fund) for the period of March 1, 2025 to February 28, 2026.
|
| Additional Information [Text Block] |
|
You can find additional information about the Fund at columbiathreadneedleus.com/resources/literature. You can also request more information by contacting us at 1-800-345-6611.
|
| Additional Information Phone Number |
|
1-800-345-6611
|
| Additional Information Website |
|
columbiathreadneedleus.com/resources/literature
|
| Expenses [Text Block] |
|
What were the Fund costs for the reporting period? (Based on a hypothetical $10,000 investment)
Table Summary
Class |
Cost of a $10,000 investment |
Cost paid as a percentage of a $10,000 investment |
Institutional 2 Class |
$92 |
0.81% | |
| Expenses Paid, Amount |
|
$ 92
|
| Expense Ratio, Percent |
|
0.81%
|
| Factors Affecting Performance [Text Block] |
|
Management's Discussion of Fund Performance The performance of Institutional 2 Class shares for the period presented is shown in the Average Annual Total Returns table. Top Performance ContributorsStock selection | Selections in the industrials, information technology and real estate sectors contributed to the Fund’s relative performance during the annual period. Allocations | Allocations to the consumer staples, materials and industrials sectors lifted the Fund’s relative performance during the annual period. Individual holdings | Positions in Corning, a manufacturer of specialty glass, ceramics, and optical materials; Teradyne, a leading supplier of automated test equipment used across semiconductor and electronics markets; ATI, a producer of high performance materials and components for aerospace and defense applications; CACI, a provider of information technology and professional services for government clients; and Freeport-McMoRan, Inc., one of the world’s largest publicly traded producers of copper and other critical minerals, were top contributors during the period. Top Performance DetractorsStock selection | Selections in the health care, financials and utilities sectors hurt the Fund’s relative performance during the annual period. Allocations | Allocations to the information technology, financials and energy sectors detracted from the Fund’s relative performance. Individual holdings | Positions in Kemper, a provider of insurance products across property, casualty, and life markets; SanDisk, a global manufacturer of flash memory storage solutions; Western Digital, a leading developer of hard disk drives and data storage technologies; Global Payments, a provider of payment technology and software solutions to merchants worldwide; and Voya Financial, a diversified financial services company specializing in retirement, investment, and insurance products, were top detractors during the period. |
| Performance Past Does Not Indicate Future [Text] |
|
The Fund's past performance is not a good predictor of the Fund's future performance.
|
| Line Graph [Table Text Block] |
|

Table Summary
|
Columbia Select Mid Cap Value Fund Institutional 2 Class ($33,414) |
Russell 3000® Index ($40,728) |
Russell Midcap® Value Index ($29,181) |
02/16 |
$10,000 |
$10,000 |
$10,000 |
03/16 |
$10,869 |
$10,704 |
$10,923 |
04/16 |
$11,052 |
$10,770 |
$11,158 |
05/16 |
$11,265 |
$10,963 |
$11,340 |
06/16 |
$11,245 |
$10,986 |
$11,444 |
07/16 |
$11,572 |
$11,422 |
$11,929 |
08/16 |
$11,611 |
$11,451 |
$11,903 |
09/16 |
$11,638 |
$11,469 |
$11,953 |
10/16 |
$11,334 |
$11,221 |
$11,663 |
11/16 |
$12,028 |
$11,723 |
$12,393 |
12/16 |
$12,310 |
$11,952 |
$12,613 |
01/17 |
$12,466 |
$12,176 |
$12,825 |
02/17 |
$12,786 |
$12,629 |
$13,184 |
03/17 |
$12,746 |
$12,638 |
$13,088 |
04/17 |
$12,779 |
$12,772 |
$13,112 |
05/17 |
$12,861 |
$12,903 |
$13,072 |
06/17 |
$12,986 |
$13,019 |
$13,266 |
07/17 |
$13,054 |
$13,264 |
$13,442 |
08/17 |
$12,807 |
$13,290 |
$13,191 |
09/17 |
$13,244 |
$13,614 |
$13,551 |
10/17 |
$13,440 |
$13,911 |
$13,660 |
11/17 |
$13,849 |
$14,334 |
$14,122 |
12/17 |
$13,993 |
$14,477 |
$14,296 |
01/18 |
$14,282 |
$15,240 |
$14,625 |
02/18 |
$13,595 |
$14,678 |
$13,904 |
03/18 |
$13,614 |
$14,384 |
$13,938 |
04/18 |
$13,704 |
$14,438 |
$14,008 |
05/18 |
$13,843 |
$14,846 |
$14,160 |
06/18 |
$13,889 |
$14,943 |
$14,274 |
07/18 |
$14,280 |
$15,439 |
$14,662 |
08/18 |
$14,396 |
$15,981 |
$14,862 |
09/18 |
$14,336 |
$16,008 |
$14,744 |
10/18 |
$13,245 |
$14,829 |
$13,682 |
11/18 |
$13,457 |
$15,126 |
$14,010 |
12/18 |
$12,154 |
$13,718 |
$12,539 |
01/19 |
$13,533 |
$14,896 |
$13,830 |
02/19 |
$14,138 |
$15,419 |
$14,270 |
03/19 |
$14,151 |
$15,645 |
$14,342 |
04/19 |
$14,823 |
$16,269 |
$14,814 |
05/19 |
$13,756 |
$15,216 |
$13,863 |
06/19 |
$14,705 |
$16,285 |
$14,799 |
07/19 |
$14,930 |
$16,527 |
$14,922 |
08/19 |
$14,493 |
$16,190 |
$14,396 |
09/19 |
$15,014 |
$16,475 |
$14,980 |
10/19 |
$14,908 |
$16,829 |
$15,061 |
11/19 |
$15,373 |
$17,469 |
$15,462 |
12/19 |
$16,014 |
$17,973 |
$15,933 |
01/20 |
$15,552 |
$17,954 |
$15,623 |
02/20 |
$13,837 |
$16,484 |
$14,076 |
03/20 |
$10,776 |
$14,217 |
$10,881 |
04/20 |
$12,212 |
$16,100 |
$12,334 |
05/20 |
$12,691 |
$16,961 |
$12,906 |
06/20 |
$12,798 |
$17,349 |
$13,051 |
07/20 |
$13,533 |
$18,334 |
$13,668 |
08/20 |
$14,140 |
$19,662 |
$14,209 |
09/20 |
$13,959 |
$18,946 |
$13,887 |
10/20 |
$14,143 |
$18,537 |
$14,016 |
11/20 |
$16,437 |
$20,792 |
$15,984 |
12/20 |
$17,132 |
$21,728 |
$16,724 |
01/21 |
$16,905 |
$21,631 |
$16,685 |
02/21 |
$18,508 |
$22,307 |
$17,978 |
03/21 |
$19,456 |
$23,107 |
$18,906 |
04/21 |
$20,394 |
$24,298 |
$19,821 |
05/21 |
$20,777 |
$24,409 |
$20,212 |
06/21 |
$20,351 |
$25,010 |
$19,977 |
07/21 |
$20,323 |
$25,433 |
$20,100 |
08/21 |
$20,582 |
$26,159 |
$20,531 |
09/21 |
$20,013 |
$24,985 |
$19,775 |
10/21 |
$21,109 |
$26,675 |
$20,828 |
11/21 |
$21,138 |
$26,269 |
$20,195 |
12/21 |
$22,668 |
$27,303 |
$21,463 |
01/22 |
$21,601 |
$25,697 |
$20,547 |
02/22 |
$21,926 |
$25,049 |
$20,451 |
03/22 |
$22,121 |
$25,862 |
$21,072 |
04/22 |
$20,773 |
$23,541 |
$19,820 |
05/22 |
$21,393 |
$23,509 |
$20,201 |
06/22 |
$19,076 |
$21,543 |
$17,980 |
07/22 |
$20,789 |
$23,564 |
$19,527 |
08/22 |
$20,304 |
$22,684 |
$18,930 |
09/22 |
$18,440 |
$20,581 |
$17,094 |
10/22 |
$20,399 |
$22,269 |
$18,708 |
11/22 |
$21,630 |
$23,431 |
$19,891 |
12/22 |
$20,615 |
$22,059 |
$18,880 |
01/23 |
$22,197 |
$23,578 |
$20,406 |
02/23 |
$21,604 |
$23,027 |
$19,752 |
03/23 |
$20,753 |
$23,643 |
$19,130 |
04/23 |
$20,819 |
$23,895 |
$19,131 |
05/23 |
$19,762 |
$23,988 |
$18,283 |
06/23 |
$21,609 |
$25,626 |
$19,868 |
07/23 |
$22,308 |
$26,544 |
$20,733 |
08/23 |
$21,426 |
$26,032 |
$20,000 |
09/23 |
$20,212 |
$24,792 |
$18,982 |
10/23 |
$19,210 |
$24,135 |
$18,042 |
11/23 |
$21,263 |
$26,385 |
$19,743 |
12/23 |
$22,803 |
$27,785 |
$21,281 |
01/24 |
$22,669 |
$28,093 |
$20,900 |
02/24 |
$23,556 |
$29,613 |
$21,898 |
03/24 |
$24,915 |
$30,569 |
$23,031 |
04/24 |
$24,059 |
$29,224 |
$21,826 |
05/24 |
$24,747 |
$30,604 |
$22,610 |
06/24 |
$24,342 |
$31,552 |
$22,248 |
07/24 |
$25,908 |
$32,138 |
$23,592 |
08/24 |
$26,283 |
$32,838 |
$24,037 |
09/24 |
$26,662 |
$33,517 |
$24,490 |
10/24 |
$26,150 |
$33,271 |
$24,182 |
11/24 |
$27,703 |
$35,484 |
$25,962 |
12/24 |
$25,825 |
$34,400 |
$24,062 |
01/25 |
$26,521 |
$35,486 |
$24,908 |
02/25 |
$26,075 |
$34,806 |
$24,454 |
03/25 |
$25,164 |
$32,775 |
$23,554 |
04/25 |
$24,411 |
$32,556 |
$22,970 |
05/25 |
$25,647 |
$34,619 |
$23,972 |
06/25 |
$26,613 |
$36,378 |
$24,814 |
07/25 |
$27,180 |
$37,179 |
$25,259 |
08/25 |
$28,350 |
$38,039 |
$26,017 |
09/25 |
$28,704 |
$39,352 |
$26,347 |
10/25 |
$28,594 |
$40,196 |
$26,083 |
11/25 |
$29,382 |
$40,306 |
$26,705 |
12/25 |
$29,428 |
$40,298 |
$26,721 |
01/26 |
$30,802 |
$40,923 |
$27,866 |
02/26 |
$33,414 |
$40,728 |
$29,181 |
|
| Average Annual Return [Table Text Block] |
|
Table Summary
Average Annual Total Returns (%) |
1 year |
5 years |
10 years |
Institutional 2 Class |
28.15 |
12.54 |
12.82 |
Russell 3000® Index |
17.02 |
12.80 |
15.08 |
Russell Midcap® Value Index |
19.33 |
10.17 |
11.30 | |
| No Deduction of Taxes [Text Block] |
|
Performance does not reflect the deduction of taxes that a shareholder may pay on fund distributions or on the redemptions of fund shares.
|
| Updated Performance Information Location [Text Block] |
|
columbiathreadneedleus.com/investment-products/mutual-funds
|
| AssetsNet |
|
$ 2,904,196,404
|
| Holdings Count | Holding |
|
49
|
| Advisory Fees Paid, Amount |
|
$ 18,121,891
|
| InvestmentCompanyPortfolioTurnover |
|
15.00%
|
| Additional Fund Statistics [Text Block] |
|
Table Summary
Fund net assets |
$2,904,196,404 |
Total number of portfolio holdings |
49 |
Management services fees (represents 0.73% of Fund average net assets) |
$18,121,891 |
Portfolio turnover for the reporting period |
15% | |
| Holdings [Text Block] |
|
Table Summary
Industrials |
17.6% |
Financials |
15.7% |
Information Technology |
10.7% |
Consumer Discretionary |
9.5% |
Real Estate |
8.3% |
Utilities |
8.1% |
Health Care |
7.6% |
Consumer Staples |
5.6% |
Materials |
5.6% |
Energy |
5.5% |
Other |
4.3% |
Table Summary
Common Stocks |
98.5% |
Money Market Funds |
1.8% | |
| Largest Holdings [Text Block] |
|
Table Summary
Corning, Inc. |
3.5% |
Entergy Corp. |
3.3% |
AMETEK, Inc. |
2.9% |
ITT, Inc. |
2.9% |
Ameren Corp. |
2.9% |
Marathon Petroleum Corp. |
2.9% |
Southwest Airlines Co. |
2.7% |
Welltower, Inc. |
2.7% |
Devon Energy Corp. |
2.6% |
Quest Diagnostics, Inc. |
2.5% | |
| Material Fund Change [Text Block] |
|
|
| C000079026 |
|
|
| Shareholder Report [Line Items] |
|
|
| Fund Name |
|
Columbia Select Mid Cap Value Fund
|
| Class Name |
|
Institutional 3 Class
|
| Trading Symbol |
|
CMVYX
|
| Annual or Semi-Annual Statement [Text Block] |
|
This annual shareholder report contains important information about Columbia Select Mid Cap Value Fund (the Fund) for the period of March 1, 2025 to February 28, 2026.
|
| Additional Information [Text Block] |
|
You can find additional information about the Fund at columbiathreadneedleus.com/resources/literature. You can also request more information by contacting us at 1-800-345-6611.
|
| Additional Information Phone Number |
|
1-800-345-6611
|
| Additional Information Website |
|
columbiathreadneedleus.com/resources/literature
|
| Expenses [Text Block] |
|
What were the Fund costs for the reporting period? (Based on a hypothetical $10,000 investment)
Table Summary
Class |
Cost of a $10,000 investment |
Cost paid as a percentage of a $10,000 investment |
Institutional 3 Class |
$87 |
0.76% | |
| Expenses Paid, Amount |
|
$ 87
|
| Expense Ratio, Percent |
|
0.76%
|
| Factors Affecting Performance [Text Block] |
|
Management's Discussion of Fund Performance The performance of Institutional 3 Class shares for the period presented is shown in the Average Annual Total Returns table. Top Performance ContributorsStock selection | Selections in the industrials, information technology and real estate sectors contributed to the Fund’s relative performance during the annual period. Allocations | Allocations to the consumer staples, materials and industrials sectors lifted the Fund’s relative performance during the annual period. Individual holdings | Positions in Corning, a manufacturer of specialty glass, ceramics, and optical materials; Teradyne, a leading supplier of automated test equipment used across semiconductor and electronics markets; ATI, a producer of high performance materials and components for aerospace and defense applications; CACI, a provider of information technology and professional services for government clients; and Freeport-McMoRan, Inc., one of the world’s largest publicly traded producers of copper and other critical minerals, were top contributors during the period. Top Performance DetractorsStock selection | Selections in the health care, financials and utilities sectors hurt the Fund’s relative performance during the annual period. Allocations | Allocations to the information technology, financials and energy sectors detracted from the Fund’s relative performance. Individual holdings | Positions in Kemper, a provider of insurance products across property, casualty, and life markets; SanDisk, a global manufacturer of flash memory storage solutions; Western Digital, a leading developer of hard disk drives and data storage technologies; Global Payments, a provider of payment technology and software solutions to merchants worldwide; and Voya Financial, a diversified financial services company specializing in retirement, investment, and insurance products, were top detractors during the period. |
| Performance Past Does Not Indicate Future [Text] |
|
The Fund's past performance is not a good predictor of the Fund's future performance.
|
| Line Graph [Table Text Block] |
|
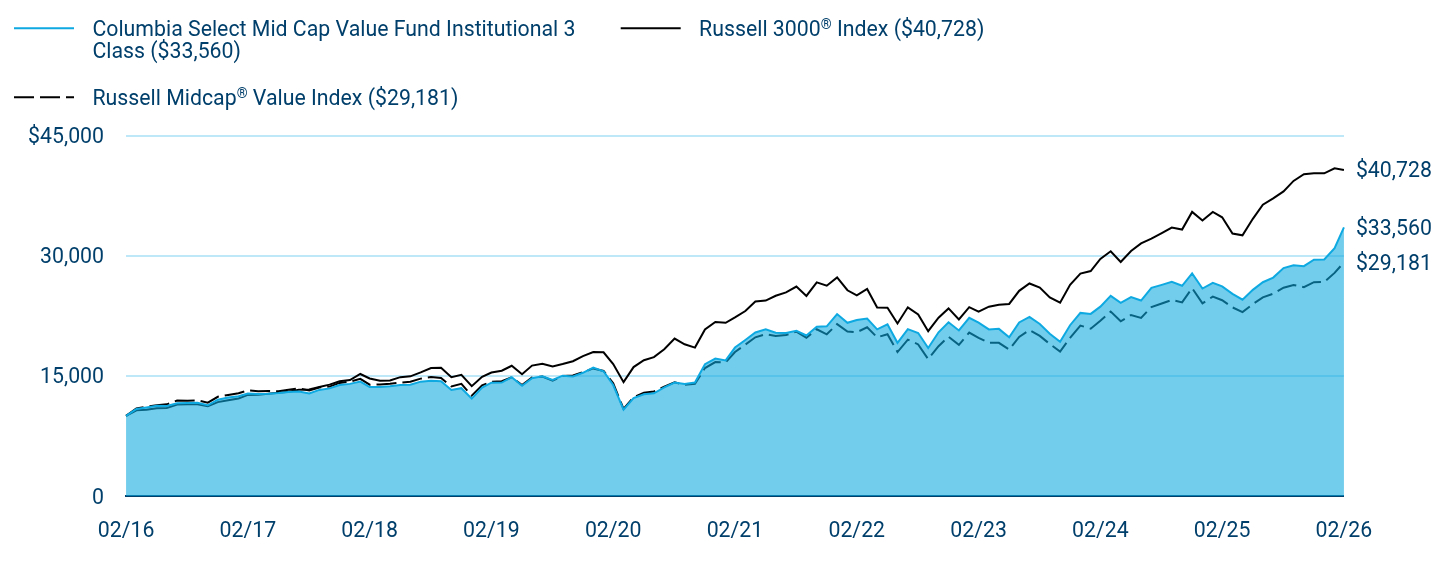
Table Summary
|
Columbia Select Mid Cap Value Fund Institutional 3 Class ($33,560) |
Russell 3000® Index ($40,728) |
Russell Midcap® Value Index ($29,181) |
02/16 |
$10,000 |
$10,000 |
$10,000 |
03/16 |
$10,867 |
$10,704 |
$10,923 |
04/16 |
$11,054 |
$10,770 |
$11,158 |
05/16 |
$11,263 |
$10,963 |
$11,340 |
06/16 |
$11,245 |
$10,986 |
$11,444 |
07/16 |
$11,571 |
$11,422 |
$11,929 |
08/16 |
$11,611 |
$11,451 |
$11,903 |
09/16 |
$11,633 |
$11,469 |
$11,953 |
10/16 |
$11,330 |
$11,221 |
$11,663 |
11/16 |
$12,032 |
$11,723 |
$12,393 |
12/16 |
$12,305 |
$11,952 |
$12,613 |
01/17 |
$12,465 |
$12,176 |
$12,825 |
02/17 |
$12,794 |
$12,629 |
$13,184 |
03/17 |
$12,754 |
$12,638 |
$13,088 |
04/17 |
$12,779 |
$12,772 |
$13,112 |
05/17 |
$12,863 |
$12,903 |
$13,072 |
06/17 |
$12,993 |
$13,019 |
$13,266 |
07/17 |
$13,063 |
$13,264 |
$13,442 |
08/17 |
$12,818 |
$13,290 |
$13,191 |
09/17 |
$13,250 |
$13,614 |
$13,551 |
10/17 |
$13,443 |
$13,911 |
$13,660 |
11/17 |
$13,855 |
$14,334 |
$14,122 |
12/17 |
$14,004 |
$14,477 |
$14,296 |
01/18 |
$14,291 |
$15,240 |
$14,625 |
02/18 |
$13,604 |
$14,678 |
$13,904 |
03/18 |
$13,625 |
$14,384 |
$13,938 |
04/18 |
$13,707 |
$14,438 |
$14,008 |
05/18 |
$13,851 |
$14,846 |
$14,160 |
06/18 |
$13,889 |
$14,943 |
$14,274 |
07/18 |
$14,282 |
$15,439 |
$14,662 |
08/18 |
$14,402 |
$15,981 |
$14,862 |
09/18 |
$14,341 |
$16,008 |
$14,744 |
10/18 |
$13,247 |
$14,829 |
$13,682 |
11/18 |
$13,466 |
$15,126 |
$14,010 |
12/18 |
$12,167 |
$13,718 |
$12,539 |
01/19 |
$13,535 |
$14,896 |
$13,830 |
02/19 |
$14,151 |
$15,419 |
$14,270 |
03/19 |
$14,166 |
$15,645 |
$14,342 |
04/19 |
$14,839 |
$16,269 |
$14,814 |
05/19 |
$13,768 |
$15,216 |
$13,863 |
06/19 |
$14,718 |
$16,285 |
$14,799 |
07/19 |
$14,952 |
$16,527 |
$14,922 |
08/19 |
$14,510 |
$16,190 |
$14,396 |
09/19 |
$15,027 |
$16,475 |
$14,980 |
10/19 |
$14,931 |
$16,829 |
$15,061 |
11/19 |
$15,388 |
$17,469 |
$15,462 |
12/19 |
$16,045 |
$17,973 |
$15,933 |
01/20 |
$15,576 |
$17,954 |
$15,623 |
02/20 |
$13,858 |
$16,484 |
$14,076 |
03/20 |
$10,779 |
$14,217 |
$10,881 |
04/20 |
$12,235 |
$16,100 |
$12,334 |
05/20 |
$12,706 |
$16,961 |
$12,906 |
06/20 |
$12,820 |
$17,349 |
$13,051 |
07/20 |
$13,558 |
$18,334 |
$13,668 |
08/20 |
$14,164 |
$19,662 |
$14,209 |
09/20 |
$13,976 |
$18,946 |
$13,887 |
10/20 |
$14,169 |
$18,537 |
$14,016 |
11/20 |
$16,464 |
$20,792 |
$15,984 |
12/20 |
$17,162 |
$21,728 |
$16,724 |
01/21 |
$16,940 |
$21,631 |
$16,685 |
02/21 |
$18,542 |
$22,307 |
$17,978 |
03/21 |
$19,491 |
$23,107 |
$18,906 |
04/21 |
$20,427 |
$24,298 |
$19,821 |
05/21 |
$20,814 |
$24,409 |
$20,212 |
06/21 |
$20,400 |
$25,010 |
$19,977 |
07/21 |
$20,370 |
$25,433 |
$20,100 |
08/21 |
$20,626 |
$26,159 |
$20,531 |
09/21 |
$20,048 |
$24,985 |
$19,775 |
10/21 |
$21,151 |
$26,675 |
$20,828 |
11/21 |
$21,196 |
$26,269 |
$20,195 |
12/21 |
$22,724 |
$27,303 |
$21,463 |
01/22 |
$21,636 |
$25,697 |
$20,547 |
02/22 |
$21,977 |
$25,049 |
$20,451 |
03/22 |
$22,168 |
$25,862 |
$21,072 |
04/22 |
$20,818 |
$23,541 |
$19,820 |
05/22 |
$21,436 |
$23,509 |
$20,201 |
06/22 |
$19,135 |
$21,543 |
$17,980 |
07/22 |
$20,836 |
$23,564 |
$19,527 |
08/22 |
$20,360 |
$22,684 |
$18,930 |
09/22 |
$18,484 |
$20,581 |
$17,094 |
10/22 |
$20,445 |
$22,269 |
$18,708 |
11/22 |
$21,690 |
$23,431 |
$19,891 |
12/22 |
$20,675 |
$22,059 |
$18,880 |
01/23 |
$22,256 |
$23,578 |
$20,406 |
02/23 |
$21,647 |
$23,027 |
$19,752 |
03/23 |
$20,805 |
$23,643 |
$19,130 |
04/23 |
$20,875 |
$23,895 |
$19,131 |
05/23 |
$19,829 |
$23,988 |
$18,283 |
06/23 |
$21,675 |
$25,626 |
$19,868 |
07/23 |
$22,378 |
$26,544 |
$20,733 |
08/23 |
$21,482 |
$26,032 |
$20,000 |
09/23 |
$20,273 |
$24,792 |
$18,982 |
10/23 |
$19,269 |
$24,135 |
$18,042 |
11/23 |
$21,330 |
$26,385 |
$19,743 |
12/23 |
$22,870 |
$27,785 |
$21,281 |
01/24 |
$22,746 |
$28,093 |
$20,900 |
02/24 |
$23,647 |
$29,613 |
$21,898 |
03/24 |
$24,997 |
$30,569 |
$23,031 |
04/24 |
$24,128 |
$29,224 |
$21,826 |
05/24 |
$24,837 |
$30,604 |
$22,610 |
06/24 |
$24,412 |
$31,552 |
$22,248 |
07/24 |
$25,995 |
$32,138 |
$23,592 |
08/24 |
$26,373 |
$32,838 |
$24,037 |
09/24 |
$26,759 |
$33,517 |
$24,490 |
10/24 |
$26,254 |
$33,271 |
$24,182 |
11/24 |
$27,806 |
$35,484 |
$25,962 |
12/24 |
$25,914 |
$34,400 |
$24,062 |
01/25 |
$26,614 |
$35,486 |
$24,908 |
02/25 |
$26,179 |
$34,806 |
$24,454 |
03/25 |
$25,254 |
$32,775 |
$23,554 |
04/25 |
$24,514 |
$32,556 |
$22,970 |
05/25 |
$25,748 |
$34,619 |
$23,972 |
06/25 |
$26,699 |
$36,378 |
$24,814 |
07/25 |
$27,281 |
$37,179 |
$25,259 |
08/25 |
$28,466 |
$38,039 |
$26,017 |
09/25 |
$28,806 |
$39,352 |
$26,347 |
10/25 |
$28,709 |
$40,196 |
$26,083 |
11/25 |
$29,507 |
$40,306 |
$26,705 |
12/25 |
$29,540 |
$40,298 |
$26,721 |
01/26 |
$30,941 |
$40,923 |
$27,866 |
02/26 |
$33,560 |
$40,728 |
$29,181 |
|
| Average Annual Return [Table Text Block] |
|
Table Summary
Average Annual Total Returns (%) |
1 year |
5 years |
10 years |
Institutional 3 Class |
28.19 |
12.60 |
12.87 |
Russell 3000® Index |
17.02 |
12.80 |
15.08 |
Russell Midcap® Value Index |
19.33 |
10.17 |
11.30 | |
| No Deduction of Taxes [Text Block] |
|
Performance does not reflect the deduction of taxes that a shareholder may pay on fund distributions or on the redemptions of fund shares.
|
| Updated Performance Information Location [Text Block] |
|
columbiathreadneedleus.com/investment-products/mutual-funds
|
| AssetsNet |
|
$ 2,904,196,404
|
| Holdings Count | Holding |
|
49
|
| Advisory Fees Paid, Amount |
|
$ 18,121,891
|
| InvestmentCompanyPortfolioTurnover |
|
15.00%
|
| Additional Fund Statistics [Text Block] |
|
Table Summary
Fund net assets |
$2,904,196,404 |
Total number of portfolio holdings |
49 |
Management services fees (represents 0.73% of Fund average net assets) |
$18,121,891 |
Portfolio turnover for the reporting period |
15% | |
| Holdings [Text Block] |
|
Table Summary
Industrials |
17.6% |
Financials |
15.7% |
Information Technology |
10.7% |
Consumer Discretionary |
9.5% |
Real Estate |
8.3% |
Utilities |
8.1% |
Health Care |
7.6% |
Consumer Staples |
5.6% |
Materials |
5.6% |
Energy |
5.5% |
Other |
4.3% |
Table Summary
Common Stocks |
98.5% |
Money Market Funds |
1.8% | |
| Largest Holdings [Text Block] |
|
Table Summary
Corning, Inc. |
3.5% |
Entergy Corp. |
3.3% |
AMETEK, Inc. |
2.9% |
ITT, Inc. |
2.9% |
Ameren Corp. |
2.9% |
Marathon Petroleum Corp. |
2.9% |
Southwest Airlines Co. |
2.7% |
Welltower, Inc. |
2.7% |
Devon Energy Corp. |
2.6% |
Quest Diagnostics, Inc. |
2.5% | |
| Material Fund Change [Text Block] |
|
|
| C000029854 |
|
|
| Shareholder Report [Line Items] |
|
|
| Fund Name |
|
Columbia Select Mid Cap Value Fund
|
| Class Name |
|
Institutional Class
|
| Trading Symbol |
|
NAMAX
|
| Annual or Semi-Annual Statement [Text Block] |
|
This annual shareholder report contains important information about Columbia Select Mid Cap Value Fund (the Fund) for the period of March 1, 2025 to February 28, 2026.
|
| Additional Information [Text Block] |
|
You can find additional information about the Fund at columbiathreadneedleus.com/resources/literature. You can also request more information by contacting us at 1-800-345-6611.
|
| Additional Information Phone Number |
|
1-800-345-6611
|
| Additional Information Website |
|
columbiathreadneedleus.com/resources/literature
|
| Expenses [Text Block] |
|
What were the Fund costs for the reporting period? (Based on a hypothetical $10,000 investment)
Table Summary
Class |
Cost of a $10,000 investment |
Cost paid as a percentage of a $10,000 investment |
Institutional Class |
$100 |
0.88% | |
| Expenses Paid, Amount |
|
$ 100
|
| Expense Ratio, Percent |
|
0.88%
|
| Factors Affecting Performance [Text Block] |
|
Management's Discussion of Fund Performance The performance of Institutional Class shares for the period presented is shown in the Average Annual Total Returns table. Top Performance ContributorsStock selection | Selections in the industrials, information technology and real estate sectors contributed to the Fund’s relative performance during the annual period. Allocations | Allocations to the consumer staples, materials and industrials sectors lifted the Fund’s relative performance during the annual period. Individual holdings | Positions in Corning, a manufacturer of specialty glass, ceramics, and optical materials; Teradyne, a leading supplier of automated test equipment used across semiconductor and electronics markets; ATI, a producer of high performance materials and components for aerospace and defense applications; CACI, a provider of information technology and professional services for government clients; and Freeport-McMoRan, Inc., one of the world’s largest publicly traded producers of copper and other critical minerals, were top contributors during the period. Top Performance DetractorsStock selection | Selections in the health care, financials and utilities sectors hurt the Fund’s relative performance during the annual period. Allocations | Allocations to the information technology, financials and energy sectors detracted from the Fund’s relative performance. Individual holdings | Positions in Kemper, a provider of insurance products across property, casualty, and life markets; SanDisk, a global manufacturer of flash memory storage solutions; Western Digital, a leading developer of hard disk drives and data storage technologies; Global Payments, a provider of payment technology and software solutions to merchants worldwide; and Voya Financial, a diversified financial services company specializing in retirement, investment, and insurance products, were top detractors during the period. |
| Performance Past Does Not Indicate Future [Text] |
|
The Fund's past performance is not a good predictor of the Fund's future performance.
|
| Line Graph [Table Text Block] |
|
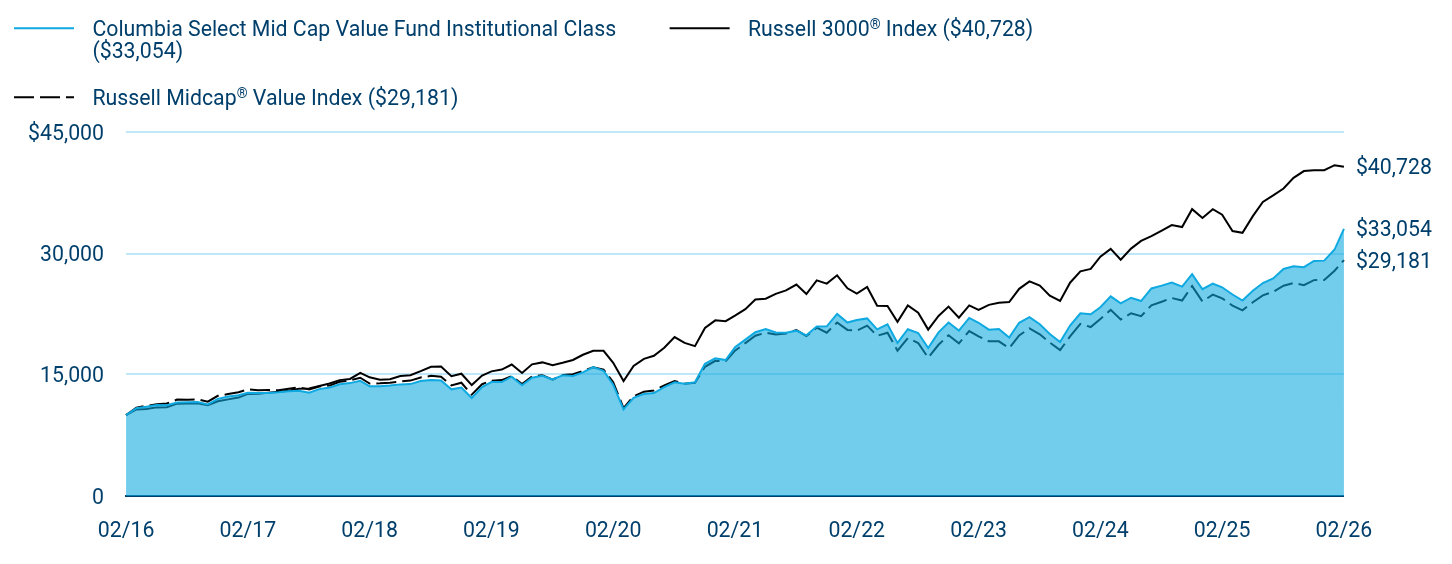
Table Summary
|
Columbia Select Mid Cap Value Fund Institutional Class ($33,054) |
Russell 3000® Index ($40,728) |
Russell Midcap® Value Index ($29,181) |
02/16 |
$10,000 |
$10,000 |
$10,000 |
03/16 |
$10,869 |
$10,704 |
$10,923 |
04/16 |
$11,047 |
$10,770 |
$11,158 |
05/16 |
$11,256 |
$10,963 |
$11,340 |
06/16 |
$11,240 |
$10,986 |
$11,444 |
07/16 |
$11,566 |
$11,422 |
$11,929 |
08/16 |
$11,606 |
$11,451 |
$11,903 |
09/16 |
$11,622 |
$11,469 |
$11,953 |
10/16 |
$11,320 |
$11,221 |
$11,663 |
11/16 |
$12,020 |
$11,723 |
$12,393 |
12/16 |
$12,296 |
$11,952 |
$12,613 |
01/17 |
$12,455 |
$12,176 |
$12,825 |
02/17 |
$12,774 |
$12,629 |
$13,184 |
03/17 |
$12,729 |
$12,638 |
$13,088 |
04/17 |
$12,754 |
$12,772 |
$13,112 |
05/17 |
$12,838 |
$12,903 |
$13,072 |
06/17 |
$12,961 |
$13,019 |
$13,266 |
07/17 |
$13,031 |
$13,264 |
$13,442 |
08/17 |
$12,787 |
$13,290 |
$13,191 |
09/17 |
$13,221 |
$13,614 |
$13,551 |
10/17 |
$13,412 |
$13,911 |
$13,660 |
11/17 |
$13,822 |
$14,334 |
$14,122 |
12/17 |
$13,965 |
$14,477 |
$14,296 |
01/18 |
$14,250 |
$15,240 |
$14,625 |
02/18 |
$13,567 |
$14,678 |
$13,904 |
03/18 |
$13,583 |
$14,384 |
$13,938 |
04/18 |
$13,665 |
$14,438 |
$14,008 |
05/18 |
$13,808 |
$14,846 |
$14,160 |
06/18 |
$13,841 |
$14,943 |
$14,274 |
07/18 |
$14,231 |
$15,439 |
$14,662 |
08/18 |
$14,350 |
$15,981 |
$14,862 |
09/18 |
$14,285 |
$16,008 |
$14,744 |
10/18 |
$13,198 |
$14,829 |
$13,682 |
11/18 |
$13,416 |
$15,126 |
$14,010 |
12/18 |
$12,121 |
$13,718 |
$12,539 |
01/19 |
$13,478 |
$14,896 |
$13,830 |
02/19 |
$14,089 |
$15,419 |
$14,270 |
03/19 |
$14,098 |
$15,645 |
$14,342 |
04/19 |
$14,765 |
$16,269 |
$14,814 |
05/19 |
$13,704 |
$15,216 |
$13,863 |
06/19 |
$14,639 |
$16,285 |
$14,799 |
07/19 |
$14,871 |
$16,527 |
$14,922 |
08/19 |
$14,433 |
$16,190 |
$14,396 |
09/19 |
$14,940 |
$16,475 |
$14,980 |
10/19 |
$14,844 |
$16,829 |
$15,061 |
11/19 |
$15,297 |
$17,469 |
$15,462 |
12/19 |
$15,941 |
$17,973 |
$15,933 |
01/20 |
$15,491 |
$17,954 |
$15,623 |
02/20 |
$13,776 |
$16,484 |
$14,076 |
03/20 |
$10,721 |
$14,217 |
$10,881 |
04/20 |
$12,148 |
$16,100 |
$12,334 |
05/20 |
$12,628 |
$16,961 |
$12,906 |
06/20 |
$12,736 |
$17,349 |
$13,051 |
07/20 |
$13,466 |
$18,334 |
$13,668 |
08/20 |
$14,065 |
$19,662 |
$14,209 |
09/20 |
$13,888 |
$18,946 |
$13,887 |
10/20 |
$14,064 |
$18,537 |
$14,016 |
11/20 |
$16,347 |
$20,792 |
$15,984 |
12/20 |
$17,031 |
$21,728 |
$16,724 |
01/21 |
$16,811 |
$21,631 |
$16,685 |
02/21 |
$18,394 |
$22,307 |
$17,978 |
03/21 |
$19,341 |
$23,107 |
$18,906 |
04/21 |
$20,265 |
$24,298 |
$19,821 |
05/21 |
$20,647 |
$24,409 |
$20,212 |
06/21 |
$20,231 |
$25,010 |
$19,977 |
07/21 |
$20,202 |
$25,433 |
$20,100 |
08/21 |
$20,455 |
$26,159 |
$20,531 |
09/21 |
$19,876 |
$24,985 |
$19,775 |
10/21 |
$20,965 |
$26,675 |
$20,828 |
11/21 |
$20,994 |
$26,269 |
$20,195 |
12/21 |
$22,525 |
$27,303 |
$21,463 |
01/22 |
$21,452 |
$25,697 |
$20,547 |
02/22 |
$21,772 |
$25,049 |
$20,451 |
03/22 |
$21,969 |
$25,862 |
$21,072 |
04/22 |
$20,621 |
$23,541 |
$19,820 |
05/22 |
$21,231 |
$23,509 |
$20,201 |
06/22 |
$18,938 |
$21,543 |
$17,980 |
07/22 |
$20,631 |
$23,564 |
$19,527 |
08/22 |
$20,162 |
$22,684 |
$18,930 |
09/22 |
$18,307 |
$20,581 |
$17,094 |
10/22 |
$20,239 |
$22,269 |
$18,708 |
11/22 |
$21,465 |
$23,431 |
$19,891 |
12/22 |
$20,457 |
$22,059 |
$18,880 |
01/23 |
$22,031 |
$23,578 |
$20,406 |
02/23 |
$21,432 |
$23,027 |
$19,752 |
03/23 |
$20,578 |
$23,643 |
$19,130 |
04/23 |
$20,647 |
$23,895 |
$19,131 |
05/23 |
$19,601 |
$23,988 |
$18,283 |
06/23 |
$21,426 |
$25,626 |
$19,868 |
07/23 |
$22,135 |
$26,544 |
$20,733 |
08/23 |
$21,254 |
$26,032 |
$20,000 |
09/23 |
$20,040 |
$24,792 |
$18,982 |
10/23 |
$19,035 |
$24,135 |
$18,042 |
11/23 |
$21,079 |
$26,385 |
$19,743 |
12/23 |
$22,602 |
$27,785 |
$21,281 |
01/24 |
$22,481 |
$28,093 |
$20,900 |
02/24 |
$23,349 |
$29,613 |
$21,898 |
03/24 |
$24,702 |
$30,569 |
$23,031 |
04/24 |
$23,831 |
$29,224 |
$21,826 |
05/24 |
$24,528 |
$30,604 |
$22,610 |
06/24 |
$24,120 |
$31,552 |
$22,248 |
07/24 |
$25,675 |
$32,138 |
$23,592 |
08/24 |
$26,028 |
$32,838 |
$24,037 |
09/24 |
$26,416 |
$33,517 |
$24,490 |
10/24 |
$25,902 |
$33,271 |
$24,182 |
11/24 |
$27,444 |
$35,484 |
$25,962 |
12/24 |
$25,577 |
$34,400 |
$24,062 |
01/25 |
$26,265 |
$35,486 |
$24,908 |
02/25 |
$25,819 |
$34,806 |
$24,454 |
03/25 |
$24,922 |
$32,775 |
$23,554 |
04/25 |
$24,177 |
$32,556 |
$22,970 |
05/25 |
$25,387 |
$34,619 |
$23,972 |
06/25 |
$26,349 |
$36,378 |
$24,814 |
07/25 |
$26,920 |
$37,179 |
$25,259 |
08/25 |
$28,082 |
$38,039 |
$26,017 |
09/25 |
$28,407 |
$39,352 |
$26,347 |
10/25 |
$28,311 |
$40,196 |
$26,083 |
11/25 |
$29,074 |
$40,306 |
$26,705 |
12/25 |
$29,116 |
$40,298 |
$26,721 |
01/26 |
$30,488 |
$40,923 |
$27,866 |
02/26 |
$33,054 |
$40,728 |
$29,181 |
|
| Average Annual Return [Table Text Block] |
|
Table Summary
Average Annual Total Returns (%) |
1 year |
5 years |
10 years |
Institutional Class |
28.02 |
12.44 |
12.70 |
Russell 3000® Index |
17.02 |
12.80 |
15.08 |
Russell Midcap® Value Index |
19.33 |
10.17 |
11.30 | |
| No Deduction of Taxes [Text Block] |
|
Performance does not reflect the deduction of taxes that a shareholder may pay on fund distributions or on the redemptions of fund shares.
|
| Updated Performance Information Location [Text Block] |
|
columbiathreadneedleus.com/investment-products/mutual-funds
|
| AssetsNet |
|
$ 2,904,196,404
|
| Holdings Count | Holding |
|
49
|
| Advisory Fees Paid, Amount |
|
$ 18,121,891
|
| InvestmentCompanyPortfolioTurnover |
|
15.00%
|
| Additional Fund Statistics [Text Block] |
|
Table Summary
Fund net assets |
$2,904,196,404 |
Total number of portfolio holdings |
49 |
Management services fees (represents 0.73% of Fund average net assets) |
$18,121,891 |
Portfolio turnover for the reporting period |
15% | |
| Holdings [Text Block] |
|
Table Summary
Industrials |
17.6% |
Financials |
15.7% |
Information Technology |
10.7% |
Consumer Discretionary |
9.5% |
Real Estate |
8.3% |
Utilities |
8.1% |
Health Care |
7.6% |
Consumer Staples |
5.6% |
Materials |
5.6% |
Energy |
5.5% |
Other |
4.3% |
Table Summary
Common Stocks |
98.5% |
Money Market Funds |
1.8% | |
| Largest Holdings [Text Block] |
|
Table Summary
Corning, Inc. |
3.5% |
Entergy Corp. |
3.3% |
AMETEK, Inc. |
2.9% |
ITT, Inc. |
2.9% |
Ameren Corp. |
2.9% |
Marathon Petroleum Corp. |
2.9% |
Southwest Airlines Co. |
2.7% |
Welltower, Inc. |
2.7% |
Devon Energy Corp. |
2.6% |
Quest Diagnostics, Inc. |
2.5% | |
| Material Fund Change [Text Block] |
|
|
| C000030056 |
|
|
| Shareholder Report [Line Items] |
|
|
| Fund Name |
|
Columbia Small Cap Index Fund
|
| Class Name |
|
Class A
|
| Trading Symbol |
|
NMSAX
|
| Annual or Semi-Annual Statement [Text Block] |
|
This annual shareholder report contains important information about Columbia Small Cap Index Fund (the Fund) for the period of March 1, 2025 to February 28, 2026.
|
| Additional Information [Text Block] |
|
You can find additional information about the Fund at columbiathreadneedleus.com/resources/literature. You can also request more information by contacting us at 1-800-345-6611.
|
| Additional Information Phone Number |
|
1-800-345-6611
|
| Additional Information Website |
|
columbiathreadneedleus.com/resources/literature
|
| Expenses [Text Block] |
|
What were the Fund costs for the reporting period? (Based on a hypothetical $10,000 investment)
Table Summary
Class |
Cost of a $10,000 investment |
Cost paid as a percentage of a $10,000 investment |
Class A |
$49 |
0.45% | |
| Expenses Paid, Amount |
|
$ 49
|
| Expense Ratio, Percent |
|
0.45%
|
| Factors Affecting Performance [Text Block] |
|
Management's Discussion of Fund Performance The performance of Class A shares for the period presented is shown in the Average Annual Total Returns table. Top Performance ContributorsSectors | The industrials, information technology and materials sectors were the top performing sectors for the Fund, on an absolute basis, during the period. Individual holdings | Fund positions in Sandisk, a data storage and semiconductor hardware company; Kratos Defense & Security Solutions, a defense technology and aerospace company; Sterling Infrastructure, an engineering & construction infrastructure services company; TTM Technologies, an electronic components and advanced manufacturing company; and Mr. Cooper Group, a mortgage finance and servicing company, were among the top absolute contributors to Fund performance during the period. Top Performance DetractorsSectors | The health care, communication services and consumer staples sectors were the weakest performing sectors for the Fund, on an absolute basis, during the period. Individual holdings | Fund positions in Inspire Medical Systems, a medical device company; Robert Half, a professional staffing and consulting services company; V.F. Corporation, a branded apparel and footwear company; FMC Corporation, an agricultural chemicals and crop science company; and Alaska Air, an airline holding company, were among the top absolute detractors from Fund performance during the period. |
| Performance Past Does Not Indicate Future [Text] |
|
The Fund's past performance is not a good predictor of the Fund's future performance.
|
| Line Graph [Table Text Block] |
|
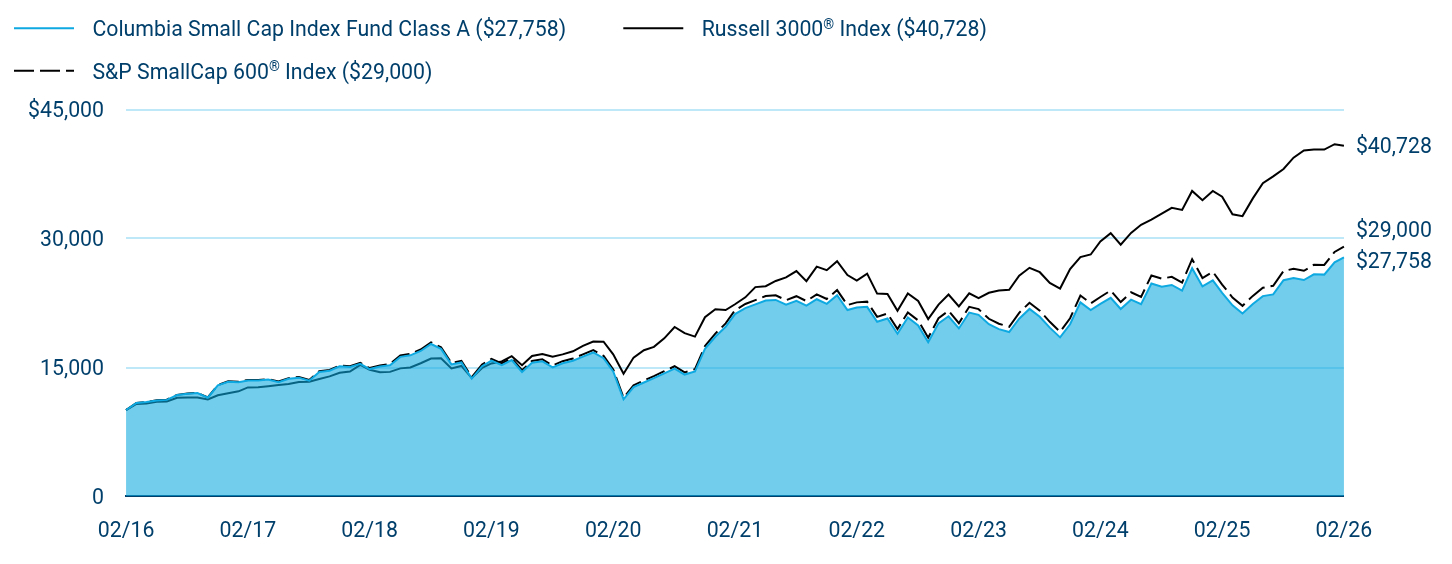
Table Summary
|
Columbia Small Cap Index Fund Class A ($27,758) |
Russell 3000® Index ($40,728) |
S&P SmallCap 600® Index ($29,000) |
02/16 |
$10,000 |
$10,000 |
$10,000 |
03/16 |
$10,819 |
$10,704 |
$10,820 |
04/16 |
$10,940 |
$10,770 |
$10,947 |
05/16 |
$11,118 |
$10,963 |
$11,128 |
06/16 |
$11,181 |
$10,986 |
$11,196 |
07/16 |
$11,747 |
$11,422 |
$11,766 |
08/16 |
$11,902 |
$11,451 |
$11,925 |
09/16 |
$11,977 |
$11,469 |
$12,002 |
10/16 |
$11,438 |
$11,221 |
$11,465 |
11/16 |
$12,863 |
$11,723 |
$12,904 |
12/16 |
$13,293 |
$11,952 |
$13,338 |
01/17 |
$13,231 |
$12,176 |
$13,285 |
02/17 |
$13,440 |
$12,629 |
$13,497 |
03/17 |
$13,423 |
$12,638 |
$13,480 |
04/17 |
$13,541 |
$12,772 |
$13,602 |
05/17 |
$13,248 |
$12,903 |
$13,313 |
06/17 |
$13,641 |
$13,019 |
$13,711 |
07/17 |
$13,767 |
$13,264 |
$13,844 |
08/17 |
$13,412 |
$13,290 |
$13,489 |
09/17 |
$14,437 |
$13,614 |
$14,529 |
10/17 |
$14,568 |
$13,911 |
$14,666 |
11/17 |
$15,078 |
$14,334 |
$15,183 |
12/17 |
$14,996 |
$14,477 |
$15,104 |
01/18 |
$15,366 |
$15,240 |
$15,486 |
02/18 |
$14,765 |
$14,678 |
$14,886 |
03/18 |
$15,062 |
$14,384 |
$15,189 |
04/18 |
$15,208 |
$14,438 |
$15,346 |
05/18 |
$16,185 |
$14,846 |
$16,337 |
06/18 |
$16,359 |
$14,943 |
$16,522 |
07/18 |
$16,871 |
$15,439 |
$17,043 |
08/18 |
$17,678 |
$15,981 |
$17,867 |
09/18 |
$17,111 |
$16,008 |
$17,300 |
10/18 |
$15,311 |
$14,829 |
$15,487 |
11/18 |
$15,539 |
$15,126 |
$15,720 |
12/18 |
$13,653 |
$13,718 |
$13,823 |
01/19 |
$15,098 |
$14,896 |
$15,293 |
02/19 |
$15,754 |
$15,419 |
$15,959 |
03/19 |
$15,232 |
$15,645 |
$15,427 |
04/19 |
$15,814 |
$16,269 |
$16,025 |
05/19 |
$14,429 |
$15,216 |
$14,626 |
06/19 |
$15,494 |
$16,285 |
$15,715 |
07/19 |
$15,665 |
$16,527 |
$15,894 |
08/19 |
$14,953 |
$16,190 |
$15,177 |
09/19 |
$15,446 |
$16,475 |
$15,684 |
10/19 |
$15,741 |
$16,829 |
$15,989 |
11/19 |
$16,220 |
$17,469 |
$16,479 |
12/19 |
$16,697 |
$17,973 |
$16,972 |
01/20 |
$16,027 |
$17,954 |
$16,298 |
02/20 |
$14,481 |
$16,484 |
$14,732 |
03/20 |
$11,238 |
$14,217 |
$11,433 |
04/20 |
$12,664 |
$16,100 |
$12,885 |
05/20 |
$13,205 |
$16,961 |
$13,440 |
06/20 |
$13,704 |
$17,349 |
$13,942 |
07/20 |
$14,261 |
$18,334 |
$14,515 |
08/20 |
$14,825 |
$19,662 |
$15,094 |
09/20 |
$14,124 |
$18,946 |
$14,384 |
10/20 |
$14,478 |
$18,537 |
$14,755 |
11/20 |
$17,109 |
$20,792 |
$17,436 |
12/20 |
$18,520 |
$21,728 |
$18,887 |
01/21 |
$19,684 |
$21,631 |
$20,075 |
02/21 |
$21,164 |
$22,307 |
$21,611 |
03/21 |
$21,848 |
$23,107 |
$22,332 |
04/21 |
$22,290 |
$24,298 |
$22,787 |
05/21 |
$22,740 |
$24,409 |
$23,260 |
06/21 |
$22,811 |
$25,010 |
$23,338 |
07/21 |
$22,255 |
$25,433 |
$22,781 |
08/21 |
$22,698 |
$26,159 |
$23,240 |
09/21 |
$22,134 |
$24,985 |
$22,675 |
10/21 |
$22,886 |
$26,675 |
$23,452 |
11/21 |
$22,352 |
$26,269 |
$22,915 |
12/21 |
$23,349 |
$27,303 |
$23,953 |
01/22 |
$21,636 |
$25,697 |
$22,213 |
02/22 |
$21,930 |
$25,049 |
$22,523 |
03/22 |
$22,002 |
$25,862 |
$22,606 |
04/22 |
$20,273 |
$23,541 |
$20,841 |
05/22 |
$20,647 |
$23,509 |
$21,229 |
06/22 |
$18,873 |
$21,543 |
$19,415 |
07/22 |
$20,758 |
$23,564 |
$21,360 |
08/22 |
$19,845 |
$22,684 |
$20,423 |
09/22 |
$17,878 |
$20,581 |
$18,405 |
10/22 |
$20,083 |
$22,269 |
$20,681 |
11/22 |
$20,907 |
$23,431 |
$21,543 |
12/22 |
$19,492 |
$22,059 |
$20,097 |
01/23 |
$21,342 |
$23,578 |
$22,005 |
02/23 |
$21,069 |
$23,027 |
$21,734 |
03/23 |
$19,976 |
$23,643 |
$20,613 |
04/23 |
$19,412 |
$23,895 |
$20,040 |
05/23 |
$19,069 |
$23,988 |
$19,689 |
06/23 |
$20,628 |
$25,626 |
$21,309 |
07/23 |
$21,760 |
$26,544 |
$22,483 |
08/23 |
$20,844 |
$26,032 |
$21,553 |
09/23 |
$19,585 |
$24,792 |
$20,260 |
10/23 |
$18,453 |
$24,135 |
$19,098 |
11/23 |
$19,972 |
$26,385 |
$20,677 |
12/23 |
$22,523 |
$27,785 |
$23,323 |
01/24 |
$21,628 |
$28,093 |
$22,402 |
02/24 |
$22,337 |
$29,613 |
$23,147 |
03/24 |
$23,054 |
$30,569 |
$23,897 |
04/24 |
$21,749 |
$29,224 |
$22,556 |
05/24 |
$22,840 |
$30,604 |
$23,693 |
06/24 |
$22,317 |
$31,552 |
$23,154 |
07/24 |
$24,712 |
$32,138 |
$25,654 |
08/24 |
$24,353 |
$32,838 |
$25,284 |
09/24 |
$24,547 |
$33,517 |
$25,499 |
10/24 |
$23,888 |
$33,271 |
$24,827 |
11/24 |
$26,495 |
$35,484 |
$27,542 |
12/24 |
$24,377 |
$34,400 |
$25,351 |
01/25 |
$25,076 |
$35,486 |
$26,089 |
02/25 |
$23,635 |
$34,806 |
$24,599 |
03/25 |
$22,173 |
$32,775 |
$23,088 |
04/25 |
$21,237 |
$32,556 |
$22,121 |
05/25 |
$22,345 |
$34,619 |
$23,278 |
06/25 |
$23,249 |
$36,378 |
$24,219 |
07/25 |
$23,450 |
$37,179 |
$24,444 |
08/25 |
$25,098 |
$38,039 |
$26,171 |
09/25 |
$25,345 |
$39,352 |
$26,427 |
10/25 |
$25,121 |
$40,196 |
$26,195 |
11/25 |
$25,782 |
$40,306 |
$26,890 |
12/25 |
$25,751 |
$40,298 |
$26,876 |
01/26 |
$27,190 |
$40,923 |
$28,383 |
02/26 |
$27,758 |
$40,728 |
$29,000 |
|
| Average Annual Return [Table Text Block] |
|
Table Summary
Average Annual Total Returns (%) |
1 year |
5 years |
10 years |
Class A |
17.44 |
5.57 |
10.75 |
Russell 3000® Index |
17.02 |
12.80 |
15.08 |
S&P SmallCap 600® Index |
17.89 |
6.06 |
11.23 | |
| No Deduction of Taxes [Text Block] |
|
Performance does not reflect the deduction of taxes that a shareholder may pay on fund distributions or on the redemptions of fund shares.
|
| Updated Performance Information Location [Text Block] |
|
columbiathreadneedleus.com/investment-products/mutual-funds
|
| AssetsNet |
|
$ 2,547,107,539
|
| Holdings Count | Holding |
|
608
|
| Advisory Fees Paid, Amount |
|
$ 5,098,990
|
| InvestmentCompanyPortfolioTurnover |
|
22.00%
|
| Additional Fund Statistics [Text Block] |
|
Table Summary
Fund net assets |
$2,547,107,539 |
Total number of portfolio holdings |
608 |
Management services fees (represents 0.20% of Fund average net assets) |
$5,098,990 |
Portfolio turnover for the reporting period |
22% | |
| Holdings [Text Block] |
|
Table Summary
Industrials |
17.6% |
Financials |
17.3% |
Consumer Discretionary |
13.8% |
Information Technology |
13.1% |
Health Care |
10.7% |
Real Estate |
7.0% |
Materials |
5.8% |
Energy |
5.5% |
Communication Services |
3.0% |
Consumer Staples |
2.5% |
Other |
2.2% |
Table Summary
Common Stocks |
98.5% |
Other |
1.6% | |
| Largest Holdings [Text Block] |
|
Table Summary
Solstice Advanced Materials, Inc. |
0.8% |
iShares Core S&P Small-Cap ETF |
0.7% |
Moog, Inc., Class A |
0.6% |
InterDigital, Inc. |
0.6% |
CareTrust REIT, Inc. |
0.6% |
SiTime Corp. |
0.5% |
Eastman Chemical Co. |
0.5% |
LKQ Corp. |
0.5% |
Sanmina Corp. |
0.5% |
Primoris Services Corp. |
0.5% | |
| Material Fund Change [Text Block] |
|
|
| C000122595 |
|
|
| Shareholder Report [Line Items] |
|
|
| Fund Name |
|
Columbia Small Cap Index Fund
|
| Class Name |
|
Institutional 2 Class
|
| Trading Symbol |
|
CXXRX
|
| Annual or Semi-Annual Statement [Text Block] |
|
This annual shareholder report contains important information about Columbia Small Cap Index Fund (the Fund) for the period of March 1, 2025 to February 28, 2026.
|
| Additional Information [Text Block] |
|
You can find additional information about the Fund at columbiathreadneedleus.com/resources/literature. You can also request more information by contacting us at 1-800-345-6611.
|
| Additional Information Phone Number |
|
1-800-345-6611
|
| Additional Information Website |
|
columbiathreadneedleus.com/resources/literature
|
| Expenses [Text Block] |
|
What were the Fund costs for the reporting period? (Based on a hypothetical $10,000 investment)
Table Summary
Class |
Cost of a $10,000 investment |
Cost paid as a percentage of a $10,000 investment |
Institutional 2 Class |
$22 |
0.20% | |
| Expenses Paid, Amount |
|
$ 22
|
| Expense Ratio, Percent |
|
0.20%
|
| Factors Affecting Performance [Text Block] |
|
Management's Discussion of Fund Performance The performance of Institutional 2 Class shares for the period presented is shown in the Average Annual Total Returns table. Top Performance ContributorsSectors | The industrials, information technology and materials sectors were the top performing sectors for the Fund, on an absolute basis, during the period. Individual holdings | Fund positions in Sandisk, a data storage and semiconductor hardware company; Kratos Defense & Security Solutions, a defense technology and aerospace company; Sterling Infrastructure, an engineering & construction infrastructure services company; TTM Technologies, an electronic components and advanced manufacturing company; and Mr. Cooper Group, a mortgage finance and servicing company, were among the top absolute contributors to Fund performance during the period. Top Performance DetractorsSectors | The health care, communication services and consumer staples sectors were the weakest performing sectors for the Fund, on an absolute basis, during the period. Individual holdings | Fund positions in Inspire Medical Systems, a medical device company; Robert Half, a professional staffing and consulting services company; V.F. Corporation, a branded apparel and footwear company; FMC Corporation, an agricultural chemicals and crop science company; and Alaska Air, an airline holding company, were among the top absolute detractors from Fund performance during the period. |
| Performance Past Does Not Indicate Future [Text] |
|
The Fund's past performance is not a good predictor of the Fund's future performance.
|
| Line Graph [Table Text Block] |
|

Table Summary
|
Columbia Small Cap Index Fund Institutional 2 Class ($28,460) |
Russell 3000® Index ($40,728) |
S&P SmallCap 600® Index ($29,000) |
02/16 |
$10,000 |
$10,000 |
$10,000 |
03/16 |
$10,816 |
$10,704 |
$10,820 |
04/16 |
$10,944 |
$10,770 |
$10,947 |
05/16 |
$11,124 |
$10,963 |
$11,128 |
06/16 |
$11,189 |
$10,986 |
$11,196 |
07/16 |
$11,758 |
$11,422 |
$11,766 |
08/16 |
$11,920 |
$11,451 |
$11,925 |
09/16 |
$11,993 |
$11,469 |
$12,002 |
10/16 |
$11,455 |
$11,221 |
$11,465 |
11/16 |
$12,885 |
$11,723 |
$12,904 |
12/16 |
$13,319 |
$11,952 |
$13,338 |
01/17 |
$13,263 |
$12,176 |
$13,285 |
02/17 |
$13,473 |
$12,629 |
$13,497 |
03/17 |
$13,462 |
$12,638 |
$13,480 |
04/17 |
$13,583 |
$12,772 |
$13,602 |
05/17 |
$13,291 |
$12,903 |
$13,313 |
06/17 |
$13,686 |
$13,019 |
$13,711 |
07/17 |
$13,815 |
$13,264 |
$13,844 |
08/17 |
$13,463 |
$13,290 |
$13,489 |
09/17 |
$14,498 |
$13,614 |
$14,529 |
10/17 |
$14,632 |
$13,911 |
$14,666 |
11/17 |
$15,142 |
$14,334 |
$15,183 |
12/17 |
$15,062 |
$14,477 |
$15,104 |
01/18 |
$15,442 |
$15,240 |
$15,486 |
02/18 |
$14,837 |
$14,678 |
$14,886 |
03/18 |
$15,139 |
$14,384 |
$15,189 |
04/18 |
$15,294 |
$14,438 |
$15,346 |
05/18 |
$16,273 |
$14,846 |
$16,337 |
06/18 |
$16,456 |
$14,943 |
$16,522 |
07/18 |
$16,968 |
$15,439 |
$17,043 |
08/18 |
$17,788 |
$15,981 |
$17,867 |
09/18 |
$17,222 |
$16,008 |
$17,300 |
10/18 |
$15,413 |
$14,829 |
$15,487 |
11/18 |
$15,642 |
$15,126 |
$15,720 |
12/18 |
$13,749 |
$13,718 |
$13,823 |
01/19 |
$15,209 |
$14,896 |
$15,293 |
02/19 |
$15,876 |
$15,419 |
$15,959 |
03/19 |
$15,346 |
$15,645 |
$15,427 |
04/19 |
$15,935 |
$16,269 |
$16,025 |
05/19 |
$14,547 |
$15,216 |
$14,626 |
06/19 |
$15,628 |
$16,285 |
$15,715 |
07/19 |
$15,803 |
$16,527 |
$15,894 |
08/19 |
$15,086 |
$16,190 |
$15,177 |
09/19 |
$15,582 |
$16,475 |
$15,684 |
10/19 |
$15,883 |
$16,829 |
$15,989 |
11/19 |
$16,372 |
$17,469 |
$16,479 |
12/19 |
$16,858 |
$17,973 |
$16,972 |
01/20 |
$16,188 |
$17,954 |
$16,298 |
02/20 |
$14,627 |
$16,484 |
$14,732 |
03/20 |
$11,357 |
$14,217 |
$11,433 |
04/20 |
$12,793 |
$16,100 |
$12,885 |
05/20 |
$13,344 |
$16,961 |
$13,440 |
06/20 |
$13,853 |
$17,349 |
$13,942 |
07/20 |
$14,418 |
$18,334 |
$14,515 |
08/20 |
$14,991 |
$19,662 |
$15,094 |
09/20 |
$14,284 |
$18,946 |
$14,384 |
10/20 |
$14,652 |
$18,537 |
$14,755 |
11/20 |
$17,311 |
$20,792 |
$17,436 |
12/20 |
$18,749 |
$21,728 |
$18,887 |
01/21 |
$19,925 |
$21,631 |
$20,075 |
02/21 |
$21,424 |
$22,307 |
$21,611 |
03/21 |
$22,131 |
$23,107 |
$22,332 |
04/21 |
$22,578 |
$24,298 |
$22,787 |
05/21 |
$23,040 |
$24,409 |
$23,260 |
06/21 |
$23,117 |
$25,010 |
$23,338 |
07/21 |
$22,558 |
$25,433 |
$22,781 |
08/21 |
$23,014 |
$26,159 |
$23,240 |
09/21 |
$22,448 |
$24,985 |
$22,675 |
10/21 |
$23,213 |
$26,675 |
$23,452 |
11/21 |
$22,676 |
$26,269 |
$22,915 |
12/21 |
$23,692 |
$27,303 |
$23,953 |
01/22 |
$21,961 |
$25,697 |
$22,213 |
02/22 |
$22,265 |
$25,049 |
$22,523 |
03/22 |
$22,343 |
$25,862 |
$22,606 |
04/22 |
$20,588 |
$23,541 |
$20,841 |
05/22 |
$20,970 |
$23,509 |
$21,229 |
06/22 |
$19,172 |
$21,543 |
$19,415 |
07/22 |
$21,095 |
$23,564 |
$21,360 |
08/22 |
$20,170 |
$22,684 |
$20,423 |
09/22 |
$18,174 |
$20,581 |
$18,405 |
10/22 |
$20,419 |
$22,269 |
$20,681 |
11/22 |
$21,256 |
$23,431 |
$21,543 |
12/22 |
$19,834 |
$22,059 |
$20,097 |
01/23 |
$21,711 |
$23,578 |
$22,005 |
02/23 |
$21,435 |
$23,027 |
$21,734 |
03/23 |
$20,325 |
$23,643 |
$20,613 |
04/23 |
$19,765 |
$23,895 |
$20,040 |
05/23 |
$19,421 |
$23,988 |
$19,689 |
06/23 |
$21,004 |
$25,626 |
$21,309 |
07/23 |
$22,163 |
$26,544 |
$22,483 |
08/23 |
$21,241 |
$26,032 |
$21,553 |
09/23 |
$19,960 |
$24,792 |
$20,260 |
10/23 |
$18,810 |
$24,135 |
$19,098 |
11/23 |
$20,364 |
$26,385 |
$20,677 |
12/23 |
$22,970 |
$27,785 |
$23,323 |
01/24 |
$22,060 |
$28,093 |
$22,402 |
02/24 |
$22,788 |
$29,613 |
$23,147 |
03/24 |
$23,525 |
$30,569 |
$23,897 |
04/24 |
$22,196 |
$29,224 |
$22,556 |
05/24 |
$23,316 |
$30,604 |
$23,693 |
06/24 |
$22,778 |
$31,552 |
$23,154 |
07/24 |
$25,237 |
$32,138 |
$25,654 |
08/24 |
$24,869 |
$32,838 |
$25,284 |
09/24 |
$25,077 |
$33,517 |
$25,499 |
10/24 |
$24,415 |
$33,271 |
$24,827 |
11/24 |
$27,082 |
$35,484 |
$27,542 |
12/24 |
$24,919 |
$34,400 |
$25,351 |
01/25 |
$25,641 |
$35,486 |
$26,089 |
02/25 |
$24,166 |
$34,806 |
$24,599 |
03/25 |
$22,680 |
$32,775 |
$23,088 |
04/25 |
$21,728 |
$32,556 |
$22,121 |
05/25 |
$22,869 |
$34,619 |
$23,278 |
06/25 |
$23,790 |
$36,378 |
$24,219 |
07/25 |
$24,008 |
$37,179 |
$24,444 |
08/25 |
$25,705 |
$38,039 |
$26,171 |
09/25 |
$25,956 |
$39,352 |
$26,427 |
10/25 |
$25,738 |
$40,196 |
$26,195 |
11/25 |
$26,413 |
$40,306 |
$26,890 |
12/25 |
$26,387 |
$40,298 |
$26,876 |
01/26 |
$27,863 |
$40,923 |
$28,383 |
02/26 |
$28,460 |
$40,728 |
$29,000 |
|
| Average Annual Return [Table Text Block] |
|
Table Summary
Average Annual Total Returns (%) |
1 year |
5 years |
10 years |
Institutional 2 Class |
17.77 |
5.84 |
11.03 |
Russell 3000® Index |
17.02 |
12.80 |
15.08 |
S&P SmallCap 600® Index |
17.89 |
6.06 |
11.23 | |
| No Deduction of Taxes [Text Block] |
|
Performance does not reflect the deduction of taxes that a shareholder may pay on fund distributions or on the redemptions of fund shares.
|
| Updated Performance Information Location [Text Block] |
|
columbiathreadneedleus.com/investment-products/mutual-funds
|
| AssetsNet |
|
$ 2,547,107,539
|
| Holdings Count | Holding |
|
608
|
| Advisory Fees Paid, Amount |
|
$ 5,098,990
|
| InvestmentCompanyPortfolioTurnover |
|
22.00%
|
| Additional Fund Statistics [Text Block] |
|
Table Summary
Fund net assets |
$2,547,107,539 |
Total number of portfolio holdings |
608 |
Management services fees (represents 0.20% of Fund average net assets) |
$5,098,990 |
Portfolio turnover for the reporting period |
22% | |
| Holdings [Text Block] |
|
Table Summary
Industrials |
17.6% |
Financials |
17.3% |
Consumer Discretionary |
13.8% |
Information Technology |
13.1% |
Health Care |
10.7% |
Real Estate |
7.0% |
Materials |
5.8% |
Energy |
5.5% |
Communication Services |
3.0% |
Consumer Staples |
2.5% |
Other |
2.2% |
Table Summary
Common Stocks |
98.5% |
Other |
1.6% | |
| Largest Holdings [Text Block] |
|
Table Summary
Solstice Advanced Materials, Inc. |
0.8% |
iShares Core S&P Small-Cap ETF |
0.7% |
Moog, Inc., Class A |
0.6% |
InterDigital, Inc. |
0.6% |
CareTrust REIT, Inc. |
0.6% |
SiTime Corp. |
0.5% |
Eastman Chemical Co. |
0.5% |
LKQ Corp. |
0.5% |
Sanmina Corp. |
0.5% |
Primoris Services Corp. |
0.5% | |
| Material Fund Change [Text Block] |
|
|
| C000173201 |
|
|
| Shareholder Report [Line Items] |
|
|
| Fund Name |
|
Columbia Small Cap Index Fund
|
| Class Name |
|
Institutional 3 Class
|
| Trading Symbol |
|
CSPYX
|
| Annual or Semi-Annual Statement [Text Block] |
|
This annual shareholder report contains important information about Columbia Small Cap Index Fund (the Fund) for the period of March 1, 2025 to February 28, 2026.
|
| Additional Information [Text Block] |
|
You can find additional information about the Fund at columbiathreadneedleus.com/resources/literature. You can also request more information by contacting us at 1-800-345-6611.
|
| Additional Information Phone Number |
|
1-800-345-6611
|
| Additional Information Website |
|
columbiathreadneedleus.com/resources/literature
|
| Expenses [Text Block] |
|
What were the Fund costs for the reporting period? (Based on a hypothetical $10,000 investment)
Table Summary
Class |
Cost of a $10,000 investment |
Cost paid as a percentage of a $10,000 investment |
Institutional 3 Class |
$22 |
0.20% | |
| Expenses Paid, Amount |
|
$ 22
|
| Expense Ratio, Percent |
|
0.20%
|
| Factors Affecting Performance [Text Block] |
|
Management's Discussion of Fund Performance The performance of Institutional 3 Class shares for the period presented is shown in the Average Annual Total Returns table. Top Performance ContributorsSectors | The industrials, information technology and materials sectors were the top performing sectors for the Fund, on an absolute basis, during the period. Individual holdings | Fund positions in Sandisk, a data storage and semiconductor hardware company; Kratos Defense & Security Solutions, a defense technology and aerospace company; Sterling Infrastructure, an engineering & construction infrastructure services company; TTM Technologies, an electronic components and advanced manufacturing company; and Mr. Cooper Group, a mortgage finance and servicing company, were among the top absolute contributors to Fund performance during the period. Top Performance DetractorsSectors | The health care, communication services and consumer staples sectors were the weakest performing sectors for the Fund, on an absolute basis, during the period. Individual holdings | Fund positions in Inspire Medical Systems, a medical device company; Robert Half, a professional staffing and consulting services company; V.F. Corporation, a branded apparel and footwear company; FMC Corporation, an agricultural chemicals and crop science company; and Alaska Air, an airline holding company, were among the top absolute detractors from Fund performance during the period. |
| Performance Past Does Not Indicate Future [Text] |
|
The Fund's past performance is not a good predictor of the Fund's future performance.
|
| Line Graph [Table Text Block] |
|

Table Summary
|
Columbia Small Cap Index Fund Institutional 3 Class ($28,409) |
Russell 3000® Index ($40,728) |
S&P SmallCap 600® Index ($29,000) |
02/16 |
$10,000 |
$10,000 |
$10,000 |
03/16 |
$10,819 |
$10,704 |
$10,820 |
04/16 |
$10,940 |
$10,770 |
$10,947 |
05/16 |
$11,118 |
$10,963 |
$11,128 |
06/16 |
$11,181 |
$10,986 |
$11,196 |
07/16 |
$11,747 |
$11,422 |
$11,766 |
08/16 |
$11,902 |
$11,451 |
$11,925 |
09/16 |
$11,977 |
$11,469 |
$12,002 |
10/16 |
$11,438 |
$11,221 |
$11,465 |
11/16 |
$12,863 |
$11,723 |
$12,904 |
12/16 |
$13,293 |
$11,952 |
$13,338 |
01/17 |
$13,231 |
$12,176 |
$13,285 |
02/17 |
$13,440 |
$12,629 |
$13,497 |
03/17 |
$13,430 |
$12,638 |
$13,480 |
04/17 |
$13,550 |
$12,772 |
$13,602 |
05/17 |
$13,263 |
$12,903 |
$13,313 |
06/17 |
$13,657 |
$13,019 |
$13,711 |
07/17 |
$13,785 |
$13,264 |
$13,844 |
08/17 |
$13,436 |
$13,290 |
$13,489 |
09/17 |
$14,467 |
$13,614 |
$14,529 |
10/17 |
$14,601 |
$13,911 |
$14,666 |
11/17 |
$15,114 |
$14,334 |
$15,183 |
12/17 |
$15,031 |
$14,477 |
$15,104 |
01/18 |
$15,409 |
$15,240 |
$15,486 |
02/18 |
$14,808 |
$14,678 |
$14,886 |
03/18 |
$15,106 |
$14,384 |
$15,189 |
04/18 |
$15,260 |
$14,438 |
$15,346 |
05/18 |
$16,239 |
$14,846 |
$16,337 |
06/18 |
$16,424 |
$14,943 |
$16,522 |
07/18 |
$16,934 |
$15,439 |
$17,043 |
08/18 |
$17,752 |
$15,981 |
$17,867 |
09/18 |
$17,186 |
$16,008 |
$17,300 |
10/18 |
$15,384 |
$14,829 |
$15,487 |
11/18 |
$15,611 |
$15,126 |
$15,720 |
12/18 |
$13,722 |
$13,718 |
$13,823 |
01/19 |
$15,178 |
$14,896 |
$15,293 |
02/19 |
$15,844 |
$15,419 |
$15,959 |
03/19 |
$15,315 |
$15,645 |
$15,427 |
04/19 |
$15,905 |
$16,269 |
$16,025 |
05/19 |
$14,519 |
$15,216 |
$14,626 |
06/19 |
$15,597 |
$16,285 |
$15,715 |
07/19 |
$15,766 |
$16,527 |
$15,894 |
08/19 |
$15,056 |
$16,190 |
$15,177 |
09/19 |
$15,555 |
$16,475 |
$15,684 |
10/19 |
$15,850 |
$16,829 |
$15,989 |
11/19 |
$16,336 |
$17,469 |
$16,479 |
12/19 |
$16,824 |
$17,973 |
$16,972 |
01/20 |
$16,157 |
$17,954 |
$16,298 |
02/20 |
$14,602 |
$16,484 |
$14,732 |
03/20 |
$11,331 |
$14,217 |
$11,433 |
04/20 |
$12,768 |
$16,100 |
$12,885 |
05/20 |
$13,318 |
$16,961 |
$13,440 |
06/20 |
$13,824 |
$17,349 |
$13,942 |
07/20 |
$14,390 |
$18,334 |
$14,515 |
08/20 |
$14,963 |
$19,662 |
$15,094 |
09/20 |
$14,256 |
$18,946 |
$14,384 |
10/20 |
$14,621 |
$18,537 |
$14,755 |
11/20 |
$17,279 |
$20,792 |
$17,436 |
12/20 |
$18,711 |
$21,728 |
$18,887 |
01/21 |
$19,882 |
$21,631 |
$20,075 |
02/21 |
$21,379 |
$22,307 |
$21,611 |
03/21 |
$22,086 |
$23,107 |
$22,332 |
04/21 |
$22,527 |
$24,298 |
$22,787 |
05/21 |
$22,990 |
$24,409 |
$23,260 |
06/21 |
$23,072 |
$25,010 |
$23,338 |
07/21 |
$22,513 |
$25,433 |
$22,781 |
08/21 |
$22,963 |
$26,159 |
$23,240 |
09/21 |
$22,396 |
$24,985 |
$22,675 |
10/21 |
$23,165 |
$26,675 |
$23,452 |
11/21 |
$22,629 |
$26,269 |
$22,915 |
12/21 |
$23,639 |
$27,303 |
$23,953 |
01/22 |
$21,914 |
$25,697 |
$22,213 |
02/22 |
$22,219 |
$25,049 |
$22,523 |
03/22 |
$22,293 |
$25,862 |
$22,606 |
04/22 |
$20,551 |
$23,541 |
$20,841 |
05/22 |
$20,923 |
$23,509 |
$21,229 |
06/22 |
$19,135 |
$21,543 |
$19,415 |
07/22 |
$21,046 |
$23,564 |
$21,360 |
08/22 |
$20,125 |
$22,684 |
$20,423 |
09/22 |
$18,136 |
$20,581 |
$18,405 |
10/22 |
$20,372 |
$22,269 |
$20,681 |
11/22 |
$21,217 |
$23,431 |
$21,543 |
12/22 |
$19,794 |
$22,059 |
$20,097 |
01/23 |
$21,665 |
$23,578 |
$22,005 |
02/23 |
$21,399 |
$23,027 |
$21,734 |
03/23 |
$20,289 |
$23,643 |
$20,613 |
04/23 |
$19,720 |
$23,895 |
$20,040 |
05/23 |
$19,381 |
$23,988 |
$19,689 |
06/23 |
$20,967 |
$25,626 |
$21,309 |
07/23 |
$22,119 |
$26,544 |
$22,483 |
08/23 |
$21,201 |
$26,032 |
$21,553 |
09/23 |
$19,918 |
$24,792 |
$20,260 |
10/23 |
$18,776 |
$24,135 |
$19,098 |
11/23 |
$20,321 |
$26,385 |
$20,677 |
12/23 |
$22,924 |
$27,785 |
$23,323 |
01/24 |
$22,009 |
$28,093 |
$22,402 |
02/24 |
$22,739 |
$29,613 |
$23,147 |
03/24 |
$23,479 |
$30,569 |
$23,897 |
04/24 |
$22,155 |
$29,224 |
$22,556 |
05/24 |
$23,265 |
$30,604 |
$23,693 |
06/24 |
$22,738 |
$31,552 |
$23,154 |
07/24 |
$25,194 |
$32,138 |
$25,654 |
08/24 |
$24,818 |
$32,838 |
$25,284 |
09/24 |
$25,031 |
$33,517 |
$25,499 |
10/24 |
$24,372 |
$33,271 |
$24,827 |
11/24 |
$27,030 |
$35,484 |
$27,542 |
12/24 |
$24,873 |
$34,400 |
$25,351 |
01/25 |
$25,586 |
$35,486 |
$26,089 |
02/25 |
$24,127 |
$34,806 |
$24,599 |
03/25 |
$22,634 |
$32,775 |
$23,088 |
04/25 |
$21,695 |
$32,556 |
$22,121 |
05/25 |
$22,826 |
$34,619 |
$23,278 |
06/25 |
$23,743 |
$36,378 |
$24,219 |
07/25 |
$23,968 |
$37,179 |
$24,444 |
08/25 |
$25,656 |
$38,039 |
$26,171 |
09/25 |
$25,904 |
$39,352 |
$26,427 |
10/25 |
$25,691 |
$40,196 |
$26,195 |
11/25 |
$26,364 |
$40,306 |
$26,890 |
12/25 |
$26,337 |
$40,298 |
$26,876 |
01/26 |
$27,820 |
$40,923 |
$28,383 |
02/26 |
$28,409 |
$40,728 |
$29,000 |
|
| Average Annual Return [Table Text Block] |
|
Table Summary
Average Annual Total Returns (%) |
1 year |
5 years |
10 years |
Institutional 3 ClassFootnote Reference(a) |
17.75 |
5.85 |
11.01 |
Russell 3000® Index |
17.02 |
12.80 |
15.08 |
S&P SmallCap 600® Index |
17.89 |
6.06 |
11.23 | |
| No Deduction of Taxes [Text Block] |
|
Performance does not reflect the deduction of taxes that a shareholder may pay on fund distributions or on the redemptions of fund shares.
|
| Updated Performance Information Location [Text Block] |
|
columbiathreadneedleus.com/investment-products/mutual-funds
|
| AssetsNet |
|
$ 2,547,107,539
|
| Holdings Count | Holding |
|
608
|
| Advisory Fees Paid, Amount |
|
$ 5,098,990
|
| InvestmentCompanyPortfolioTurnover |
|
22.00%
|
| Additional Fund Statistics [Text Block] |
|
Table Summary
Fund net assets |
$2,547,107,539 |
Total number of portfolio holdings |
608 |
Management services fees (represents 0.20% of Fund average net assets) |
$5,098,990 |
Portfolio turnover for the reporting period |
22% | |
| Holdings [Text Block] |
|
Table Summary
Industrials |
17.6% |
Financials |
17.3% |
Consumer Discretionary |
13.8% |
Information Technology |
13.1% |
Health Care |
10.7% |
Real Estate |
7.0% |
Materials |
5.8% |
Energy |
5.5% |
Communication Services |
3.0% |
Consumer Staples |
2.5% |
Other |
2.2% |
Table Summary
Common Stocks |
98.5% |
Other |
1.6% | |
| Largest Holdings [Text Block] |
|
Table Summary
Solstice Advanced Materials, Inc. |
0.8% |
iShares Core S&P Small-Cap ETF |
0.7% |
Moog, Inc., Class A |
0.6% |
InterDigital, Inc. |
0.6% |
CareTrust REIT, Inc. |
0.6% |
SiTime Corp. |
0.5% |
Eastman Chemical Co. |
0.5% |
LKQ Corp. |
0.5% |
Sanmina Corp. |
0.5% |
Primoris Services Corp. |
0.5% | |
| Material Fund Change [Text Block] |
|
|
| C000030057 |
|
|
| Shareholder Report [Line Items] |
|
|
| Fund Name |
|
Columbia Small Cap Index Fund
|
| Class Name |
|
Institutional Class
|
| Trading Symbol |
|
NMSCX
|
| Annual or Semi-Annual Statement [Text Block] |
|
This annual shareholder report contains important information about Columbia Small Cap Index Fund (the Fund) for the period of March 1, 2025 to February 28, 2026.
|
| Additional Information [Text Block] |
|
You can find additional information about the Fund at columbiathreadneedleus.com/resources/literature. You can also request more information by contacting us at 1-800-345-6611.
|
| Additional Information Phone Number |
|
1-800-345-6611
|
| Additional Information Website |
|
columbiathreadneedleus.com/resources/literature
|
| Expenses [Text Block] |
|
What were the Fund costs for the reporting period? (Based on a hypothetical $10,000 investment)
Table Summary
Class |
Cost of a $10,000 investment |
Cost paid as a percentage of a $10,000 investment |
Institutional Class |
$22 |
0.20% | |
| Expenses Paid, Amount |
|
$ 22
|
| Expense Ratio, Percent |
|
0.20%
|
| Factors Affecting Performance [Text Block] |
|
Management's Discussion of Fund Performance The performance of Institutional Class shares for the period presented is shown in the Average Annual Total Returns table. Top Performance ContributorsSectors | The industrials, information technology and materials sectors were the top performing sectors for the Fund, on an absolute basis, during the period. Individual holdings | Fund positions in Sandisk, a data storage and semiconductor hardware company; Kratos Defense & Security Solutions, a defense technology and aerospace company; Sterling Infrastructure, an engineering & construction infrastructure services company; TTM Technologies, an electronic components and advanced manufacturing company; and Mr. Cooper Group, a mortgage finance and servicing company, were among the top absolute contributors to Fund performance during the period. Top Performance DetractorsSectors | The health care, communication services and consumer staples sectors were the weakest performing sectors for the Fund, on an absolute basis, during the period. Individual holdings | Fund positions in Inspire Medical Systems, a medical device company; Robert Half, a professional staffing and consulting services company; V.F. Corporation, a branded apparel and footwear company; FMC Corporation, an agricultural chemicals and crop science company; and Alaska Air, an airline holding company, were among the top absolute detractors from Fund performance during the period. |
| Performance Past Does Not Indicate Future [Text] |
|
The Fund's past performance is not a good predictor of the Fund's future performance.
|
| Line Graph [Table Text Block] |
|
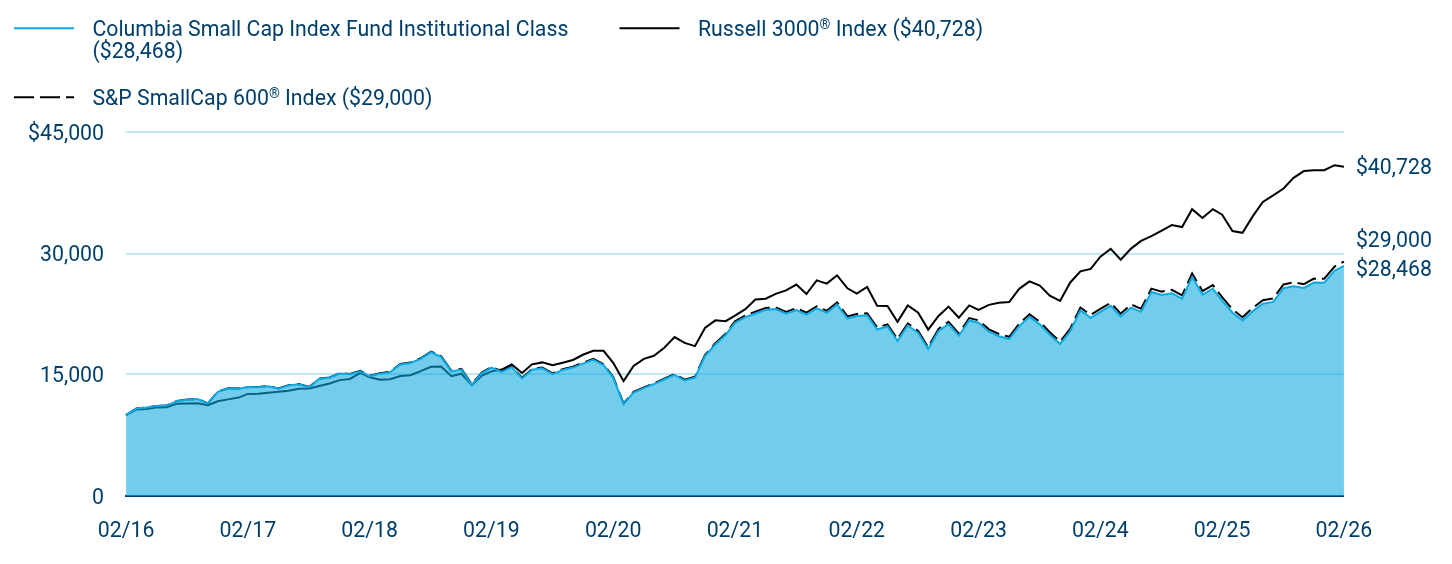
Table Summary
|
Columbia Small Cap Index Fund Institutional Class ($28,468) |
Russell 3000® Index ($40,728) |
S&P SmallCap 600® Index ($29,000) |
02/16 |
$10,000 |
$10,000 |
$10,000 |
03/16 |
$10,815 |
$10,704 |
$10,820 |
04/16 |
$10,946 |
$10,770 |
$10,947 |
05/16 |
$11,123 |
$10,963 |
$11,128 |
06/16 |
$11,190 |
$10,986 |
$11,196 |
07/16 |
$11,759 |
$11,422 |
$11,766 |
08/16 |
$11,918 |
$11,451 |
$11,925 |
09/16 |
$11,993 |
$11,469 |
$12,002 |
10/16 |
$11,456 |
$11,221 |
$11,465 |
11/16 |
$12,885 |
$11,723 |
$12,904 |
12/16 |
$13,316 |
$11,952 |
$13,338 |
01/17 |
$13,260 |
$12,176 |
$13,285 |
02/17 |
$13,474 |
$12,629 |
$13,497 |
03/17 |
$13,463 |
$12,638 |
$13,480 |
04/17 |
$13,581 |
$12,772 |
$13,602 |
05/17 |
$13,288 |
$12,903 |
$13,313 |
06/17 |
$13,686 |
$13,019 |
$13,711 |
07/17 |
$13,817 |
$13,264 |
$13,844 |
08/17 |
$13,458 |
$13,290 |
$13,489 |
09/17 |
$14,497 |
$13,614 |
$14,529 |
10/17 |
$14,628 |
$13,911 |
$14,666 |
11/17 |
$15,142 |
$14,334 |
$15,183 |
12/17 |
$15,061 |
$14,477 |
$15,104 |
01/18 |
$15,437 |
$15,240 |
$15,486 |
02/18 |
$14,836 |
$14,678 |
$14,886 |
03/18 |
$15,139 |
$14,384 |
$15,189 |
04/18 |
$15,291 |
$14,438 |
$15,346 |
05/18 |
$16,273 |
$14,846 |
$16,337 |
06/18 |
$16,453 |
$14,943 |
$16,522 |
07/18 |
$16,971 |
$15,439 |
$17,043 |
08/18 |
$17,784 |
$15,981 |
$17,867 |
09/18 |
$17,217 |
$16,008 |
$17,300 |
10/18 |
$15,412 |
$14,829 |
$15,487 |
11/18 |
$15,640 |
$15,126 |
$15,720 |
12/18 |
$13,749 |
$13,718 |
$13,823 |
01/19 |
$15,210 |
$14,896 |
$15,293 |
02/19 |
$15,873 |
$15,419 |
$15,959 |
03/19 |
$15,344 |
$15,645 |
$15,427 |
04/19 |
$15,934 |
$16,269 |
$16,025 |
05/19 |
$14,547 |
$15,216 |
$14,626 |
06/19 |
$15,626 |
$16,285 |
$15,715 |
07/19 |
$15,798 |
$16,527 |
$15,894 |
08/19 |
$15,084 |
$16,190 |
$15,177 |
09/19 |
$15,585 |
$16,475 |
$15,684 |
10/19 |
$15,887 |
$16,829 |
$15,989 |
11/19 |
$16,367 |
$17,469 |
$16,479 |
12/19 |
$16,857 |
$17,973 |
$16,972 |
01/20 |
$16,186 |
$17,954 |
$16,298 |
02/20 |
$14,628 |
$16,484 |
$14,732 |
03/20 |
$11,355 |
$14,217 |
$11,433 |
04/20 |
$12,791 |
$16,100 |
$12,885 |
05/20 |
$13,342 |
$16,961 |
$13,440 |
06/20 |
$13,849 |
$17,349 |
$13,942 |
07/20 |
$14,414 |
$18,334 |
$14,515 |
08/20 |
$14,987 |
$19,662 |
$15,094 |
09/20 |
$14,284 |
$18,946 |
$14,384 |
10/20 |
$14,646 |
$18,537 |
$14,755 |
11/20 |
$17,307 |
$20,792 |
$17,436 |
12/20 |
$18,746 |
$21,728 |
$18,887 |
01/21 |
$19,922 |
$21,631 |
$20,075 |
02/21 |
$21,424 |
$22,307 |
$21,611 |
03/21 |
$22,127 |
$23,107 |
$22,332 |
04/21 |
$22,578 |
$24,298 |
$22,787 |
05/21 |
$23,037 |
$24,409 |
$23,260 |
06/21 |
$23,116 |
$25,010 |
$23,338 |
07/21 |
$22,557 |
$25,433 |
$22,781 |
08/21 |
$23,011 |
$26,159 |
$23,240 |
09/21 |
$22,444 |
$24,985 |
$22,675 |
10/21 |
$23,214 |
$26,675 |
$23,452 |
11/21 |
$22,671 |
$26,269 |
$22,915 |
12/21 |
$23,691 |
$27,303 |
$23,953 |
01/22 |
$21,959 |
$25,697 |
$22,213 |
02/22 |
$22,264 |
$25,049 |
$22,523 |
03/22 |
$22,344 |
$25,862 |
$22,606 |
04/22 |
$20,589 |
$23,541 |
$20,841 |
05/22 |
$20,965 |
$23,509 |
$21,229 |
06/22 |
$19,173 |
$21,543 |
$19,415 |
07/22 |
$21,093 |
$23,564 |
$21,360 |
08/22 |
$20,166 |
$22,684 |
$20,423 |
09/22 |
$18,171 |
$20,581 |
$18,405 |
10/22 |
$20,414 |
$22,269 |
$20,681 |
11/22 |
$21,259 |
$23,431 |
$21,543 |
12/22 |
$19,828 |
$22,059 |
$20,097 |
01/23 |
$21,710 |
$23,578 |
$22,005 |
02/23 |
$21,435 |
$23,027 |
$21,734 |
03/23 |
$20,325 |
$23,643 |
$20,613 |
04/23 |
$19,766 |
$23,895 |
$20,040 |
05/23 |
$19,420 |
$23,988 |
$19,689 |
06/23 |
$21,008 |
$25,626 |
$21,309 |
07/23 |
$22,158 |
$26,544 |
$22,483 |
08/23 |
$21,235 |
$26,032 |
$21,553 |
09/23 |
$19,958 |
$24,792 |
$20,260 |
10/23 |
$18,808 |
$24,135 |
$19,098 |
11/23 |
$20,365 |
$26,385 |
$20,677 |
12/23 |
$22,964 |
$27,785 |
$23,323 |
01/24 |
$22,052 |
$28,093 |
$22,402 |
02/24 |
$22,785 |
$29,613 |
$23,147 |
03/24 |
$23,519 |
$30,569 |
$23,897 |
04/24 |
$22,193 |
$29,224 |
$22,556 |
05/24 |
$23,312 |
$30,604 |
$23,693 |
06/24 |
$22,785 |
$31,552 |
$23,154 |
07/24 |
$25,240 |
$32,138 |
$25,654 |
08/24 |
$24,868 |
$32,838 |
$25,284 |
09/24 |
$25,074 |
$33,517 |
$25,499 |
10/24 |
$24,418 |
$33,271 |
$24,827 |
11/24 |
$27,079 |
$35,484 |
$27,542 |
12/24 |
$24,921 |
$34,400 |
$25,351 |
01/25 |
$25,638 |
$35,486 |
$26,089 |
02/25 |
$24,172 |
$34,806 |
$24,599 |
03/25 |
$22,674 |
$32,775 |
$23,088 |
04/25 |
$21,729 |
$32,556 |
$22,121 |
05/25 |
$22,869 |
$34,619 |
$23,278 |
06/25 |
$23,793 |
$36,378 |
$24,219 |
07/25 |
$24,008 |
$37,179 |
$24,444 |
08/25 |
$25,705 |
$38,039 |
$26,171 |
09/25 |
$25,954 |
$39,352 |
$26,427 |
10/25 |
$25,739 |
$40,196 |
$26,195 |
11/25 |
$26,406 |
$40,306 |
$26,890 |
12/25 |
$26,392 |
$40,298 |
$26,876 |
01/26 |
$27,869 |
$40,923 |
$28,383 |
02/26 |
$28,468 |
$40,728 |
$29,000 |
|
| Average Annual Return [Table Text Block] |
|
Table Summary
Average Annual Total Returns (%) |
1 year |
5 years |
10 years |
Institutional Class |
17.77 |
5.85 |
11.03 |
Russell 3000® Index |
17.02 |
12.80 |
15.08 |
S&P SmallCap 600® Index |
17.89 |
6.06 |
11.23 | |
| No Deduction of Taxes [Text Block] |
|
Performance does not reflect the deduction of taxes that a shareholder may pay on fund distributions or on the redemptions of fund shares.
|
| Updated Performance Information Location [Text Block] |
|
columbiathreadneedleus.com/investment-products/mutual-funds
|
| AssetsNet |
|
$ 2,547,107,539
|
| Holdings Count | Holding |
|
608
|
| Advisory Fees Paid, Amount |
|
$ 5,098,990
|
| InvestmentCompanyPortfolioTurnover |
|
22.00%
|
| Additional Fund Statistics [Text Block] |
|
Table Summary
Fund net assets |
$2,547,107,539 |
Total number of portfolio holdings |
608 |
Management services fees (represents 0.20% of Fund average net assets) |
$5,098,990 |
Portfolio turnover for the reporting period |
22% | |
| Holdings [Text Block] |
|
Table Summary
Industrials |
17.6% |
Financials |
17.3% |
Consumer Discretionary |
13.8% |
Information Technology |
13.1% |
Health Care |
10.7% |
Real Estate |
7.0% |
Materials |
5.8% |
Energy |
5.5% |
Communication Services |
3.0% |
Consumer Staples |
2.5% |
Other |
2.2% |
Table Summary
Common Stocks |
98.5% |
Other |
1.6% | |
| Largest Holdings [Text Block] |
|
Table Summary
Solstice Advanced Materials, Inc. |
0.8% |
iShares Core S&P Small-Cap ETF |
0.7% |
Moog, Inc., Class A |
0.6% |
InterDigital, Inc. |
0.6% |
CareTrust REIT, Inc. |
0.6% |
SiTime Corp. |
0.5% |
Eastman Chemical Co. |
0.5% |
LKQ Corp. |
0.5% |
Sanmina Corp. |
0.5% |
Primoris Services Corp. |
0.5% | |
| Material Fund Change [Text Block] |
|
|
| C000029855 |
|
|
| Shareholder Report [Line Items] |
|
|
| Fund Name |
|
Columbia Small Cap Value and Inflection Fund
|
| Class Name |
|
Class A
|
| Trading Symbol |
|
COVAX
|
| Annual or Semi-Annual Statement [Text Block] |
|
This annual shareholder report contains important information about Columbia Small Cap Value and Inflection Fund (the Fund) for the period of March 1, 2025 to February 28, 2026.
|
| Additional Information [Text Block] |
|
You can find additional information about the Fund at columbiathreadneedleus.com/resources/literature. You can also request more information by contacting us at 1-800-345-6611.
|
| Material Fund Change Notice [Text Block] |
|
This report describes changes to the Fund that occurred during the reporting period.
|
| Additional Information Phone Number |
|
1-800-345-6611
|
| Additional Information Website |
|
columbiathreadneedleus.com/resources/literature
|
| Expenses [Text Block] |
|
What were the Fund costs for the reporting period? (Based on a hypothetical $10,000 investment)
Table Summary
Class |
Cost of a $10,000 investment |
Cost paid as a percentage of a $10,000 investment |
Class A |
$132 |
1.20% | |
| Expenses Paid, Amount |
|
$ 132
|
| Expense Ratio, Percent |
|
1.20%
|
| Factors Affecting Performance [Text Block] |
|
Management's Discussion of Fund Performance The performance of Class A shares for the period presented is shown in the Average Annual Total Returns table. Top Performance ContributorsStock selection | Selections in the financials, consumer staples and utilities sectors boosted the Fund’s relative performance during the annual period. Allocations | Smaller allocations to the financials and utilities sectors and a larger allocation to the information technology sector buoyed the Fund’s relative performance during the annual period. Individual holdings | Positions in MP Materials, a rare earths company; Modine Manufacturing, an HVAC company; Dycom Industries, a telecom infrastructure contractor; Amkor Technology, a semiconductor packaging and testing company; and an overweight to Victoria’s Secret, a specialty retailer, were top contributors to the Fund’s relative performance during the period. Top Performance DetractorsStock selection | Selections in the health care, materials and communication services sectors hurt the Fund’s relative performance during the annual period. Allocations | Smaller weightings in the communication services and energy sectors and a larger weighting in the consumer discretionary sector detracted from the Fund’s relative performance during the annual period. Individual holdings | Lack of ownership of EchoStar, a telecom company; Hecla Mining, a precious metals miner; and Coeur Mining, a precious metals miner, were top detractors from the Fund’s relative performance during the period. Positions in Alaska Air Group, an airline, and Cousins Properties, an office REIT, were also top detractors from the Fund’s relative performance during the period. |
| Performance Past Does Not Indicate Future [Text] |
|
The Fund's past performance is not a good predictor of the Fund's future performance.
|
| Line Graph [Table Text Block] |
|
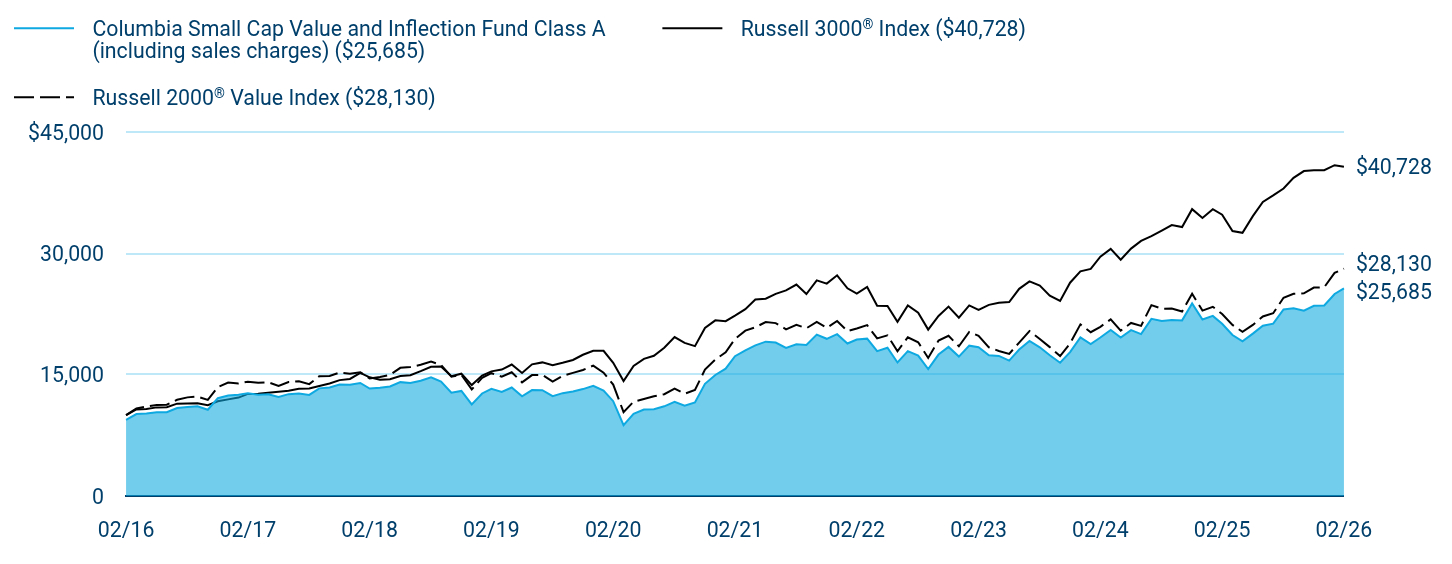
Table Summary
|
Columbia Small Cap Value and Inflection Fund Class A (including sales charges) ($25,685) |
Russell 3000® Index ($40,728) |
Russell 2000® Value Index ($28,130) |
02/16 |
$9,424 |
$10,000 |
$10,000 |
03/16 |
$10,141 |
$10,704 |
$10,829 |
04/16 |
$10,208 |
$10,770 |
$11,058 |
05/16 |
$10,362 |
$10,963 |
$11,261 |
06/16 |
$10,354 |
$10,986 |
$11,295 |
07/16 |
$10,875 |
$11,422 |
$11,905 |
08/16 |
$11,024 |
$11,451 |
$12,200 |
09/16 |
$11,099 |
$11,469 |
$12,297 |
10/16 |
$10,672 |
$11,221 |
$11,892 |
11/16 |
$12,100 |
$11,723 |
$13,471 |
12/16 |
$12,438 |
$11,952 |
$14,027 |
01/17 |
$12,516 |
$12,176 |
$13,927 |
02/17 |
$12,720 |
$12,629 |
$14,129 |
03/17 |
$12,516 |
$12,638 |
$14,009 |
04/17 |
$12,593 |
$12,772 |
$14,064 |
05/17 |
$12,261 |
$12,903 |
$13,626 |
06/17 |
$12,601 |
$13,019 |
$14,103 |
07/17 |
$12,683 |
$13,264 |
$14,192 |
08/17 |
$12,504 |
$13,290 |
$13,843 |
09/17 |
$13,316 |
$13,614 |
$14,823 |
10/17 |
$13,421 |
$13,911 |
$14,843 |
11/17 |
$13,778 |
$14,334 |
$15,272 |
12/17 |
$13,760 |
$14,477 |
$15,127 |
01/18 |
$13,977 |
$15,240 |
$15,313 |
02/18 |
$13,286 |
$14,678 |
$14,547 |
03/18 |
$13,380 |
$14,384 |
$14,727 |
04/18 |
$13,543 |
$14,438 |
$14,983 |
05/18 |
$14,086 |
$14,846 |
$15,854 |
06/18 |
$13,986 |
$14,943 |
$15,950 |
07/18 |
$14,265 |
$15,439 |
$16,232 |
08/18 |
$14,679 |
$15,981 |
$16,618 |
09/18 |
$14,153 |
$16,008 |
$16,206 |
10/18 |
$12,783 |
$14,829 |
$14,755 |
11/18 |
$12,998 |
$15,126 |
$14,993 |
12/18 |
$11,326 |
$13,718 |
$13,181 |
01/19 |
$12,687 |
$14,896 |
$14,622 |
02/19 |
$13,266 |
$15,419 |
$15,191 |
03/19 |
$12,871 |
$15,645 |
$14,753 |
04/19 |
$13,424 |
$16,269 |
$15,311 |
05/19 |
$12,336 |
$15,216 |
$14,060 |
06/19 |
$13,109 |
$16,285 |
$14,956 |
07/19 |
$13,091 |
$16,527 |
$14,980 |
08/19 |
$12,347 |
$16,190 |
$14,144 |
09/19 |
$12,724 |
$16,475 |
$14,870 |
10/19 |
$12,930 |
$16,829 |
$15,230 |
11/19 |
$13,225 |
$17,469 |
$15,587 |
12/19 |
$13,631 |
$17,973 |
$16,132 |
01/20 |
$13,040 |
$17,954 |
$15,262 |
02/20 |
$11,730 |
$16,484 |
$13,779 |
03/20 |
$8,772 |
$14,217 |
$10,380 |
04/20 |
$10,155 |
$16,100 |
$11,660 |
05/20 |
$10,692 |
$16,961 |
$11,995 |
06/20 |
$10,744 |
$17,349 |
$12,342 |
07/20 |
$11,092 |
$18,334 |
$12,596 |
08/20 |
$11,650 |
$19,662 |
$13,275 |
09/20 |
$11,174 |
$18,946 |
$12,657 |
10/20 |
$11,567 |
$18,537 |
$13,110 |
11/20 |
$13,881 |
$20,792 |
$15,641 |
12/20 |
$14,974 |
$21,728 |
$16,880 |
01/21 |
$15,754 |
$21,631 |
$17,768 |
02/21 |
$17,295 |
$22,307 |
$19,437 |
03/21 |
$18,002 |
$23,107 |
$20,453 |
04/21 |
$18,626 |
$24,298 |
$20,867 |
05/21 |
$19,093 |
$24,409 |
$21,516 |
06/21 |
$18,979 |
$25,010 |
$21,386 |
07/21 |
$18,329 |
$25,433 |
$20,620 |
08/21 |
$18,769 |
$26,159 |
$21,173 |
09/21 |
$18,692 |
$24,985 |
$20,748 |
10/21 |
$19,963 |
$26,675 |
$21,539 |
11/21 |
$19,447 |
$26,269 |
$20,804 |
12/21 |
$20,020 |
$27,303 |
$21,652 |
01/22 |
$18,868 |
$25,697 |
$20,390 |
02/22 |
$19,360 |
$25,049 |
$20,727 |
03/22 |
$19,465 |
$25,862 |
$21,133 |
04/22 |
$17,925 |
$23,541 |
$19,493 |
05/22 |
$18,344 |
$23,509 |
$19,867 |
06/22 |
$16,519 |
$21,543 |
$17,904 |
07/22 |
$17,920 |
$23,564 |
$19,638 |
08/22 |
$17,366 |
$22,684 |
$19,017 |
09/22 |
$15,704 |
$20,581 |
$17,079 |
10/22 |
$17,496 |
$22,269 |
$19,229 |
11/22 |
$18,441 |
$23,431 |
$19,816 |
12/22 |
$17,249 |
$22,059 |
$18,516 |
01/23 |
$18,599 |
$23,578 |
$20,283 |
02/23 |
$18,399 |
$23,027 |
$19,815 |
03/23 |
$17,417 |
$23,643 |
$18,395 |
04/23 |
$17,327 |
$23,895 |
$17,936 |
05/23 |
$16,747 |
$23,988 |
$17,583 |
06/23 |
$18,116 |
$25,626 |
$18,980 |
07/23 |
$19,175 |
$26,544 |
$20,412 |
08/23 |
$18,392 |
$26,032 |
$19,430 |
09/23 |
$17,402 |
$24,792 |
$18,418 |
10/23 |
$16,480 |
$24,135 |
$17,319 |
11/23 |
$17,805 |
$26,385 |
$18,878 |
12/23 |
$19,620 |
$27,785 |
$21,228 |
01/24 |
$18,805 |
$28,093 |
$20,264 |
02/24 |
$19,608 |
$29,613 |
$20,927 |
03/24 |
$20,544 |
$30,569 |
$21,844 |
04/24 |
$19,596 |
$29,224 |
$20,452 |
05/24 |
$20,520 |
$30,604 |
$21,409 |
06/24 |
$20,032 |
$31,552 |
$21,048 |
07/24 |
$21,918 |
$32,138 |
$23,613 |
08/24 |
$21,656 |
$32,838 |
$23,170 |
09/24 |
$21,780 |
$33,517 |
$23,184 |
10/24 |
$21,725 |
$33,271 |
$22,822 |
11/24 |
$23,818 |
$35,484 |
$25,023 |
12/24 |
$21,842 |
$34,400 |
$22,938 |
01/25 |
$22,281 |
$35,486 |
$23,409 |
02/25 |
$21,308 |
$34,806 |
$22,513 |
03/25 |
$19,912 |
$32,775 |
$21,162 |
04/25 |
$19,127 |
$32,556 |
$20,312 |
05/25 |
$20,084 |
$34,619 |
$21,165 |
06/25 |
$21,061 |
$36,378 |
$22,213 |
07/25 |
$21,324 |
$37,179 |
$22,605 |
08/25 |
$23,082 |
$38,039 |
$24,520 |
09/25 |
$23,229 |
$39,352 |
$25,013 |
10/25 |
$22,917 |
$40,196 |
$25,075 |
11/25 |
$23,525 |
$40,306 |
$25,780 |
12/25 |
$23,574 |
$40,298 |
$25,827 |
01/26 |
$24,987 |
$40,923 |
$27,598 |
02/26 |
$25,685 |
$40,728 |
$28,130 |
|
| Average Annual Return [Table Text Block] |
|
Table Summary
Average Annual Total Returns (%) |
1 year |
5 years |
10 years |
Class A (excluding sales charges) |
20.54 |
8.23 |
10.55 |
Class A (including sales charges) |
13.60 |
6.96 |
9.89 |
Russell 3000® Index |
17.02 |
12.80 |
15.08 |
Russell 2000® Value Index |
24.95 |
7.67 |
10.90 | |
| No Deduction of Taxes [Text Block] |
|
Performance does not reflect the deduction of taxes that a shareholder may pay on fund distributions or on the redemptions of fund shares.
|
| Material Change Date |
Sep. 01, 2025
|
|
| Updated Performance Information Location [Text Block] |
|
columbiathreadneedleus.com/investment-products/mutual-funds
|
| AssetsNet |
|
$ 826,343,737
|
| Holdings Count | Holding |
|
101
|
| Advisory Fees Paid, Amount |
|
$ 7,007,299
|
| InvestmentCompanyPortfolioTurnover |
|
115.00%
|
| Additional Fund Statistics [Text Block] |
|
Table Summary
Fund net assets |
$826,343,737 |
Total number of portfolio holdings |
101 |
Management services fees (represents 0.85% of Fund average net assets) |
$7,007,299 |
Portfolio turnover for the reporting period |
115% | |
| Holdings [Text Block] |
|
Table Summary
Financials |
19.7% |
Industrials |
15.6% |
Real Estate |
12.4% |
Consumer Discretionary |
12.1% |
Information Technology |
9.4% |
Energy |
9.3% |
Health Care |
7.0% |
Materials |
6.0% |
Consumer Staples |
4.1% |
Utilities |
2.6% |
Other |
0.9% |
Table Summary
Common Stocks |
99.1% |
Other |
0.6% | |
| Largest Holdings [Text Block] |
|
Table Summary
Phillips Edison & Co., Inc. |
2.1% |
BankUnited, Inc. |
1.8% |
California Resources Corp. |
1.8% |
StoneX Group, Inc. |
1.7% |
Essent Group Ltd. |
1.7% |
Texas Capital Bancshares, Inc. |
1.7% |
Fulton Financial Corp. |
1.6% |
Polaris, Inc. |
1.6% |
Amneal Pharmaceuticals, Inc. |
1.6% |
Taylor Morrison Home Corp., Class A |
1.5% | |
| Material Fund Change [Text Block] |
|
This is a summary of the changes to the Fund. For more complete information, you may review the Fund’s prospectus, which is available at columbiathreadneedleus.com/resources/literature or upon request at 1-800-345-6611. Effective September 1, 2025, the Fund's name was changed from Columbia Small Cap Value Fund II to Columbia Small Cap Value and Inflection Fund. |
| Material Fund Change Name [Text Block] |
|
Effective September 1, 2025, the Fund's name was changed from Columbia Small Cap Value Fund II to Columbia Small Cap Value and Inflection Fund.
|
| Summary of Change Legend [Text Block] |
|
This is a summary of the changes to the Fund. For more complete information, you may review the Fund’s prospectus, which is available at columbiathreadneedleus.com/resources/literature or upon request at 1-800-345-6611.
|
| Updated Prospectus Phone Number |
|
1-800-345-6611
|
| Updated Prospectus Web Address |
|
columbiathreadneedleus.com/resources/literature
|
| C000029858 |
|
|
| Shareholder Report [Line Items] |
|
|
| Fund Name |
|
Columbia Small Cap Value and Inflection Fund
|
| Class Name |
|
Class R
|
| Trading Symbol |
|
CCTRX
|
| Annual or Semi-Annual Statement [Text Block] |
|
This annual shareholder report contains important information about Columbia Small Cap Value and Inflection Fund (the Fund) for the period of March 1, 2025 to February 28, 2026.
|
| Additional Information [Text Block] |
|
You can find additional information about the Fund at columbiathreadneedleus.com/resources/literature. You can also request more information by contacting us at 1-800-345-6611.
|
| Material Fund Change Notice [Text Block] |
|
This report describes changes to the Fund that occurred during the reporting period.
|
| Additional Information Phone Number |
|
1-800-345-6611
|
| Additional Information Website |
|
columbiathreadneedleus.com/resources/literature
|
| Expenses [Text Block] |
|
What were the Fund costs for the reporting period? (Based on a hypothetical $10,000 investment)
Table Summary
Class |
Cost of a $10,000 investment |
Cost paid as a percentage of a $10,000 investment |
Class R |
$160 |
1.45% | |
| Expenses Paid, Amount |
|
$ 160
|
| Expense Ratio, Percent |
|
1.45%
|
| Factors Affecting Performance [Text Block] |
|
Management's Discussion of Fund Performance The performance of Class R shares for the period presented is shown in the Average Annual Total Returns table. Top Performance ContributorsStock selection | Selections in the financials, consumer staples and utilities sectors boosted the Fund’s relative performance during the annual period. Allocations | Smaller allocations to the financials and utilities sectors and a larger allocation to the information technology sector buoyed the Fund’s relative performance during the annual period. Individual holdings | Positions in MP Materials, a rare earths company; Modine Manufacturing, an HVAC company; Dycom Industries, a telecom infrastructure contractor; Amkor Technology, a semiconductor packaging and testing company; and an overweight to Victoria’s Secret, a specialty retailer, were top contributors to the Fund’s relative performance during the period. Top Performance DetractorsStock selection | Selections in the health care, materials and communication services sectors hurt the Fund’s relative performance during the annual period. Allocations | Smaller weightings in the communication services and energy sectors and a larger weighting in the consumer discretionary sector detracted from the Fund’s relative performance during the annual period. Individual holdings | Lack of ownership of EchoStar, a telecom company; Hecla Mining, a precious metals miner; and Coeur Mining, a precious metals miner, were top detractors from the Fund’s relative performance during the period. Positions in Alaska Air Group, an airline, and Cousins Properties, an office REIT, were also top detractors from the Fund’s relative performance during the period. |
| Performance Past Does Not Indicate Future [Text] |
|
The Fund's past performance is not a good predictor of the Fund's future performance.
|
| Line Graph [Table Text Block] |
|
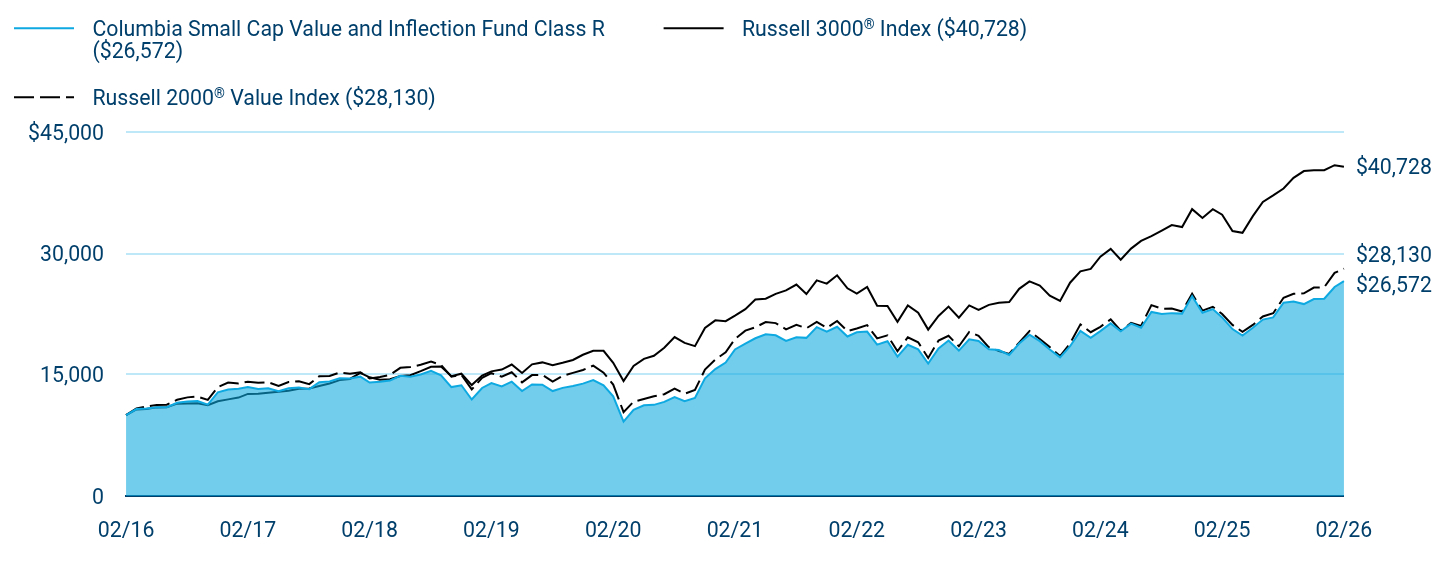
Table Summary
|
Columbia Small Cap Value and Inflection Fund Class R ($26,572) |
Russell 3000® Index ($40,728) |
Russell 2000® Value Index ($28,130) |
02/16 |
$10,000 |
$10,000 |
$10,000 |
03/16 |
$10,755 |
$10,704 |
$10,829 |
04/16 |
$10,827 |
$10,770 |
$11,058 |
05/16 |
$10,992 |
$10,963 |
$11,261 |
06/16 |
$10,980 |
$10,986 |
$11,295 |
07/16 |
$11,525 |
$11,422 |
$11,905 |
08/16 |
$11,684 |
$11,451 |
$12,200 |
09/16 |
$11,757 |
$11,469 |
$12,297 |
10/16 |
$11,300 |
$11,221 |
$11,892 |
11/16 |
$12,817 |
$11,723 |
$13,471 |
12/16 |
$13,171 |
$11,952 |
$14,027 |
01/17 |
$13,255 |
$12,176 |
$13,927 |
02/17 |
$13,467 |
$12,629 |
$14,129 |
03/17 |
$13,247 |
$12,638 |
$14,009 |
04/17 |
$13,323 |
$12,772 |
$14,064 |
05/17 |
$12,974 |
$12,903 |
$13,626 |
06/17 |
$13,324 |
$13,019 |
$14,103 |
07/17 |
$13,412 |
$13,264 |
$14,192 |
08/17 |
$13,220 |
$13,290 |
$13,843 |
09/17 |
$14,075 |
$13,614 |
$14,823 |
10/17 |
$14,179 |
$13,911 |
$14,843 |
11/17 |
$14,555 |
$14,334 |
$15,272 |
12/17 |
$14,540 |
$14,477 |
$15,127 |
01/18 |
$14,765 |
$15,240 |
$15,313 |
02/18 |
$14,031 |
$14,678 |
$14,547 |
03/18 |
$14,123 |
$14,384 |
$14,727 |
04/18 |
$14,290 |
$14,438 |
$14,983 |
05/18 |
$14,865 |
$14,846 |
$15,854 |
06/18 |
$14,749 |
$14,943 |
$15,950 |
07/18 |
$15,039 |
$15,439 |
$16,232 |
08/18 |
$15,475 |
$15,981 |
$16,618 |
09/18 |
$14,920 |
$16,008 |
$16,206 |
10/18 |
$13,475 |
$14,829 |
$14,755 |
11/18 |
$13,697 |
$15,126 |
$14,993 |
12/18 |
$11,938 |
$13,718 |
$13,181 |
01/19 |
$13,363 |
$14,896 |
$14,622 |
02/19 |
$13,967 |
$15,419 |
$15,191 |
03/19 |
$13,552 |
$15,645 |
$14,753 |
04/19 |
$14,137 |
$16,269 |
$15,311 |
05/19 |
$12,986 |
$15,216 |
$14,060 |
06/19 |
$13,792 |
$16,285 |
$14,956 |
07/19 |
$13,773 |
$16,527 |
$14,980 |
08/19 |
$12,983 |
$16,190 |
$14,144 |
09/19 |
$13,378 |
$16,475 |
$14,870 |
10/19 |
$13,599 |
$16,829 |
$15,230 |
11/19 |
$13,898 |
$17,469 |
$15,587 |
12/19 |
$14,332 |
$17,973 |
$16,132 |
01/20 |
$13,698 |
$17,954 |
$15,262 |
02/20 |
$12,321 |
$16,484 |
$13,779 |
03/20 |
$9,207 |
$14,217 |
$10,380 |
04/20 |
$10,671 |
$16,100 |
$11,660 |
05/20 |
$11,227 |
$16,961 |
$11,995 |
06/20 |
$11,274 |
$17,349 |
$12,342 |
07/20 |
$11,637 |
$18,334 |
$12,596 |
08/20 |
$12,225 |
$19,662 |
$13,275 |
09/20 |
$11,715 |
$18,946 |
$12,657 |
10/20 |
$12,137 |
$18,537 |
$13,110 |
11/20 |
$14,560 |
$20,792 |
$15,641 |
12/20 |
$15,697 |
$21,728 |
$16,880 |
01/21 |
$16,513 |
$21,631 |
$17,768 |
02/21 |
$18,125 |
$22,307 |
$19,437 |
03/21 |
$18,862 |
$23,107 |
$20,453 |
04/21 |
$19,511 |
$24,298 |
$20,867 |
05/21 |
$20,003 |
$24,409 |
$21,516 |
06/21 |
$19,880 |
$25,010 |
$21,386 |
07/21 |
$19,183 |
$25,433 |
$20,620 |
08/21 |
$19,644 |
$26,159 |
$21,173 |
09/21 |
$19,562 |
$24,985 |
$20,748 |
10/21 |
$20,895 |
$26,675 |
$21,539 |
11/21 |
$20,341 |
$26,269 |
$20,804 |
12/21 |
$20,936 |
$27,303 |
$21,652 |
01/22 |
$19,733 |
$25,697 |
$20,390 |
02/22 |
$20,251 |
$25,049 |
$20,727 |
03/22 |
$20,340 |
$25,862 |
$21,133 |
04/22 |
$18,721 |
$23,541 |
$19,493 |
05/22 |
$19,149 |
$23,509 |
$19,867 |
06/22 |
$17,246 |
$21,543 |
$17,904 |
07/22 |
$18,704 |
$23,564 |
$19,638 |
08/22 |
$18,132 |
$22,684 |
$19,017 |
09/22 |
$16,394 |
$20,581 |
$17,079 |
10/22 |
$18,261 |
$22,269 |
$19,229 |
11/22 |
$19,241 |
$23,431 |
$19,816 |
12/22 |
$17,989 |
$22,059 |
$18,516 |
01/23 |
$19,389 |
$23,578 |
$20,283 |
02/23 |
$19,174 |
$23,027 |
$19,815 |
03/23 |
$18,157 |
$23,643 |
$18,395 |
04/23 |
$18,061 |
$23,895 |
$17,936 |
05/23 |
$17,450 |
$23,988 |
$17,583 |
06/23 |
$18,862 |
$25,626 |
$18,980 |
07/23 |
$19,962 |
$26,544 |
$20,412 |
08/23 |
$19,159 |
$26,032 |
$19,430 |
09/23 |
$18,120 |
$24,792 |
$18,418 |
10/23 |
$17,156 |
$24,135 |
$17,319 |
11/23 |
$18,528 |
$26,385 |
$18,878 |
12/23 |
$20,419 |
$27,785 |
$21,228 |
01/24 |
$19,558 |
$28,093 |
$20,264 |
02/24 |
$20,394 |
$29,613 |
$20,927 |
03/24 |
$21,358 |
$30,569 |
$21,844 |
04/24 |
$20,368 |
$29,224 |
$20,452 |
05/24 |
$21,319 |
$30,604 |
$21,409 |
06/24 |
$20,813 |
$31,552 |
$21,048 |
07/24 |
$22,770 |
$32,138 |
$23,613 |
08/24 |
$22,503 |
$32,838 |
$23,170 |
09/24 |
$22,622 |
$33,517 |
$23,184 |
10/24 |
$22,562 |
$33,271 |
$22,822 |
11/24 |
$24,727 |
$35,484 |
$25,023 |
12/24 |
$22,667 |
$34,400 |
$22,938 |
01/25 |
$23,125 |
$35,486 |
$23,409 |
02/25 |
$22,091 |
$34,806 |
$22,513 |
03/25 |
$20,651 |
$32,775 |
$21,162 |
04/25 |
$19,838 |
$32,556 |
$20,312 |
05/25 |
$20,821 |
$34,619 |
$21,165 |
06/25 |
$21,824 |
$36,378 |
$22,213 |
07/25 |
$22,091 |
$37,179 |
$22,605 |
08/25 |
$23,903 |
$38,039 |
$24,520 |
09/25 |
$24,063 |
$39,352 |
$25,013 |
10/25 |
$23,743 |
$40,196 |
$25,075 |
11/25 |
$24,366 |
$40,306 |
$25,780 |
12/25 |
$24,401 |
$40,298 |
$25,827 |
01/26 |
$25,855 |
$40,923 |
$27,598 |
02/26 |
$26,572 |
$40,728 |
$28,130 |
|
| Average Annual Return [Table Text Block] |
|
Table Summary
Average Annual Total Returns (%) |
1 year |
5 years |
10 years |
Class R |
20.28 |
7.95 |
10.27 |
Russell 3000® Index |
17.02 |
12.80 |
15.08 |
Russell 2000® Value Index |
24.95 |
7.67 |
10.90 | |
| No Deduction of Taxes [Text Block] |
|
Performance does not reflect the deduction of taxes that a shareholder may pay on fund distributions or on the redemptions of fund shares.
|
| Material Change Date |
Sep. 01, 2025
|
|
| Updated Performance Information Location [Text Block] |
|
columbiathreadneedleus.com/investment-products/mutual-funds
|
| AssetsNet |
|
$ 826,343,737
|
| Holdings Count | Holding |
|
101
|
| Advisory Fees Paid, Amount |
|
$ 7,007,299
|
| InvestmentCompanyPortfolioTurnover |
|
115.00%
|
| Additional Fund Statistics [Text Block] |
|
Table Summary
Fund net assets |
$826,343,737 |
Total number of portfolio holdings |
101 |
Management services fees (represents 0.85% of Fund average net assets) |
$7,007,299 |
Portfolio turnover for the reporting period |
115% | |
| Holdings [Text Block] |
|
Table Summary
Financials |
19.7% |
Industrials |
15.6% |
Real Estate |
12.4% |
Consumer Discretionary |
12.1% |
Information Technology |
9.4% |
Energy |
9.3% |
Health Care |
7.0% |
Materials |
6.0% |
Consumer Staples |
4.1% |
Utilities |
2.6% |
Other |
0.9% |
Table Summary
Common Stocks |
99.1% |
Other |
0.6% | |
| Largest Holdings [Text Block] |
|
Table Summary
Phillips Edison & Co., Inc. |
2.1% |
BankUnited, Inc. |
1.8% |
California Resources Corp. |
1.8% |
StoneX Group, Inc. |
1.7% |
Essent Group Ltd. |
1.7% |
Texas Capital Bancshares, Inc. |
1.7% |
Fulton Financial Corp. |
1.6% |
Polaris, Inc. |
1.6% |
Amneal Pharmaceuticals, Inc. |
1.6% |
Taylor Morrison Home Corp., Class A |
1.5% | |
| Material Fund Change [Text Block] |
|
This is a summary of the changes to the Fund. For more complete information, you may review the Fund’s prospectus, which is available at columbiathreadneedleus.com/resources/literature or upon request at 1-800-345-6611. Effective September 1, 2025, the Fund's name was changed from Columbia Small Cap Value Fund II to Columbia Small Cap Value and Inflection Fund. |
| Material Fund Change Name [Text Block] |
|
Effective September 1, 2025, the Fund's name was changed from Columbia Small Cap Value Fund II to Columbia Small Cap Value and Inflection Fund.
|
| Summary of Change Legend [Text Block] |
|
This is a summary of the changes to the Fund. For more complete information, you may review the Fund’s prospectus, which is available at columbiathreadneedleus.com/resources/literature or upon request at 1-800-345-6611.
|
| Updated Prospectus Phone Number |
|
1-800-345-6611
|
| Updated Prospectus Web Address |
|
columbiathreadneedleus.com/resources/literature
|
| C000253705 |
|
|
| Shareholder Report [Line Items] |
|
|
| Fund Name |
|
Columbia Small Cap Value and Inflection Fund
|
| Class Name |
|
Class S
|
| Trading Symbol |
|
NSVBX
|
| Annual or Semi-Annual Statement [Text Block] |
|
This annual shareholder report contains important information about Columbia Small Cap Value and Inflection Fund (the Fund) for the period of March 1, 2025 to February 28, 2026.
|
| Additional Information [Text Block] |
|
You can find additional information about the Fund at columbiathreadneedleus.com/resources/literature. You can also request more information by contacting us at 1-800-345-6611.
|
| Material Fund Change Notice [Text Block] |
|
This report describes changes to the Fund that occurred during the reporting period.
|
| Additional Information Phone Number |
|
1-800-345-6611
|
| Additional Information Website |
|
columbiathreadneedleus.com/resources/literature
|
| Expenses [Text Block] |
|
What were the Fund costs for the reporting period? (Based on a hypothetical $10,000 investment)
Table Summary
Class |
Cost of a $10,000 investment |
Cost paid as a percentage of a $10,000 investment |
Class S |
$105 |
0.95% | |
| Expenses Paid, Amount |
|
$ 105
|
| Expense Ratio, Percent |
|
0.95%
|
| Factors Affecting Performance [Text Block] |
|
Management's Discussion of Fund Performance The performance of Class S shares for the period presented is shown in the Average Annual Total Returns table. Top Performance ContributorsStock selection | Selections in the financials, consumer staples and utilities sectors boosted the Fund’s relative performance during the annual period. Allocations | Smaller allocations to the financials and utilities sectors and a larger allocation to the information technology sector buoyed the Fund’s relative performance during the annual period. Individual holdings | Positions in MP Materials, a rare earths company; Modine Manufacturing, an HVAC company; Dycom Industries, a telecom infrastructure contractor; Amkor Technology, a semiconductor packaging and testing company; and an overweight to Victoria’s Secret, a specialty retailer, were top contributors to the Fund’s relative performance during the period. Top Performance DetractorsStock selection | Selections in the health care, materials and communication services sectors hurt the Fund’s relative performance during the annual period. Allocations | Smaller weightings in the communication services and energy sectors and a larger weighting in the consumer discretionary sector detracted from the Fund’s relative performance during the annual period. Individual holdings | Lack of ownership of EchoStar, a telecom company; Hecla Mining, a precious metals miner; and Coeur Mining, a precious metals miner, were top detractors from the Fund’s relative performance during the period. Positions in Alaska Air Group, an airline, and Cousins Properties, an office REIT, were also top detractors from the Fund’s relative performance during the period. |
| Performance Past Does Not Indicate Future [Text] |
|
The Fund's past performance is not a good predictor of the Fund's future performance.
|
| Line Graph [Table Text Block] |
|
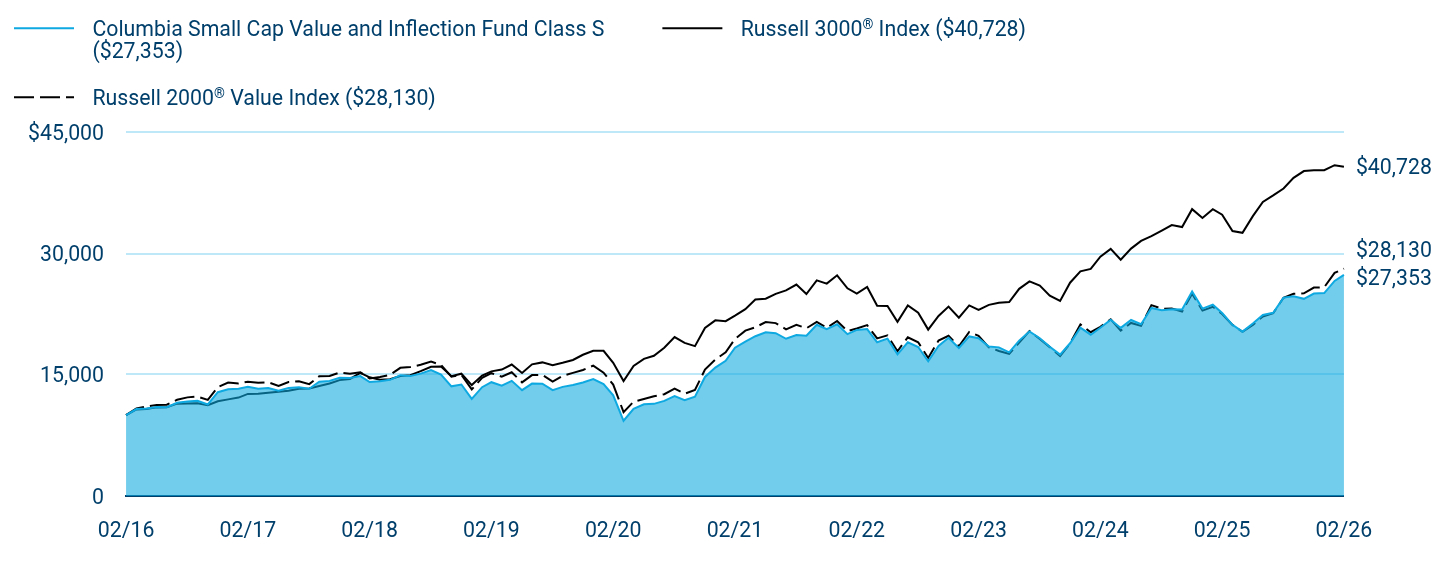
Table Summary
|
Columbia Small Cap Value and Inflection Fund Class S ($27,353) |
Russell 3000® Index ($40,728) |
Russell 2000® Value Index ($28,130) |
02/16 |
$10,000 |
$10,000 |
$10,000 |
03/16 |
$10,760 |
$10,704 |
$10,829 |
04/16 |
$10,832 |
$10,770 |
$11,058 |
05/16 |
$10,995 |
$10,963 |
$11,261 |
06/16 |
$10,987 |
$10,986 |
$11,295 |
07/16 |
$11,540 |
$11,422 |
$11,905 |
08/16 |
$11,698 |
$11,451 |
$12,200 |
09/16 |
$11,777 |
$11,469 |
$12,297 |
10/16 |
$11,325 |
$11,221 |
$11,892 |
11/16 |
$12,840 |
$11,723 |
$13,471 |
12/16 |
$13,198 |
$11,952 |
$14,027 |
01/17 |
$13,281 |
$12,176 |
$13,927 |
02/17 |
$13,498 |
$12,629 |
$14,129 |
03/17 |
$13,281 |
$12,638 |
$14,009 |
04/17 |
$13,363 |
$12,772 |
$14,064 |
05/17 |
$13,011 |
$12,903 |
$13,626 |
06/17 |
$13,372 |
$13,019 |
$14,103 |
07/17 |
$13,458 |
$13,264 |
$14,192 |
08/17 |
$13,269 |
$13,290 |
$13,843 |
09/17 |
$14,130 |
$13,614 |
$14,823 |
10/17 |
$14,241 |
$13,911 |
$14,843 |
11/17 |
$14,620 |
$14,334 |
$15,272 |
12/17 |
$14,601 |
$14,477 |
$15,127 |
01/18 |
$14,832 |
$15,240 |
$15,313 |
02/18 |
$14,098 |
$14,678 |
$14,547 |
03/18 |
$14,197 |
$14,384 |
$14,727 |
04/18 |
$14,370 |
$14,438 |
$14,983 |
05/18 |
$14,947 |
$14,846 |
$15,854 |
06/18 |
$14,841 |
$14,943 |
$15,950 |
07/18 |
$15,137 |
$15,439 |
$16,232 |
08/18 |
$15,576 |
$15,981 |
$16,618 |
09/18 |
$15,018 |
$16,008 |
$16,206 |
10/18 |
$13,565 |
$14,829 |
$14,755 |
11/18 |
$13,793 |
$15,126 |
$14,993 |
12/18 |
$12,018 |
$13,718 |
$13,181 |
01/19 |
$13,462 |
$14,896 |
$14,622 |
02/19 |
$14,077 |
$15,419 |
$15,191 |
03/19 |
$13,658 |
$15,645 |
$14,753 |
04/19 |
$14,245 |
$16,269 |
$15,311 |
05/19 |
$13,090 |
$15,216 |
$14,060 |
06/19 |
$13,910 |
$16,285 |
$14,956 |
07/19 |
$13,891 |
$16,527 |
$14,980 |
08/19 |
$13,102 |
$16,190 |
$14,144 |
09/19 |
$13,501 |
$16,475 |
$14,870 |
10/19 |
$13,720 |
$16,829 |
$15,230 |
11/19 |
$14,034 |
$17,469 |
$15,587 |
12/19 |
$14,465 |
$17,973 |
$16,132 |
01/20 |
$13,837 |
$17,954 |
$15,262 |
02/20 |
$12,446 |
$16,484 |
$13,779 |
03/20 |
$9,308 |
$14,217 |
$10,380 |
04/20 |
$10,776 |
$16,100 |
$11,660 |
05/20 |
$11,346 |
$16,961 |
$11,995 |
06/20 |
$11,401 |
$17,349 |
$12,342 |
07/20 |
$11,770 |
$18,334 |
$12,596 |
08/20 |
$12,362 |
$19,662 |
$13,275 |
09/20 |
$11,857 |
$18,946 |
$12,657 |
10/20 |
$12,274 |
$18,537 |
$13,110 |
11/20 |
$14,729 |
$20,792 |
$15,641 |
12/20 |
$15,889 |
$21,728 |
$16,880 |
01/21 |
$16,717 |
$21,631 |
$17,768 |
02/21 |
$18,352 |
$22,307 |
$19,437 |
03/21 |
$19,102 |
$23,107 |
$20,453 |
04/21 |
$19,764 |
$24,298 |
$20,867 |
05/21 |
$20,261 |
$24,409 |
$21,516 |
06/21 |
$20,139 |
$25,010 |
$21,386 |
07/21 |
$19,450 |
$25,433 |
$20,620 |
08/21 |
$19,916 |
$26,159 |
$21,173 |
09/21 |
$19,835 |
$24,985 |
$20,748 |
10/21 |
$21,184 |
$26,675 |
$21,539 |
11/21 |
$20,636 |
$26,269 |
$20,804 |
12/21 |
$21,244 |
$27,303 |
$21,652 |
01/22 |
$20,021 |
$25,697 |
$20,390 |
02/22 |
$20,544 |
$25,049 |
$20,727 |
03/22 |
$20,655 |
$25,862 |
$21,133 |
04/22 |
$19,021 |
$23,541 |
$19,493 |
05/22 |
$19,465 |
$23,509 |
$19,867 |
06/22 |
$17,529 |
$21,543 |
$17,904 |
07/22 |
$19,015 |
$23,564 |
$19,638 |
08/22 |
$18,428 |
$22,684 |
$19,017 |
09/22 |
$16,664 |
$20,581 |
$17,079 |
10/22 |
$18,566 |
$22,269 |
$19,229 |
11/22 |
$19,568 |
$23,431 |
$19,816 |
12/22 |
$18,304 |
$22,059 |
$18,516 |
01/23 |
$19,736 |
$23,578 |
$20,283 |
02/23 |
$19,523 |
$23,027 |
$19,815 |
03/23 |
$18,481 |
$23,643 |
$18,395 |
04/23 |
$18,387 |
$23,895 |
$17,936 |
05/23 |
$17,771 |
$23,988 |
$17,583 |
06/23 |
$19,223 |
$25,626 |
$18,980 |
07/23 |
$20,347 |
$26,544 |
$20,412 |
08/23 |
$19,516 |
$26,032 |
$19,430 |
09/23 |
$18,465 |
$24,792 |
$18,418 |
10/23 |
$17,488 |
$24,135 |
$17,319 |
11/23 |
$18,893 |
$26,385 |
$18,878 |
12/23 |
$20,820 |
$27,785 |
$21,228 |
01/24 |
$19,954 |
$28,093 |
$20,264 |
02/24 |
$20,807 |
$29,613 |
$20,927 |
03/24 |
$21,799 |
$30,569 |
$21,844 |
04/24 |
$20,794 |
$29,224 |
$20,452 |
05/24 |
$21,774 |
$30,604 |
$21,409 |
06/24 |
$21,256 |
$31,552 |
$21,048 |
07/24 |
$23,257 |
$32,138 |
$23,613 |
08/24 |
$22,980 |
$32,838 |
$23,170 |
09/24 |
$23,111 |
$33,517 |
$23,184 |
10/24 |
$23,071 |
$33,271 |
$22,822 |
11/24 |
$25,295 |
$35,484 |
$25,023 |
12/24 |
$23,185 |
$34,400 |
$22,938 |
01/25 |
$23,669 |
$35,486 |
$23,409 |
02/25 |
$22,637 |
$34,806 |
$22,513 |
03/25 |
$21,170 |
$32,775 |
$21,162 |
04/25 |
$20,331 |
$32,556 |
$20,312 |
05/25 |
$21,347 |
$34,619 |
$21,165 |
06/25 |
$22,400 |
$36,378 |
$22,213 |
07/25 |
$22,670 |
$37,179 |
$22,605 |
08/25 |
$24,540 |
$38,039 |
$24,520 |
09/25 |
$24,709 |
$39,352 |
$25,013 |
10/25 |
$24,389 |
$40,196 |
$25,075 |
11/25 |
$25,046 |
$40,306 |
$25,780 |
12/25 |
$25,097 |
$40,298 |
$25,827 |
01/26 |
$26,601 |
$40,923 |
$27,598 |
02/26 |
$27,353 |
$40,728 |
$28,130 |
|
| Average Annual Return [Table Text Block] |
|
Table Summary
Average Annual Total Returns (%) |
1 year |
5 years |
10 years |
Class SFootnote Reference(a) |
20.83 |
8.31 |
10.59 |
Russell 3000® Index |
17.02 |
12.80 |
15.08 |
Russell 2000® Value Index |
24.95 |
7.67 |
10.90 | |
| No Deduction of Taxes [Text Block] |
|
Performance does not reflect the deduction of taxes that a shareholder may pay on fund distributions or on the redemptions of fund shares.
|
| Material Change Date |
Sep. 01, 2025
|
|
| Updated Performance Information Location [Text Block] |
|
columbiathreadneedleus.com/investment-products/mutual-funds
|
| AssetsNet |
|
$ 826,343,737
|
| Holdings Count | Holding |
|
101
|
| Advisory Fees Paid, Amount |
|
$ 7,007,299
|
| InvestmentCompanyPortfolioTurnover |
|
115.00%
|
| Additional Fund Statistics [Text Block] |
|
Table Summary
Fund net assets |
$826,343,737 |
Total number of portfolio holdings |
101 |
Management services fees (represents 0.85% of Fund average net assets) |
$7,007,299 |
Portfolio turnover for the reporting period |
115% | |
| Holdings [Text Block] |
|
Table Summary
Financials |
19.7% |
Industrials |
15.6% |
Real Estate |
12.4% |
Consumer Discretionary |
12.1% |
Information Technology |
9.4% |
Energy |
9.3% |
Health Care |
7.0% |
Materials |
6.0% |
Consumer Staples |
4.1% |
Utilities |
2.6% |
Other |
0.9% |
Table Summary
Common Stocks |
99.1% |
Other |
0.6% | |
| Largest Holdings [Text Block] |
|
Table Summary
Phillips Edison & Co., Inc. |
2.1% |
BankUnited, Inc. |
1.8% |
California Resources Corp. |
1.8% |
StoneX Group, Inc. |
1.7% |
Essent Group Ltd. |
1.7% |
Texas Capital Bancshares, Inc. |
1.7% |
Fulton Financial Corp. |
1.6% |
Polaris, Inc. |
1.6% |
Amneal Pharmaceuticals, Inc. |
1.6% |
Taylor Morrison Home Corp., Class A |
1.5% | |
| Material Fund Change [Text Block] |
|
This is a summary of the changes to the Fund. For more complete information, you may review the Fund’s prospectus, which is available at columbiathreadneedleus.com/resources/literature or upon request at 1-800-345-6611. Effective September 1, 2025, the Fund's name was changed from Columbia Small Cap Value Fund II to Columbia Small Cap Value and Inflection Fund. |
| Material Fund Change Name [Text Block] |
|
Effective September 1, 2025, the Fund's name was changed from Columbia Small Cap Value Fund II to Columbia Small Cap Value and Inflection Fund.
|
| Summary of Change Legend [Text Block] |
|
This is a summary of the changes to the Fund. For more complete information, you may review the Fund’s prospectus, which is available at columbiathreadneedleus.com/resources/literature or upon request at 1-800-345-6611.
|
| Updated Prospectus Phone Number |
|
1-800-345-6611
|
| Updated Prospectus Web Address |
|
columbiathreadneedleus.com/resources/literature
|
| C000122579 |
|
|
| Shareholder Report [Line Items] |
|
|
| Fund Name |
|
Columbia Small Cap Value and Inflection Fund
|
| Class Name |
|
Institutional 2 Class
|
| Trading Symbol |
|
CRRRX
|
| Annual or Semi-Annual Statement [Text Block] |
|
This annual shareholder report contains important information about Columbia Small Cap Value and Inflection Fund (the Fund) for the period of March 1, 2025 to February 28, 2026.
|
| Additional Information [Text Block] |
|
You can find additional information about the Fund at columbiathreadneedleus.com/resources/literature. You can also request more information by contacting us at 1-800-345-6611.
|
| Material Fund Change Notice [Text Block] |
|
This report describes changes to the Fund that occurred during the reporting period.
|
| Additional Information Phone Number |
|
1-800-345-6611
|
| Additional Information Website |
|
columbiathreadneedleus.com/resources/literature
|
| Expenses [Text Block] |
|
What were the Fund costs for the reporting period? (Based on a hypothetical $10,000 investment)
Table Summary
Class |
Cost of a $10,000 investment |
Cost paid as a percentage of a $10,000 investment |
Institutional 2 Class |
$88 |
0.80% | |
| Expenses Paid, Amount |
|
$ 88
|
| Expense Ratio, Percent |
|
0.80%
|
| Factors Affecting Performance [Text Block] |
|
Management's Discussion of Fund Performance The performance of Institutional 2 Class shares for the period presented is shown in the Average Annual Total Returns table. Top Performance ContributorsStock selection | Selections in the financials, consumer staples and utilities sectors boosted the Fund’s relative performance during the annual period. Allocations | Smaller allocations to the financials and utilities sectors and a larger allocation to the information technology sector buoyed the Fund’s relative performance during the annual period. Individual holdings | Positions in MP Materials, a rare earths company; Modine Manufacturing, an HVAC company; Dycom Industries, a telecom infrastructure contractor; Amkor Technology, a semiconductor packaging and testing company; and an overweight to Victoria’s Secret, a specialty retailer, were top contributors to the Fund’s relative performance during the period. Top Performance DetractorsStock selection | Selections in the health care, materials and communication services sectors hurt the Fund’s relative performance during the annual period. Allocations | Smaller weightings in the communication services and energy sectors and a larger weighting in the consumer discretionary sector detracted from the Fund’s relative performance during the annual period. Individual holdings | Lack of ownership of EchoStar, a telecom company; Hecla Mining, a precious metals miner; and Coeur Mining, a precious metals miner, were top detractors from the Fund’s relative performance during the period. Positions in Alaska Air Group, an airline, and Cousins Properties, an office REIT, were also top detractors from the Fund’s relative performance during the period. |
| Performance Past Does Not Indicate Future [Text] |
|
The Fund's past performance is not a good predictor of the Fund's future performance.
|
| Line Graph [Table Text Block] |
|
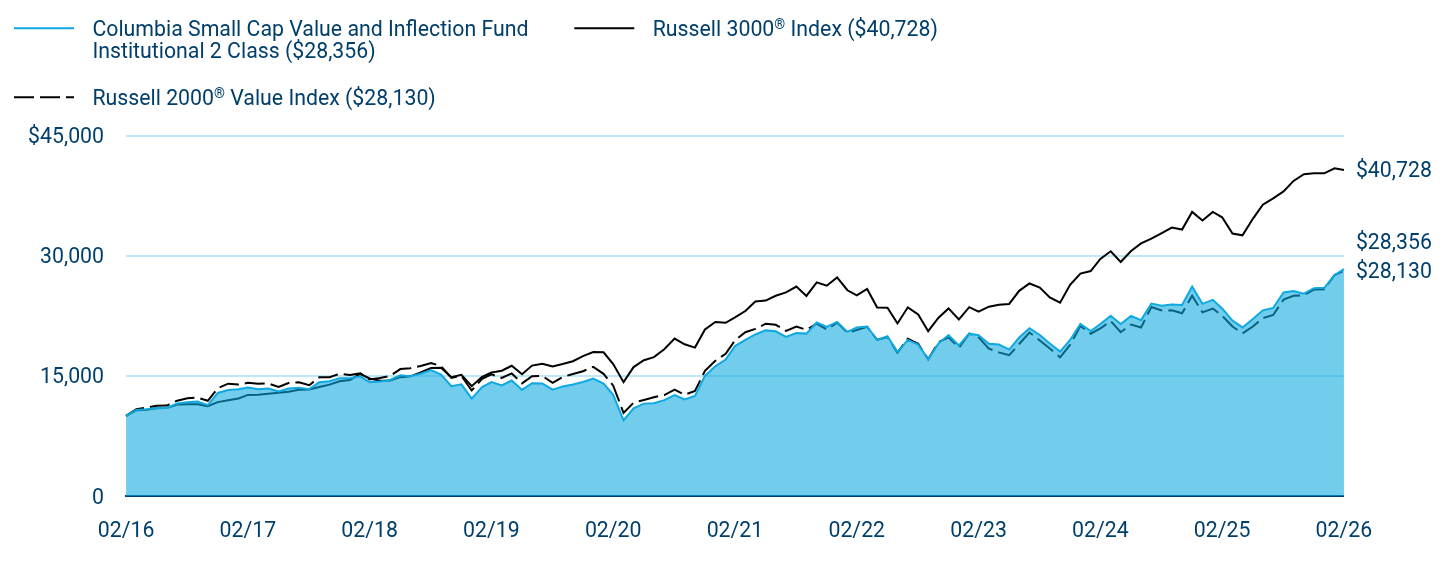
Table Summary
|
Columbia Small Cap Value and Inflection Fund Institutional 2 Class ($28,356) |
Russell 3000® Index ($40,728) |
Russell 2000® Value Index ($28,130) |
02/16 |
$10,000 |
$10,000 |
$10,000 |
03/16 |
$10,757 |
$10,704 |
$10,829 |
04/16 |
$10,833 |
$10,770 |
$11,058 |
05/16 |
$11,005 |
$10,963 |
$11,261 |
06/16 |
$10,997 |
$10,986 |
$11,295 |
07/16 |
$11,546 |
$11,422 |
$11,905 |
08/16 |
$11,713 |
$11,451 |
$12,200 |
09/16 |
$11,797 |
$11,469 |
$12,297 |
10/16 |
$11,345 |
$11,221 |
$11,892 |
11/16 |
$12,868 |
$11,723 |
$13,471 |
12/16 |
$13,237 |
$11,952 |
$14,027 |
01/17 |
$13,324 |
$12,176 |
$13,927 |
02/17 |
$13,542 |
$12,629 |
$14,129 |
03/17 |
$13,332 |
$12,638 |
$14,009 |
04/17 |
$13,419 |
$12,772 |
$14,064 |
05/17 |
$13,070 |
$12,903 |
$13,626 |
06/17 |
$13,434 |
$13,019 |
$14,103 |
07/17 |
$13,534 |
$13,264 |
$14,192 |
08/17 |
$13,342 |
$13,290 |
$13,843 |
09/17 |
$14,214 |
$13,614 |
$14,823 |
10/17 |
$14,329 |
$13,911 |
$14,843 |
11/17 |
$14,719 |
$14,334 |
$15,272 |
12/17 |
$14,701 |
$14,477 |
$15,127 |
01/18 |
$14,941 |
$15,240 |
$15,313 |
02/18 |
$14,206 |
$14,678 |
$14,547 |
03/18 |
$14,310 |
$14,384 |
$14,727 |
04/18 |
$14,486 |
$14,438 |
$14,983 |
05/18 |
$15,077 |
$14,846 |
$15,854 |
06/18 |
$14,966 |
$14,943 |
$15,950 |
07/18 |
$15,269 |
$15,439 |
$16,232 |
08/18 |
$15,719 |
$15,981 |
$16,618 |
09/18 |
$15,162 |
$16,008 |
$16,206 |
10/18 |
$13,705 |
$14,829 |
$14,755 |
11/18 |
$13,942 |
$15,126 |
$14,993 |
12/18 |
$12,153 |
$13,718 |
$13,181 |
01/19 |
$13,606 |
$14,896 |
$14,622 |
02/19 |
$14,237 |
$15,419 |
$15,191 |
03/19 |
$13,813 |
$15,645 |
$14,753 |
04/19 |
$14,418 |
$16,269 |
$15,311 |
05/19 |
$13,254 |
$15,216 |
$14,060 |
06/19 |
$14,093 |
$16,285 |
$14,956 |
07/19 |
$14,066 |
$16,527 |
$14,980 |
08/19 |
$13,274 |
$16,190 |
$14,144 |
09/19 |
$13,688 |
$16,475 |
$14,870 |
10/19 |
$13,918 |
$16,829 |
$15,230 |
11/19 |
$14,231 |
$17,469 |
$15,587 |
12/19 |
$14,678 |
$17,973 |
$16,132 |
01/20 |
$14,050 |
$17,954 |
$15,262 |
02/20 |
$12,635 |
$16,484 |
$13,779 |
03/20 |
$9,448 |
$14,217 |
$10,380 |
04/20 |
$10,957 |
$16,100 |
$11,660 |
05/20 |
$11,538 |
$16,961 |
$11,995 |
06/20 |
$11,592 |
$17,349 |
$12,342 |
07/20 |
$11,978 |
$18,334 |
$12,596 |
08/20 |
$12,590 |
$19,662 |
$13,275 |
09/20 |
$12,072 |
$18,946 |
$12,657 |
10/20 |
$12,505 |
$18,537 |
$13,110 |
11/20 |
$15,010 |
$20,792 |
$15,641 |
12/20 |
$16,195 |
$21,728 |
$16,880 |
01/21 |
$17,037 |
$21,631 |
$17,768 |
02/21 |
$18,723 |
$22,307 |
$19,437 |
03/21 |
$19,490 |
$23,107 |
$20,453 |
04/21 |
$20,172 |
$24,298 |
$20,867 |
05/21 |
$20,684 |
$24,409 |
$21,516 |
06/21 |
$20,575 |
$25,010 |
$21,386 |
07/21 |
$19,866 |
$25,433 |
$20,620 |
08/21 |
$20,349 |
$26,159 |
$21,173 |
09/21 |
$20,280 |
$24,985 |
$20,748 |
10/21 |
$21,668 |
$26,675 |
$21,539 |
11/21 |
$21,116 |
$26,269 |
$20,804 |
12/21 |
$21,736 |
$27,303 |
$21,652 |
01/22 |
$20,497 |
$25,697 |
$20,390 |
02/22 |
$21,047 |
$25,049 |
$20,727 |
03/22 |
$21,154 |
$25,862 |
$21,133 |
04/22 |
$19,495 |
$23,541 |
$19,493 |
05/22 |
$19,948 |
$23,509 |
$19,867 |
06/22 |
$17,973 |
$21,543 |
$17,904 |
07/22 |
$19,501 |
$23,564 |
$19,638 |
08/22 |
$18,910 |
$22,684 |
$19,017 |
09/22 |
$17,115 |
$20,581 |
$17,079 |
10/22 |
$19,066 |
$22,269 |
$19,229 |
11/22 |
$20,103 |
$23,431 |
$19,816 |
12/22 |
$18,796 |
$22,059 |
$18,516 |
01/23 |
$20,276 |
$23,578 |
$20,283 |
02/23 |
$20,069 |
$23,027 |
$19,815 |
03/23 |
$19,014 |
$23,643 |
$18,395 |
04/23 |
$18,922 |
$23,895 |
$17,936 |
05/23 |
$18,291 |
$23,988 |
$17,583 |
06/23 |
$19,791 |
$25,626 |
$18,980 |
07/23 |
$20,951 |
$26,544 |
$20,412 |
08/23 |
$20,111 |
$26,032 |
$19,430 |
09/23 |
$19,034 |
$24,792 |
$18,418 |
10/23 |
$18,029 |
$24,135 |
$17,319 |
11/23 |
$19,484 |
$26,385 |
$18,878 |
12/23 |
$21,478 |
$27,785 |
$21,228 |
01/24 |
$20,590 |
$28,093 |
$20,264 |
02/24 |
$21,478 |
$29,613 |
$20,927 |
03/24 |
$22,501 |
$30,569 |
$21,844 |
04/24 |
$21,478 |
$29,224 |
$20,452 |
05/24 |
$22,489 |
$30,604 |
$21,409 |
06/24 |
$21,964 |
$31,552 |
$21,048 |
07/24 |
$24,041 |
$32,138 |
$23,613 |
08/24 |
$23,774 |
$32,838 |
$23,170 |
09/24 |
$23,915 |
$33,517 |
$23,184 |
10/24 |
$23,859 |
$33,271 |
$22,822 |
11/24 |
$26,174 |
$35,484 |
$25,023 |
12/24 |
$23,995 |
$34,400 |
$22,938 |
01/25 |
$24,503 |
$35,486 |
$23,409 |
02/25 |
$23,422 |
$34,806 |
$22,513 |
03/25 |
$21,913 |
$32,775 |
$21,162 |
04/25 |
$21,055 |
$32,556 |
$20,312 |
05/25 |
$22,104 |
$34,619 |
$21,165 |
06/25 |
$23,188 |
$36,378 |
$22,213 |
07/25 |
$23,487 |
$37,179 |
$22,605 |
08/25 |
$25,426 |
$38,039 |
$24,520 |
09/25 |
$25,608 |
$39,352 |
$25,013 |
10/25 |
$25,277 |
$40,196 |
$25,075 |
11/25 |
$25,956 |
$40,306 |
$25,780 |
12/25 |
$26,001 |
$40,298 |
$25,827 |
01/26 |
$27,565 |
$40,923 |
$27,598 |
02/26 |
$28,356 |
$40,728 |
$28,130 |
|
| Average Annual Return [Table Text Block] |
|
Table Summary
Average Annual Total Returns (%) |
1 year |
5 years |
10 years |
Institutional 2 Class |
21.07 |
8.66 |
10.99 |
Russell 3000® Index |
17.02 |
12.80 |
15.08 |
Russell 2000® Value Index |
24.95 |
7.67 |
10.90 | |
| No Deduction of Taxes [Text Block] |
|
Performance does not reflect the deduction of taxes that a shareholder may pay on fund distributions or on the redemptions of fund shares.
|
| Material Change Date |
Sep. 01, 2025
|
|
| Updated Performance Information Location [Text Block] |
|
columbiathreadneedleus.com/investment-products/mutual-funds
|
| AssetsNet |
|
$ 826,343,737
|
| Holdings Count | Holding |
|
101
|
| Advisory Fees Paid, Amount |
|
$ 7,007,299
|
| InvestmentCompanyPortfolioTurnover |
|
115.00%
|
| Additional Fund Statistics [Text Block] |
|
Table Summary
Fund net assets |
$826,343,737 |
Total number of portfolio holdings |
101 |
Management services fees (represents 0.85% of Fund average net assets) |
$7,007,299 |
Portfolio turnover for the reporting period |
115% | |
| Holdings [Text Block] |
|
Table Summary
Financials |
19.7% |
Industrials |
15.6% |
Real Estate |
12.4% |
Consumer Discretionary |
12.1% |
Information Technology |
9.4% |
Energy |
9.3% |
Health Care |
7.0% |
Materials |
6.0% |
Consumer Staples |
4.1% |
Utilities |
2.6% |
Other |
0.9% |
Table Summary
Common Stocks |
99.1% |
Other |
0.6% | |
| Largest Holdings [Text Block] |
|
Table Summary
Phillips Edison & Co., Inc. |
2.1% |
BankUnited, Inc. |
1.8% |
California Resources Corp. |
1.8% |
StoneX Group, Inc. |
1.7% |
Essent Group Ltd. |
1.7% |
Texas Capital Bancshares, Inc. |
1.7% |
Fulton Financial Corp. |
1.6% |
Polaris, Inc. |
1.6% |
Amneal Pharmaceuticals, Inc. |
1.6% |
Taylor Morrison Home Corp., Class A |
1.5% | |
| Material Fund Change [Text Block] |
|
This is a summary of the changes to the Fund. For more complete information, you may review the Fund’s prospectus, which is available at columbiathreadneedleus.com/resources/literature or upon request at 1-800-345-6611. Effective September 1, 2025, the Fund's name was changed from Columbia Small Cap Value Fund II to Columbia Small Cap Value and Inflection Fund. |
| Material Fund Change Name [Text Block] |
|
Effective September 1, 2025, the Fund's name was changed from Columbia Small Cap Value Fund II to Columbia Small Cap Value and Inflection Fund.
|
| Summary of Change Legend [Text Block] |
|
This is a summary of the changes to the Fund. For more complete information, you may review the Fund’s prospectus, which is available at columbiathreadneedleus.com/resources/literature or upon request at 1-800-345-6611.
|
| Updated Prospectus Phone Number |
|
1-800-345-6611
|
| Updated Prospectus Web Address |
|
columbiathreadneedleus.com/resources/literature
|
| C000122580 |
|
|
| Shareholder Report [Line Items] |
|
|
| Fund Name |
|
Columbia Small Cap Value and Inflection Fund
|
| Class Name |
|
Institutional 3 Class
|
| Trading Symbol |
|
CRRYX
|
| Annual or Semi-Annual Statement [Text Block] |
|
This annual shareholder report contains important information about Columbia Small Cap Value and Inflection Fund (the Fund) for the period of March 1, 2025 to February 28, 2026.
|
| Additional Information [Text Block] |
|
You can find additional information about the Fund at columbiathreadneedleus.com/resources/literature. You can also request more information by contacting us at 1-800-345-6611.
|
| Material Fund Change Notice [Text Block] |
|
This report describes changes to the Fund that occurred during the reporting period.
|
| Additional Information Phone Number |
|
1-800-345-6611
|
| Additional Information Website |
|
columbiathreadneedleus.com/resources/literature
|
| Expenses [Text Block] |
|
What were the Fund costs for the reporting period? (Based on a hypothetical $10,000 investment)
Table Summary
Class |
Cost of a $10,000 investment |
Cost paid as a percentage of a $10,000 investment |
Institutional 3 Class |
$84 |
0.76% | |
| Expenses Paid, Amount |
|
$ 84
|
| Expense Ratio, Percent |
|
0.76%
|
| Factors Affecting Performance [Text Block] |
|
Management's Discussion of Fund Performance The performance of Institutional 3 Class shares for the period presented is shown in the Average Annual Total Returns table. Top Performance ContributorsStock selection | Selections in the financials, consumer staples and utilities sectors boosted the Fund’s relative performance during the annual period. Allocations | Smaller allocations to the financials and utilities sectors and a larger allocation to the information technology sector buoyed the Fund’s relative performance during the annual period. Individual holdings | Positions in MP Materials, a rare earths company; Modine Manufacturing, an HVAC company; Dycom Industries, a telecom infrastructure contractor; Amkor Technology, a semiconductor packaging and testing company; and an overweight to Victoria’s Secret, a specialty retailer, were top contributors to the Fund’s relative performance during the period. Top Performance DetractorsStock selection | Selections in the health care, materials and communication services sectors hurt the Fund’s relative performance during the annual period. Allocations | Smaller weightings in the communication services and energy sectors and a larger weighting in the consumer discretionary sector detracted from the Fund’s relative performance during the annual period. Individual holdings | Lack of ownership of EchoStar, a telecom company; Hecla Mining, a precious metals miner; and Coeur Mining, a precious metals miner, were top detractors from the Fund’s relative performance during the period. Positions in Alaska Air Group, an airline, and Cousins Properties, an office REIT, were also top detractors from the Fund’s relative performance during the period. |
| Performance Past Does Not Indicate Future [Text] |
|
The Fund's past performance is not a good predictor of the Fund's future performance.
|
| Line Graph [Table Text Block] |
|

Table Summary
|
Columbia Small Cap Value and Inflection Fund Institutional 3 Class ($28,492) |
Russell 3000® Index ($40,728) |
Russell 2000® Value Index ($28,130) |
02/16 |
$10,000 |
$10,000 |
$10,000 |
03/16 |
$10,762 |
$10,704 |
$10,829 |
04/16 |
$10,838 |
$10,770 |
$11,058 |
05/16 |
$11,010 |
$10,963 |
$11,261 |
06/16 |
$11,002 |
$10,986 |
$11,295 |
07/16 |
$11,558 |
$11,422 |
$11,905 |
08/16 |
$11,724 |
$11,451 |
$12,200 |
09/16 |
$11,808 |
$11,469 |
$12,297 |
10/16 |
$11,356 |
$11,221 |
$11,892 |
11/16 |
$12,877 |
$11,723 |
$13,471 |
12/16 |
$13,243 |
$11,952 |
$14,027 |
01/17 |
$13,338 |
$12,176 |
$13,927 |
02/17 |
$13,555 |
$12,629 |
$14,129 |
03/17 |
$13,345 |
$12,638 |
$14,009 |
04/17 |
$13,432 |
$12,772 |
$14,064 |
05/17 |
$13,084 |
$12,903 |
$13,626 |
06/17 |
$13,447 |
$13,019 |
$14,103 |
07/17 |
$13,547 |
$13,264 |
$14,192 |
08/17 |
$13,363 |
$13,290 |
$13,843 |
09/17 |
$14,234 |
$13,614 |
$14,823 |
10/17 |
$14,348 |
$13,911 |
$14,843 |
11/17 |
$14,738 |
$14,334 |
$15,272 |
12/17 |
$14,726 |
$14,477 |
$15,127 |
01/18 |
$14,965 |
$15,240 |
$15,313 |
02/18 |
$14,231 |
$14,678 |
$14,547 |
03/18 |
$14,335 |
$14,384 |
$14,727 |
04/18 |
$14,510 |
$14,438 |
$14,983 |
05/18 |
$15,101 |
$14,846 |
$15,854 |
06/18 |
$14,998 |
$14,943 |
$15,950 |
07/18 |
$15,300 |
$15,439 |
$16,232 |
08/18 |
$15,750 |
$15,981 |
$16,618 |
09/18 |
$15,194 |
$16,008 |
$16,206 |
10/18 |
$13,731 |
$14,829 |
$14,755 |
11/18 |
$13,968 |
$15,126 |
$14,993 |
12/18 |
$12,180 |
$13,718 |
$13,181 |
01/19 |
$13,639 |
$14,896 |
$14,622 |
02/19 |
$14,270 |
$15,419 |
$15,191 |
03/19 |
$13,846 |
$15,645 |
$14,753 |
04/19 |
$14,450 |
$16,269 |
$15,311 |
05/19 |
$13,288 |
$15,216 |
$14,060 |
06/19 |
$14,118 |
$16,285 |
$14,956 |
07/19 |
$14,099 |
$16,527 |
$14,980 |
08/19 |
$13,309 |
$16,190 |
$14,144 |
09/19 |
$13,722 |
$16,475 |
$14,870 |
10/19 |
$13,952 |
$16,829 |
$15,230 |
11/19 |
$14,274 |
$17,469 |
$15,587 |
12/19 |
$14,717 |
$17,973 |
$16,132 |
01/20 |
$14,080 |
$17,954 |
$15,262 |
02/20 |
$12,667 |
$16,484 |
$13,779 |
03/20 |
$9,474 |
$14,217 |
$10,380 |
04/20 |
$10,981 |
$16,100 |
$11,660 |
05/20 |
$11,562 |
$16,961 |
$11,995 |
06/20 |
$11,625 |
$17,349 |
$12,342 |
07/20 |
$12,001 |
$18,334 |
$12,596 |
08/20 |
$12,622 |
$19,662 |
$13,275 |
09/20 |
$12,105 |
$18,946 |
$12,657 |
10/20 |
$12,537 |
$18,537 |
$13,110 |
11/20 |
$15,048 |
$20,792 |
$15,641 |
12/20 |
$16,237 |
$21,728 |
$16,880 |
01/21 |
$17,088 |
$21,631 |
$17,768 |
02/21 |
$18,772 |
$22,307 |
$19,437 |
03/21 |
$19,548 |
$23,107 |
$20,453 |
04/21 |
$20,230 |
$24,298 |
$20,867 |
05/21 |
$20,741 |
$24,409 |
$21,516 |
06/21 |
$20,632 |
$25,010 |
$21,386 |
07/21 |
$19,924 |
$25,433 |
$20,620 |
08/21 |
$20,416 |
$26,159 |
$21,173 |
09/21 |
$20,337 |
$24,985 |
$20,748 |
10/21 |
$21,734 |
$26,675 |
$21,539 |
11/21 |
$21,173 |
$26,269 |
$20,804 |
12/21 |
$21,811 |
$27,303 |
$21,652 |
01/22 |
$20,562 |
$25,697 |
$20,390 |
02/22 |
$21,111 |
$25,049 |
$20,727 |
03/22 |
$21,229 |
$25,862 |
$21,133 |
04/22 |
$19,550 |
$23,541 |
$19,493 |
05/22 |
$20,013 |
$23,509 |
$19,867 |
06/22 |
$18,030 |
$21,543 |
$17,904 |
07/22 |
$19,567 |
$23,564 |
$19,638 |
08/22 |
$18,976 |
$22,684 |
$19,017 |
09/22 |
$17,172 |
$20,581 |
$17,079 |
10/22 |
$19,132 |
$22,269 |
$19,229 |
11/22 |
$20,168 |
$23,431 |
$19,816 |
12/22 |
$18,871 |
$22,059 |
$18,516 |
01/23 |
$20,350 |
$23,578 |
$20,283 |
02/23 |
$20,143 |
$23,027 |
$19,815 |
03/23 |
$19,077 |
$23,643 |
$18,395 |
04/23 |
$18,985 |
$23,895 |
$17,936 |
05/23 |
$18,366 |
$23,988 |
$17,583 |
06/23 |
$19,855 |
$25,626 |
$18,980 |
07/23 |
$21,025 |
$26,544 |
$20,412 |
08/23 |
$20,186 |
$26,032 |
$19,430 |
09/23 |
$19,099 |
$24,792 |
$18,418 |
10/23 |
$18,094 |
$24,135 |
$17,319 |
11/23 |
$19,560 |
$26,385 |
$18,878 |
12/23 |
$21,561 |
$27,785 |
$21,228 |
01/24 |
$20,674 |
$28,093 |
$20,264 |
02/24 |
$21,561 |
$29,613 |
$20,927 |
03/24 |
$22,596 |
$30,569 |
$21,844 |
04/24 |
$21,573 |
$29,224 |
$20,452 |
05/24 |
$22,583 |
$30,604 |
$21,409 |
06/24 |
$22,060 |
$31,552 |
$21,048 |
07/24 |
$24,149 |
$32,138 |
$23,613 |
08/24 |
$23,868 |
$32,838 |
$23,170 |
09/24 |
$24,009 |
$33,517 |
$23,184 |
10/24 |
$23,967 |
$33,271 |
$22,822 |
11/24 |
$26,279 |
$35,484 |
$25,023 |
12/24 |
$24,097 |
$34,400 |
$22,938 |
01/25 |
$24,604 |
$35,486 |
$23,409 |
02/25 |
$23,526 |
$34,806 |
$22,513 |
03/25 |
$22,003 |
$32,775 |
$21,162 |
04/25 |
$21,146 |
$32,556 |
$20,312 |
05/25 |
$22,209 |
$34,619 |
$21,165 |
06/25 |
$23,308 |
$36,378 |
$22,213 |
07/25 |
$23,589 |
$37,179 |
$22,605 |
08/25 |
$25,541 |
$38,039 |
$24,520 |
09/25 |
$25,723 |
$39,352 |
$25,013 |
10/25 |
$25,393 |
$40,196 |
$25,075 |
11/25 |
$26,087 |
$40,306 |
$25,780 |
12/25 |
$26,123 |
$40,298 |
$25,827 |
01/26 |
$27,702 |
$40,923 |
$27,598 |
02/26 |
$28,492 |
$40,728 |
$28,130 |
|
| Average Annual Return [Table Text Block] |
|
Table Summary
Average Annual Total Returns (%) |
1 year |
5 years |
10 years |
Institutional 3 Class |
21.11 |
8.70 |
11.04 |
Russell 3000® Index |
17.02 |
12.80 |
15.08 |
Russell 2000® Value Index |
24.95 |
7.67 |
10.90 | |
| No Deduction of Taxes [Text Block] |
|
Performance does not reflect the deduction of taxes that a shareholder may pay on fund distributions or on the redemptions of fund shares.
|
| Material Change Date |
Sep. 01, 2025
|
|
| Updated Performance Information Location [Text Block] |
|
columbiathreadneedleus.com/investment-products/mutual-funds
|
| AssetsNet |
|
$ 826,343,737
|
| Holdings Count | Holding |
|
101
|
| Advisory Fees Paid, Amount |
|
$ 7,007,299
|
| InvestmentCompanyPortfolioTurnover |
|
115.00%
|
| Additional Fund Statistics [Text Block] |
|
Table Summary
Fund net assets |
$826,343,737 |
Total number of portfolio holdings |
101 |
Management services fees (represents 0.85% of Fund average net assets) |
$7,007,299 |
Portfolio turnover for the reporting period |
115% | |
| Holdings [Text Block] |
|
Table Summary
Financials |
19.7% |
Industrials |
15.6% |
Real Estate |
12.4% |
Consumer Discretionary |
12.1% |
Information Technology |
9.4% |
Energy |
9.3% |
Health Care |
7.0% |
Materials |
6.0% |
Consumer Staples |
4.1% |
Utilities |
2.6% |
Other |
0.9% |
Table Summary
Common Stocks |
99.1% |
Other |
0.6% | |
| Largest Holdings [Text Block] |
|
Table Summary
Phillips Edison & Co., Inc. |
2.1% |
BankUnited, Inc. |
1.8% |
California Resources Corp. |
1.8% |
StoneX Group, Inc. |
1.7% |
Essent Group Ltd. |
1.7% |
Texas Capital Bancshares, Inc. |
1.7% |
Fulton Financial Corp. |
1.6% |
Polaris, Inc. |
1.6% |
Amneal Pharmaceuticals, Inc. |
1.6% |
Taylor Morrison Home Corp., Class A |
1.5% | |
| Material Fund Change [Text Block] |
|
This is a summary of the changes to the Fund. For more complete information, you may review the Fund’s prospectus, which is available at columbiathreadneedleus.com/resources/literature or upon request at 1-800-345-6611. Effective September 1, 2025, the Fund's name was changed from Columbia Small Cap Value Fund II to Columbia Small Cap Value and Inflection Fund. |
| Material Fund Change Name [Text Block] |
|
Effective September 1, 2025, the Fund's name was changed from Columbia Small Cap Value Fund II to Columbia Small Cap Value and Inflection Fund.
|
| Summary of Change Legend [Text Block] |
|
This is a summary of the changes to the Fund. For more complete information, you may review the Fund’s prospectus, which is available at columbiathreadneedleus.com/resources/literature or upon request at 1-800-345-6611.
|
| Updated Prospectus Phone Number |
|
1-800-345-6611
|
| Updated Prospectus Web Address |
|
columbiathreadneedleus.com/resources/literature
|
| C000029859 |
|
|
| Shareholder Report [Line Items] |
|
|
| Fund Name |
|
Columbia Small Cap Value and Inflection Fund
|
| Class Name |
|
Institutional Class
|
| Trading Symbol |
|
NSVAX
|
| Annual or Semi-Annual Statement [Text Block] |
|
This annual shareholder report contains important information about Columbia Small Cap Value and Inflection Fund (the Fund) for the period of March 1, 2025 to February 28, 2026.
|
| Additional Information [Text Block] |
|
You can find additional information about the Fund at columbiathreadneedleus.com/resources/literature. You can also request more information by contacting us at 1-800-345-6611.
|
| Material Fund Change Notice [Text Block] |
|
This report describes changes to the Fund that occurred during the reporting period.
|
| Additional Information Phone Number |
|
1-800-345-6611
|
| Additional Information Website |
|
columbiathreadneedleus.com/resources/literature
|
| Expenses [Text Block] |
|
What were the Fund costs for the reporting period? (Based on a hypothetical $10,000 investment)
Table Summary
Class |
Cost of a $10,000 investment |
Cost paid as a percentage of a $10,000 investment |
Institutional Class |
$105 |
0.95% | |
| Expenses Paid, Amount |
|
$ 105
|
| Expense Ratio, Percent |
|
0.95%
|
| Factors Affecting Performance [Text Block] |
|
Management's Discussion of Fund Performance The performance of Institutional Class shares for the period presented is shown in the Average Annual Total Returns table. Top Performance ContributorsStock selection | Selections in the financials, consumer staples and utilities sectors boosted the Fund’s relative performance during the annual period. Allocations | Smaller allocations to the financials and utilities sectors and a larger allocation to the information technology sector buoyed the Fund’s relative performance during the annual period. Individual holdings | Positions in MP Materials, a rare earths company; Modine Manufacturing, an HVAC company; Dycom Industries, a telecom infrastructure contractor; Amkor Technology, a semiconductor packaging and testing company; and an overweight to Victoria’s Secret, a specialty retailer, were top contributors to the Fund’s relative performance during the period. Top Performance DetractorsStock selection | Selections in the health care, materials and communication services sectors hurt the Fund’s relative performance during the annual period. Allocations | Smaller weightings in the communication services and energy sectors and a larger weighting in the consumer discretionary sector detracted from the Fund’s relative performance during the annual period. Individual holdings | Lack of ownership of EchoStar, a telecom company; Hecla Mining, a precious metals miner; and Coeur Mining, a precious metals miner, were top detractors from the Fund’s relative performance during the period. Positions in Alaska Air Group, an airline, and Cousins Properties, an office REIT, were also top detractors from the Fund’s relative performance during the period. |
| Performance Past Does Not Indicate Future [Text] |
|
The Fund's past performance is not a good predictor of the Fund's future performance.
|
| Line Graph [Table Text Block] |
|
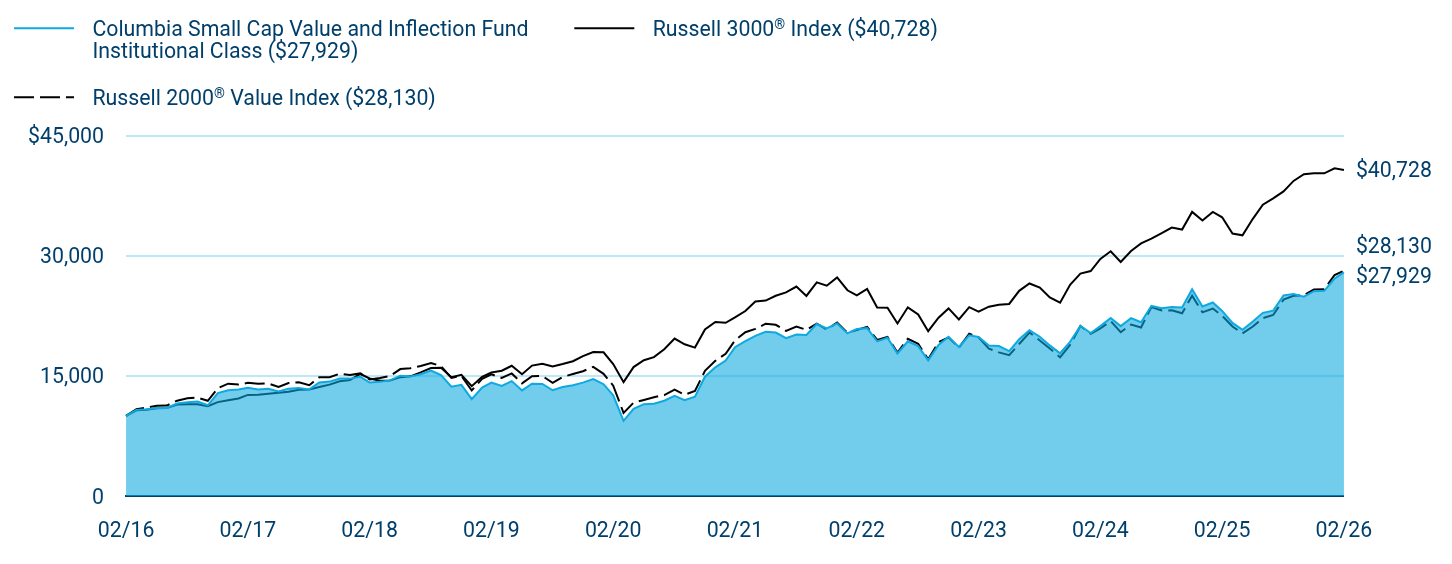
Table Summary
|
Columbia Small Cap Value and Inflection Fund Institutional Class ($27,929) |
Russell 3000® Index ($40,728) |
Russell 2000® Value Index ($28,130) |
02/16 |
$10,000 |
$10,000 |
$10,000 |
03/16 |
$10,758 |
$10,704 |
$10,829 |
04/16 |
$10,828 |
$10,770 |
$11,058 |
05/16 |
$10,996 |
$10,963 |
$11,261 |
06/16 |
$10,986 |
$10,986 |
$11,295 |
07/16 |
$11,546 |
$11,422 |
$11,905 |
08/16 |
$11,709 |
$11,451 |
$12,200 |
09/16 |
$11,787 |
$11,469 |
$12,297 |
10/16 |
$11,333 |
$11,221 |
$11,892 |
11/16 |
$12,858 |
$11,723 |
$13,471 |
12/16 |
$13,214 |
$11,952 |
$14,027 |
01/17 |
$13,303 |
$12,176 |
$13,927 |
02/17 |
$13,526 |
$12,629 |
$14,129 |
03/17 |
$13,311 |
$12,638 |
$14,009 |
04/17 |
$13,400 |
$12,772 |
$14,064 |
05/17 |
$13,044 |
$12,903 |
$13,626 |
06/17 |
$13,408 |
$13,019 |
$14,103 |
07/17 |
$13,502 |
$13,264 |
$14,192 |
08/17 |
$13,314 |
$13,290 |
$13,843 |
09/17 |
$14,181 |
$13,614 |
$14,823 |
10/17 |
$14,290 |
$13,911 |
$14,843 |
11/17 |
$14,681 |
$14,334 |
$15,272 |
12/17 |
$14,660 |
$14,477 |
$15,127 |
01/18 |
$14,897 |
$15,240 |
$15,313 |
02/18 |
$14,163 |
$14,678 |
$14,547 |
03/18 |
$14,261 |
$14,384 |
$14,727 |
04/18 |
$14,440 |
$14,438 |
$14,983 |
05/18 |
$15,027 |
$14,846 |
$15,854 |
06/18 |
$14,914 |
$14,943 |
$15,950 |
07/18 |
$15,215 |
$15,439 |
$16,232 |
08/18 |
$15,666 |
$15,981 |
$16,618 |
09/18 |
$15,106 |
$16,008 |
$16,206 |
10/18 |
$13,651 |
$14,829 |
$14,755 |
11/18 |
$13,885 |
$15,126 |
$14,993 |
12/18 |
$12,100 |
$13,718 |
$13,181 |
01/19 |
$13,548 |
$14,896 |
$14,622 |
02/19 |
$14,176 |
$15,419 |
$15,191 |
03/19 |
$13,751 |
$15,645 |
$14,753 |
04/19 |
$14,351 |
$16,269 |
$15,311 |
05/19 |
$13,189 |
$15,216 |
$14,060 |
06/19 |
$14,016 |
$16,285 |
$14,956 |
07/19 |
$13,997 |
$16,527 |
$14,980 |
08/19 |
$13,206 |
$16,190 |
$14,144 |
09/19 |
$13,620 |
$16,475 |
$14,870 |
10/19 |
$13,837 |
$16,829 |
$15,230 |
11/19 |
$14,157 |
$17,469 |
$15,587 |
12/19 |
$14,595 |
$17,973 |
$16,132 |
01/20 |
$13,963 |
$17,954 |
$15,262 |
02/20 |
$12,565 |
$16,484 |
$13,779 |
03/20 |
$9,395 |
$14,217 |
$10,380 |
04/20 |
$10,889 |
$16,100 |
$11,660 |
05/20 |
$11,464 |
$16,961 |
$11,995 |
06/20 |
$11,518 |
$17,349 |
$12,342 |
07/20 |
$11,894 |
$18,334 |
$12,596 |
08/20 |
$12,500 |
$19,662 |
$13,275 |
09/20 |
$11,980 |
$18,946 |
$12,657 |
10/20 |
$12,413 |
$18,537 |
$13,110 |
11/20 |
$14,896 |
$20,792 |
$15,641 |
12/20 |
$16,072 |
$21,728 |
$16,880 |
01/21 |
$16,913 |
$21,631 |
$17,768 |
02/21 |
$18,577 |
$22,307 |
$19,437 |
03/21 |
$19,340 |
$23,107 |
$20,453 |
04/21 |
$20,008 |
$24,298 |
$20,867 |
05/21 |
$20,520 |
$24,409 |
$21,516 |
06/21 |
$20,410 |
$25,010 |
$21,386 |
07/21 |
$19,705 |
$25,433 |
$20,620 |
08/21 |
$20,178 |
$26,159 |
$21,173 |
09/21 |
$20,108 |
$24,985 |
$20,748 |
10/21 |
$21,486 |
$26,675 |
$21,539 |
11/21 |
$20,923 |
$26,269 |
$20,804 |
12/21 |
$21,550 |
$27,303 |
$21,652 |
01/22 |
$20,314 |
$25,697 |
$20,390 |
02/22 |
$20,855 |
$25,049 |
$20,727 |
03/22 |
$20,966 |
$25,862 |
$21,133 |
04/22 |
$19,310 |
$23,541 |
$19,493 |
05/22 |
$19,763 |
$23,509 |
$19,867 |
06/22 |
$17,796 |
$21,543 |
$17,904 |
07/22 |
$19,316 |
$23,564 |
$19,638 |
08/22 |
$18,722 |
$22,684 |
$19,017 |
09/22 |
$16,939 |
$20,581 |
$17,079 |
10/22 |
$18,870 |
$22,269 |
$19,229 |
11/22 |
$19,888 |
$23,431 |
$19,816 |
12/22 |
$18,605 |
$22,059 |
$18,516 |
01/23 |
$20,064 |
$23,578 |
$20,283 |
02/23 |
$19,852 |
$23,027 |
$19,815 |
03/23 |
$18,805 |
$23,643 |
$18,395 |
04/23 |
$18,723 |
$23,895 |
$17,936 |
05/23 |
$18,100 |
$23,988 |
$17,583 |
06/23 |
$19,574 |
$25,626 |
$18,980 |
07/23 |
$20,715 |
$26,544 |
$20,412 |
08/23 |
$19,890 |
$26,032 |
$19,430 |
09/23 |
$18,810 |
$24,792 |
$18,418 |
10/23 |
$17,827 |
$24,135 |
$17,319 |
11/23 |
$19,259 |
$26,385 |
$18,878 |
12/23 |
$21,229 |
$27,785 |
$21,228 |
01/24 |
$20,343 |
$28,093 |
$20,264 |
02/24 |
$21,216 |
$29,613 |
$20,927 |
03/24 |
$22,241 |
$30,569 |
$21,844 |
04/24 |
$21,216 |
$29,224 |
$20,452 |
05/24 |
$22,216 |
$30,604 |
$21,409 |
06/24 |
$21,697 |
$31,552 |
$21,048 |
07/24 |
$23,738 |
$32,138 |
$23,613 |
08/24 |
$23,463 |
$32,838 |
$23,170 |
09/24 |
$23,607 |
$33,517 |
$23,184 |
10/24 |
$23,550 |
$33,271 |
$22,822 |
11/24 |
$25,822 |
$35,484 |
$25,023 |
12/24 |
$23,675 |
$34,400 |
$22,938 |
01/25 |
$24,169 |
$35,486 |
$23,409 |
02/25 |
$23,116 |
$34,806 |
$22,513 |
03/25 |
$21,617 |
$32,775 |
$21,162 |
04/25 |
$20,761 |
$32,556 |
$20,312 |
05/25 |
$21,798 |
$34,619 |
$21,165 |
06/25 |
$22,873 |
$36,378 |
$22,213 |
07/25 |
$23,149 |
$37,179 |
$22,605 |
08/25 |
$25,059 |
$38,039 |
$24,520 |
09/25 |
$25,231 |
$39,352 |
$25,013 |
10/25 |
$24,904 |
$40,196 |
$25,075 |
11/25 |
$25,576 |
$40,306 |
$25,780 |
12/25 |
$25,626 |
$40,298 |
$25,827 |
01/26 |
$27,161 |
$40,923 |
$27,598 |
02/26 |
$27,929 |
$40,728 |
$28,130 |
|
| Average Annual Return [Table Text Block] |
|
Table Summary
Average Annual Total Returns (%) |
1 year |
5 years |
10 years |
Institutional Class |
20.82 |
8.50 |
10.82 |
Russell 3000® Index |
17.02 |
12.80 |
15.08 |
Russell 2000® Value Index |
24.95 |
7.67 |
10.90 | |
| No Deduction of Taxes [Text Block] |
|
Performance does not reflect the deduction of taxes that a shareholder may pay on fund distributions or on the redemptions of fund shares.
|
| Material Change Date |
Sep. 01, 2025
|
|
| Updated Performance Information Location [Text Block] |
|
columbiathreadneedleus.com/investment-products/mutual-funds
|
| AssetsNet |
|
$ 826,343,737
|
| Holdings Count | Holding |
|
101
|
| Advisory Fees Paid, Amount |
|
$ 7,007,299
|
| InvestmentCompanyPortfolioTurnover |
|
115.00%
|
| Additional Fund Statistics [Text Block] |
|
Table Summary
Fund net assets |
$826,343,737 |
Total number of portfolio holdings |
101 |
Management services fees (represents 0.85% of Fund average net assets) |
$7,007,299 |
Portfolio turnover for the reporting period |
115% | |
| Holdings [Text Block] |
|
Table Summary
Financials |
19.7% |
Industrials |
15.6% |
Real Estate |
12.4% |
Consumer Discretionary |
12.1% |
Information Technology |
9.4% |
Energy |
9.3% |
Health Care |
7.0% |
Materials |
6.0% |
Consumer Staples |
4.1% |
Utilities |
2.6% |
Other |
0.9% |
Table Summary
Common Stocks |
99.1% |
Other |
0.6% | |
| Largest Holdings [Text Block] |
|
Table Summary
Phillips Edison & Co., Inc. |
2.1% |
BankUnited, Inc. |
1.8% |
California Resources Corp. |
1.8% |
StoneX Group, Inc. |
1.7% |
Essent Group Ltd. |
1.7% |
Texas Capital Bancshares, Inc. |
1.7% |
Fulton Financial Corp. |
1.6% |
Polaris, Inc. |
1.6% |
Amneal Pharmaceuticals, Inc. |
1.6% |
Taylor Morrison Home Corp., Class A |
1.5% | |
| Material Fund Change [Text Block] |
|
This is a summary of the changes to the Fund. For more complete information, you may review the Fund’s prospectus, which is available at columbiathreadneedleus.com/resources/literature or upon request at 1-800-345-6611. Effective September 1, 2025, the Fund's name was changed from Columbia Small Cap Value Fund II to Columbia Small Cap Value and Inflection Fund. |
| Material Fund Change Name [Text Block] |
|
Effective September 1, 2025, the Fund's name was changed from Columbia Small Cap Value Fund II to Columbia Small Cap Value and Inflection Fund.
|
| Summary of Change Legend [Text Block] |
|
This is a summary of the changes to the Fund. For more complete information, you may review the Fund’s prospectus, which is available at columbiathreadneedleus.com/resources/literature or upon request at 1-800-345-6611.
|
| Updated Prospectus Phone Number |
|
1-800-345-6611
|
| Updated Prospectus Web Address |
|
columbiathreadneedleus.com/resources/literature
|