Pay vs Performance Disclosure - USD ($)
Apr. 08, 2021
Jan. 29, 2022
Jan. 31, 2026
Feb. 01, 2025
Feb. 03, 2024
Jan. 28, 2023
Jan. 29, 2022
Pay versus performance
The information below presents the relationship between the compensation of the company’s named executive officer and certain performance measures in accordance with Item 402(v) of Regulation S-K (“Pay Versus Performance Table”). For a discussion of the company’s compensation programs and pay for performance philosophy, please refer to the section captioned “Compensation Discussion and Analysis,” above.
Pay Versus Performance Table
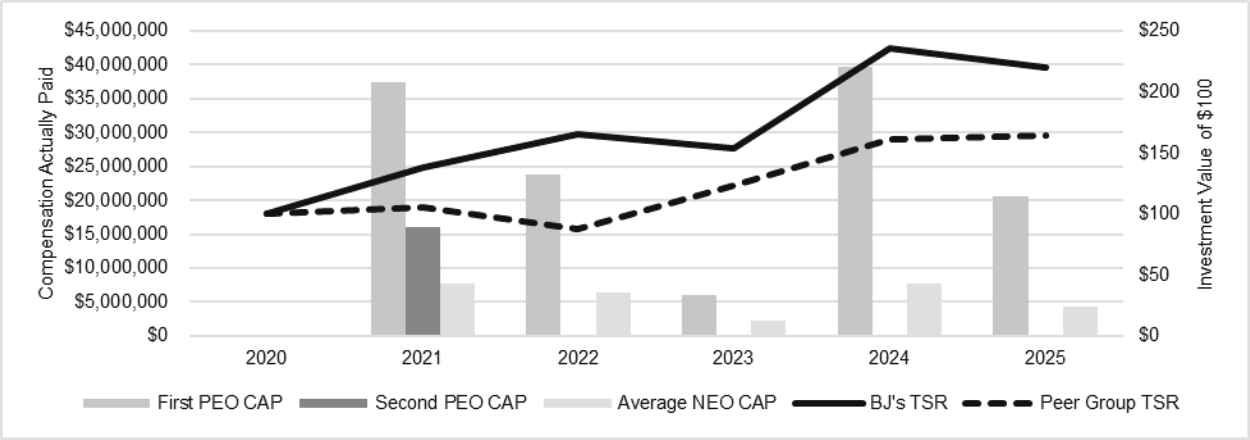
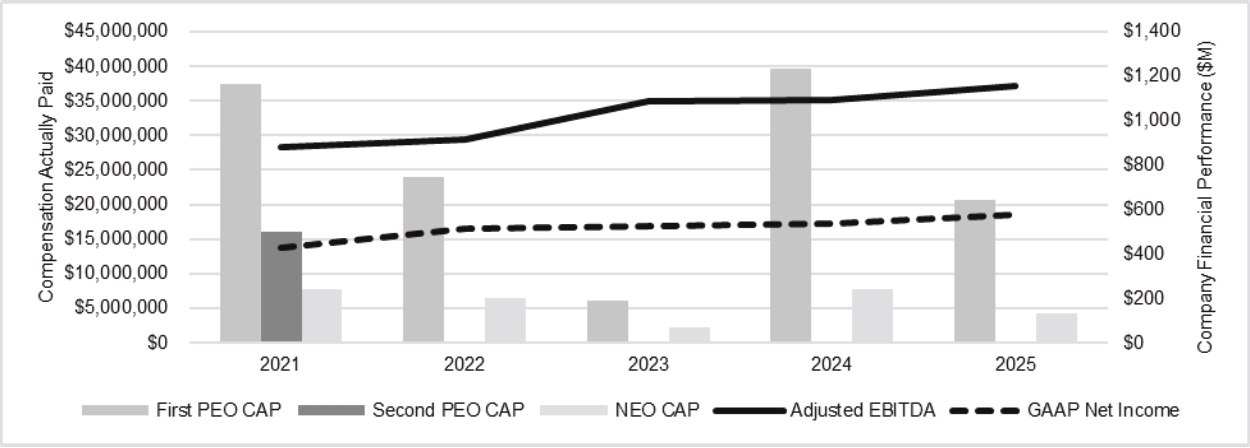
The information below presents the relationship between compensation actually paid (“CAP”) of the company’s NEOs and certain performance measures in accordance with Item 402(v) of Regulation S-K.
Year | Summary Compensation Table total for first Principal Executive Officer (“PEO”) ($)1 | Compensation actually paid to first PEO ($)2 | Summary Compensation Table total for second PEO ($)1 | Compensation actually paid to second PEO ($)2 | Average Summary Compensation Table total for non-PEO NEOs ($)1 | Average compensation actually paid to Non-PEO NEOs ($)2 | Value of initial fixed $100 investment based on: | Net income (millions) ($) | Adjusted EBITDA (millions) ($)4 | |||
Total shareholder return ($) | Peer group total shareholder return ($)3 | |||||||||||
(a) | (b) | (c) | (b) | (c) | (d) | (e) | (f) | (g) | (h) | (i) | ||
2025 | 16,678,036 | 20,650,215 | — | — | 3,876,570 | 4,239,801 | 219.73 | 164.12 | 578 | 1,158 | ||||||||||||||||||||||
2024 | 13,608,152 | 39,628,190 | — | — | 3,160,495 | 7,723,158 | 235.44 | 161.20 | 534 | 1,091 | ||||||||||||||||||||||
2023 | 10,858,552 | 6,059,860 | — | — | 3,021,845 | 2,293,990 | 153.34 | 123.16 | 524 | 1,088 | ||||||||||||||||||||||
2022 | 12,249,164 | 23,888,302 | — | — | 3,548,597 | 6,422,497 | 165.68 | 87.69 | 513 | 914 | ||||||||||||||||||||||
2021 | 16,340,546 | 37,445,973 | 21,626,020 | 15,984,701 | 3,681,469 | 7,736,013 | 137.70 | 105.90 | 427 | 880 | ||||||||||||||||||||||
(1) | For 2025, 2024, 2023, and 2022, the PEO is Mr. Eddy. For 2021, the first PEO is Mr. Eddy, who was appointed as president and chief executive officer on April 19, 2021. The second PEO is Mr. Delaney, who served as our PEO in 2021 until he passed away unexpectedly on April 8, 2021. Our non-PEO NEOs for the covered years are as follows: |
2021 | 2022 | 2023 | 2024 | 2025 |
Laura Felice | Laura Felice | Laura Felice | Laura Felice | Laura Felice | ||||||||||
Paul Cichocki | Paul Cichocki | Paul Cichocki | Paul Cichocki | Paul Cichocki | ||||||||||
Jeff Desroches | Jeff Desroches | Jeff Desroches | Jeff Desroches | Bill Werner | ||||||||||
Bill Werner | Scott Kessler | Bill Werner | Bill Werner | Tim Morningstar | ||||||||||
Graham Luce | ||||||||||||||
(2) | The following adjustments relating to equity awards were made to total compensation for each year to determine CAP as computed in accordance with Item 402(v) of Regulation S-K: |
Year | Summary Compensation Table total ($) | Total equity award Adjustments ($) | Compensation actually paid ($) |
First PEO (Mr. Eddy) | |||||||||||
2025 | 16,678,036 | 3,972,179 | 20,650,215 | ||||||||
Non-PEO NEOs | |||||||||||
2025 | 3,876,570 | 363,232 | 4,239,801 | ||||||||
The total equity award adjustments for each applicable fiscal year are detailed below:
Year | Value of equity awards disclosed in the Summary Compensation Table ($) | Year end fair value of equity awards granted in the year and unvested ($) | Year-over-year change in fair value of outstanding and unvested equity awards ($) | Fair value as of vesting date of equity awards granted and vested in year ($) | Year-over-year change in fair value of equity awards granted in prior years that vested in the applicable year ($) | Fair value at the end of the prior year of equity awards that failed to meet vesting conditions in the year ($) | Total equity award adjustments ($) |
First PEO (Mr. Eddy) | |||||||||||||||||||||||
2025 | (12,499,863) | 16,093,157 | (3,425,843) | 0 | 3,804,729 | 0 | 3,972,179 | ||||||||||||||||
Non-PEO NEOs | |||||||||||||||||||||||
2025 | (2,293,637) | 2,768,416 | (621,528) | 0 | 509,980 | 0 | 363,232 | ||||||||||||||||
The valuation methodologies used to calculate fair values for each measurement date do not materially differ from those used at the time of grant of each respective award.
(3) | Represents total shareholder return for the S&P 500 Retail Index. |
(4) | Represents Adjusted EBITDA, which is defined in the Compensation Discussion and Analysis section of this Proxy Statement. |
(1) | For 2025, 2024, 2023, and 2022, the PEO is Mr. Eddy. For 2021, the first PEO is Mr. Eddy, who was appointed as president and chief executive officer on April 19, 2021. The second PEO is Mr. Delaney, who served as our PEO in 2021 until he passed away unexpectedly on April 8, 2021. Our non-PEO NEOs for the covered years are as follows: |
2021 | 2022 | 2023 | 2024 | 2025 |
Laura Felice | Laura Felice | Laura Felice | Laura Felice | Laura Felice | ||||||||||
Paul Cichocki | Paul Cichocki | Paul Cichocki | Paul Cichocki | Paul Cichocki | ||||||||||
Jeff Desroches | Jeff Desroches | Jeff Desroches | Jeff Desroches | Bill Werner | ||||||||||
Bill Werner | Scott Kessler | Bill Werner | Bill Werner | Tim Morningstar | ||||||||||
Graham Luce | ||||||||||||||
(3) | Represents total shareholder return for the S&P 500 Retail Index. |
(2) | The following adjustments relating to equity awards were made to total compensation for each year to determine CAP as computed in accordance with Item 402(v) of Regulation S-K: |
Year | Summary Compensation Table total ($) | Total equity award Adjustments ($) | Compensation actually paid ($) |
First PEO (Mr. Eddy) | |||||||||||
2025 | 16,678,036 | 3,972,179 | 20,650,215 | ||||||||
Non-PEO NEOs | |||||||||||
2025 | 3,876,570 | 363,232 | 4,239,801 | ||||||||
The total equity award adjustments for each applicable fiscal year are detailed below:
Year | Value of equity awards disclosed in the Summary Compensation Table ($) | Year end fair value of equity awards granted in the year and unvested ($) | Year-over-year change in fair value of outstanding and unvested equity awards ($) | Fair value as of vesting date of equity awards granted and vested in year ($) | Year-over-year change in fair value of equity awards granted in prior years that vested in the applicable year ($) | Fair value at the end of the prior year of equity awards that failed to meet vesting conditions in the year ($) | Total equity award adjustments ($) |
First PEO (Mr. Eddy) | |||||||||||||||||||||||
2025 | (12,499,863) | 16,093,157 | (3,425,843) | 0 | 3,804,729 | 0 | 3,972,179 | ||||||||||||||||
Non-PEO NEOs | |||||||||||||||||||||||
2025 | (2,293,637) | 2,768,416 | (621,528) | 0 | 509,980 | 0 | 363,232 | ||||||||||||||||
The valuation methodologies used to calculate fair values for each measurement date do not materially differ from those used at the time of grant of each respective award.
Tabular list of performance measures
The following table lists the financial performance measures that the company considers to be the most important financial performance measures used by the company to link compensation actually paid to its NEOs for the most recently completed fiscal year to performance of the company.
Adjusted EBITDA | ||
Comparable club sales | ||
Adjusted EPS | ||
Membership Growth & Retention | ||
The total equity award adjustments for each applicable fiscal year are detailed below:
Year | Value of equity awards disclosed in the Summary Compensation Table ($) | Year end fair value of equity awards granted in the year and unvested ($) | Year-over-year change in fair value of outstanding and unvested equity awards ($) | Fair value as of vesting date of equity awards granted and vested in year ($) | Year-over-year change in fair value of equity awards granted in prior years that vested in the applicable year ($) | Fair value at the end of the prior year of equity awards that failed to meet vesting conditions in the year ($) | Total equity award adjustments ($) |
First PEO (Mr. Eddy) | |||||||||||||||||||||||
2025 | (12,499,863) | 16,093,157 | (3,425,843) | 0 | 3,804,729 | 0 | 3,972,179 | ||||||||||||||||
Non-PEO NEOs | |||||||||||||||||||||||
2025 | (2,293,637) | 2,768,416 | (621,528) | 0 | 509,980 | 0 | 363,232 | ||||||||||||||||
The valuation methodologies used to calculate fair values for each measurement date do not materially differ from those used at the time of grant of each respective award.