
Exhibit 99.3
AAR CORP. Segment Realignment May 6, 2026
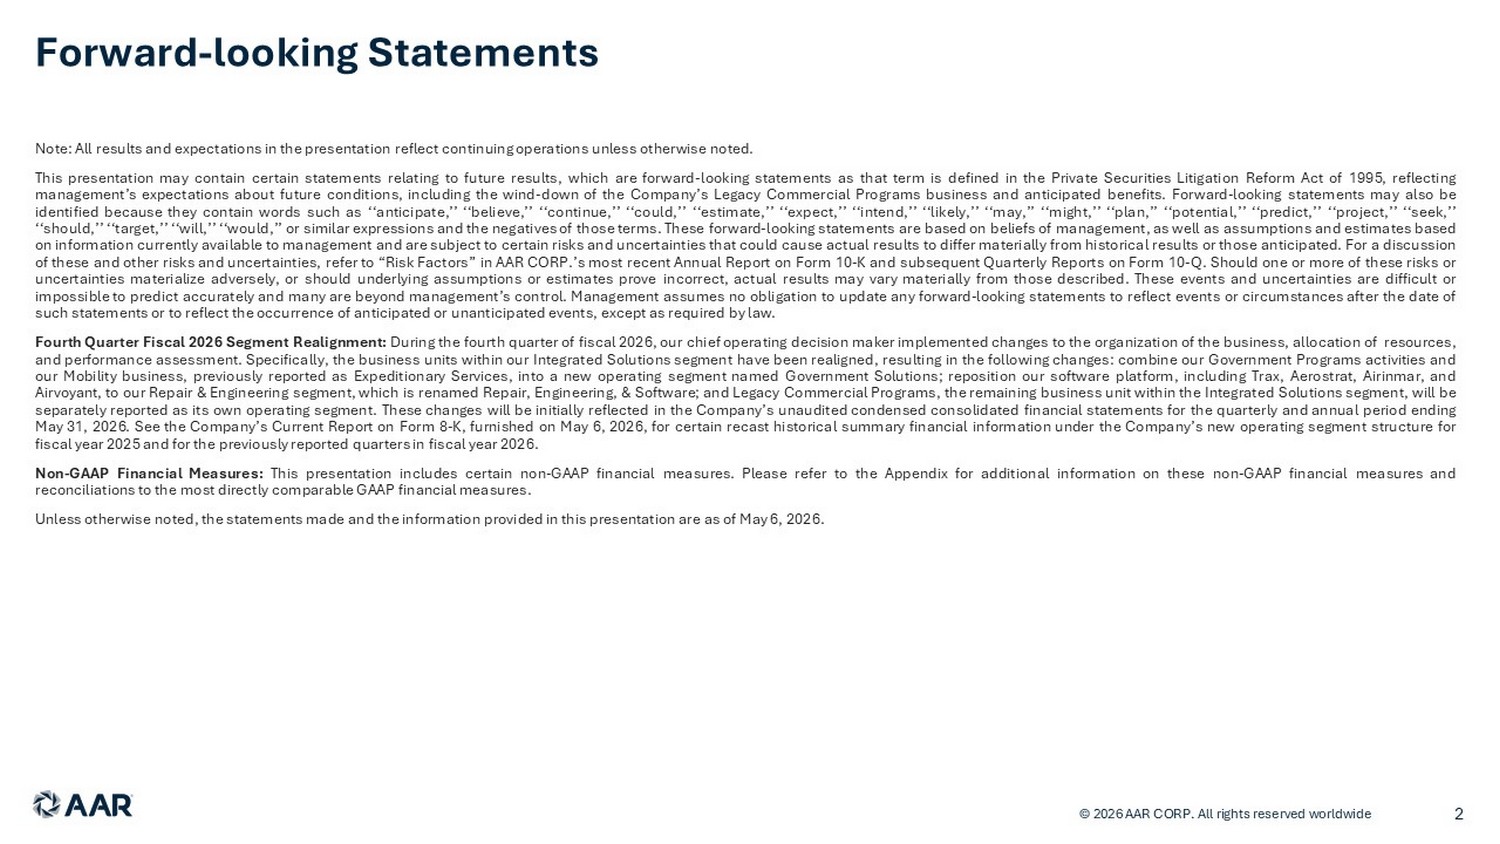
Note : All results and expectations in the presentation reflect continuing operations unless otherwise noted . This presentation may contain certain statements relating to future results, which are forward - looking statements as that term is defined in the Private Securities Litigation Reform Act of 1995 , reflecting management’s expectations about future conditions, including the wind - down of the Company’s Legacy Commercial Programs business and anticipated benefits . Forward - looking statements may also be identified because they contain words such as ‘‘anticipate,’’ ‘‘believe,’’ ‘‘continue,’’ ‘‘could,’’ ‘‘estimate,’’ ‘‘expect,’’ ‘‘intend,’’ ‘‘likely,’’ ‘‘may,’’ ‘‘might,’’ ‘‘plan,’’ ‘‘potential,’’ ‘‘predict,’’ ‘‘project,’’ ‘‘seek,’’ ‘‘should,’’ ‘‘target,’’ ‘‘will,’’ ‘‘would,’’ or similar expressions and the negatives of those terms . These forward - looking statements are based on beliefs of management, as well as assumptions and estimates based on information currently available to management and are subject to certain risks and uncertainties that could cause actual results to differ materially from historical results or those anticipated . For a discussion of these and other risks and uncertainties, refer to “Risk Factors” in AAR CORP . ’s most recent Annual Report on Form 10 - K and subsequent Quarterly Reports on Form 10 - Q . Should one or more of these risks or uncertainties materialize adversely, or should underlying assumptions or estimates prove incorrect, actual results may vary materially from those described . These events and uncertainties are difficult or impossible to predict accurately and many are beyond management’s control . Management assumes no obligation to update any forward - looking statements to reflect events or circumstances after the date of such statements or to reflect the occurrence of anticipated or unanticipated events, except as required by law . Fourth Quarter Fiscal 2026 Segment Realignment : During the fourth quarter of fiscal 2026 , our chief operating decision maker implemented changes to the organization of the business, allocation of resources, and performance assessment . Specifically, the business units within our Integrated Solutions segment have been realigned, resulting in the following changes : combine our Government Programs activities and our Mobility business, previously reported as Expeditionary Services, into a new operating segment named Government Solutions ; reposition our software platform, including Trax, Aerostrat , Airnmar , and Airvoyant , to our Repair & Engineering segment, which is renamed Repair, Engineering, & Software ; and Legacy Commercial Programs, the remaining business unit within the Integrated Solutions segment, will be separately reported as its own operating segment . These changes will be initially reflected in the Company’s unaudited condensed consolidated financial statements for the quarterly and annual period ending May 31 , 2026 . See the Company’s Current Report on Form 8 - K, furnished on May 6 , 2026 , for certain recast historical summary financial information under the Company’s new operating segment structure for fiscal year 2025 and for the previously reported quarters in fiscal year 2026 . Non - GAAP Financial Measures : This presentation includes certain non - GAAP financial measures . Please refer to the Appendix for additional information on these non - GAAP financial measures and reconciliations to the most directly comparable GAAP financial measures . Unless otherwise noted, the statements made and the information provided in this presentation are as of May 6 , 2026 . Forward - looking Statements © 2026 AAR CORP. All rights reserved worldwide 2
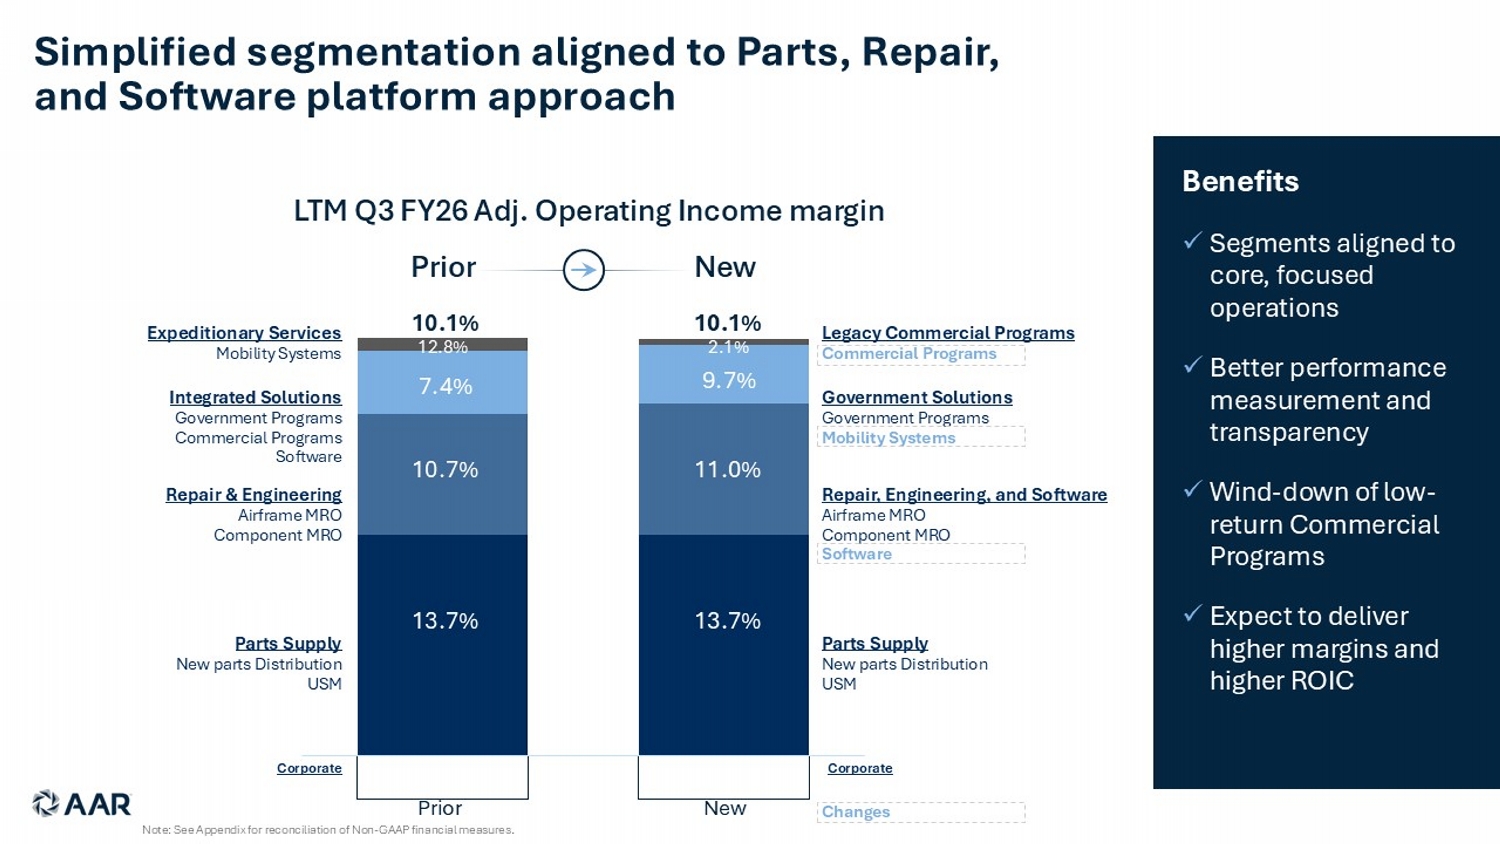
Benefits x Segments aligned to core, focused operations x Better performance measurement and transparency x Wind - down of low - return Commercial Programs x Expect to deliver higher margins and higher ROIC Prior Parts Supply New parts Distribution USM Repair & Engineering Airframe MRO Component MRO Integrated Solutions Government Programs Commercial Programs Software Expeditionary Services Mobility Systems LTM Q3 FY26 Adj. Operating Income margin Parts Supply New parts Distribution USM Repair, Engineering, and Software Airframe MRO Component MRO Software Government Solutions Government Programs Mobility Systems Legacy Commercial Programs Commercial Programs Changes New Simplified segmentation aligned to Parts, Repair, and Software platform approach 2.1% 9.7% 11.0% 13.7% 12.8% 7.4% 10.7% 13.7% 10.1% 10.1% Corporate Corporate Prior New Note: See Appendix for reconciliation of Non - GAAP financial measures.
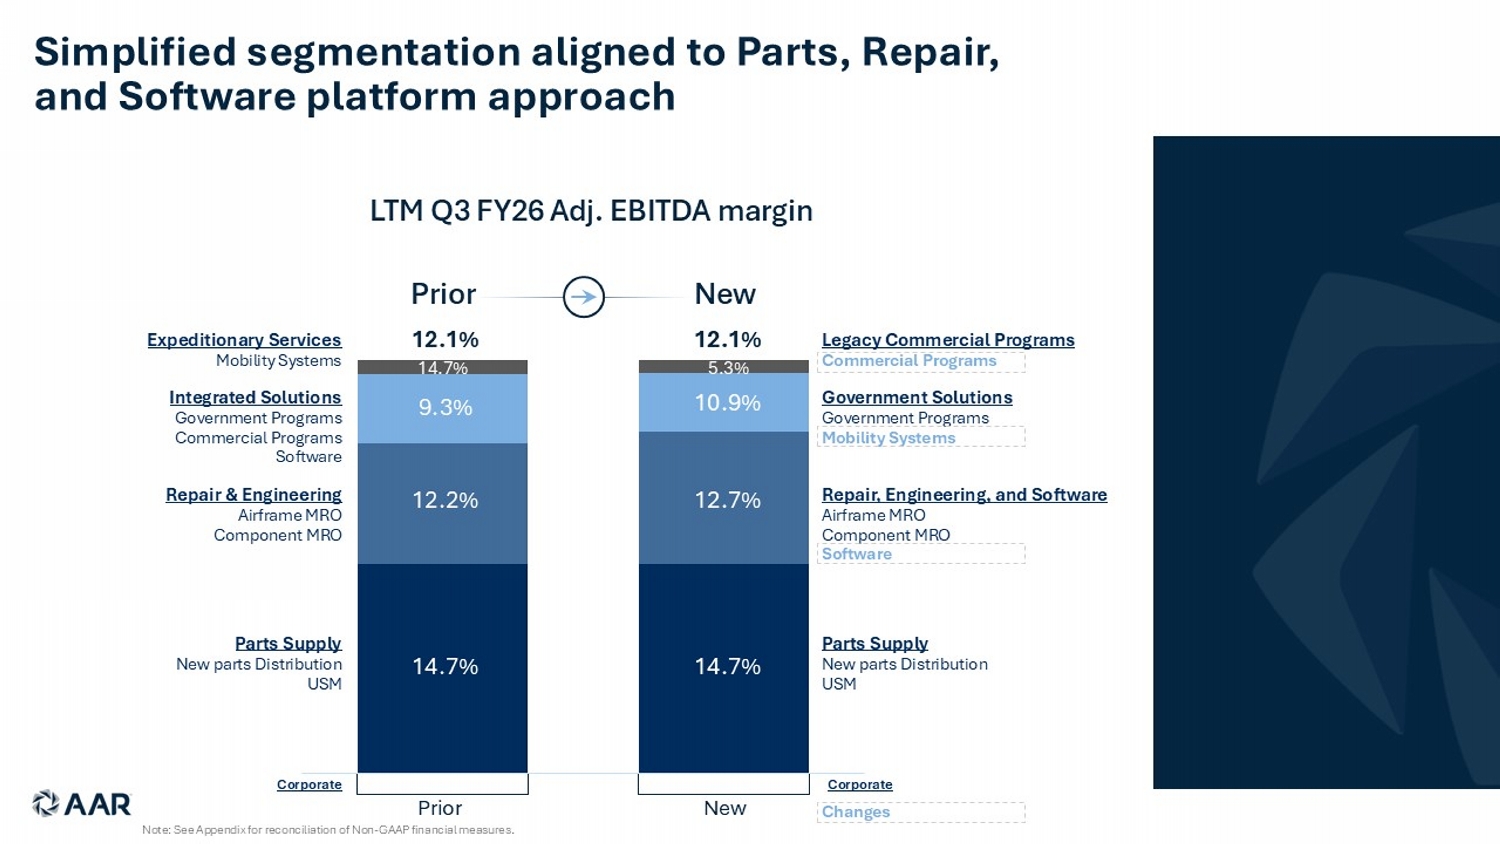
Prior Parts Supply New parts Distribution USM Repair & Engineering Airframe MRO Component MRO Integrated Solutions Government Programs Commercial Programs Software Expeditionary Services Mobility Systems LTM Q3 FY26 A dj . EBITDA margin Parts Supply New parts Distribution USM Repair, Engineering, and Software Airframe MRO Component MRO Software Government Solutions Government Programs Mobility Systems Legacy Commercial Programs Commercial Programs Changes New Simplified segmentation aligned to Parts, Repair, and Software platform approach 5.3% 10.9% 12.7% 14.7% 14.7% 9.3% 12.2% 14.7% 12.1% 12.1% Corporate Corporate Prior New Note: See Appendix for reconciliation of Non - GAAP financial measures.
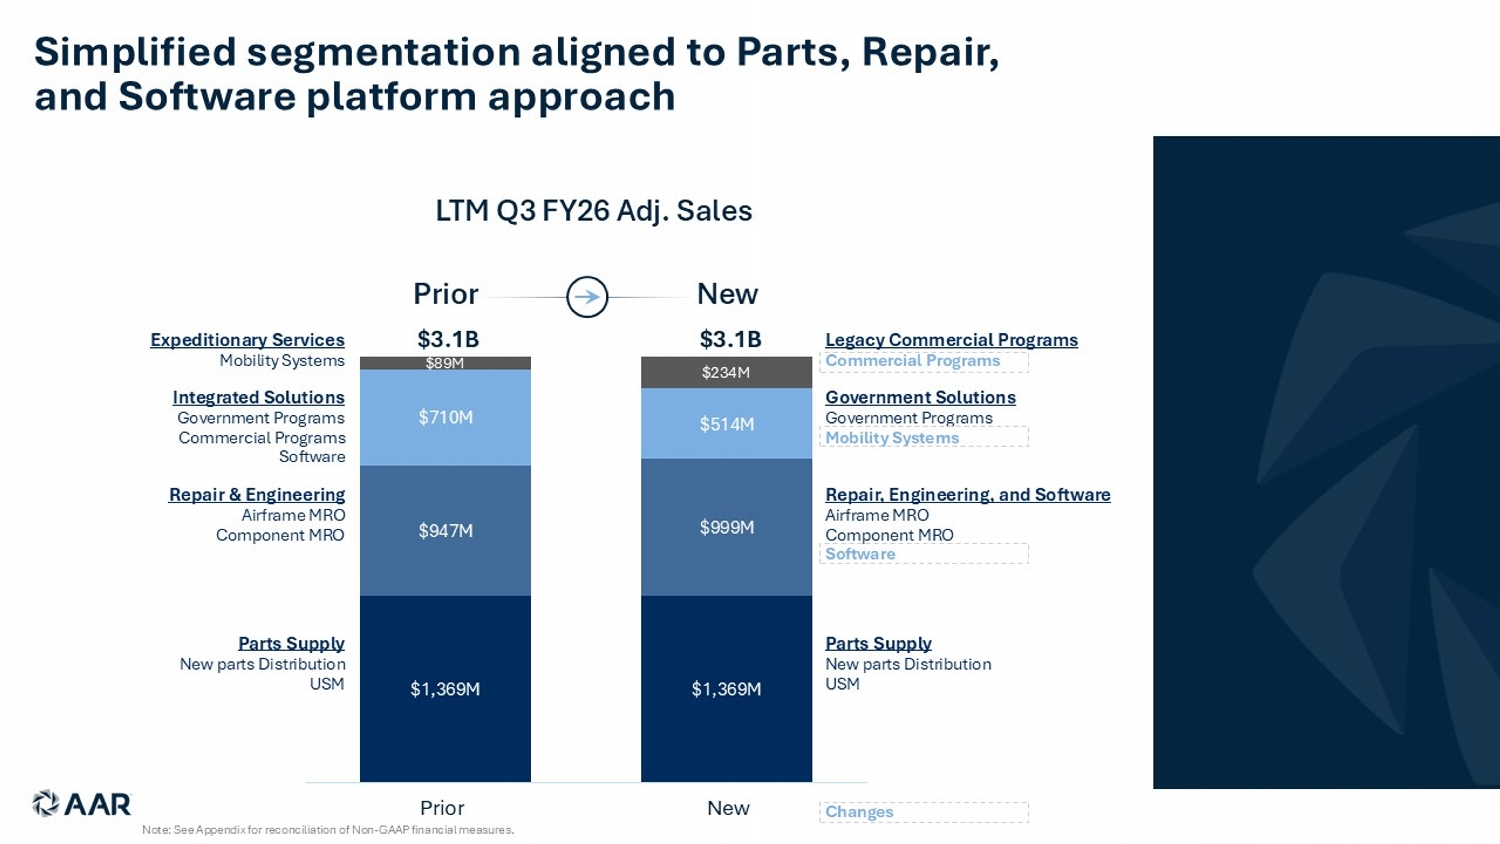
$1,369M $1,369M $947M $999M $710M $514M $89M $234M Prior Parts Supply New parts Distribution USM Repair & Engineering Airframe MRO Component MRO Integrated Solutions Government Programs Commercial Programs Software Expeditionary Services Mobility Systems LTM Q3 FY26 A dj . Sales Parts Supply New parts Distribution USM Repair, Engineering, and Software Airframe MRO Component MRO Software Government Solutions Government Programs Mobility Systems Legacy Commercial Programs Commercial Programs Changes New Simplified segmentation aligned to Parts, Repair, and Software platform approach $3.1B $3.1B Prior New Note: See Appendix for reconciliation of Non - GAAP financial measures.

© 2026 AAR CORP. All rights reserved worldwide. 6 Appendix
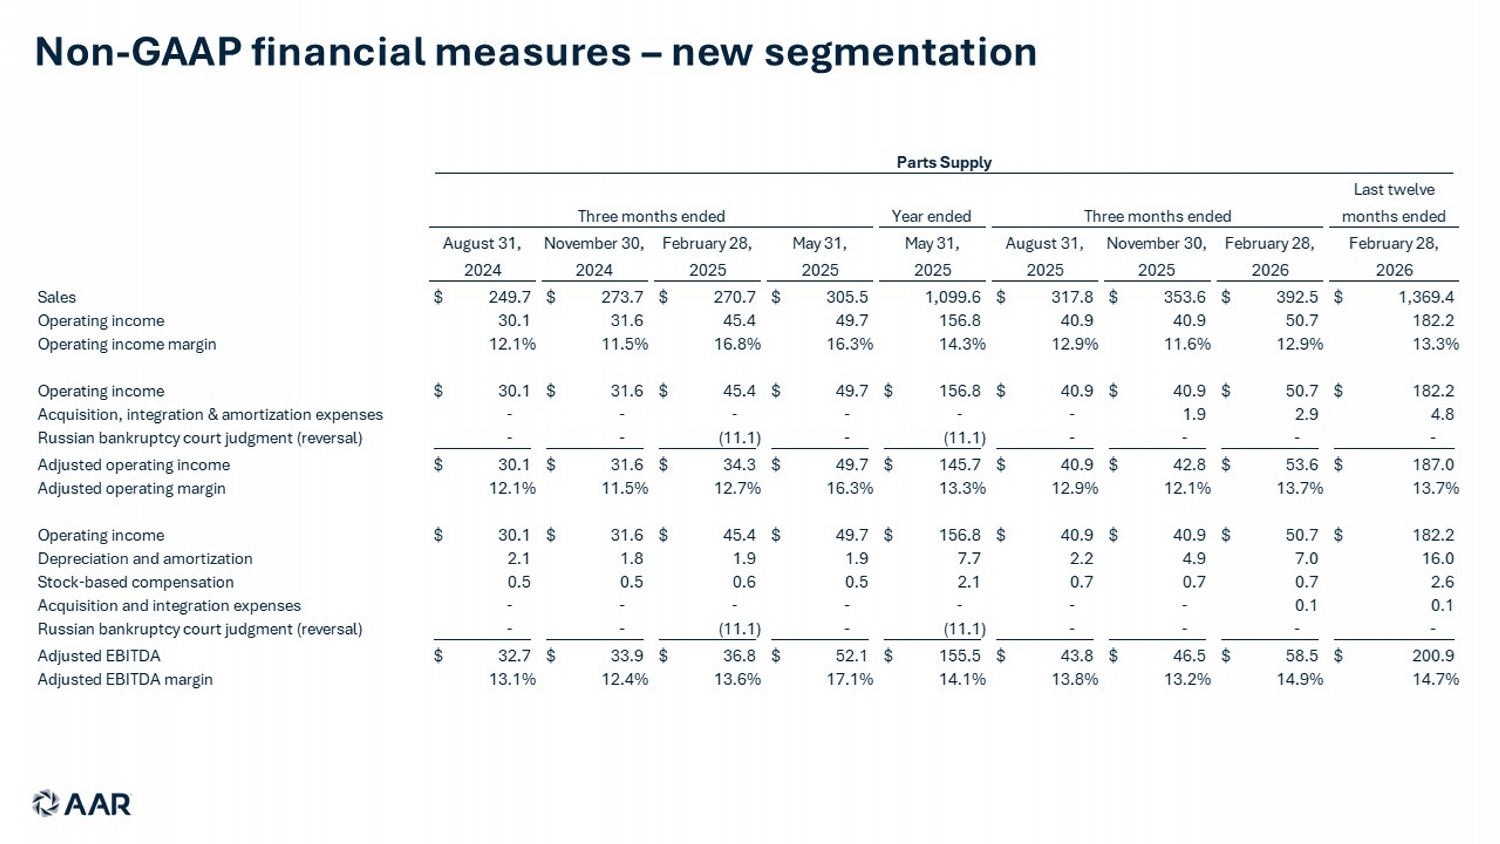
Non - GAAP financial measures – new segmentation Year ended Last twelve months ended August 31, 2024 November 30, 2024 February 28, 2025 May 31, 2025 May 31, 2025 August 31, 2025 November 30, 2025 February 28, 2026 February 28, 2026 Sales 249.7$ 273.7$ 270.7$ 305.5$ 1,099.6 317.8$ 353.6$ 392.5$ 1,369.4$ Operating income 30.1 31.6 45.4 49.7 156.8 40.9 40.9 50.7 182.2 Operating income margin 12.1% 11.5% 16.8% 16.3% 14.3% 12.9% 11.6% 12.9% 13.3% Operating income 30.1$ 31.6$ 45.4$ 49.7$ 156.8$ 40.9$ 40.9$ 50.7$ 182.2$ Acquisition, integration & amortization expenses - - - - - - 1.9 2.9 4.8 Russian bankruptcy court judgment (reversal) - - (11.1) - (11.1) - - - - Adjusted operating income 30.1$ 31.6$ 34.3$ 49.7$ 145.7$ 40.9$ 42.8$ 53.6$ 187.0$ Adjusted operating margin 12.1% 11.5% 12.7% 16.3% 13.3% 12.9% 12.1% 13.7% 13.7% Operating income 30.1$ 31.6$ 45.4$ 49.7$ 156.8$ 40.9$ 40.9$ 50.7$ 182.2$ Depreciation and amortization 2.1 1.8 1.9 1.9 7.7 2.2 4.9 7.0 16.0 Stock-based compensation 0.5 0.5 0.6 0.5 2.1 0.7 0.7 0.7 2.6 Acquisition and integration expenses - - - - - - - 0.1 0.1 Russian bankruptcy court judgment (reversal) - - (11.1) - (11.1) - - - - Adjusted EBITDA 32.7$ 33.9$ 36.8$ 52.1$ 155.5$ 43.8$ 46.5$ 58.5$ 200.9$ Adjusted EBITDA margin 13.1% 12.4% 13.6% 17.1% 14.1% 13.8% 13.2% 14.9% 14.7% Three months ended Three months ended Parts Supply
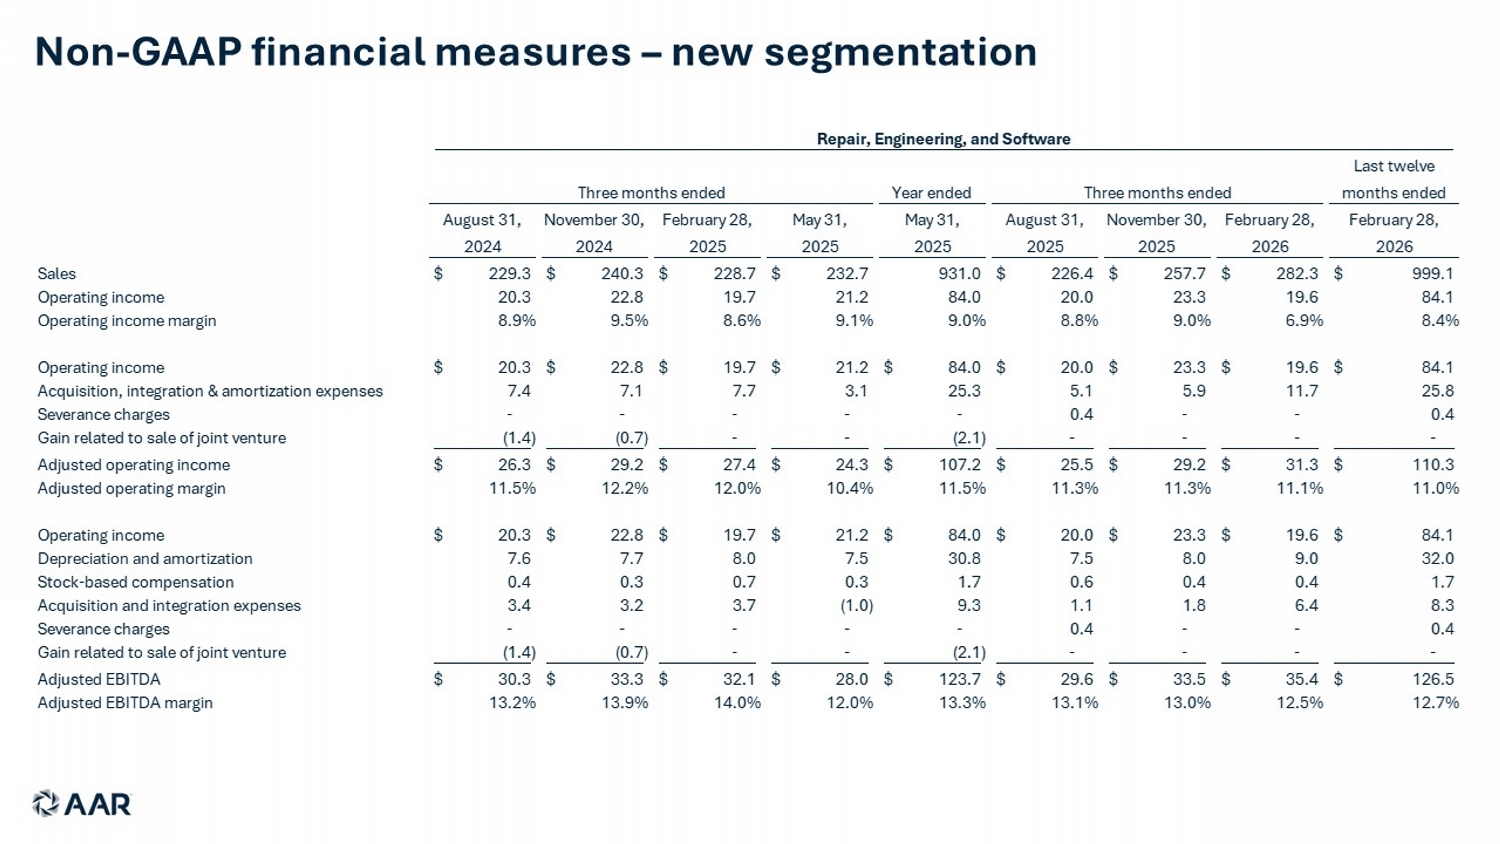
Non - GAAP financial measures – new segmentation Year ended Last twelve months ended August 31, 2024 November 30, 2024 February 28, 2025 May 31, 2025 May 31, 2025 August 31, 2025 November 30, 2025 February 28, 2026 February 28, 2026 Sales 229.3$ 240.3$ 228.7$ 232.7$ 931.0 226.4$ 257.7$ 282.3$ 999.1$ Operating income 20.3 22.8 19.7 21.2 84.0 20.0 23.3 19.6 84.1 Operating income margin 8.9% 9.5% 8.6% 9.1% 9.0% 8.8% 9.0% 6.9% 8.4% Operating income 20.3$ 22.8$ 19.7$ 21.2$ 84.0$ 20.0$ 23.3$ 19.6$ 84.1$ Acquisition, integration & amortization expenses 7.4 7.1 7.7 3.1 25.3 5.1 5.9 11.7 25.8 Severance charges - - - - - 0.4 - - 0.4 Gain related to sale of joint venture (1.4) (0.7) - - (2.1) - - - - Adjusted operating income 26.3$ 29.2$ 27.4$ 24.3$ 107.2$ 25.5$ 29.2$ 31.3$ 110.3$ Adjusted operating margin 11.5% 12.2% 12.0% 10.4% 11.5% 11.3% 11.3% 11.1% 11.0% Operating income 20.3$ 22.8$ 19.7$ 21.2$ 84.0$ 20.0$ 23.3$ 19.6$ 84.1$ Depreciation and amortization 7.6 7.7 8.0 7.5 30.8 7.5 8.0 9.0 32.0 Stock-based compensation 0.4 0.3 0.7 0.3 1.7 0.6 0.4 0.4 1.7 Acquisition and integration expenses 3.4 3.2 3.7 (1.0) 9.3 1.1 1.8 6.4 8.3 Severance charges - - - - - 0.4 - - 0.4 Gain related to sale of joint venture (1.4) (0.7) - - (2.1) - - - - Adjusted EBITDA 30.3$ 33.3$ 32.1$ 28.0$ 123.7$ 29.6$ 33.5$ 35.4$ 126.5$ Adjusted EBITDA margin 13.2% 13.9% 14.0% 12.0% 13.3% 13.1% 13.0% 12.5% 12.7% Repair, Engineering, and Software Three months ended Three months ended
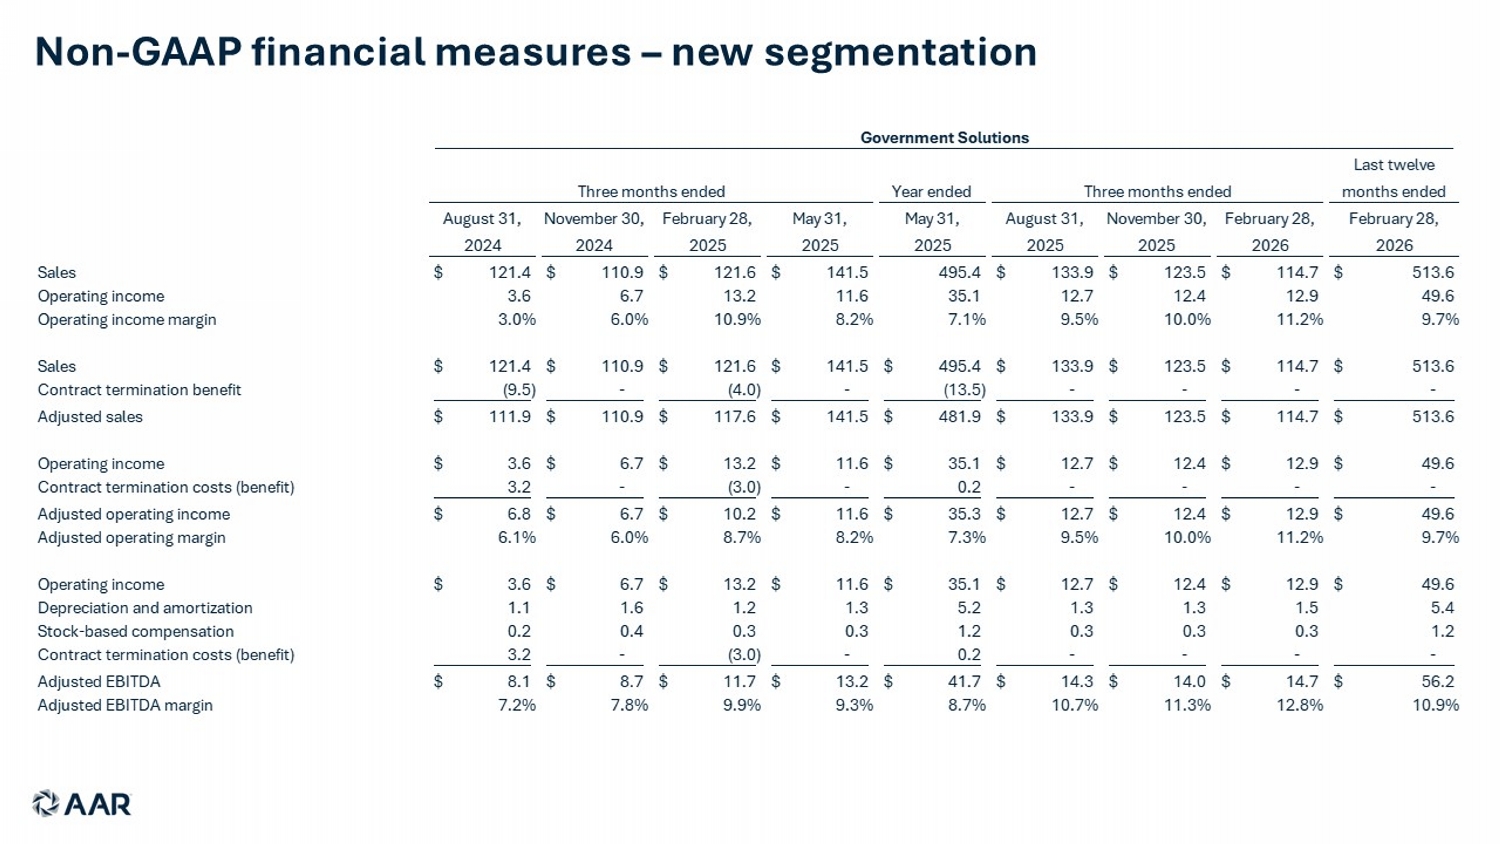
Non - GAAP financial measures – new segmentation Year ended Last twelve months ended August 31, 2024 November 30, 2024 February 28, 2025 May 31, 2025 May 31, 2025 August 31, 2025 November 30, 2025 February 28, 2026 February 28, 2026 Sales 121.4$ 110.9$ 121.6$ 141.5$ 495.4 133.9$ 123.5$ 114.7$ 513.6$ Operating income 3.6 6.7 13.2 11.6 35.1 12.7 12.4 12.9 49.6 Operating income margin 3.0% 6.0% 10.9% 8.2% 7.1% 9.5% 10.0% 11.2% 9.7% Sales 121.4$ 110.9$ 121.6$ 141.5$ 495.4$ 133.9$ 123.5$ 114.7$ 513.6$ Contract termination benefit (9.5) - (4.0) - (13.5) - - - - Adjusted sales 111.9$ 110.9$ 117.6$ 141.5$ 481.9$ 133.9$ 123.5$ 114.7$ 513.6$ Operating income 3.6$ 6.7$ 13.2$ 11.6$ 35.1$ 12.7$ 12.4$ 12.9$ 49.6$ Contract termination costs (benefit) 3.2 - (3.0) - 0.2 - - - - Adjusted operating income 6.8$ 6.7$ 10.2$ 11.6$ 35.3$ 12.7$ 12.4$ 12.9$ 49.6$ Adjusted operating margin 6.1% 6.0% 8.7% 8.2% 7.3% 9.5% 10.0% 11.2% 9.7% Operating income 3.6$ 6.7$ 13.2$ 11.6$ 35.1$ 12.7$ 12.4$ 12.9$ 49.6$ Depreciation and amortization 1.1 1.6 1.2 1.3 5.2 1.3 1.3 1.5 5.4 Stock-based compensation 0.2 0.4 0.3 0.3 1.2 0.3 0.3 0.3 1.2 Contract termination costs (benefit) 3.2 - (3.0) - 0.2 - - - - Adjusted EBITDA 8.1$ 8.7$ 11.7$ 13.2$ 41.7$ 14.3$ 14.0$ 14.7$ 56.2$ Adjusted EBITDA margin 7.2% 7.8% 9.9% 9.3% 8.7% 10.7% 11.3% 12.8% 10.9% Three months ended Three months ended Government Solutions
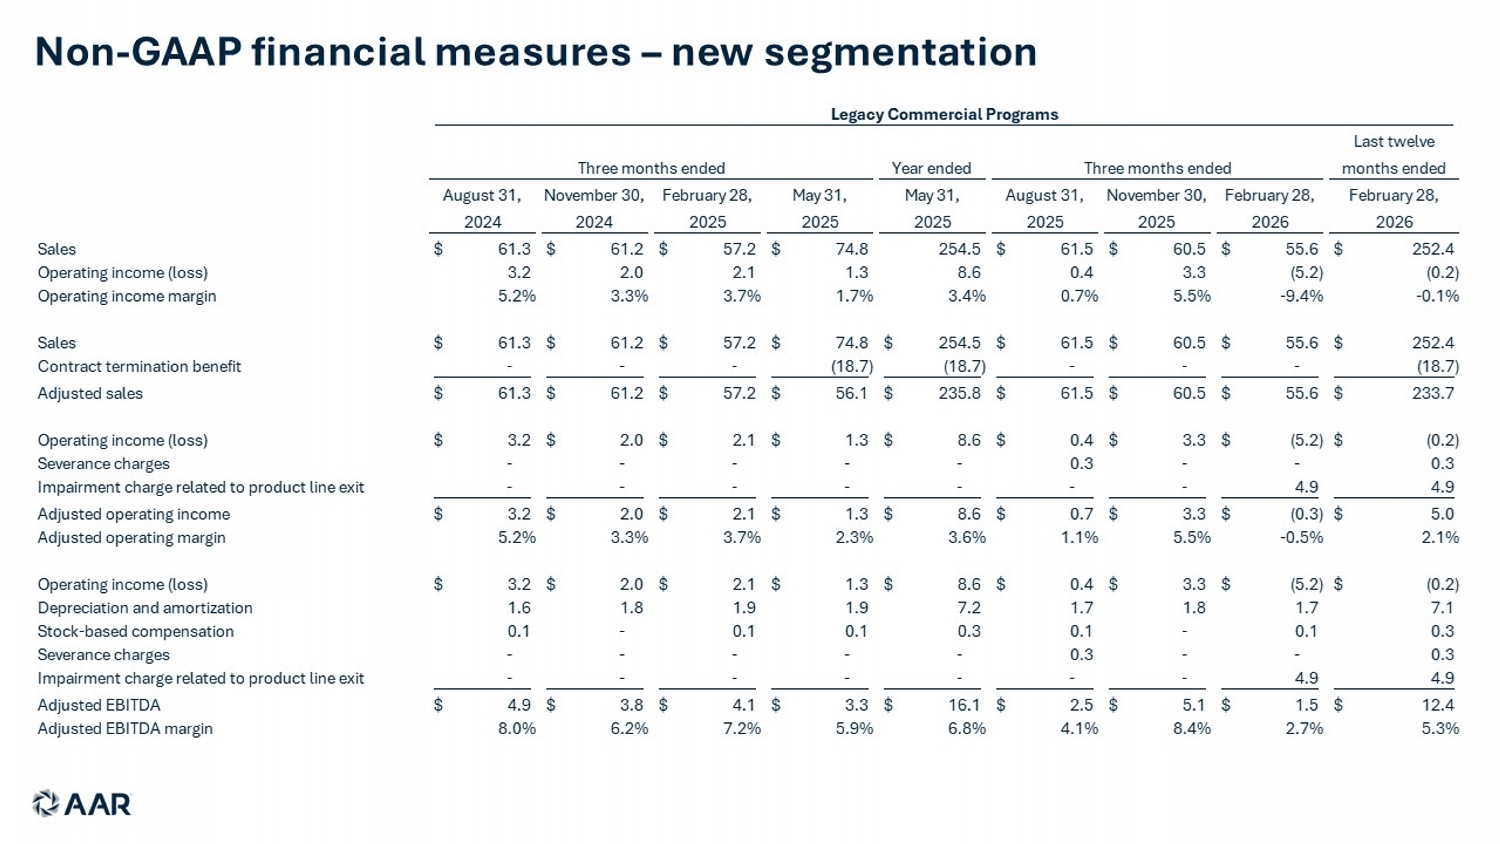
Non - GAAP financial measures – new segmentation Year ended Last twelve months ended August 31, 2024 November 30, 2024 February 28, 2025 May 31, 2025 May 31, 2025 August 31, 2025 November 30, 2025 February 28, 2026 February 28, 2026 Sales 61.3$ 61.2$ 57.2$ 74.8$ 254.5 61.5$ 60.5$ 55.6$ 252.4$ Operating income (loss) 3.2 2.0 2.1 1.3 8.6 0.4 3.3 (5.2) (0.2) Operating income margin 5.2% 3.3% 3.7% 1.7% 3.4% 0.7% 5.5% -9.4% -0.1% Sales 61.3$ 61.2$ 57.2$ 74.8$ 254.5$ 61.5$ 60.5$ 55.6$ 252.4$ Contract termination benefit - - - (18.7) (18.7) - - - (18.7) Adjusted sales 61.3$ 61.2$ 57.2$ 56.1$ 235.8$ 61.5$ 60.5$ 55.6$ 233.7$ Operating income (loss) 3.2$ 2.0$ 2.1$ 1.3$ 8.6$ 0.4$ 3.3$ (5.2)$ (0.2)$ Severance charges - - - - - 0.3 - - 0.3 Impairment charge related to product line exit - - - - - - - 4.9 4.9 Adjusted operating income 3.2$ 2.0$ 2.1$ 1.3$ 8.6$ 0.7$ 3.3$ (0.3)$ 5.0$ Adjusted operating margin 5.2% 3.3% 3.7% 2.3% 3.6% 1.1% 5.5% -0.5% 2.1% Operating income (loss) 3.2$ 2.0$ 2.1$ 1.3$ 8.6$ 0.4$ 3.3$ (5.2)$ (0.2)$ Depreciation and amortization 1.6 1.8 1.9 1.9 7.2 1.7 1.8 1.7 7.1 Stock-based compensation 0.1 - 0.1 0.1 0.3 0.1 - 0.1 0.3 Severance charges - - - - - 0.3 - - 0.3 Impairment charge related to product line exit - - - - - - - 4.9 4.9 Adjusted EBITDA 4.9$ 3.8$ 4.1$ 3.3$ 16.1$ 2.5$ 5.1$ 1.5$ 12.4$ Adjusted EBITDA margin 8.0% 6.2% 7.2% 5.9% 6.8% 4.1% 8.4% 2.7% 5.3% Legacy Commercial Programs Three months ended Three months ended
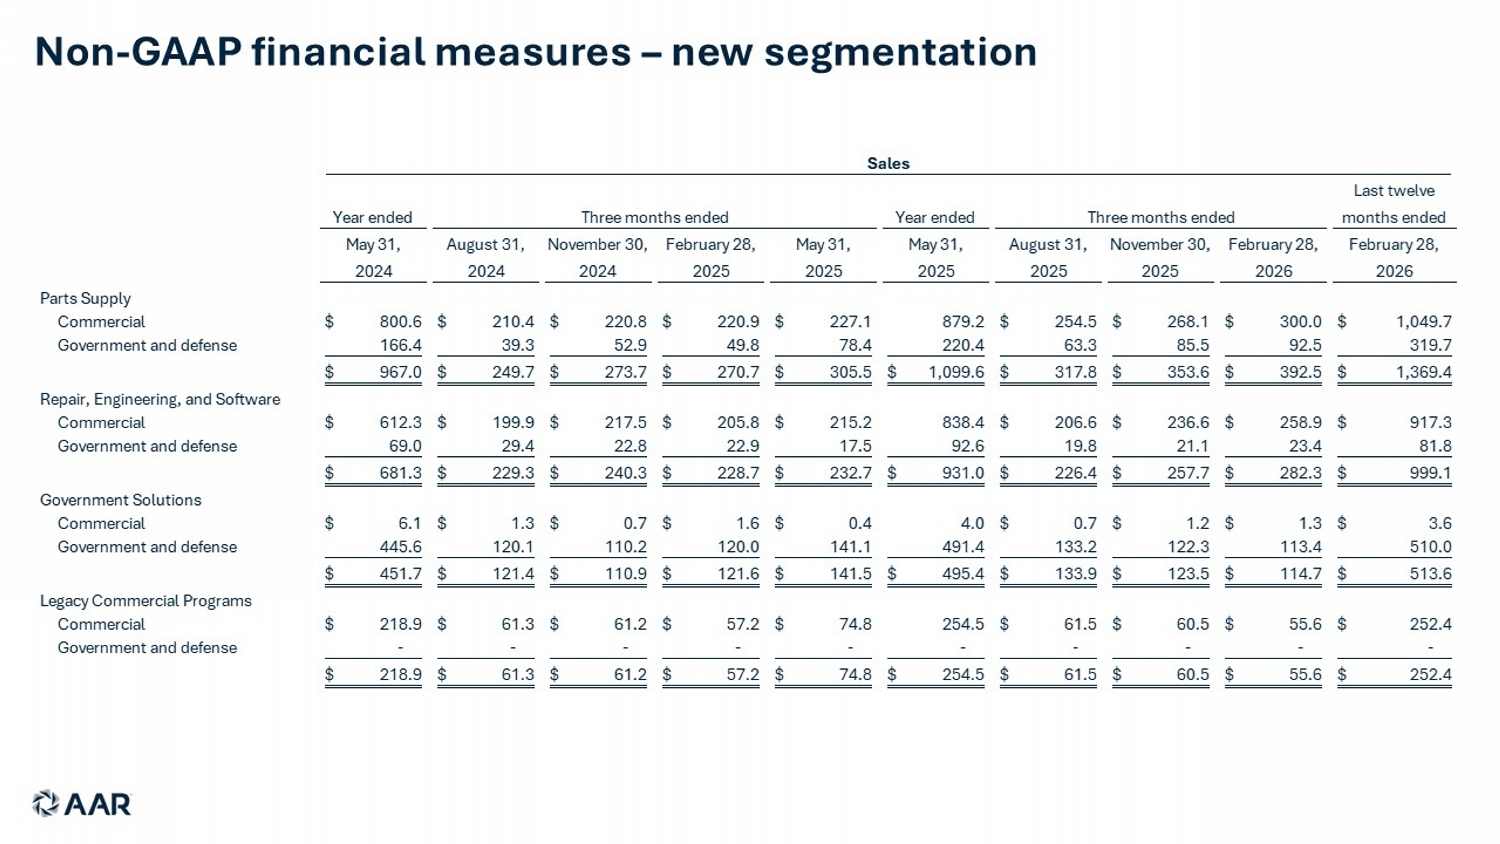
Non - GAAP financial measures – new segmentation Year ended Year ended Last twelve months ended May 31, 2024 August 31, 2024 November 30, 2024 February 28, 2025 May 31, 2025 May 31, 2025 August 31, 2025 November 30, 2025 February 28, 2026 February 28, 2026 Parts Supply Commercial 800.6$ 210.4$ 220.8$ 220.9$ 227.1$ 879.2 254.5$ 268.1$ 300.0$ 1,049.7$ Government and defense 166.4 39.3 52.9 49.8 78.4 220.4 63.3 85.5 92.5 319.7 967.0$ 249.7$ 273.7$ 270.7$ 305.5$ 1,099.6$ 317.8$ 353.6$ 392.5$ 1,369.4$ Repair, Engineering, and Software Commercial 612.3$ 199.9$ 217.5$ 205.8$ 215.2$ 838.4 206.6$ 236.6$ 258.9$ 917.3$ Government and defense 69.0 29.4 22.8 22.9 17.5 92.6 19.8 21.1 23.4 81.8 681.3$ 229.3$ 240.3$ 228.7$ 232.7$ 931.0$ 226.4$ 257.7$ 282.3$ 999.1$ Government Solutions Commercial 6.1$ 1.3$ 0.7$ 1.6$ 0.4$ 4.0 0.7$ 1.2$ 1.3$ 3.6$ Government and defense 445.6 120.1 110.2 120.0 141.1 491.4 133.2 122.3 113.4 510.0 451.7$ 121.4$ 110.9$ 121.6$ 141.5$ 495.4$ 133.9$ 123.5$ 114.7$ 513.6$ Legacy Commercial Programs Commercial 218.9$ 61.3$ 61.2$ 57.2$ 74.8$ 254.5 61.5$ 60.5$ 55.6$ 252.4$ Government and defense - - - - - - - - - - 218.9$ 61.3$ 61.2$ 57.2$ 74.8$ 254.5$ 61.5$ 60.5$ 55.6$ 252.4$ Three months ended Three months ended Sales
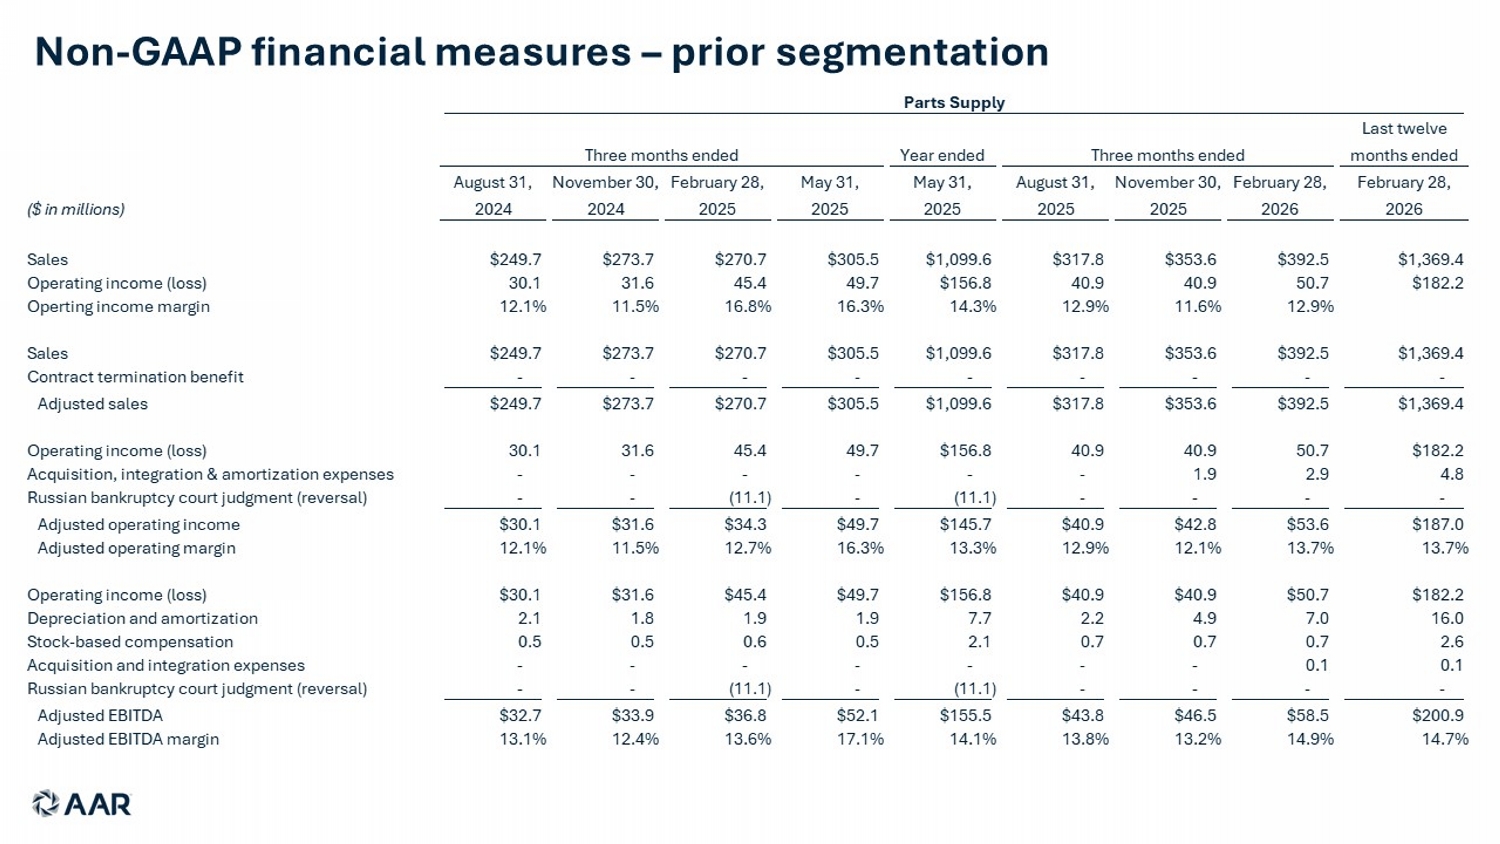
Non - GAAP financial measures – prior segmentation Year ended Last twelve months ended ($ in millions) August 31, 2024 November 30, 2024 February 28, 2025 May 31, 2025 May 31, 2025 August 31, 2025 November 30, 2025 February 28, 2026 February 28, 2026 Sales $249.7 $273.7 $270.7 $305.5 $1,099.6 $317.8 $353.6 $392.5 $1,369.4 Operating income (loss) 30.1 31.6 45.4 49.7 $156.8 40.9 40.9 50.7 $182.2 Operting income margin 12.1% 11.5% 16.8% 16.3% 14.3% 12.9% 11.6% 12.9% Sales $249.7 $273.7 $270.7 $305.5 $1,099.6 $317.8 $353.6 $392.5 $1,369.4 Contract termination benefit - - - - - - - - - Adjusted sales $249.7 $273.7 $270.7 $305.5 $1,099.6 $317.8 $353.6 $392.5 $1,369.4 Operating income (loss) 30.1 31.6 45.4 49.7 $156.8 40.9 40.9 50.7 $182.2 Acquisition, integration & amortization expenses - - - - - - 1.9 2.9 4.8 Russian bankruptcy court judgment (reversal) - - (11.1) - (11.1) - - - - Adjusted operating income $30.1 $31.6 $34.3 $49.7 $145.7 $40.9 $42.8 $53.6 $187.0 Adjusted operating margin 12.1% 11.5% 12.7% 16.3% 13.3% 12.9% 12.1% 13.7% 13.7% Operating income (loss) $30.1 $31.6 $45.4 $49.7 $156.8 $40.9 $40.9 $50.7 $182.2 Depreciation and amortization 2.1 1.8 1.9 1.9 7.7 2.2 4.9 7.0 16.0 Stock-based compensation 0.5 0.5 0.6 0.5 2.1 0.7 0.7 0.7 2.6 Acquisition and integration expenses - - - - - - - 0.1 0.1 Russian bankruptcy court judgment (reversal) - - (11.1) - (11.1) - - - - Adjusted EBITDA $32.7 $33.9 $36.8 $52.1 $155.5 $43.8 $46.5 $58.5 $200.9 Adjusted EBITDA margin 13.1% 12.4% 13.6% 17.1% 14.1% 13.8% 13.2% 14.9% 14.7% Parts Supply Three months ended Three months ended
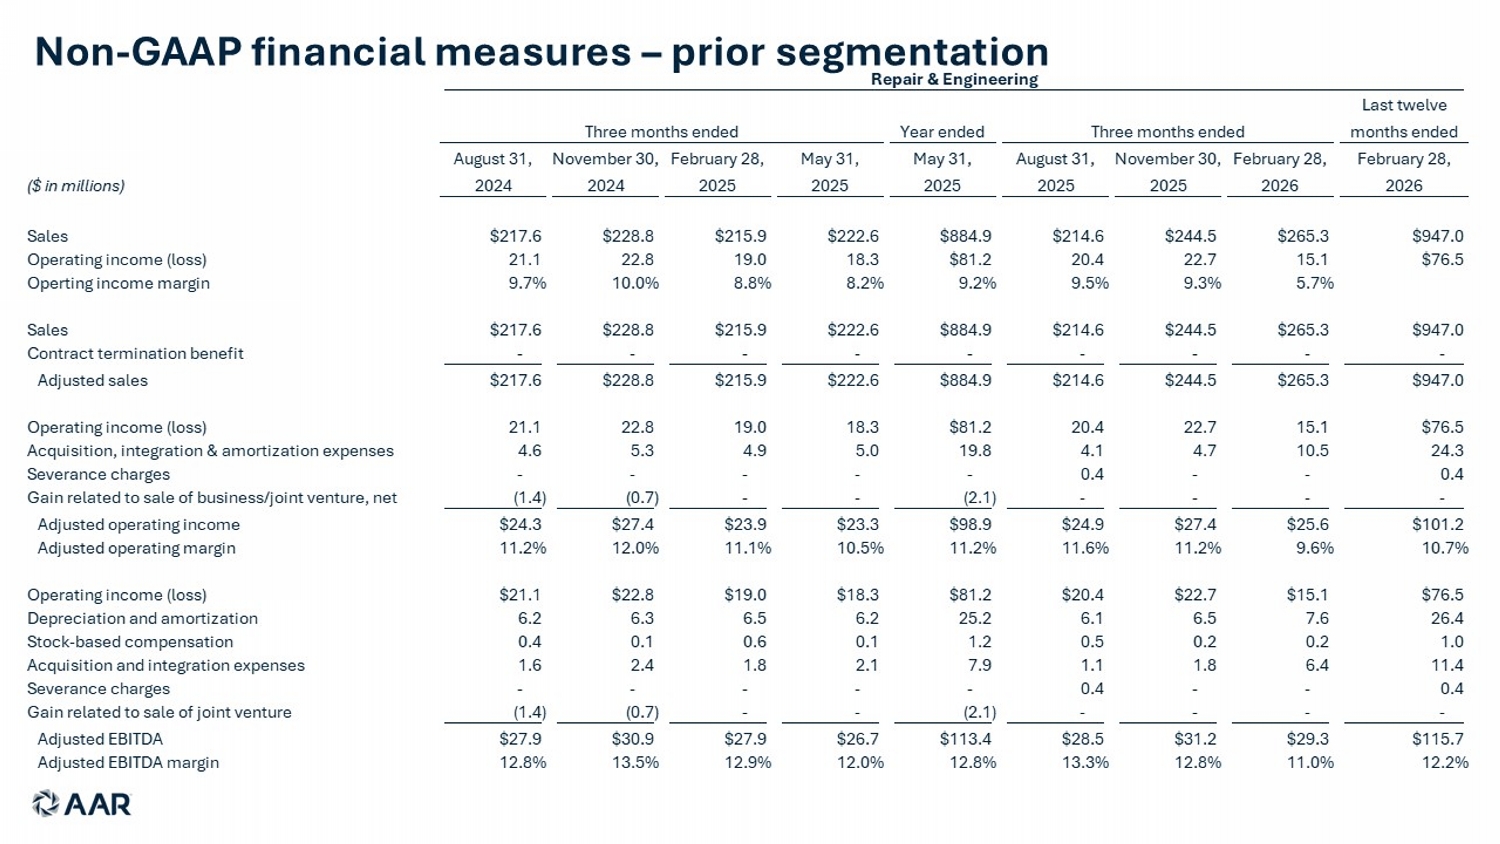
Non - GAAP financial measures – prior segmentation Year ended Last twelve months ended ($ in millions) August 31, 2024 November 30, 2024 February 28, 2025 May 31, 2025 May 31, 2025 August 31, 2025 November 30, 2025 February 28, 2026 February 28, 2026 Sales $217.6 $228.8 $215.9 $222.6 $884.9 $214.6 $244.5 $265.3 $947.0 Operating income (loss) 21.1 22.8 19.0 18.3 $81.2 20.4 22.7 15.1 $76.5 Operting income margin 9.7% 10.0% 8.8% 8.2% 9.2% 9.5% 9.3% 5.7% Sales $217.6 $228.8 $215.9 $222.6 $884.9 $214.6 $244.5 $265.3 $947.0 Contract termination benefit - - - - - - - - - Adjusted sales $217.6 $228.8 $215.9 $222.6 $884.9 $214.6 $244.5 $265.3 $947.0 Operating income (loss) 21.1 22.8 19.0 18.3 $81.2 20.4 22.7 15.1 $76.5 Acquisition, integration & amortization expenses 4.6 5.3 4.9 5.0 19.8 4.1 4.7 10.5 24.3 Severance charges - - - - - 0.4 - - 0.4 Gain related to sale of business/joint venture, net (1.4) (0.7) - - (2.1) - - - - Adjusted operating income $24.3 $27.4 $23.9 $23.3 $98.9 $24.9 $27.4 $25.6 $101.2 Adjusted operating margin 11.2% 12.0% 11.1% 10.5% 11.2% 11.6% 11.2% 9.6% 10.7% Operating income (loss) $21.1 $22.8 $19.0 $18.3 $81.2 $20.4 $22.7 $15.1 $76.5 Depreciation and amortization 6.2 6.3 6.5 6.2 25.2 6.1 6.5 7.6 26.4 Stock-based compensation 0.4 0.1 0.6 0.1 1.2 0.5 0.2 0.2 1.0 Acquisition and integration expenses 1.6 2.4 1.8 2.1 7.9 1.1 1.8 6.4 11.4 Severance charges - - - - - 0.4 - - 0.4 Gain related to sale of joint venture (1.4) (0.7) - - (2.1) - - - - Adjusted EBITDA $27.9 $30.9 $27.9 $26.7 $113.4 $28.5 $31.2 $29.3 $115.7 Adjusted EBITDA margin 12.8% 13.5% 12.9% 12.0% 12.8% 13.3% 12.8% 11.0% 12.2% Repair & Engineering Three months ended Three months ended
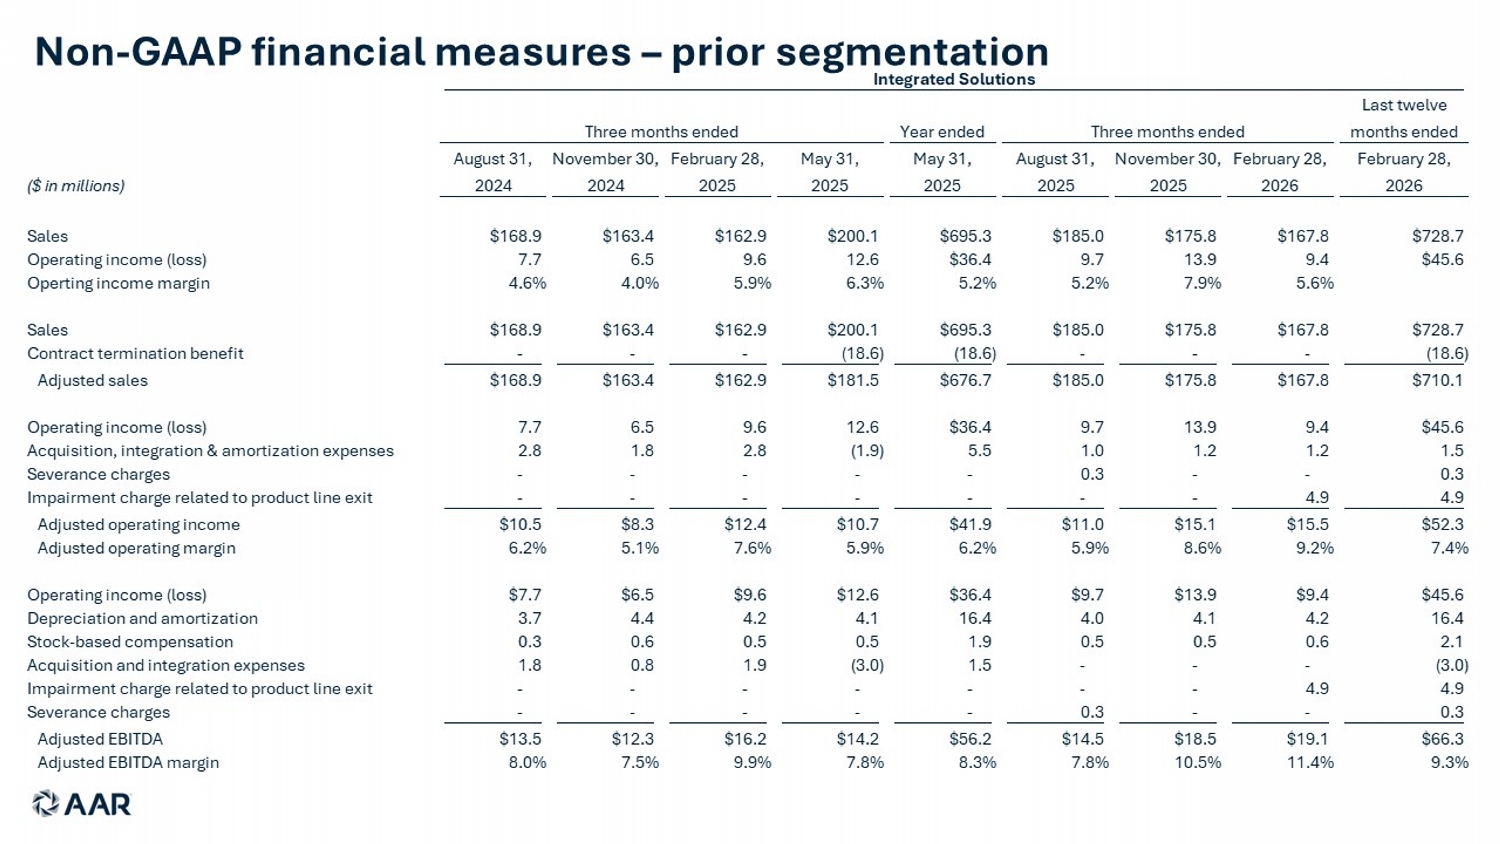
Non - GAAP financial measures – prior segmentation Year ended Last twelve months ended ($ in millions) August 31, 2024 November 30, 2024 February 28, 2025 May 31, 2025 May 31, 2025 August 31, 2025 November 30, 2025 February 28, 2026 February 28, 2026 Sales $168.9 $163.4 $162.9 $200.1 $695.3 $185.0 $175.8 $167.8 $728.7 Operating income (loss) 7.7 6.5 9.6 12.6 $36.4 9.7 13.9 9.4 $45.6 Operting income margin 4.6% 4.0% 5.9% 6.3% 5.2% 5.2% 7.9% 5.6% Sales $168.9 $163.4 $162.9 $200.1 $695.3 $185.0 $175.8 $167.8 $728.7 Contract termination benefit - - - (18.6) (18.6) - - - (18.6) Adjusted sales $168.9 $163.4 $162.9 $181.5 $676.7 $185.0 $175.8 $167.8 $710.1 Operating income (loss) 7.7 6.5 9.6 12.6 $36.4 9.7 13.9 9.4 $45.6 Acquisition, integration & amortization expenses 2.8 1.8 2.8 (1.9) 5.5 1.0 1.2 1.2 1.5 Severance charges - - - - - 0.3 - - 0.3 Impairment charge related to product line exit - - - - - - - 4.9 4.9 Adjusted operating income $10.5 $8.3 $12.4 $10.7 $41.9 $11.0 $15.1 $15.5 $52.3 Adjusted operating margin 6.2% 5.1% 7.6% 5.9% 6.2% 5.9% 8.6% 9.2% 7.4% Operating income (loss) $7.7 $6.5 $9.6 $12.6 $36.4 $9.7 $13.9 $9.4 $45.6 Depreciation and amortization 3.7 4.4 4.2 4.1 16.4 4.0 4.1 4.2 16.4 Stock-based compensation 0.3 0.6 0.5 0.5 1.9 0.5 0.5 0.6 2.1 Acquisition and integration expenses 1.8 0.8 1.9 (3.0) 1.5 - - - (3.0) Impairment charge related to product line exit - - - - - - - 4.9 4.9 Severance charges - - - - - 0.3 - - 0.3 Adjusted EBITDA $13.5 $12.3 $16.2 $14.2 $56.2 $14.5 $18.5 $19.1 $66.3 Adjusted EBITDA margin 8.0% 7.5% 9.9% 7.8% 8.3% 7.8% 10.5% 11.4% 9.3% Integrated Solutions Three months ended Three months ended
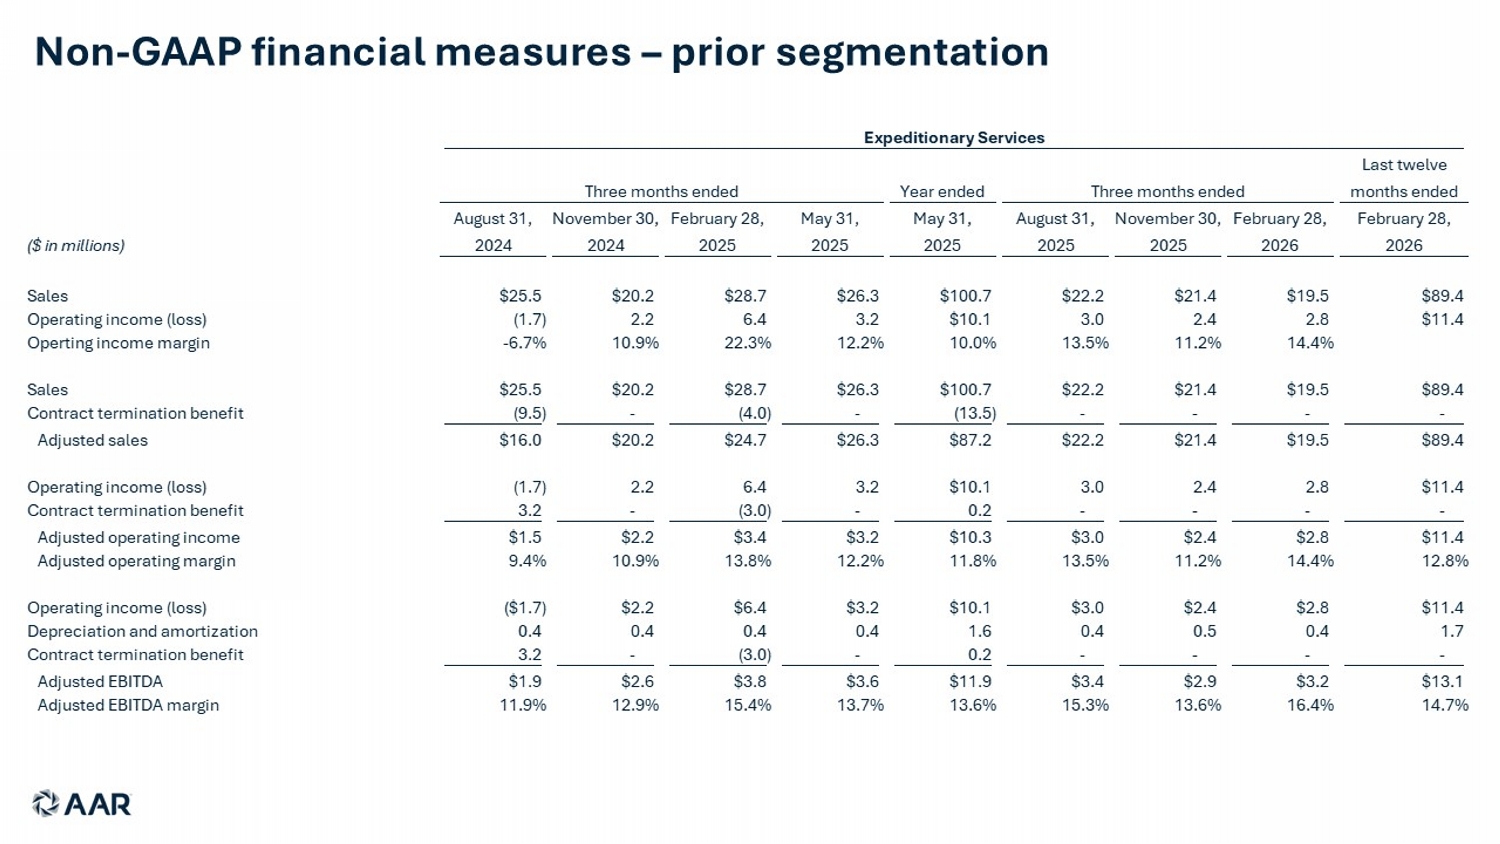
Non - GAAP financial measures – prior segmentation Year ended Last twelve months ended ($ in millions) August 31, 2024 November 30, 2024 February 28, 2025 May 31, 2025 May 31, 2025 August 31, 2025 November 30, 2025 February 28, 2026 February 28, 2026 Sales $25.5 $20.2 $28.7 $26.3 $100.7 $22.2 $21.4 $19.5 $89.4 Operating income (loss) (1.7) 2.2 6.4 3.2 $10.1 3.0 2.4 2.8 $11.4 Operting income margin -6.7% 10.9% 22.3% 12.2% 10.0% 13.5% 11.2% 14.4% Sales $25.5 $20.2 $28.7 $26.3 $100.7 $22.2 $21.4 $19.5 $89.4 Contract termination benefit (9.5) - (4.0) - (13.5) - - - - Adjusted sales $16.0 $20.2 $24.7 $26.3 $87.2 $22.2 $21.4 $19.5 $89.4 Operating income (loss) (1.7) 2.2 6.4 3.2 $10.1 3.0 2.4 2.8 $11.4 Contract termination benefit 3.2 - (3.0) - 0.2 - - - - Adjusted operating income $1.5 $2.2 $3.4 $3.2 $10.3 $3.0 $2.4 $2.8 $11.4 Adjusted operating margin 9.4% 10.9% 13.8% 12.2% 11.8% 13.5% 11.2% 14.4% 12.8% Operating income (loss) ($1.7) $2.2 $6.4 $3.2 $10.1 $3.0 $2.4 $2.8 $11.4 Depreciation and amortization 0.4 0.4 0.4 0.4 1.6 0.4 0.5 0.4 1.7 Contract termination benefit 3.2 - (3.0) - 0.2 - - - - Adjusted EBITDA $1.9 $2.6 $3.8 $3.6 $11.9 $3.4 $2.9 $3.2 $13.1 Adjusted EBITDA margin 11.9% 12.9% 15.4% 13.7% 13.6% 15.3% 13.6% 16.4% 14.7% Expeditionary Services Three months ended Three months ended
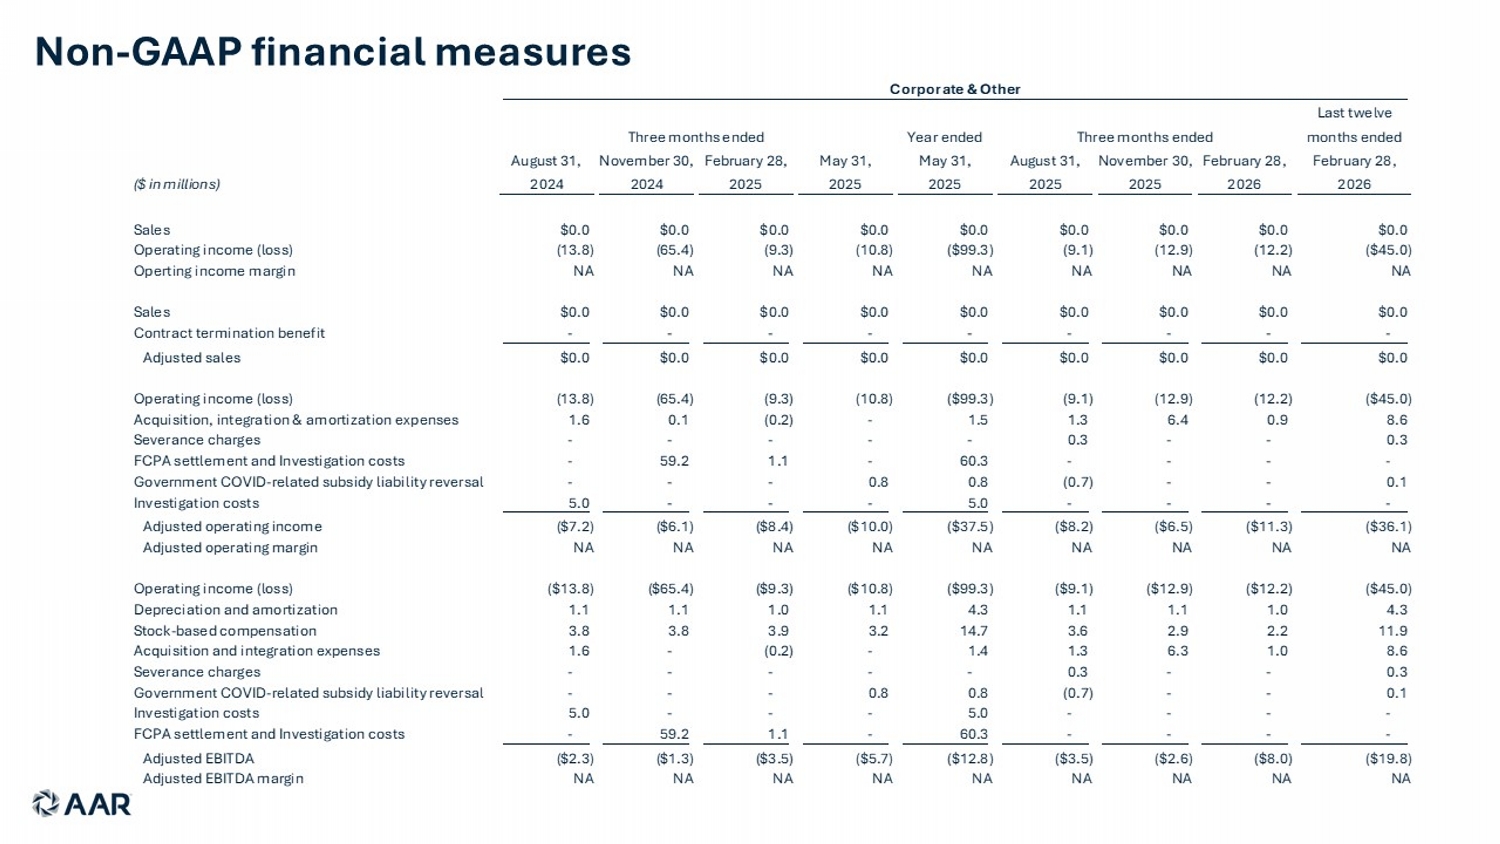
Non - GAAP financial measures Year ended Last twelve months ended ($ in millions) August 31, 2024 November 30, 2024 February 28, 2025 May 31, 2025 May 31, 2025 August 31, 2025 November 30, 2025 February 28, 2026 February 28, 2026 Sales $0.0 $0.0 $0.0 $0.0 $0.0 $0.0 $0.0 $0.0 $0.0 Operating income (loss) (13.8) (65.4) (9.3) (10.8) ($99.3) (9.1) (12.9) (12.2) ($45.0) Operting income margin NA NA NA NA NA NA NA NA NA Sales $0.0 $0.0 $0.0 $0.0 $0.0 $0.0 $0.0 $0.0 $0.0 Contract termination benefit - - - - - - - - - Adjusted sales $0.0 $0.0 $0.0 $0.0 $0.0 $0.0 $0.0 $0.0 $0.0 Operating income (loss) (13.8) (65.4) (9.3) (10.8) ($99.3) (9.1) (12.9) (12.2) ($45.0) Acquisition, integration & amortization expenses 1.6 0.1 (0.2) - 1.5 1.3 6.4 0.9 8.6 Severance charges - - - - - 0.3 - - 0.3 FCPA settlement and Investigation costs - 59.2 1.1 - 60.3 - - - - Government COVID-related subsidy liability reversal - - - 0.8 0.8 (0.7) - - 0.1 Investigation costs 5.0 - - - 5.0 - - - - Adjusted operating income ($7.2) ($6.1) ($8.4) ($10.0) ($37.5) ($8.2) ($6.5) ($11.3) ($36.1) Adjusted operating margin NA NA NA NA NA NA NA NA NA Operating income (loss) ($13.8) ($65.4) ($9.3) ($10.8) ($99.3) ($9.1) ($12.9) ($12.2) ($45.0) Depreciation and amortization 1.1 1.1 1.0 1.1 4.3 1.1 1.1 1.0 4.3 Stock-based compensation 3.8 3.8 3.9 3.2 14.7 3.6 2.9 2.2 11.9 Acquisition and integration expenses 1.6 - (0.2) - 1.4 1.3 6.3 1.0 8.6 Severance charges - - - - - 0.3 - - 0.3 Government COVID-related subsidy liability reversal - - - 0.8 0.8 (0.7) - - 0.1 Investigation costs 5.0 - - - 5.0 - - - - FCPA settlement and Investigation costs - 59.2 1.1 - 60.3 - - - - Adjusted EBITDA ($2.3) ($1.3) ($3.5) ($5.7) ($12.8) ($3.5) ($2.6) ($8.0) ($19.8) Adjusted EBITDA margin NA NA NA NA NA NA NA NA NA Corporate & Other Three months ended Three months ended
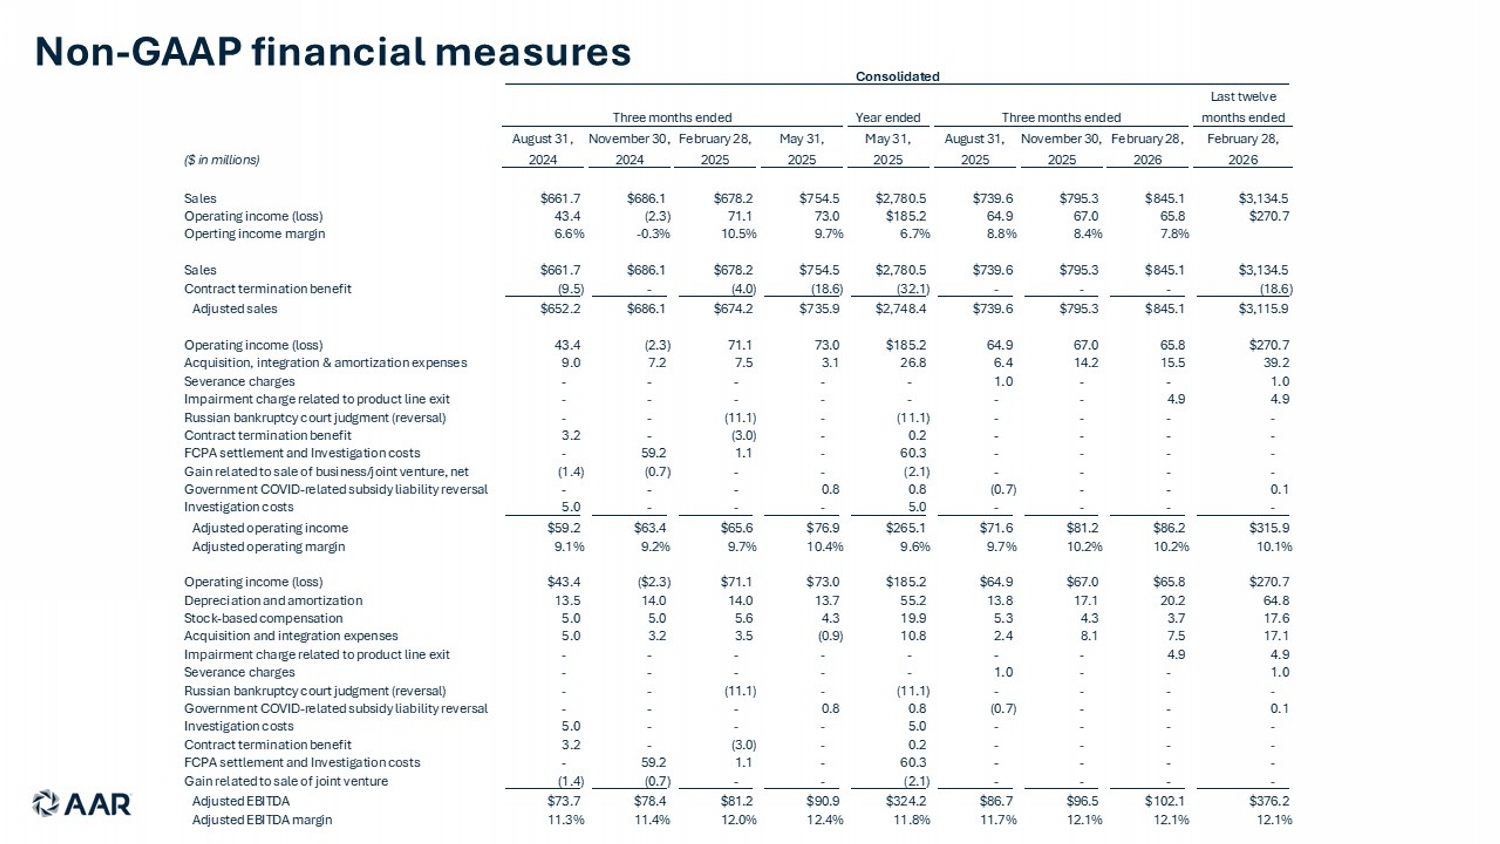
Non - GAAP financial measures Year ended Last twelve months ended ($ in millions) August 31, 2024 November 30, 2024 February 28, 2025 May 31, 2025 May 31, 2025 August 31, 2025 November 30, 2025 February 28, 2026 February 28, 2026 Sales $661.7 $686.1 $678.2 $754.5 $2,780.5 $739.6 $795.3 $845.1 $3,134.5 Operating income (loss) 43.4 (2.3) 71.1 73.0 $185.2 64.9 67.0 65.8 $270.7 Operting income margin 6.6% -0.3% 10.5% 9.7% 6.7% 8.8% 8.4% 7.8% Sales $661.7 $686.1 $678.2 $754.5 $2,780.5 $739.6 $795.3 $845.1 $3,134.5 Contract termination benefit (9.5) - (4.0) (18.6) (32.1) - - - (18.6) Adjusted sales $652.2 $686.1 $674.2 $735.9 $2,748.4 $739.6 $795.3 $845.1 $3,115.9 Operating income (loss) 43.4 (2.3) 71.1 73.0 $185.2 64.9 67.0 65.8 $270.7 Acquisition, integration & amortization expenses 9.0 7.2 7.5 3.1 26.8 6.4 14.2 15.5 39.2 Severance charges - - - - - 1.0 - - 1.0 Impairment charge related to product line exit - - - - - - - 4.9 4.9 Russian bankruptcy court judgment (reversal) - - (11.1) - (11.1) - - - - Contract termination benefit 3.2 - (3.0) - 0.2 - - - - FCPA settlement and Investigation costs - 59.2 1.1 - 60.3 - - - - Gain related to sale of business/joint venture, net (1.4) (0.7) - - (2.1) - - - - Government COVID-related subsidy liability reversal - - - 0.8 0.8 (0.7) - - 0.1 Investigation costs 5.0 - - - 5.0 - - - - Adjusted operating income $59.2 $63.4 $65.6 $76.9 $265.1 $71.6 $81.2 $86.2 $315.9 Adjusted operating margin 9.1% 9.2% 9.7% 10.4% 9.6% 9.7% 10.2% 10.2% 10.1% Operating income (loss) $43.4 ($2.3) $71.1 $73.0 $185.2 $64.9 $67.0 $65.8 $270.7 Depreciation and amortization 13.5 14.0 14.0 13.7 55.2 13.8 17.1 20.2 64.8 Stock-based compensation 5.0 5.0 5.6 4.3 19.9 5.3 4.3 3.7 17.6 Acquisition and integration expenses 5.0 3.2 3.5 (0.9) 10.8 2.4 8.1 7.5 17.1 Impairment charge related to product line exit - - - - - - - 4.9 4.9 Severance charges - - - - - 1.0 - - 1.0 Russian bankruptcy court judgment (reversal) - - (11.1) - (11.1) - - - - Government COVID-related subsidy liability reversal - - - 0.8 0.8 (0.7) - - 0.1 Investigation costs 5.0 - - - 5.0 - - - - Contract termination benefit 3.2 - (3.0) - 0.2 - - - - FCPA settlement and Investigation costs - 59.2 1.1 - 60.3 - - - - Gain related to sale of joint venture (1.4) (0.7) - - (2.1) - - - - Adjusted EBITDA $73.7 $78.4 $81.2 $90.9 $324.2 $86.7 $96.5 $102.1 $376.2 Adjusted EBITDA margin 11.3% 11.4% 12.0% 12.4% 11.8% 11.7% 12.1% 12.1% 12.1% Consolidated Three months ended Three months ended