Exhibit 99.2
| Q1 2026 SUPPLEMENTAL exhibit 99.2 |

| T ble of 2 Q1 2026 Earnings Release p. 3 Capitalization p. 10 Debt Summary p. 11 Capital Investments p. 12 Portfolio Summary p. 13 Seaport NYC Detail p. 14 Seaport NYC Leasing or Programming Activity p. 15 2026 Statement of Operations p. 1 6 2025 Statement of Operations p. 1 7 Statement of Operations YoY Change p. 1 8 Q1 2026 Segment Operating EBITDA p. 19 Q1 2025 Segment Operating EBITDA p. 2 0 Q1 Segment Operating EBITDA YoY Change p. 2 1 Asset Based Value Components p. 2 2 Contact Information p. 2 3 Safe Harbor and Key Terms and References p. 2 4 |
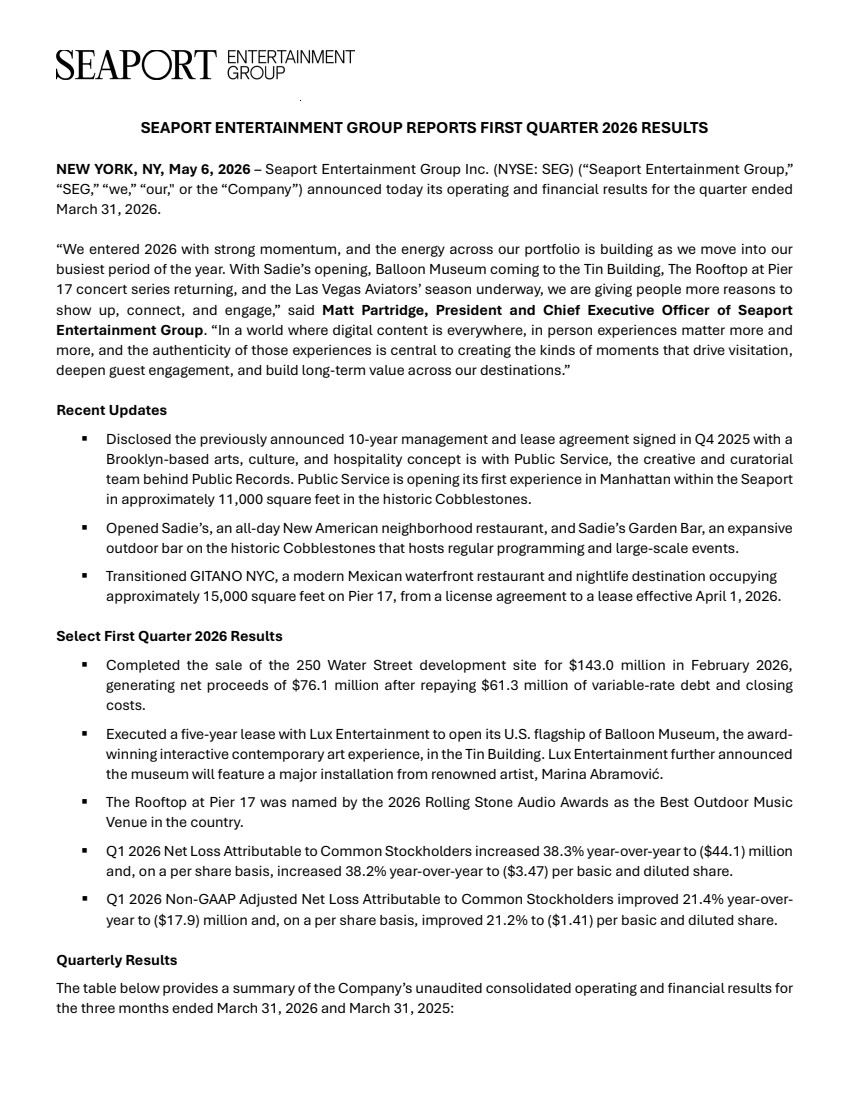
| SEAPORT ENTERTAINMENT GROUP REPORTS FIRST QUARTER 2026 RESULTS NEW YORK, NY, May 6, 2026 – Seaport Entertainment Group Inc. (NYSE: SEG) (“Seaport Entertainment Group,” “SEG,” “we,” “our," or the “Company”) announced today its operating and financial results for the quarter ended March 31, 2026. “We entered 2026 with strong momentum, and the energy across our portfolio is building as we move into our busiest period of the year. With Sadie’s opening, Balloon Museum coming to the Tin Building, The Rooftop at Pier 17 concert series returning, and the Las Vegas Aviators’ season underway, we are giving people more reasons to show up, connect, and engage,” said Matt Partridge, President and Chief Executive Officer of Seaport Entertainment Group. “In a world where digital content is everywhere, in person experiences matter more and more, and the authenticity of those experiences is central to creating the kinds of moments that drive visitation, deepen guest engagement, and build long-term value across our destinations.” Recent Updates Disclosed the previously announced 10-year management and lease agreement signed in Q4 2025 with a Brooklyn-based arts, culture, and hospitality concept is with Public Service, the creative and curatorial team behind Public Records. Public Service is opening its first experience in Manhattan within the Seaport in approximately 11,000 square feet in the historic Cobblestones. Opened Sadie’s, an all-day New American neighborhood restaurant, and Sadie’s Garden Bar, an expansive outdoor bar on the historic Cobblestones that hosts regular programming and large-scale events. Transitioned GITANO NYC, a modern Mexican waterfront restaurant and nightlife destination occupying approximately 15,000 square feet on Pier 17, from a license agreement to a lease effective April 1, 2026. Select First Quarter 2026 Results Completed the sale of the 250 Water Street development site for $143.0 million in February 2026, generating net proceeds of $76.1 million after repaying $61.3 million of variable-rate debt and closing costs. Executed a five-year lease with Lux Entertainment to open its U.S. flagship of Balloon Museum, the award-winning interactive contemporary art experience, in the Tin Building. Lux Entertainment further announced the museum will feature a major installation from renowned artist, Marina Abramović. The Rooftop at Pier 17 was named by the 2026 Rolling Stone Audio Awards as the Best Outdoor Music Venue in the country. Q1 2026 Net Loss Attributable to Common Stockholders increased 38.3% year-over-year to ($44.1) million and, on a per share basis, increased 38.2% year-over-year to ($3.47) per basic and diluted share. Q1 2026 Non-GAAP Adjusted Net Loss Attributable to Common Stockholders improved 21.4% year-over-year to ($17.9) million and, on a per share basis, improved 21.2% to ($1.41) per basic and diluted share. Quarterly Results The table below provides a summary of the Company’s unaudited consolidated operating and financial results for the three months ended March 31, 2026 and March 31, 2025: |
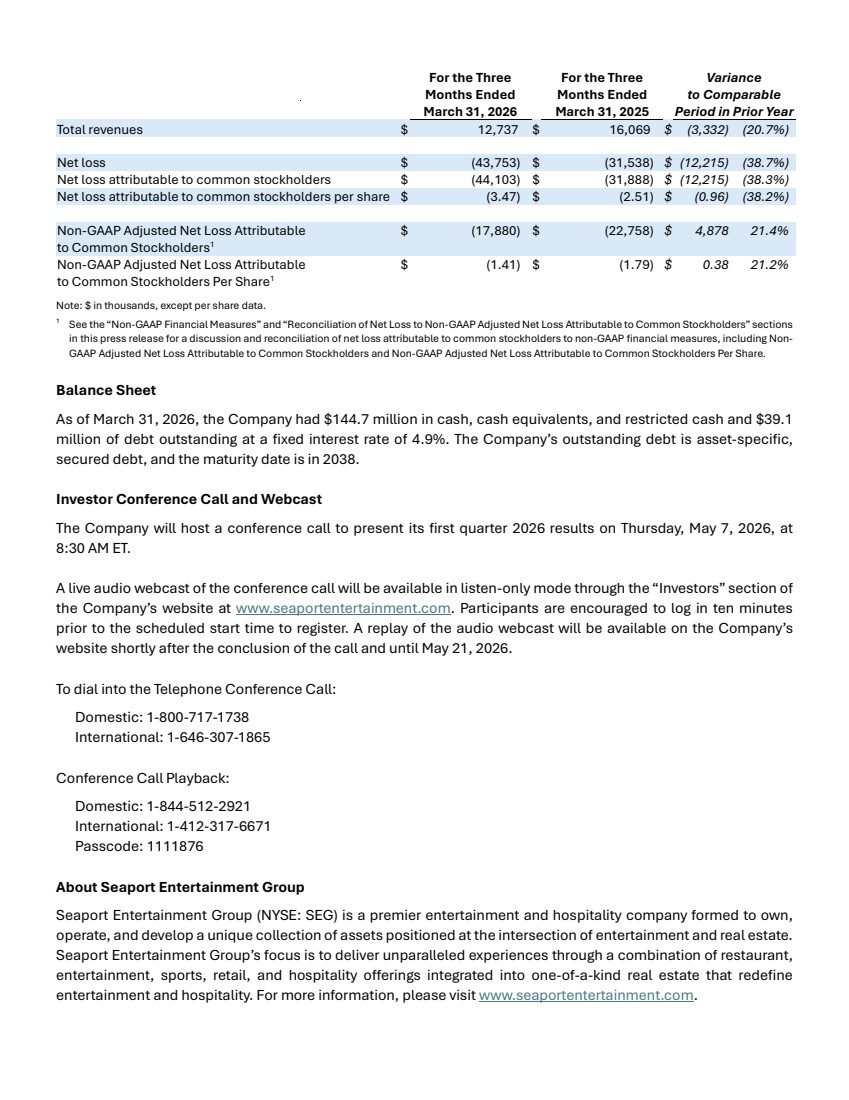
| For the Three Months Ended March 31, 2026 For the Three Months Ended March 31, 2025 Variance to Comparable Period in Prior Year Total revenues $ 12,737 $ 16,069 $ (3,332) (20.7%) Net loss $ (43,753) $ (31,538) $ (12,215) (38.7%) Net loss attributable to common stockholders $ (44,103) $ (31,888) $ (12,215) (38.3%) Net loss attributable to common stockholders per share $ (3.47) $ (2.51) $ (0.96) (38.2%) Non-GAAP Adjusted Net Loss Attributable to Common Stockholders1 $ (17,880) $ (22,758) $ 4,878 21.4% Non-GAAP Adjusted Net Loss Attributable to Common Stockholders Per Share1 $ (1.41) $ (1.79) $ 0.38 21.2% Note: $ in thousands, except per share data. 1 See the “Non-GAAP Financial Measures” and “Reconciliation of Net Loss to Non-GAAP Adjusted Net Loss Attributable to Common Stockholders” sections in this press release for a discussion and reconciliation of net loss attributable to common stockholders to non-GAAP financial measures, including Non-GAAP Adjusted Net Loss Attributable to Common Stockholders and Non-GAAP Adjusted Net Loss Attributable to Common Stockholders Per Share. Balance Sheet As of March 31, 2026, the Company had $144.7 million in cash, cash equivalents, and restricted cash and $39.1 million of debt outstanding at a fixed interest rate of 4.9%. The Company’s outstanding debt is asset-specific, secured debt, and the maturity date is in 2038. Investor Conference Call and Webcast The Company will host a conference call to present its first quarter 2026 results on Thursday, May 7, 2026, at 8:30 AM ET. A live audio webcast of the conference call will be available in listen-only mode through the “Investors” section of the Company’s website at www.seaportentertainment.com. Participants are encouraged to log in ten minutes prior to the scheduled start time to register. A replay of the audio webcast will be available on the Company’s website shortly after the conclusion of the call and until May 21, 2026. To dial into the Telephone Conference Call: Domestic: 1-800-717-1738 International: 1-646-307-1865 Conference Call Playback: Domestic: 1-844-512-2921 International: 1-412-317-6671 Passcode: 1111876 About Seaport Entertainment Group Seaport Entertainment Group (NYSE: SEG) is a premier entertainment and hospitality company formed to own, operate, and develop a unique collection of assets positioned at the intersection of entertainment and real estate. Seaport Entertainment Group’s focus is to deliver unparalleled experiences through a combination of restaurant, entertainment, sports, retail, and hospitality offerings integrated into one-of-a-kind real estate that redefine entertainment and hospitality. For more information, please visit www.seaportentertainment.com. |
| Safe Harbor and Forward-Looking Statements This press release includes forward-looking statements within the meaning of the federal securities laws. Such forward-looking statements include, but are not limited to, statements concerning the Company’s plans, goals, objectives, outlook, expectations, and intentions. Forward-looking statements are based on the Company’s current expectations and involve risks and uncertainties that could cause actual results to differ materially from those expressed or implied in such forward-looking statements. Factors that could cause the Company’s results to differ materially from current expectations include, but are not limited to: risks related to macroeconomic conditions; risks related to the impact of tariffs and global trade disruptions on the Company and its tenants, including impacts on inflation, interest rates, supply chains and consumer sentiment and spending; changes in discretionary consumer spending patterns or consumer tastes or preferences; risks associated with the Company’s investments in real estate assets and trends in the real estate industry; the Company’s ability to obtain operating and development capital on favorable terms, or at all; the availability of debt and equity capital; the Company’s ability to renew its leases or re-lease available space; the Company’s ability to compete effectively; the impact of uncertainty around, and disruptions to, the Company’s supply chain; risks related to the concentration of the Company’s properties and operations in New York City and the Las Vegas area; social, political and economic instability, unrest and other circumstances beyond the Company’s control which could adversely affect the Company’s business operations; adverse changes in laws or regulations governing the Company’s operation, changes in the interpretation thereof, or newly enacted laws or regulations could require changes to the Company’s business practices, adversely impact the Company’s revenues and/or impose additional costs on the Company; extreme weather conditions or climate change that may cause property damage or interrupt business; the impact of water and electricity shortages on the Company’s business; the Company’s ability to successfully identify, acquire, develop, and manage properties on terms that are favorable to it; the contamination of the Company’s properties by hazardous or toxic substances; catastrophic events or geopolitical conditions that may disrupt the Company’s business; actual or threatened terrorist activity and other acts of violence, or the perception of a heightened threat of such events; losses that are not insured or that exceed the applicable insurance limits; risks related to the disruption or failure of information technology networks and related systems – both the Company’s and those operated and managed by third parties; the Company’s ability to attract and retain key personnel; the Company’s inability to control certain properties due to the joint ownership of such property and inability to successfully attract desirable strategic partners, including joint venture partners; risks related to the concentration of ownership of the Company’s common stock by Pershing Square; risks related to the Company’s separation from, and relationship with, Howard Hughes Holdings Inc. (“Howard Hughes”); and the other factors detailed in the Company’s filings with the SEC. Forward-looking statements speak only as of the date of this press release. The Company is under no obligation to publicly update or revise and forward-looking statements, whether as a result of new information, future events or otherwise, except as required by applicable law. Non-GAAP Financial Measures Our reported results are presented in accordance with accounting principles generally accepted in the United States of America (“GAAP”). We also disclose Non-GAAP Adjusted Net Loss Attributable to Common Stockholders and Non-GAAP Adjusted Net Loss Attributable to Common Stockholders Per Share, each of which are non-GAAP financial measures. We believe these non-GAAP financial measures are useful to investors because they provide a meaningful supplement to the Company’s operating performance and period-over-period changes without regard to certain potential distortions or certain non-cash items. |
| Non-GAAP Adjusted Net Loss Attributable to Common Stockholders and Non-GAAP Adjusted Net Loss Attributable to Common Stockholders Per Share do not represent cash generated from operating activities and are not necessarily indicative of cash available to fund cash requirements. Accordingly, they should not be considered alternatives to net loss as a performance measure or cash flows from operating activities as reported on our statement of cash flows as a liquidity measure and should be considered in addition to, and not in lieu of, GAAP financial measures. To derive Non-GAAP Adjusted Net Loss Attributable to Common Stockholders, GAAP net loss attributable to common stockholders is adjusted to exclude depreciation and amortization, as well as gains and losses from the sale of assets, gains or losses on extinguishment of debt, and provisions for impairment, and these adjustments include the pro rata share of such adjustments of unconsolidated subsidiaries. Additionally, adjustments are made for non-cash revenues and expenses such as straight-line rental revenue and expenses, amortization of above- and below-market lease related intangibles, and non-cash compensation; other non-recurring items such as termination fees, leadership transition costs, corporate restructuring costs, and legal settlements; and certain capitalized items such as capitalized interest. Please see the reconciliation table provided in this press release for a reconciliation of Non-GAAP Adjusted Net Loss Attributable to Common Stockholders and Non-GAAP Adjusted Net Loss Attributable to Common Stockholders Per Share to the most directly comparable GAAP measure of net loss. Availability of Information on SEG’s Website and Social Media Channels Investors and others should note that SEG routinely announces material information to investors and the marketplace using SEC filings, press releases, public conference calls, webcasts and the SEG Investor Relations website. The Company uses these channels as well as social media channels (e.g., LinkedIn www.linkedin.com/company/new-york-seaportentertainment) as a means of disclosing information about the Company's business to our customers, employees, investors, and the public. While not all of the information that the Company posts to the SEG Investor Relations website or on the Company's social media channels is of a material nature, some information could be deemed to be material. Accordingly, the Company encourages investors, the media, and others interested in SEG to review the information that it shares through its website and on the Company's social media channels. Users may automatically receive email alerts and other information about the Company when enrolling an email address by visiting "Email Alerts" in the "Resources" section of the SEG Investor Relations website at https://ir.seaportentertainment.com/resources/email-alerts. The contents of these websites are not incorporated by reference into this press release or any report or document SEG files with the SEC, and any references to the websites are intended to be inactive textual references only. Contacts: Investor Relations: Seaport Entertainment Group Inc. T: (212) 732-8257 ir@seaportentertainment.com Media Relations: media@seaportentertainment.com |
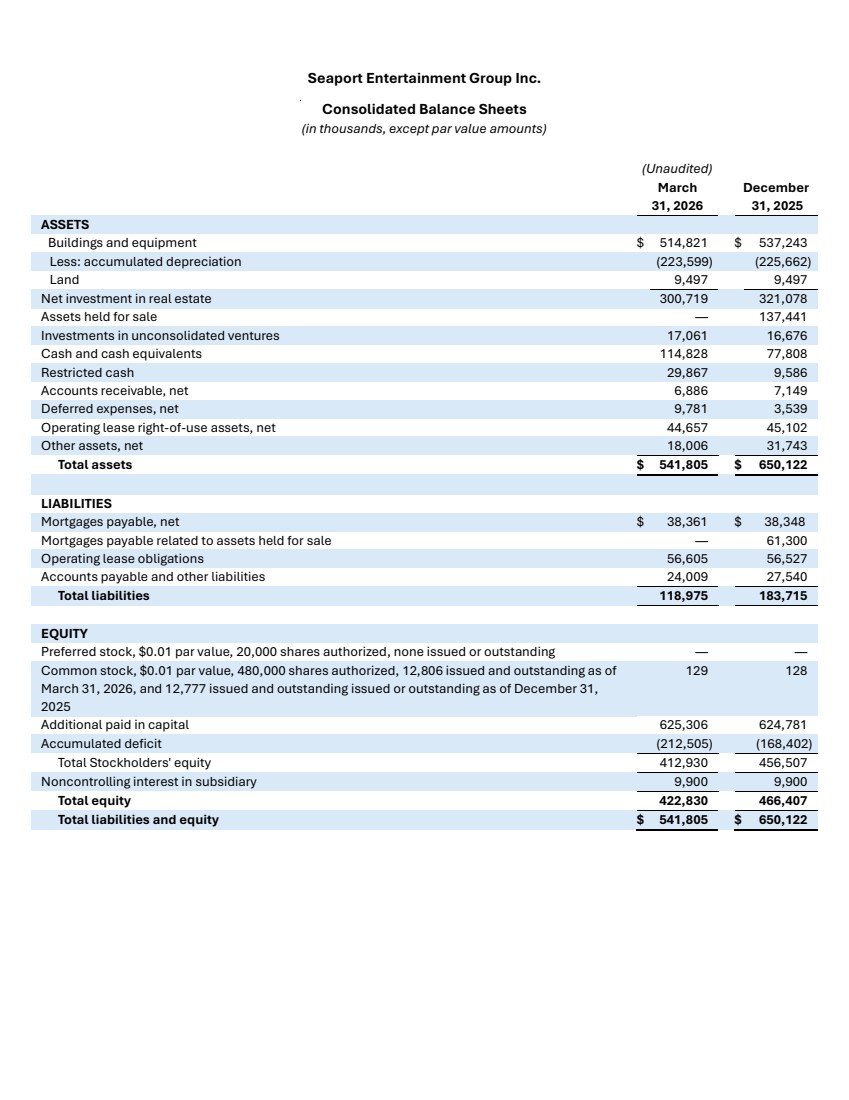
| Seaport Entertainment Group Inc. Consolidated Balance Sheets (in thousands, except par value amounts) (Unaudited) March 31, 2026 December 31, 2025 ASSETS Buildings and equipment $ 514,821 $ 537,243 Less: accumulated depreciation (223,599) (225,662) Land 9,497 9,497 Net investment in real estate 300,719 321,078 Assets held for sale — 137,441 Investments in unconsolidated ventures 17,061 16,676 Cash and cash equivalents 114,828 77,808 Restricted cash 29,867 9,586 Accounts receivable, net 6,886 7,149 Deferred expenses, net 9,781 3,539 Operating lease right-of-use assets, net 44,657 45,102 Other assets, net 18,006 31,743 Total assets $ 541,805 $ 650,122 LIABILITIES Mortgages payable, net $ 38,361 $ 38,348 Mortgages payable related to assets held for sale — 61,300 Operating lease obligations 56,605 56,527 Accounts payable and other liabilities 24,009 27,540 Total liabilities 118,975 183,715 EQUITY Preferred stock, $0.01 par value, 20,000 shares authorized, none issued or outstanding — — Common stock, $0.01 par value, 480,000 shares authorized, 12,806 issued and outstanding as of March 31, 2026, and 12,777 issued and outstanding issued or outstanding as of December 31, 2025 129 128 Additional paid in capital 625,306 624,781 Accumulated deficit (212,505) (168,402) Total Stockholders' equity 412,930 456,507 Noncontrolling interest in subsidiary 9,900 9,900 Total equity 422,830 466,407 Total liabilities and equity $ 541,805 $ 650,122 |
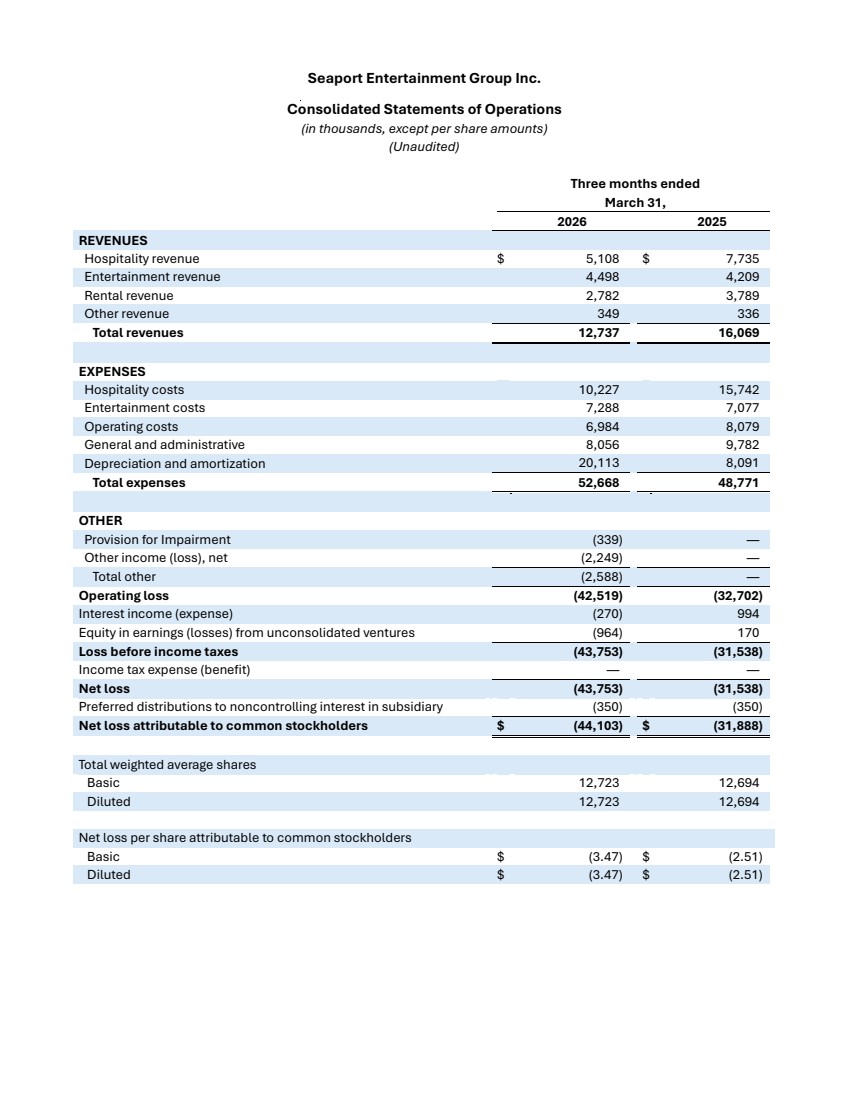
| Seaport Entertainment Group Inc. Consolidated Statements of Operations (in thousands, except per share amounts) (Unaudited) Three months ended March 31, 2026 2025 REVENUES Hospitality revenue $ 5,108 $ 7,735 Entertainment revenue 4,498 4,209 Rental revenue 2,782 3,789 Other revenue 349 336 Total revenues 12,737 16,069 EXPENSES Hospitality costs 10,227 15,742 Entertainment costs 7,288 7,077 Operating costs 6,984 8,079 General and administrative 8,056 9,782 Depreciation and amortization 20,113 8,091 Total expenses 52,668 48,771 OTHER Provision for Impairment (339) — Other income (loss), net (2,249) — Total other (2,588) — Operating loss (42,519) (32,702) Interest income (expense) (270) 994 Equity in earnings (losses) from unconsolidated ventures (964) 170 Loss before income taxes (43,753) (31,538) Income tax expense (benefit) — — Net loss (43,753) (31,538) Preferred distributions to noncontrolling interest in subsidiary (350) (350) Net loss attributable to common stockholders $ (44,103) $ (31,888) Total weighted average shares Basic 12,723 12,694 Diluted 12,723 12,694 Net loss per share attributable to common stockholders Basic $ (3.47) $ (2.51) Diluted $ (3.47) $ (2.51) |
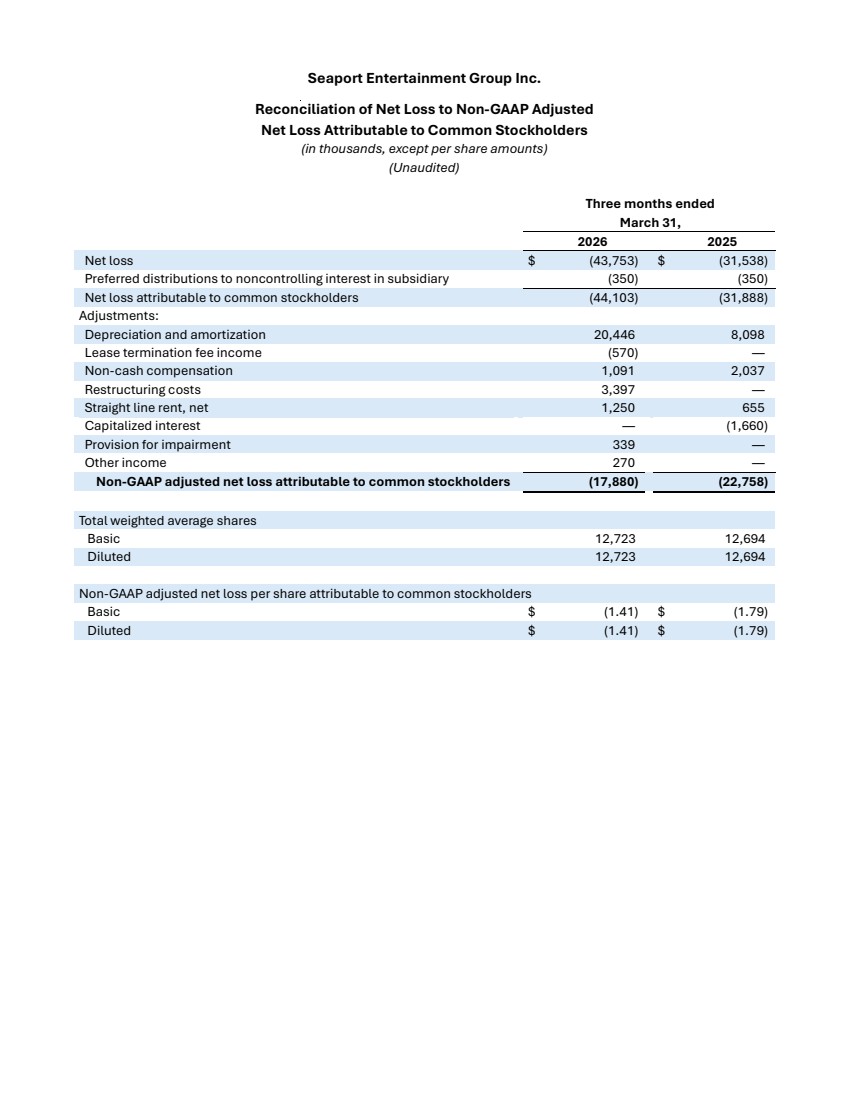
| Seaport Entertainment Group Inc. Reconciliation of Net Loss to Non-GAAP Adjusted Net Loss Attributable to Common Stockholders (in thousands, except per share amounts) (Unaudited) Three months ended March 31, 2026 2025 Net loss $ (43,753) $ (31,538) Preferred distributions to noncontrolling interest in subsidiary (350) (350) Net loss attributable to common stockholders (44,103) (31,888) Adjustments: Depreciation and amortization 20,446 8,098 Lease termination fee income (570) — Non-cash compensation 1,091 2,037 Restructuring costs 3,397 — Straight line rent, net 1,250 655 Capitalized interest — (1,660) Provision for impairment 339 — Other income 270 — Non-GAAP adjusted net loss attributable to common stockholders (17,880) (22,758) Total weighted average shares Basic 12,723 12,694 Diluted 12,723 12,694 Non-GAAP adjusted net loss per share attributable to common stockholders Basic $ (1.41) $ (1.79) Diluted $ (1.41) $ (1.79) |
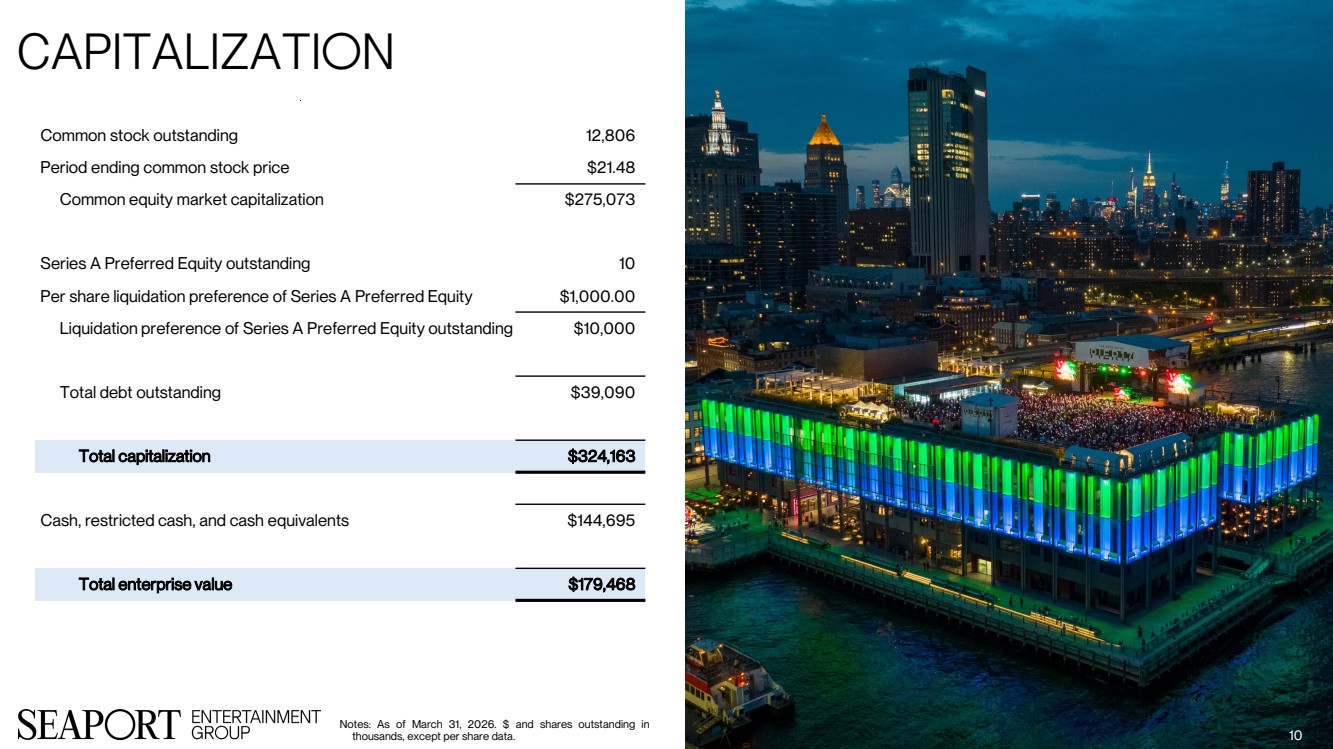
| Common stock outstanding 12,806 Period ending common stock price $21.48 Common equity market capitalization $275,073 Series A Preferred Equity outstanding 10 Per share liquidation preference of Series A Preferred Equity $1,000.00 Liquidation preference of Series A Preferred Equity outstanding $10,000 Total debt outstanding $39,090 Total capitalization $324,163 Cash, restricted cash, and cash equivalents $144,695 Total enterprise value $179,468 Capita 10 Notes: As of March 31, 2026. $ and shares outstanding in thousands, except per share data. |
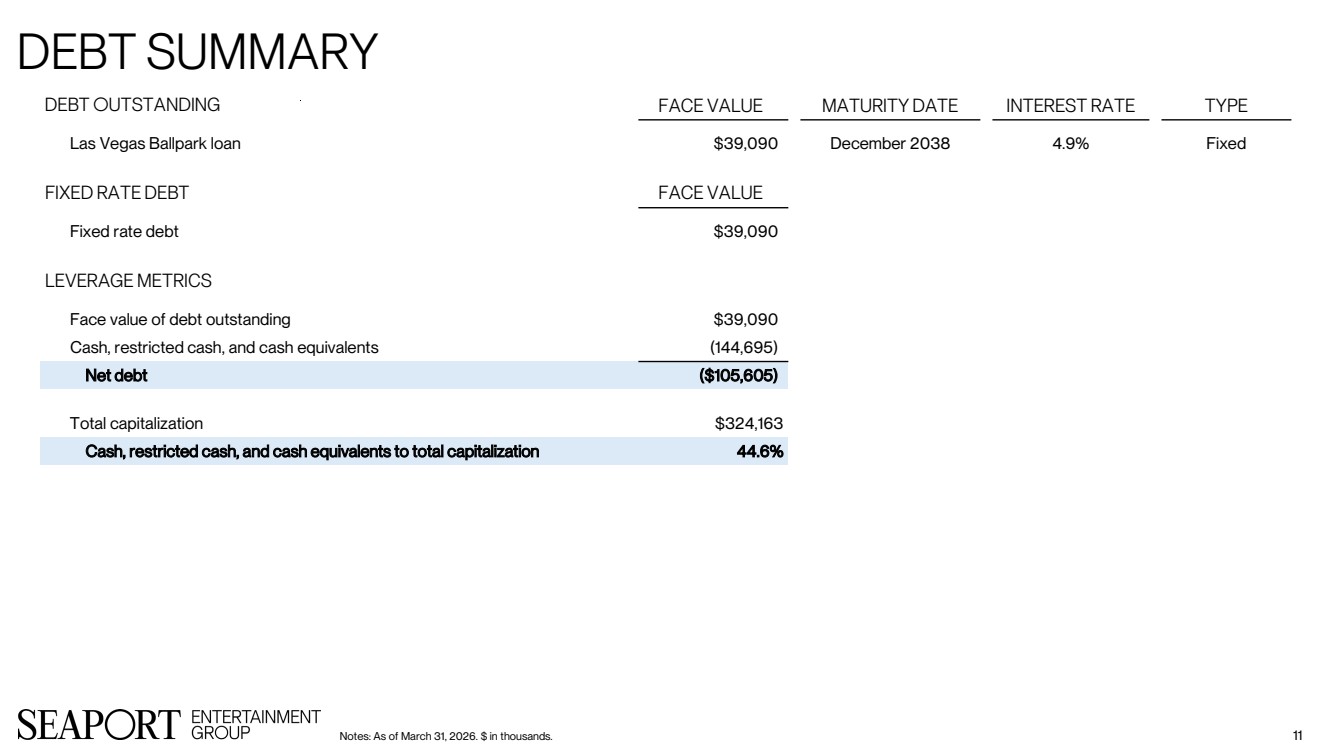
| Debt 11 Debt Otstandig ac Las Vegas Ballpark loan $39,090 December 2038 4.9% Fixed Fixe Rt Fixed rate debt $39,090 Leverag Face value of debt outstanding $39,090 Cash, restricted cash, and cash equivalents (144,695) Net debt ($105,605) Total capitalization $324,163 Cash, restricted cash, and cash equivalents to total capitalization 44.6% Notes: As of March 31, 2026. $ in thousands. |
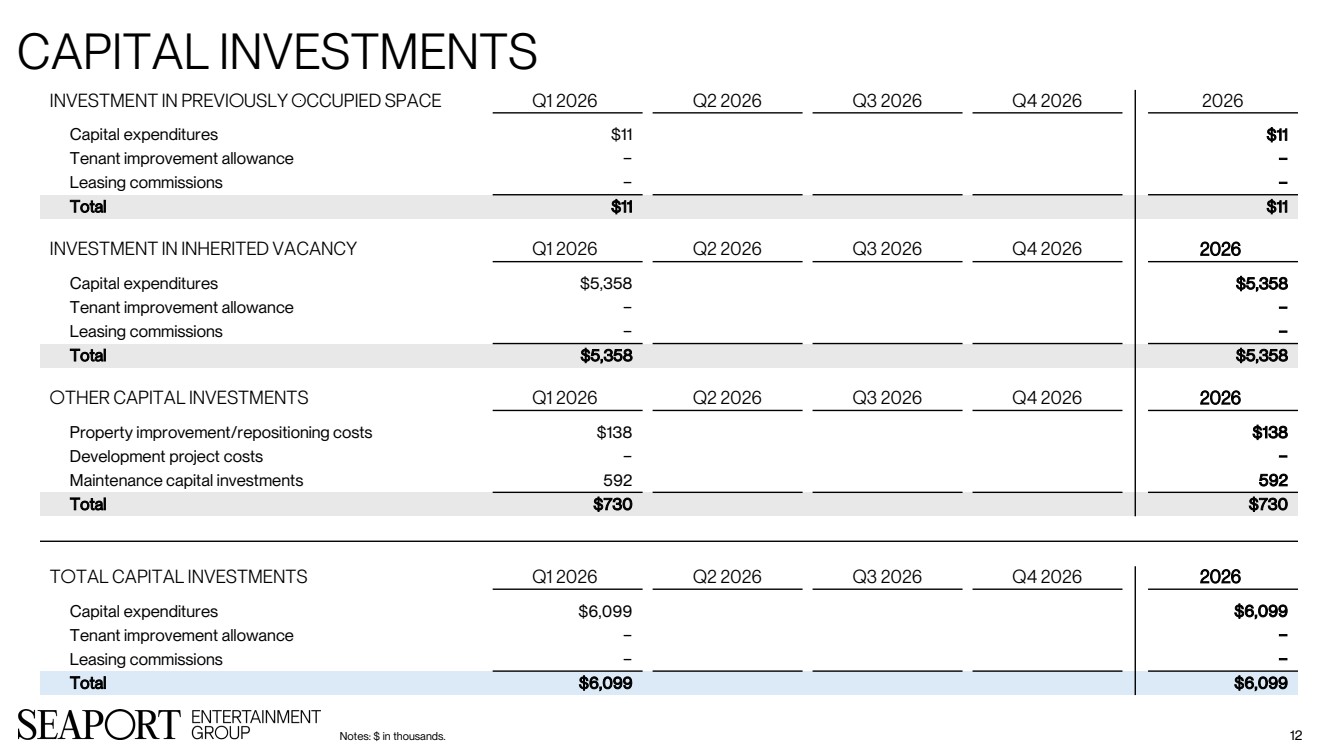
| Cap 12 Investment in Previously Occupied Space Q1 2026 Q2 Capital expenditures $11 $11 Tenant improvement allowance − − Leasing commissions − − Total $11 $11 Investment in Inherited Vacancy Q1 2026 Q2 2026 Capital expenditures $5,358 $5,358 Tenant improvement allowance − − Leasing commissions − − Total $5,358 $5,358 Other apital Investments Q1 2026 Q2 2026 Q Property improvement/repositioning costs $138 $138 Development project costs − − Maintenance capital investments 592 592 Total $730 $730 Total Capital investments Q1 2026 Q2 2026 Q3 Capital expenditures $6,099 $6,099 Tenant improvement allowance − − Leasing commissions − − Total $6,099 $6,099 Notes: $ in thousands. |
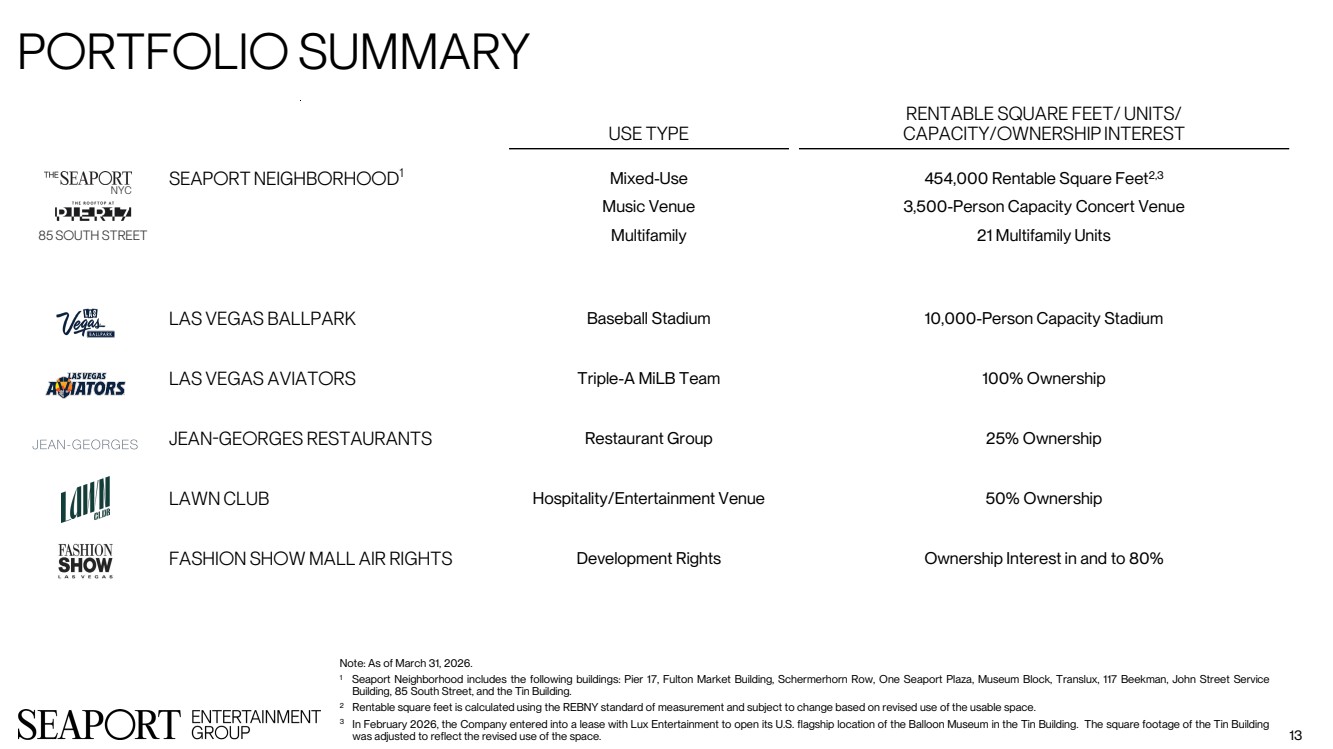
| Portfolio S 13 Note: As of March 31, 2026. 1 Seaport Neighborhood includes the following buildings: Pier 17, Fulton Market Building, Schermerhorn Row, One Seaport Plaza, Museum Block, Translux, 117 Beekman, John Street Service Building, 85 South Street, and the Tin Building. 2 Rentable square feet is calculated using the REBNY standard of measurement and subject to change based on revised use of the usable space. 3 In February 2026, the Company entered into a lease with Lux Entertainment to open its U.S. flagship location of the Balloon Museum in the Tin Building. The square footage of the Tin Building was adjusted to reflect the revised use of the space. USE Ty Rentable S Capacity/O Seaport Neighborhood1 Mixe Music Venue Multifamily 454,000 Rentable Square Feet2,3 3,500-Person Capacity Concert Venue 21 Multifamily Units Las Vegas Ballpark Baseball Stadium 10,000-Person Capac Las Vegas Aviators Triple-A MiLB Team 100% Jean-Georges Restaurants Restaurant Gr Lawn club Hospitality/Entertainment Venue 50% Owne Fashion Show Mall Air Rights Development Rights Ownership Interest in NY 85 South |
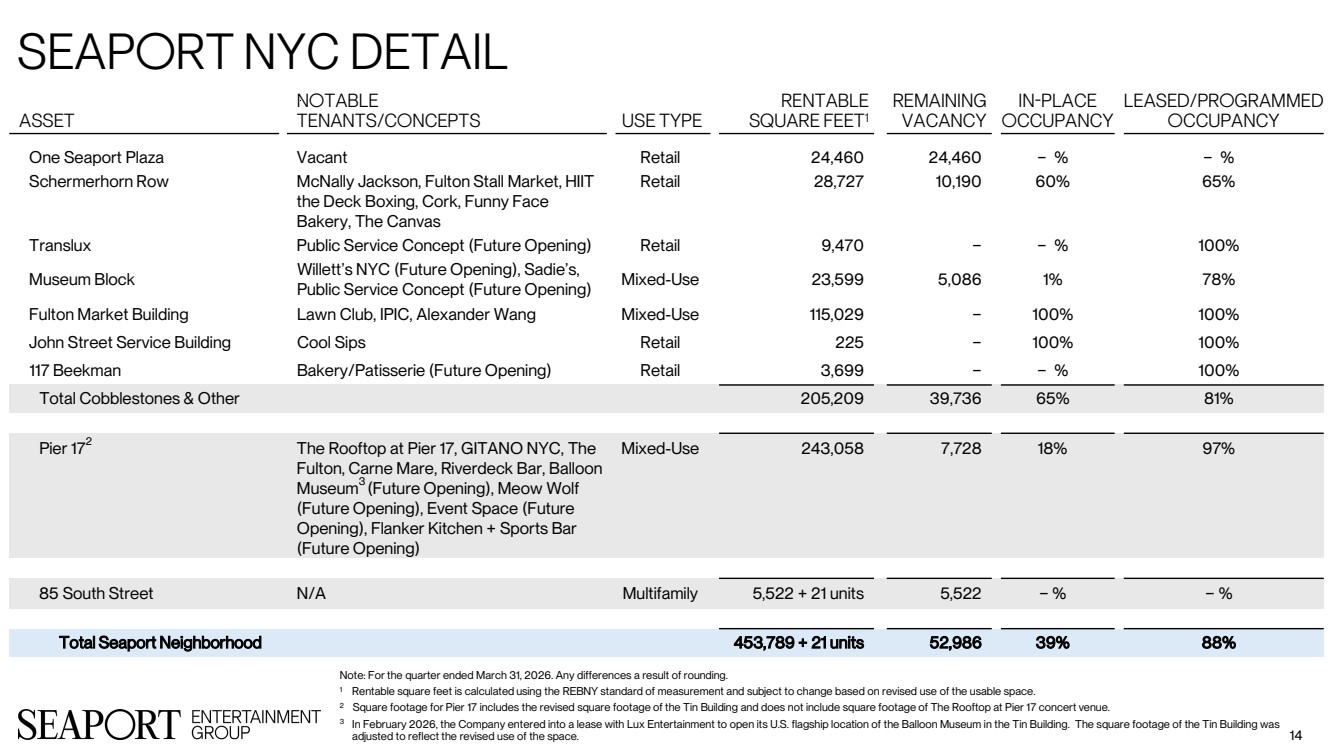
| Seaport 14 Note: For the quarter ended March 31, 2026. Any differences a result of rounding. 1 Rentable square feet is calculated using the REBNY standard of measurement and subject to change based on revised use of the usable space. 2 Square footage for Pier 17 includes the revised square footage of the Tin Building and does not include square footage of The Rooftop at Pier 17 concert venue. 3 In February 2026, the Company entered into a lease with Lux Entertainment to open its U.S. flagship location of the Balloon Museum in the Tin Building. The square footage of the Tin Building was adjusted to reflect the revised use of the space. A Not Tenants/Con RENTABL Squa Rema v In O Leased/Pro O One Seaport Plaza Vacant Retail 24,460 24,460 − % − % Schermerhorn Row McNally Jackson, Fulton Stall Market, HIIT the Deck Boxing, Cork, Funny Face Bakery, The Canvas Retail 28,727 10,190 60% 65% Translux Public Service Concept (Future Opening) Retail 9,470 − − % 100% Museum Block Willett’s NYC (Future Opening), Sadie’s, Public Service Concept (Future Opening) Mixed-Use 23,599 5,086 1% 78% Fulton Market Building Lawn Club, IPIC, Alexander Wang Mixed-Use 115,029 − 100% 100% John Street Service Building Cool Sips Retail 225 − 100% 100% 117 Beekman Bakery/Patisserie (Future Opening) Retail 3,699 − − % 100% Total Cobblestones & Other 205,209 39,736 65% 81% Pier 172 The Rooftop at Pier 17, GITANO NYC, The Fulton, Carne Mare, Riverdeck Bar, Balloon Museum3 (Future Opening), Meow Wolf (Future Opening), Event Space (Future Opening), Flanker Kitchen + Sports Bar (Future Opening) Mixed-Use 243,058 7,728 18% 97% 85 South Street N/A Multifamily 5,522 + 21 units 5,522 − % − % Total Seaport Neighborhood 453,789 + 21 units 52,986 39% 88% |
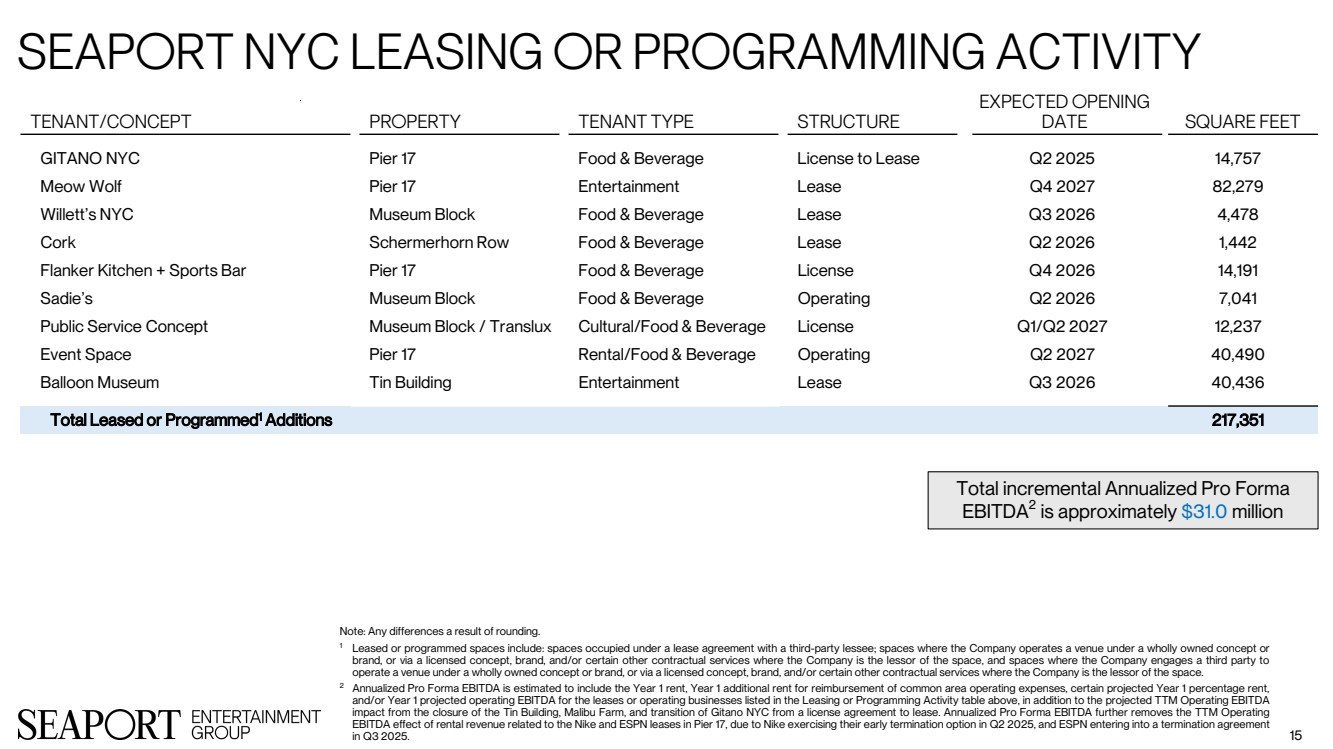
| Seaport NYC Leasing or p 15 Tenant/concept propert Expecte Date GITANO NYC Pier 17 Food & Beverage License to Lease Q2 2025 14,757 Meow Wolf Pier 17 Entertainment Lease Q4 2027 82,279 Willett’s NYC Museum Block Food & Beverage Lease Q3 2026 4,478 Cork Schermerhorn Row Food & Beverage Lease Q2 2026 1,442 Flanker Kitchen + Sports Bar Pier 17 Food & Beverage License Q4 2026 14,191 Sadie’s Museum Block Food & Beverage Operating Q2 2026 7,041 Public Service Concept Museum Block / Translux Cultural/Food & Beverage License Q1/Q2 2027 12,237 Event Space Pier 17 Rental/Food & Beverage Operating Q2 2027 40,490 Balloon Museum Tin Building Entertainment Lease Q3 2026 40,436 Total Leased or Programmed1 Additions 217,351 Note: Any differences a result of rounding. 1 Leased or programmed spaces include: spaces occupied under a lease agreement with a third-party lessee; spaces where the Company operates a venue under a wholly owned concept or brand, or via a licensed concept, brand, and/or certain other contractual services where the Company is the lessor of the space, and spaces where the Company engages a third party to operate a venue under a wholly owned concept or brand, or via a licensed concept, brand, and/or certain other contractual services where the Company is the lessor of the space. 2 Annualized Pro Forma EBITDA is estimated to include the Year 1 rent, Year 1 additional rent for reimbursement of common area operating expenses, certain projected Year 1 percentage rent, and/or Year 1 projected operating EBITDA for the leases or operating businesses listed in the Leasing or Programming Activity table above, in addition to the projected TTM Operating EBITDA impact from the closure of the Tin Building, Malibu Farm, and transition of Gitano NYC from a license agreement to lease. Annualized Pro Forma EBITDA further removes the TTM Operating EBITDA effect of rental revenue related to the Nike and ESPN leases in Pier 17, due to Nike exercising their early termination option in Q2 2025, and ESPN entering into a termination agreement in Q3 2025. Total incremental Annualized Pro Forma EBITDA2 is approximately $31.0 million |
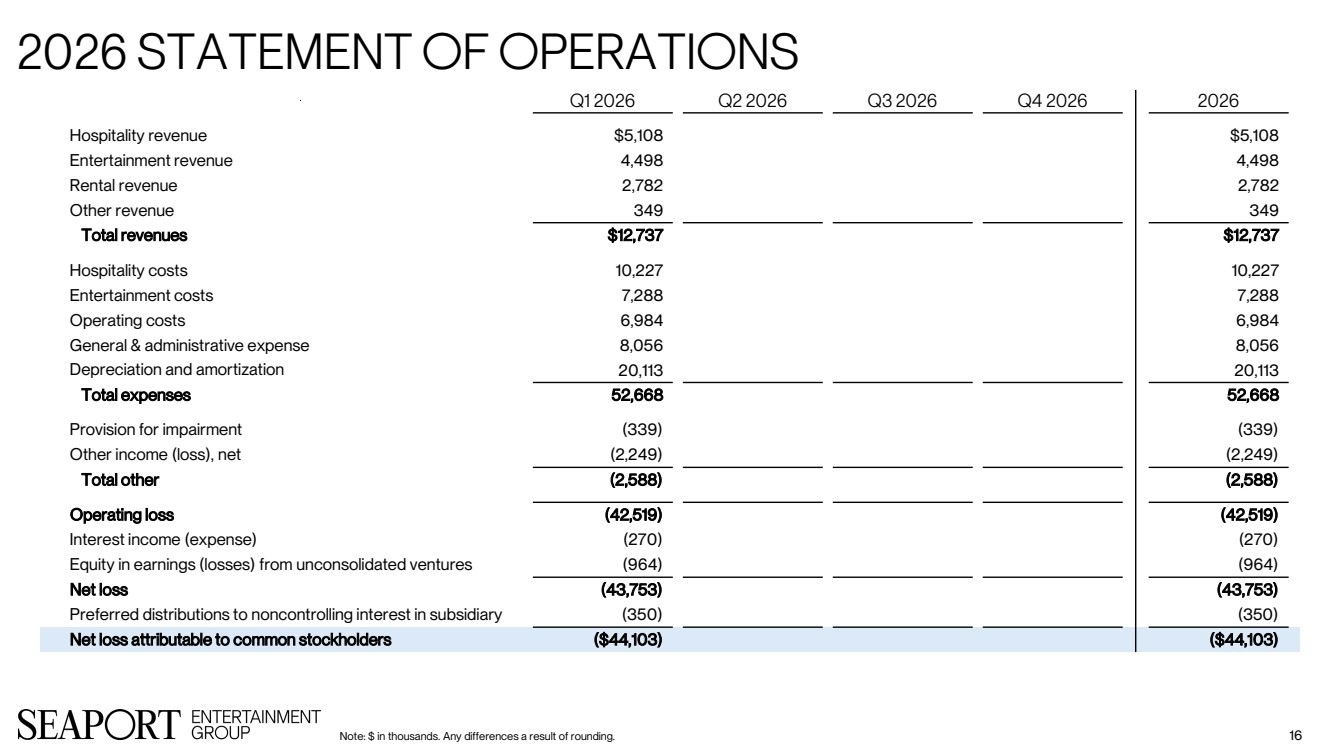
| 2026 Statemen Note: $ in thousands. Any differences a result of rounding. 16 Q1 2026 Q2 2026 Q3 2026 Q4 2026 2026 Hospitality revenue $5,108 $5,108 Entertainment revenue 4,498 4,498 Rental revenue 2,782 2,782 Other revenue 349 349 Total revenues $12,737 $12,737 Hospitality costs 10,227 10,227 Entertainment costs 7,288 7,288 Operating costs 6,984 6,984 General & administrative expense 8,056 8,056 Depreciation and amortization 20,113 20,113 Total expenses 52,668 52,668 Provision for impairment (339) (339) Other income (loss), net (2,249) (2,249) Total other (2,588) (2,588) Operating loss (42,519) (42,519) Interest income (expense) (270) (270) Equity in earnings (losses) from unconsolidated ventures (964) (964) Net loss (43,753) (43,753) Preferred distributions to noncontrolling interest in subsidiary (350) (350) Net loss attributable to common stockholders ($44,103) ($44,103) |
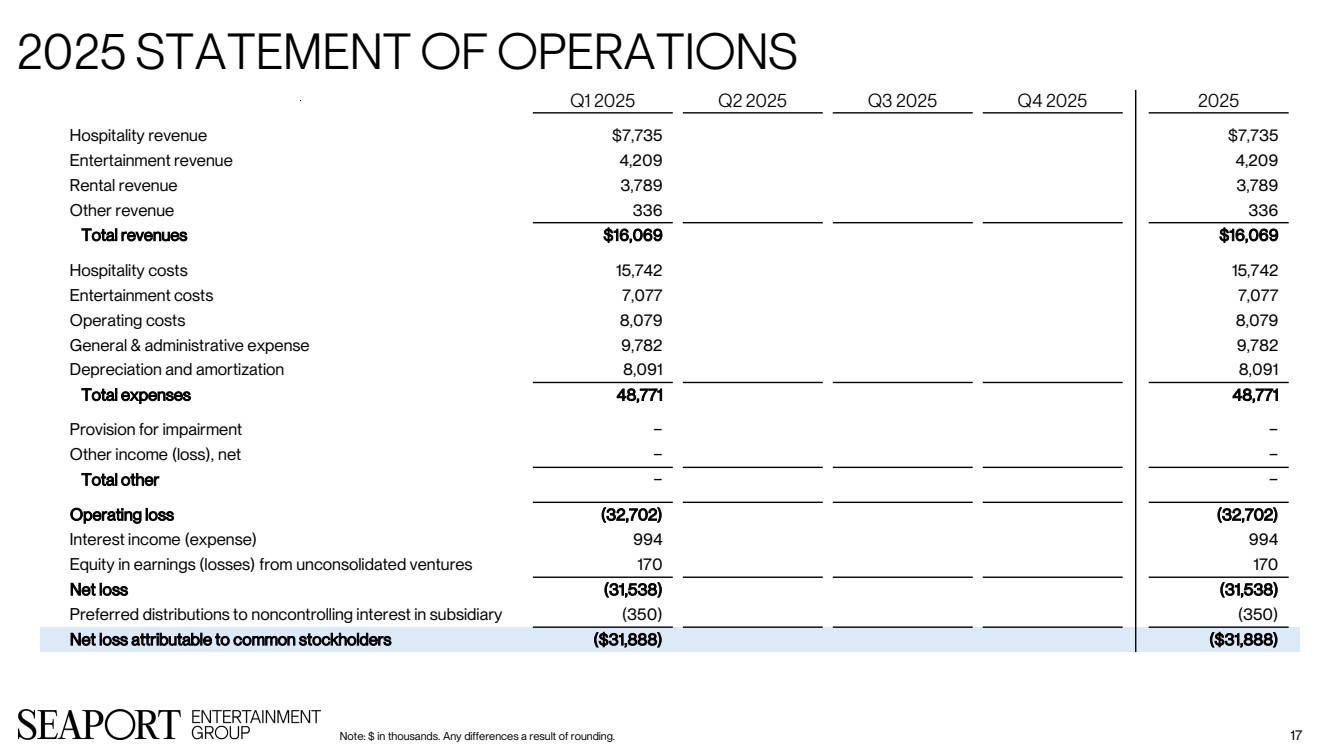
| 2025 Statemen Note: $ in thousands. Any differences a result of rounding. 17 Q1 2025 Q2 2025 Q3 2025 Q4 2025 2025 Hospitality revenue $7,735 $7,735 Entertainment revenue 4,209 4,209 Rental revenue 3,789 3,789 Other revenue 336 336 Total revenues $16,069 $16,069 Hospitality costs 15,742 15,742 Entertainment costs 7,077 7,077 Operating costs 8,079 8,079 General & administrative expense 9,782 9,782 Depreciation and amortization 8,091 8,091 Total expenses 48,771 48,771 Provision for impairment − − Other income (loss), net − − Total other − − Operating loss (32,702) (32,702) Interest income (expense) 994 994 Equity in earnings (losses) from unconsolidated ventures 170 170 Net loss (31,538) (31,538) Preferred distributions to noncontrolling interest in subsidiary (350) (350) Net loss attributable to common stockholders ($31,888) ($31,888) |
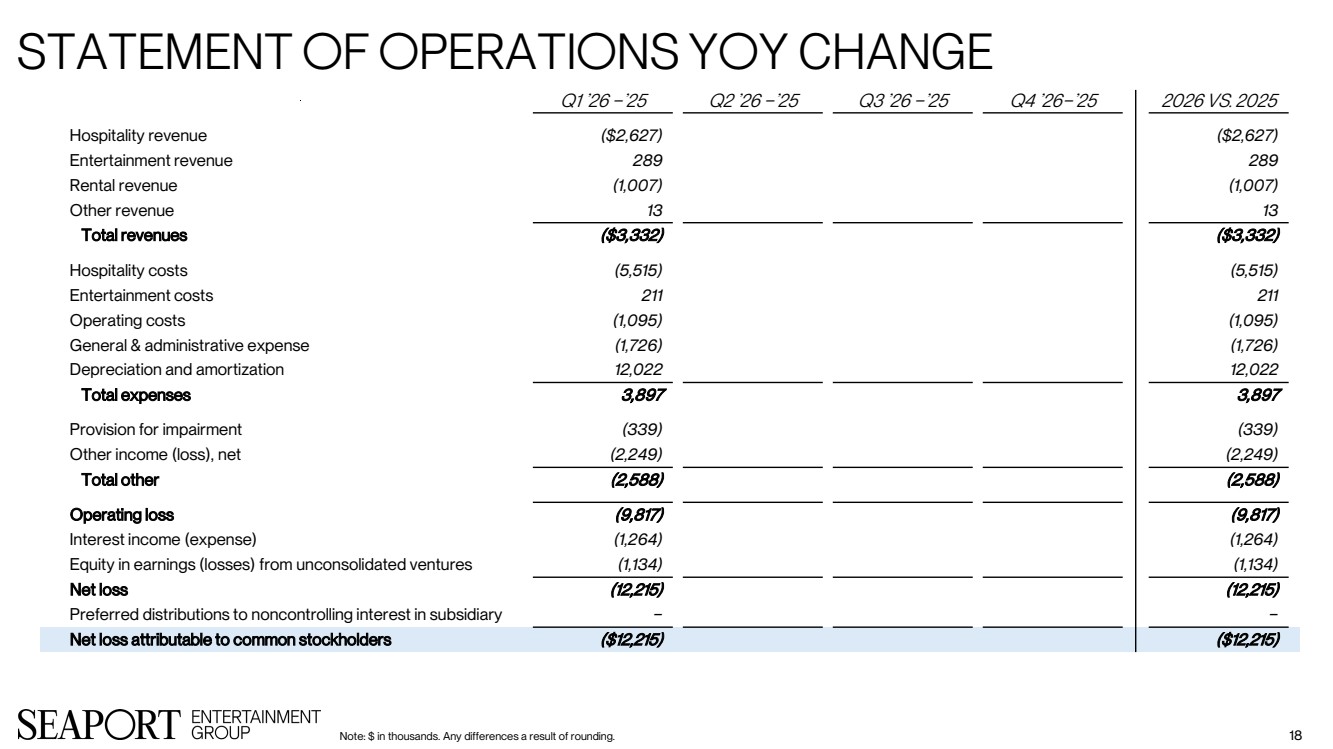
| Statementof O 18 Q1 ’26 −’25 Q2 ’26 −’25 Q3 ’26 −’25 Q4 ’26−’25 2026 vs. 20 Hospitality revenue ($2,627) ($2,627) Entertainment revenue 289 289 Rental revenue (1,007) (1,007) Other revenue 13 13 Total revenues ($3,332) ($3,332) Hospitality costs (5,515) (5,515) Entertainment costs 211 211 Operating costs (1,095) (1,095) General & administrative expense (1,726) (1,726) Depreciation and amortization 12,022 12,022 Total expenses 3,897 3,897 Provision for impairment (339) (339) Other income (loss), net (2,249) (2,249) Total other (2,588) (2,588) Operating loss (9,817) (9,817) Interest income (expense) (1,264) (1,264) Equity in earnings (losses) from unconsolidated ventures (1,134) (1,134) Net loss (12,215) (12,215) Preferred distributions to noncontrolling interest in subsidiary − − Net loss attributable to common stockholders ($12,215) ($12,215) Note: $ in thousands. Any differences a result of rounding. |
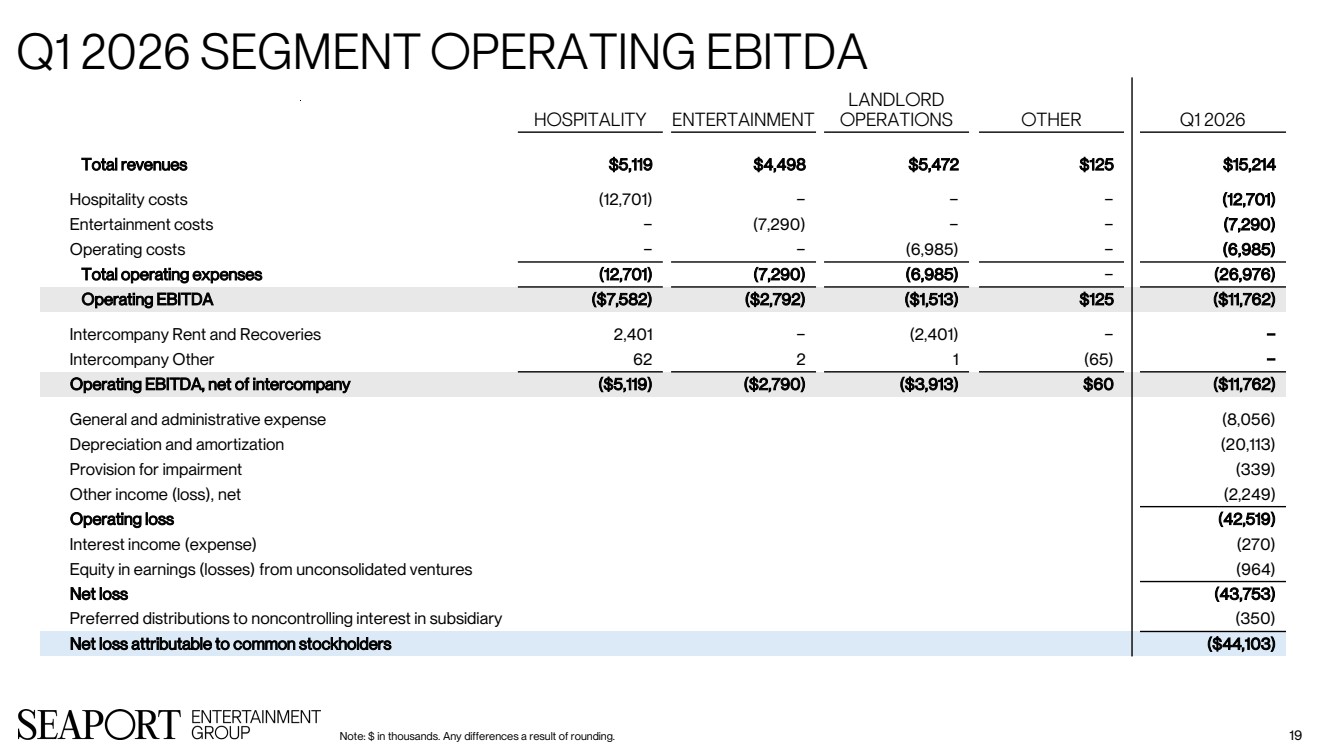
| Q1 2026 SEGMENT OPERATING 19 Hospital Landl Operations OTH Total revenues $5,119 $4,498 $5,472 $125 $15,214 Hospitality costs (12,701) − − − (12,701) Entertainment costs − (7,290) − − (7,290) Operating costs − − (6,985) − (6,985) Total operating expenses (12,701) (7,290) (6,985) − (26,976) Operating EBITDA ($7,582) ($2,792) ($1,513) $125 ($11,762) Intercompany Rent and Recoveries 2,401 − (2,401) − − Intercompany Other 62 2 1 (65) − Operating EBITDA, net of intercompany ($5,119) ($2,790) ($3,913) $60 ($11,762) General and administrative expense (8,056) Depreciation and amortization (20,113) Provision for impairment (339) Other income (loss), net (2,249) Operating loss (42,519) Interest income (expense) (270) Equity in earnings (losses) from unconsolidated ventures (964) Net loss (43,753) Preferred distributions to noncontrolling interest in subsidiary (350) Net loss attributable to common stockholders ($44,103) Note: $ in thousands. Any differences a result of rounding. |
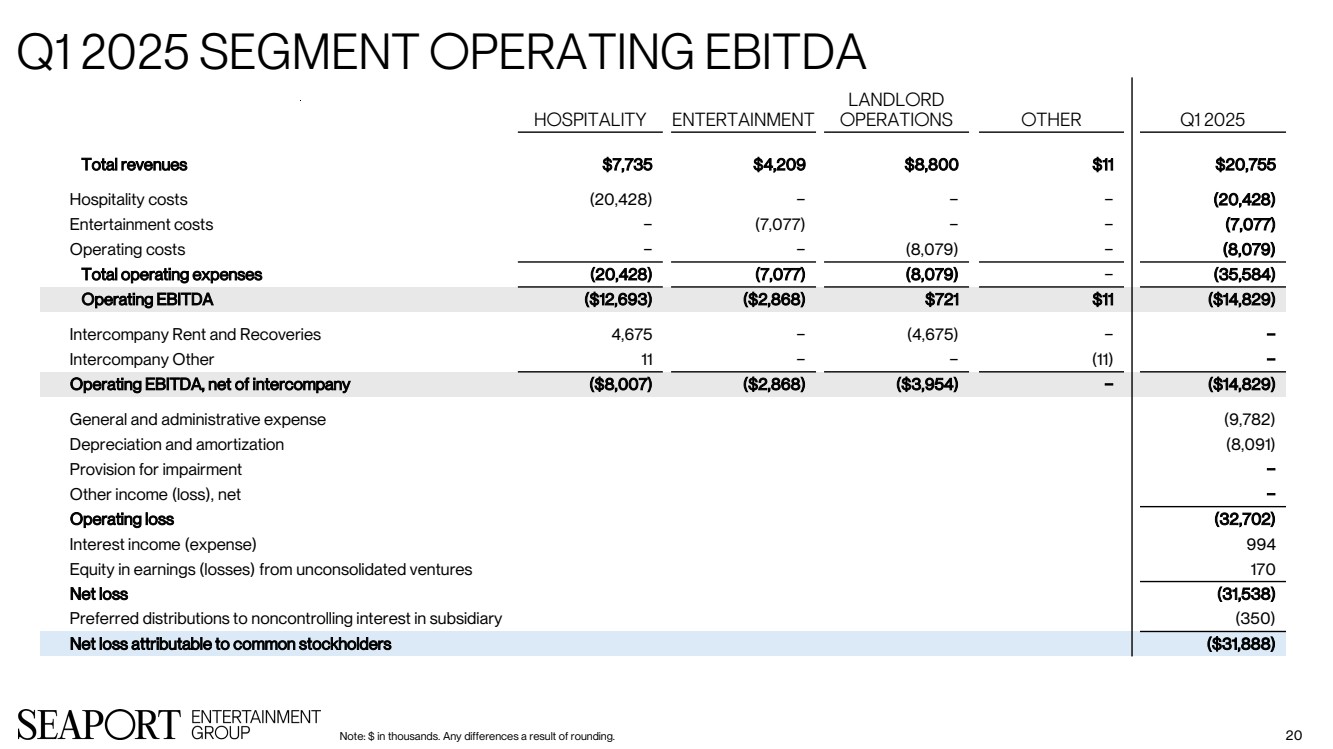
| Q1 2025 SEGMENT OPERATING 20 Hospital Landl Operations OTH Total revenues $7,735 $4,209 $8,800 $11 $20,755 Hospitality costs (20,428) − − − (20,428) Entertainment costs − (7,077) − − (7,077) Operating costs − − (8,079) − (8,079) Total operating expenses (20,428) (7,077) (8,079) − (35,584) Operating EBITDA ($12,693) ($2,868) $721 $11 ($14,829) Intercompany Rent and Recoveries 4,675 − (4,675) − − Intercompany Other 11 − − (11) − Operating EBITDA, net of intercompany ($8,007) ($2,868) ($3,954) − ($14,829) General and administrative expense (9,782) Depreciation and amortization (8,091) Provision for impairment − Other income (loss), net − Operating loss (32,702) Interest income (expense) 994 Equity in earnings (losses) from unconsolidated ventures 170 Net loss (31,538) Preferred distributions to noncontrolling interest in subsidiary (350) Net loss attributable to common stockholders ($31,888) Note: $ in thousands. Any differences a result of rounding. |
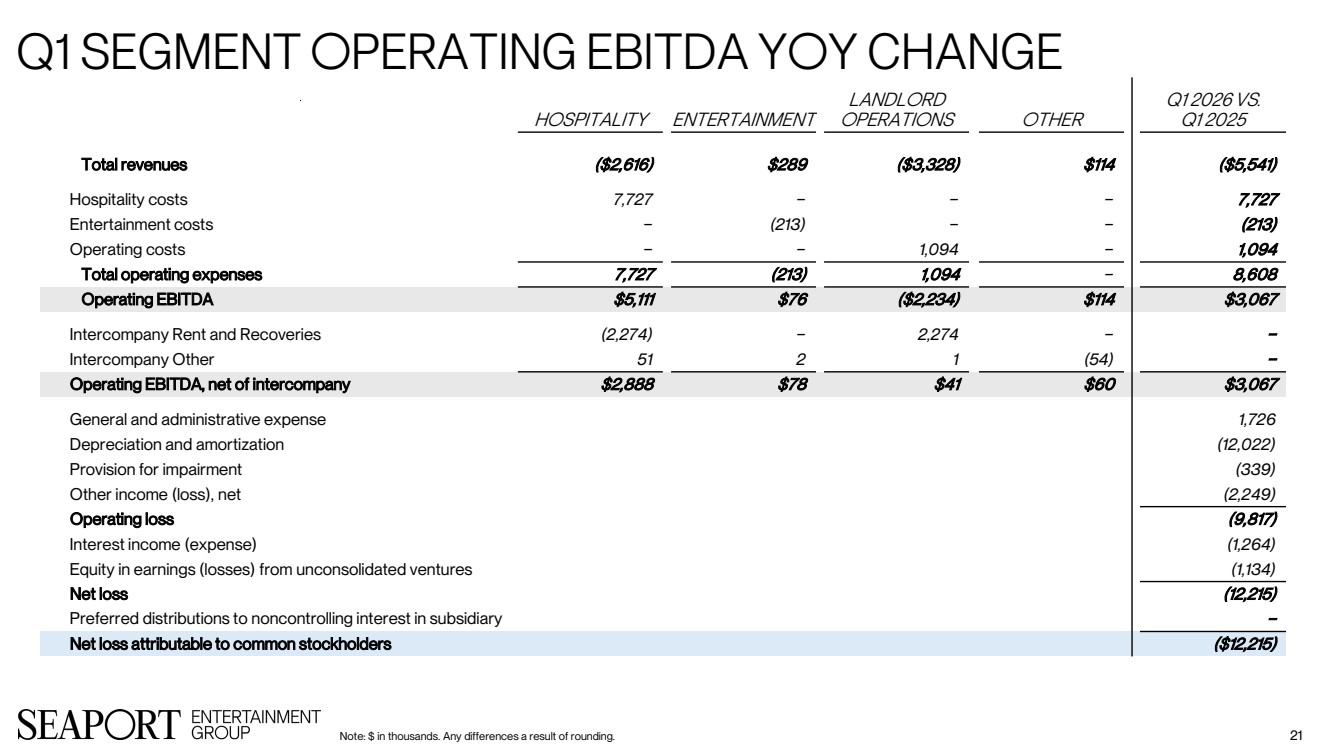
| Q1 SEGMENT OPERATINGEBITD 21 Hospital Landl Operat Q1 2026 VS. Q1 2025 Total revenues ($2,616) $289 ($3,328) $114 ($5,541) Hospitality costs 7,727 − − − 7,727 Entertainment costs − (213) − − (213) Operating costs − − 1,094 − 1,094 Total operating expenses 7,727 (213) 1,094 − 8,608 Operating EBITDA $5,111 $76 ($2,234) $114 $3,067 Intercompany Rent and Recoveries (2,274) − 2,274 − − Intercompany Other 51 2 1 (54) − Operating EBITDA, net of intercompany $2,888 $78 $41 $60 $3,067 General and administrative expense 1,726 Depreciation and amortization (12,022) Provision for impairment (339) Other income (loss), net (2,249) Operating loss (9,817) Interest income (expense) (1,264) Equity in earnings (losses) from unconsolidated ventures (1,134) Net loss (12,215) Preferred distributions to noncontrolling interest in subsidiary − Net loss attributable to common stockholders ($12,215) Note: $ in thousands. Any differences a result of rounding. |
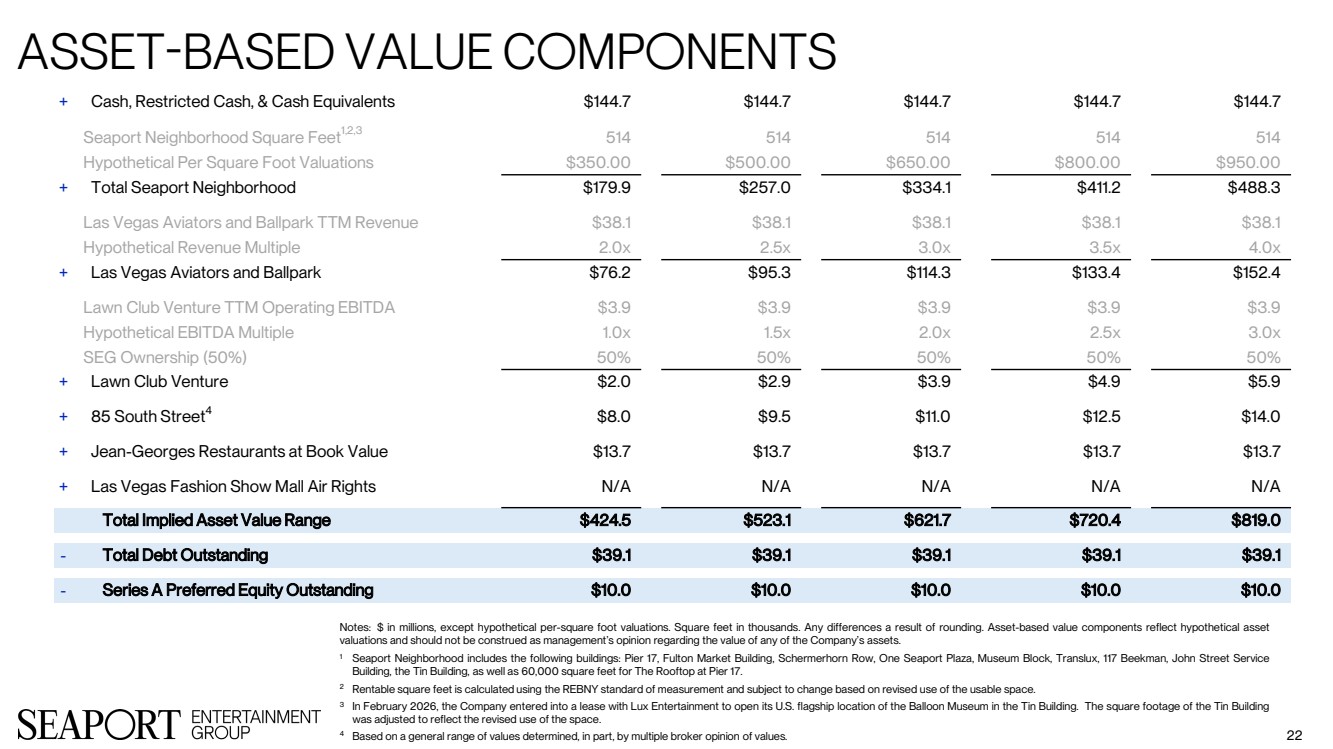
| Asset-Bas 22 + Cash, Restricted Cash, & Cash Equivalents $144.7 $144.7 $144.7 $144.7 $144.7 Seaport Neighborhood Square Feet1,2,3 514 514 514 514 514 Hypothetical Per Square Foot Valuations $350.00 $500.00 $650.00 $800.00 $950.00 + Total Seaport Neighborhood $179.9 $257.0 $334.1 $411.2 $488.3 Las Vegas Aviators and Ballpark TTM Revenue $38.1 $38.1 $38.1 $38.1 $38.1 Hypothetical Revenue Multiple 2.0x 2.5x 3.0x 3.5x 4.0x + Las Vegas Aviators and Ballpark $76.2 $95.3 $114.3 $133.4 $152.4 Lawn Club Venture TTM Operating EBITDA $3.9 $3.9 $3.9 $3.9 $3.9 Hypothetical EBITDA Multiple 1.0x 1.5x 2.0x 2.5x 3.0x SEG Ownership (50%) 50% 50% 50% 50% 50% + Lawn Club Venture $2.0 $2.9 $3.9 $4.9 $5.9 + 85 South Street4 $8.0 $9.5 $11.0 $12.5 $14.0 + Jean-Georges Restaurants at Book Value $13.7 $13.7 $13.7 $13.7 $13.7 + Las Vegas Fashion Show Mall Air Rights N/A N/A N/A N/A N/A Total Implied Asset Value Range $424.5 $523.1 $621.7 $720.4 $819.0 - Total Debt Outstanding $39.1 $39.1 $39.1 $39.1 $39.1 - Series A Preferred Equity Outstanding $10.0 $10.0 $10.0 $10.0 $10.0 Notes: $ in millions, except hypothetical per-square foot valuations. Square feet in thousands. Any differences a result of rounding. Asset-based value components reflect hypothetical asset valuations and should not be construed as management’s opinion regarding the value of any of the Company’s assets. 1 Seaport Neighborhood includes the following buildings: Pier 17, Fulton Market Building, Schermerhorn Row, One Seaport Plaza, Museum Block, Translux, 117 Beekman, John Street Service Building, the Tin Building, as well as 60,000 square feet for The Rooftop at Pier 17. 2 Rentable square feet is calculated using the REBNY standard of measurement and subject to change based on revised use of the usable space. 3 In February 2026, the Company entered into a lease with Lux Entertainment to open its U.S. flagship location of the Balloon Museum in the Tin Building. The square footage of the Tin Building was adjusted to reflect the revised use of the space. 4 Based on a general range of values determined, in part, by multiple broker opinion of values. |
| Contact 23 Corporate 199 Water Street New York, NY 10038 Inves (212) 732-8257 ir@seaportentertainment.com Transfe Fidelity Stock TransferSM (FST) (833) 500-1036 nb.fidelity.com NYS Ticker Symbol: SEG www.seaportentertainment.com |
| This presentation and accompanying statements contain forward-looking statements that are subject to risks and uncertainties. All statements other than statements of historical facts or relating to present facts or current conditions included in this presentation are forward-looking statements. Forward-looking statements give Seaport Entertainment Group Inc.’s (“Seaport Entertainment,” the “Company,” “we,” “us,” “our” and “SEG”) current expectations relating to its financial condition, results of operations, plans, objectives, future performance and business. You can identify forward-looking statements by the fact that they do not relate strictly to historical or current facts. These statements may include words such as “may,” “could,” “seek,” “potential,” “likely,” “believe,” “will,” “expect,” “anticipate,” “estimate,” “plan,” “intend,” “hypothetical,” “forecast,” “aim,” “objectives,” “target,” “transform,” “project,” “realize” or variations of these terms and similar expressions, or the negative of these terms or similar expressions, although not all forward-looking statements contain these identifying words. Forward-looking statements include, but are not limited to, statements concerning the Company’s plans, goals, objectives, outlook, expectations, and intentions. Forward-looking statements are based on the Company’s current expectations and involve risks and uncertainties that could cause actual results to differ materially from those expressed or implied in such forward-looking statements. Factors that could cause the Company’s results to differ materially from current expectations include, but are not limited to: risks related to macroeconomic conditions; risks related to the impact of tariffs and global trade disruptions on the Company and its tenants, including impacts on inflation, interest rates, supply chains and consumer sentiment and spending; changes in discretionary consumer spending patterns or consumer tastes or preferences; risks associated with the Company’s investments in real estate assets and trends in the real estate industry; the Company’s ability to obtain operating and development capital on favorable terms, or at all; the availability of debt and equity capital; the Company’s ability to renew its leases or re-lease available space; the Company’s ability to compete effectively; the impact of uncertainty around, and disruptions to, the Company’s supply chain; risks related to the concentration of the Company’s properties and operations in New York City and the Las Vegas area; social, political and economic instability, unrest and other circumstances beyond the Company’s control which could adversely affect the Company’s business operations; adverse changes in laws or regulations governing the Company’s operation, changes in the interpretation thereof, or newly enacted laws or regulations could require changes to the Company’s business practices, adversely impact the Company’s revenues and/or impose additional costs on the Company ; extreme weather conditions or climate change that may cause property damage or interrupt business; the impact of water and electricity shortages on the Company’s business; the Company’s ability to successfully identify, acquire, develop, and manage properties on terms that are favorable to it; the contamination of the Company’s properties by hazardous or toxic substances; catastrophic events or geopolitical conditions that may disrupt the Company’s business; actual or threatened terrorist activity and other acts of violence, or the perception of a heightened threat of such events; losses that are not insured or that exceed the applicable insurance limits; risks related to the disruption or failure of information technology networks and related systems – both the Company’s and those operated and managed by third parties; the Company’s ability to attract and retain key personnel; the Company’s inability to control certain properties due to the joint ownership of such property and inability to successfully attract desirable strategic partners, including joint venture partners; risks related to the concentration of ownership of the Company’s common stock by Pershing Square; risks related to the Company’s separation from, and relationship with, Howard Hughes Holdings Inc.; and the other factors detailed in the Company’s filings with the SEC. Forward-looking statements speak only as of the date of this presentation. The Company is under no obligation to publicly update or revise any forward-looking statements, whether as a result of new information, future events or otherwise, except as required by applicable law. All forward-looking statements in this presentation are made as of (i) the date hereof, in the case of information about the Company, and (ii) the date of such information, in the case of information from persons other than the Company. While management believes the information underlying any estimates and projections forms a reasonable basis for the statements in this presentation, such information may be limited or incomplete and should not be read to indicate that the Company has conducted an exhaustive inquiry into, or review of, all potentially available relevant information. All trademarks and logos depicted in this presentation are the property of their respective owners and are displayed solely for purposes of illustration. Such use should not be construed as an endorsement of the products or services of the Company. 24 Safe Ha |
| Key terms References and terms used in this presentation that are in addition to the terms defined in the Safe Harbor section of this presentation, or not already defined in other areas of this presentation, include: This presentation was published on May 6, 2026. All information is as of, or for the quarter-ending March 31, 2026, unless otherwise noted. Any calculation differences are assumed to be a result of rounding. “Aviators” refers to the Las Vegas Aviators Triple-A baseball team. “Inherited Vacancy” refers to rentable spaces of which the majority of the associated space was vacant or on a short-term agreement at the time of the Company’s Spin-Off. “Jean-Georges,” “JGM,” or “JG” refers to Jean-Georges Restaurants. “Net Debt” is calculated as our total long-term debt as presented on the face of our balance sheet, plus financing costs net of accumulated amortization, less cash, restricted cash and cash equivalents. “NYSE” refers to the New York Stock Exchange. “Pershing Square” refers to Pershing Square Capital Management, L.P. “Seaport,” “Seaport NYC,” or “Seaport Neighborhood” refers to the approximately 454,000 square feet of restaurant, retail, office and entertainment properties and 21 residential units that makeup the Seaport in Lower Manhattan. “Operating EBITDA” refers to the Segment Operating Results disclosed within our Form 10-Q filed May 6, 2026. “Previously Occupied Space” refers to rentable spaces of which the majority of the associated space was occupied at the time of the Company’s Spin-Off. “Series A Preferred Equity” refers to 14.000% Series A preferred stock of Seaport District NYC, Inc. On July 31, 2024, in connection with certain restructuring transactions to effectuate the Spin-Off, where Seaport District NYC, Inc., at such time an indirect subsidiary of HHH, issued 10,000 shares of its 14.000% Series A preferred stock with an aggregate liquidation preference of $10.0 million to its then-direct parent in exchange for the contribution by its parent of certain assets. In connection with the Separation, Seaport District NYC, Inc. became a subsidiary of Seaport Entertainment. “Spin-Off” or “Separation” refers to the pro rata distribution of the shares of Seaport Entertainment Group Inc. to the Seaport Entertainment Group Inc. shareholders in a distribution that is intended to be tax-free to HHH stockholders for U.S. federal income tax purposes except for cash received in lieu of fractional shares. “TTM” or “Trailing Twelve Months” refers to the financial results for the twelve consecutive months ending on the date of the reported financial statements. 25 |
|