Shareholder Report
Feb. 28, 2026
USD ($)
Holding
| [1] | Annualized |
| [2] | Annualized |
Shareholder Report |
6 Months Ended | |||||
|---|---|---|---|---|---|---|
|
Feb. 28, 2026
USD ($)
Holding
| ||||||
| Shareholder Report [Line Items] | ||||||
| Document Type | N-CSRS | |||||
| Amendment Flag | false | |||||
| Registrant Name | THOR Financial Technologies Trust | |||||
| Entity Central Index Key | 0001924447 | |||||
| Entity Investment Company Type | N-1A | |||||
| Document Period End Date | Feb. 28, 2026 | |||||
| Shareholder Report Annual or Semi-Annual | Semi-Annual Shareholder Report | |||||
| C000252269 | ||||||
| Shareholder Report [Line Items] | ||||||
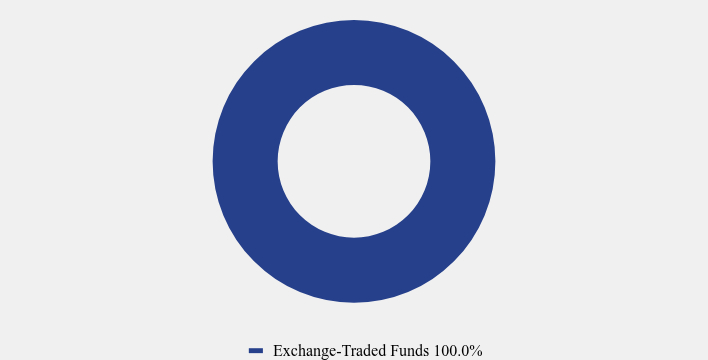
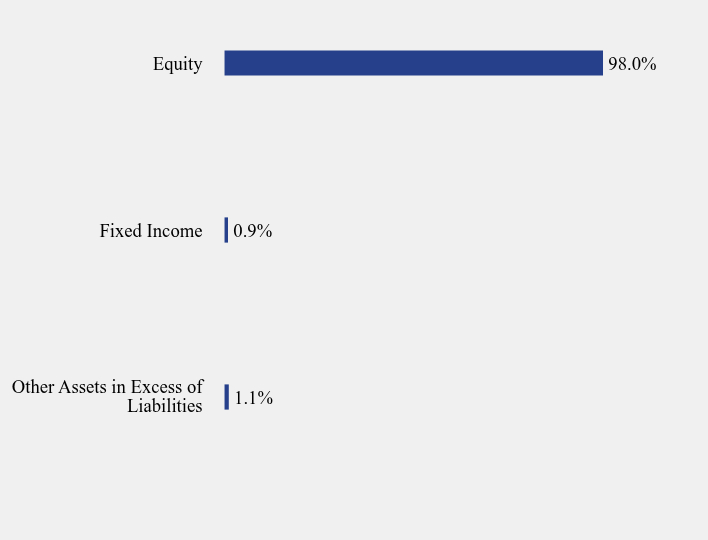
| Fund Name | THOR Index Rotation ETF | |||||
| Trading Symbol | THIR | |||||
| Annual or Semi-Annual Statement [Text Block] | This semi-annual shareholder report contains important information about THOR Index Rotation ETF for the period of September 1, 2025 to February 28, 2026. | |||||
| Additional Information [Text Block] | You can find additional information about the Fund at https://thorfunds.com/etfs/thir. You can also request this information by contacting us at 1-800-974-6964. | |||||
| Additional Information Phone Number | 1-800-974-6964 | |||||
| Additional Information Website | https://thorfunds.com/etfs/thir | |||||
| Expenses [Text Block] | ||||||
| Expenses Paid, Amount | $ 28 | |||||
| Expense Ratio, Percent | 0.55% | [1] | ||||
| Performance Past Does Not Indicate Future [Text] | The Fund's past performance is not a good predictor of how the Fund will perform in the future. | |||||
| Average Annual Return [Table Text Block] | ||||||
| Performance Inception Date | Sep. 23, 2024 | |||||
| No Deduction of Taxes [Text Block] | The graph and table do not reflect the deduction of taxes that a shareholder would pay on fund distributions or redemption of fund shares. | |||||
| AssetsNet | $ 214,336,423 | |||||
| Holdings Count | Holding | 4 | |||||
| Advisory Fees Paid, Amount | $ 477,016 | |||||
| InvestmentCompanyPortfolioTurnover | 32.00% | |||||
| Additional Fund Statistics [Text Block] | ||||||
| Holdings [Text Block] | ||||||
| C000236830 | ||||||
| Shareholder Report [Line Items] | ||||||
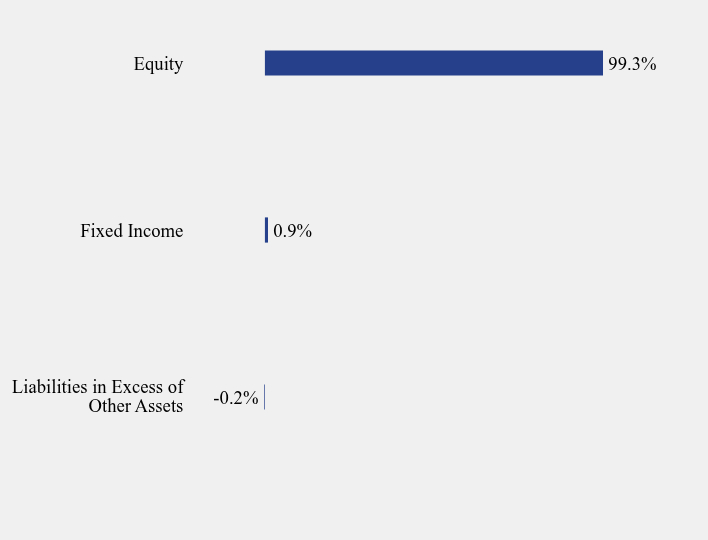
| Fund Name | THOR Equal Weight Low Volatility ETF | |||||
| Trading Symbol | THLV | |||||
| Annual or Semi-Annual Statement [Text Block] | This semi-annual shareholder report contains important information about THOR Equal Weight Low Volatility ETF for the period of September 1, 2025 to February 28, 2026. | |||||
| Additional Information [Text Block] | You can find additional information about the Fund at https://thorfunds.com/etfs/thlv. You can also request this information by contacting us at 1-800-974-6964. | |||||
| Additional Information Phone Number | 1-800-974-6964 | |||||
| Additional Information Website | https://thorfunds.com/etfs/thlv | |||||
| Expenses [Text Block] | ||||||
| Expenses Paid, Amount | $ 29 | |||||
| Expense Ratio, Percent | 0.55% | [2] | ||||
| Performance Past Does Not Indicate Future [Text] | The Fund's past performance is not a good predictor of how the Fund will perform in the future. | |||||
| Average Annual Return [Table Text Block] | ||||||
| Performance Inception Date | Sep. 12, 2022 | |||||
| No Deduction of Taxes [Text Block] | The graph and table do not reflect the deduction of taxes that a shareholder would pay on fund distributions or redemption of fund shares. | |||||
| AssetsNet | $ 57,740,006 | |||||
| Holdings Count | Holding | 11 | |||||
| Advisory Fees Paid, Amount | $ 136,373 | |||||
| InvestmentCompanyPortfolioTurnover | 31.00% | |||||
| Additional Fund Statistics [Text Block] | ||||||
| Holdings [Text Block] | ||||||
| ||||||