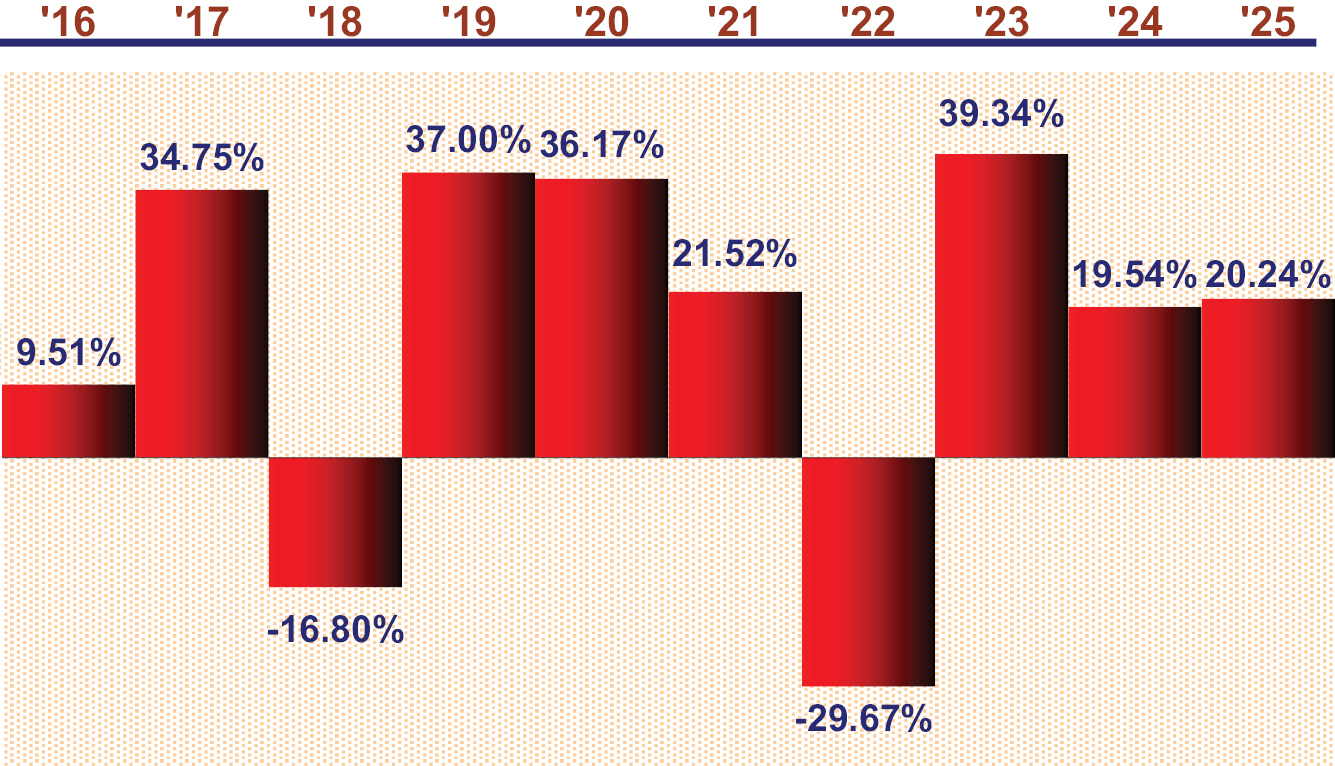
The annual returns bar chart demonstrates the risks of investing in the Alternative Energy Fund by showing how the Fund’s performance has varied from year to year. The table below also demonstrates these risks by showing how the Fund’s average annual returns compare with those of a broad-based securities market index. Unlike the Fund’s returns, the index returns do not reflect any deductions for fees, expenses or taxes. For additional information on these indices, please see Index Descriptions in the prospectus. Past performance, before or after taxes, is not indicative of future performance. Updated performance information is available on the Fund’s website www.gafunds.com.
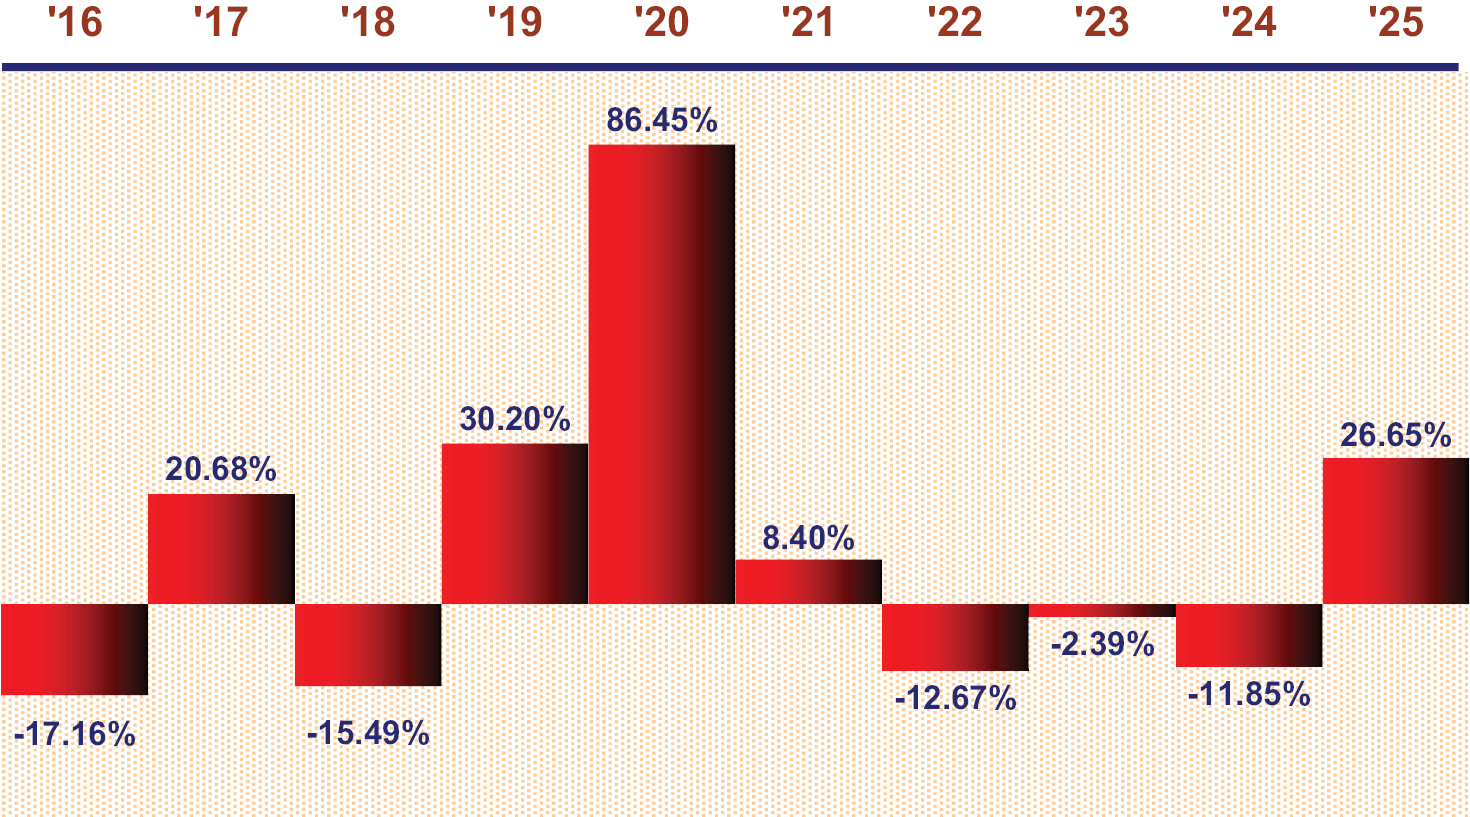
The year-to-date return for the Fund as of March 31, 2026, was (0.63)%.
During the period shown in the bar chart, the best performance for a quarter was 39.10% (for the quarter ended December 31, 2020). The worst performance was (20.78)% (for the quarter ended March 31, 2020).
| Average Annual Total Returns as of 12/31/25 | One Year | Five Years | Ten Years |
| Alternative Energy Fund: | |||
| Return Before Taxes | 26.65% | 0.63% | 7.78% |
| Return After Taxes on Distributions(1) | 26.65% | 0.63% | 7.78% |
| Return After Taxes on Distributions and Sale of Fund Shares(1) | 15.94% | 0.51% | 6.37% |
| MSCI World Index (Net Return) (Reflects no Deductions for Fees and Expenses) | 21.09% | 12.14% | 12.16% |
(1) After-tax returns are calculated using the historically highest individual federal marginal income tax rates and do not reflect the impact of state and local taxes. Actual after-tax returns depend on an investor’s tax situation and may differ from those shown, and after-tax returns shown are not relevant to investors who hold their Fund shares through tax-deferred arrangements, such as 401(k) plans or individual retirement accounts. In certain cases, the figure representing “Return After Taxes on Distributions and Sale of Fund Shares” may be higher than the other return figures for the same period. A higher after-tax return results when a capital loss occurs upon redemption and provides an assumed tax deduction that benefits the investor.
The annual returns bar chart demonstrates the risks of investing in the Asia Focus Fund by showing how the Fund’s performance has varied from year to year. The table below also demonstrates these risks by showing how the Fund’s average annual returns compare with those of a broad-based securities market index. Unlike the Fund’s returns, the index returns do not reflect any deductions for fees, expenses or taxes. For additional information on these indices, please see Index Descriptions in the prospectus. Past performance, before or after taxes, is not indicative of future performance. Updated performance information is available on the Fund’s website www.gafunds.com.
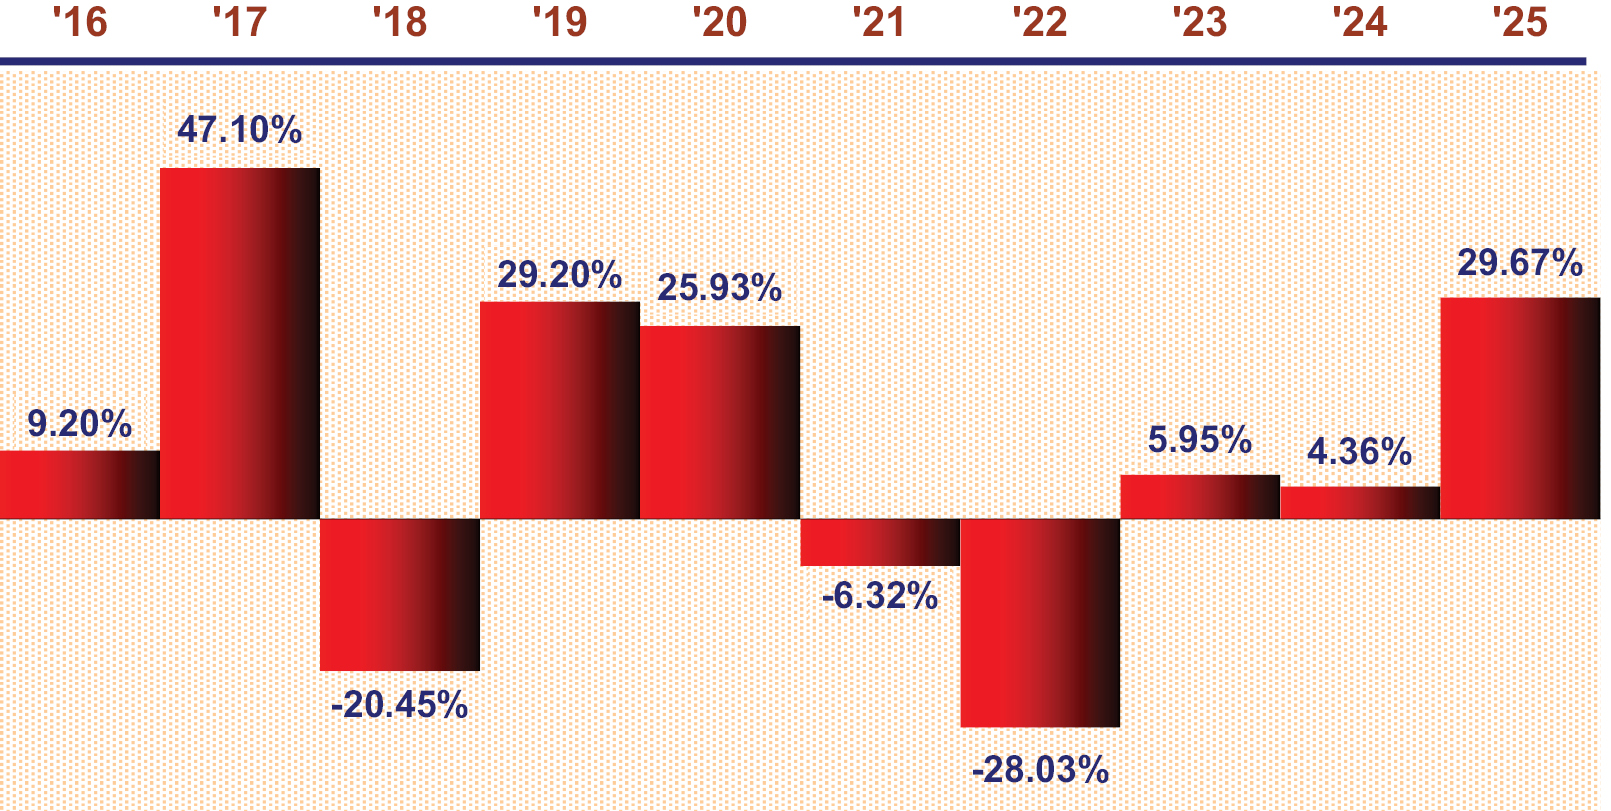
The year-to-date return for the Fund as of March 31, 2026, was 0.00%.
During the period shown in the bar chart, the best performance for a quarter was 20.34% (for the quarter ended December 31, 2020). The worst performance was (20.97)% (for the quarter ended March 31, 2020).
| Average Annual Total Returns as of 12/31/25 | One Year | Five Years | Ten Years |
| Asia Focus Fund: | |||
| Return Before Taxes | 29.67% | (0.68)% | 7.23% |
| Return After Taxes on Distributions(1) | 27.77% | (1.56)% | 6.31% |
| Return After Taxes on Distributions and Sale of Fund Shares(1) | 19.10% | (0.48)% | 5.91% |
| MSCI AC Asia Pacific ex Japan Index(2) (Net Return) (Reflects No Deductions for Fees and Expenses) | 29.56% | 4.19% | 8.46% |
| MSCI AC Far East ex Japan Index (Net Return) (Reflects No Deductions for Fees and Expenses) | 40.69% | 3.19% | 8.47% |
(1) After-tax returns are calculated using the historically highest individual federal marginal income tax rates and do not reflect the impact of state and local taxes. Actual after-tax returns depend on an investor’s tax situation and may differ from those shown, and after-tax returns shown are not relevant to investors who hold their Fund shares through tax-deferred arrangements, such as 401(k) plans or individual retirement accounts. In certain cases, the figure representing “Return After Taxes on Distributions and Sale of Fund Shares” may be higher than the other return figures for the same period. A higher after-tax return results when a capital loss occurs upon redemption and provides an assumed tax deduction that benefits the investor.
(2) As of May 1, 2026, the Fund’s primary benchmark is MSCI AC Asia Pacific ex Japan Index (NR), which provides a more accurate and relevant performance evaluation. The change in benchmark does not reflect any change in the Fund’s investment objectives, policies or strategies.
The annual returns bar chart demonstrates the risks of investing in the China & Hong Kong Fund by showing how the Fund’s performance has varied from year to year. The table below also demonstrates these risks by showing how the Fund’s average annual returns compare with those of a broad-based securities market index. Unlike the Fund’s returns, the index returns do not reflect any deductions for fees, expenses or taxes. For additional information on these indices, please see Index Descriptions in the prospectus. Past performance, before or after taxes, is not indicative of future performance. Updated performance information is available on the Fund’s website www.gafunds.com.
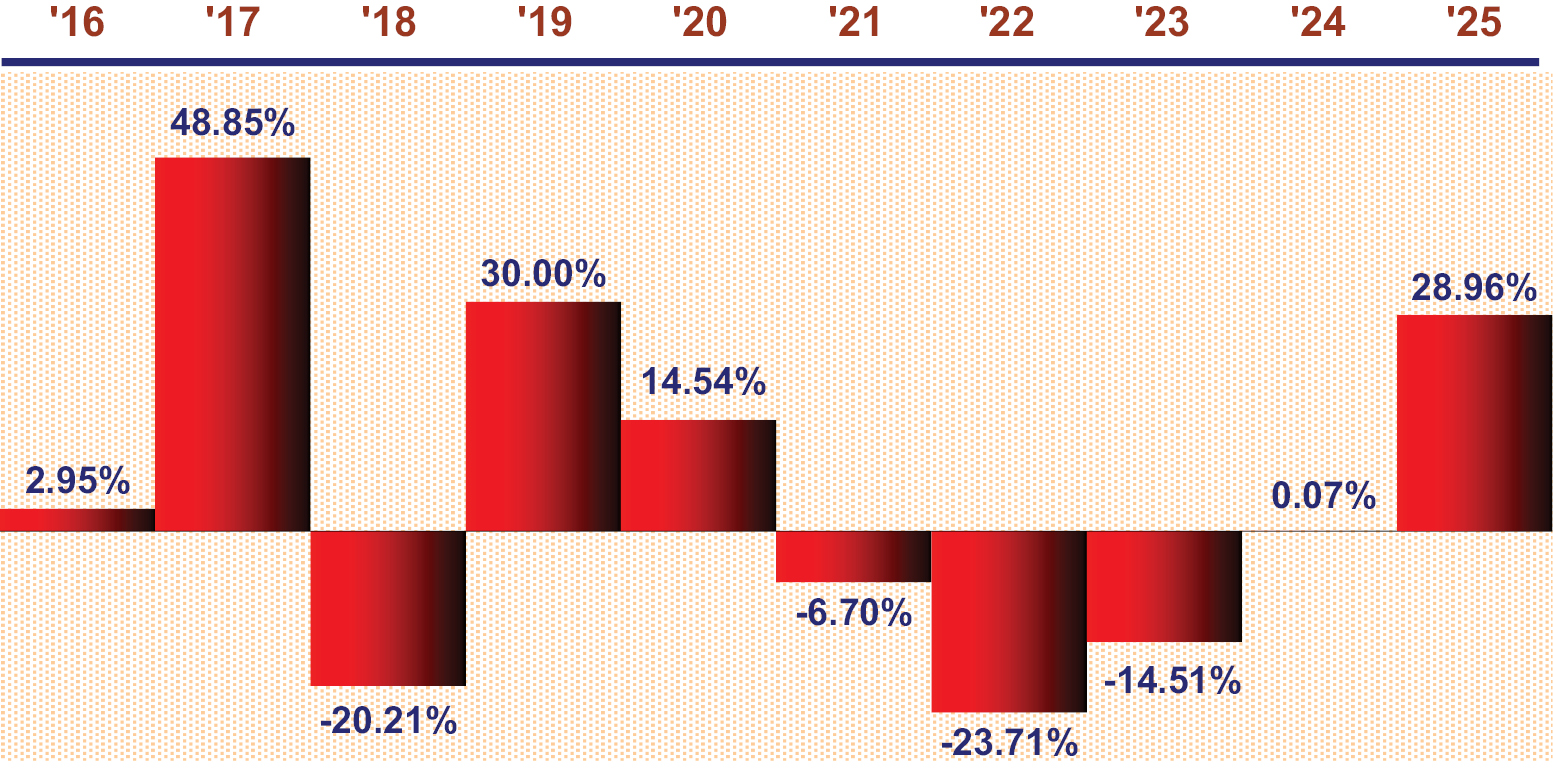
The year-to-date return for the Fund as of March 31, 2026, was (2.77)%.
During the period shown in the bar chart, the best performance for a quarter was 20.64% (for the quarter ended September 30, 2024). The worst performance was (24.79)% (for the quarter ended September 30, 2022).
| Average Annual Total Returns as of 12/31/25 | One Year | Five Years | Ten Years |
| China & Hong Kong Fund: | |||
| Return Before Taxes | 28.96% | (4.71)% | 3.64% |
| Return After Taxes on Distributions(1) | 28.81% | (5.75)% | 2.36% |
| Return After Taxes on Distributions and Sale of Fund Shares(1) | 17.55% | (3.50)% | 2.88% |
| MSCI China Index (Net Return) (Reflects No Deductions for Fees and Expenses) | 31.17% | (3.19)% | 5.53% |
(1) After-tax returns are calculated using the historically highest individual federal marginal income tax rates and do not reflect the impact of state and local taxes. Actual after-tax returns depend on an investor’s tax situation and may differ from those shown, and after-tax returns shown are not relevant to investors who hold their Fund shares through tax-deferred arrangements, such as 401(k) plans or individual retirement accounts. In certain cases, the figure representing “Return After Taxes on Distributions and Sale of Fund Shares” may be higher than the other return figures for the same period. A higher after-tax return results when a capital loss occurs upon redemption and provides an assumed tax deduction that benefits the investor.
The annual returns bar chart demonstrates the risks of investing in the Global Energy Fund by showing how the Fund’s performance has varied from year to year. The table below also demonstrates these risks by showing how the Fund’s average annual returns compare with those of a broad-based securities market index, as well as energy sector index that, more closely resembles the investments of the Fund. Unlike the Fund’s returns, the index returns do not reflect any deductions for fees, expenses or taxes. For additional information on these indices, please see Index Descriptions in the prospectus. Past performance, before or after taxes, is not indicative of future performance. Updated performance information is available on the Fund’s website www.gafunds.com.
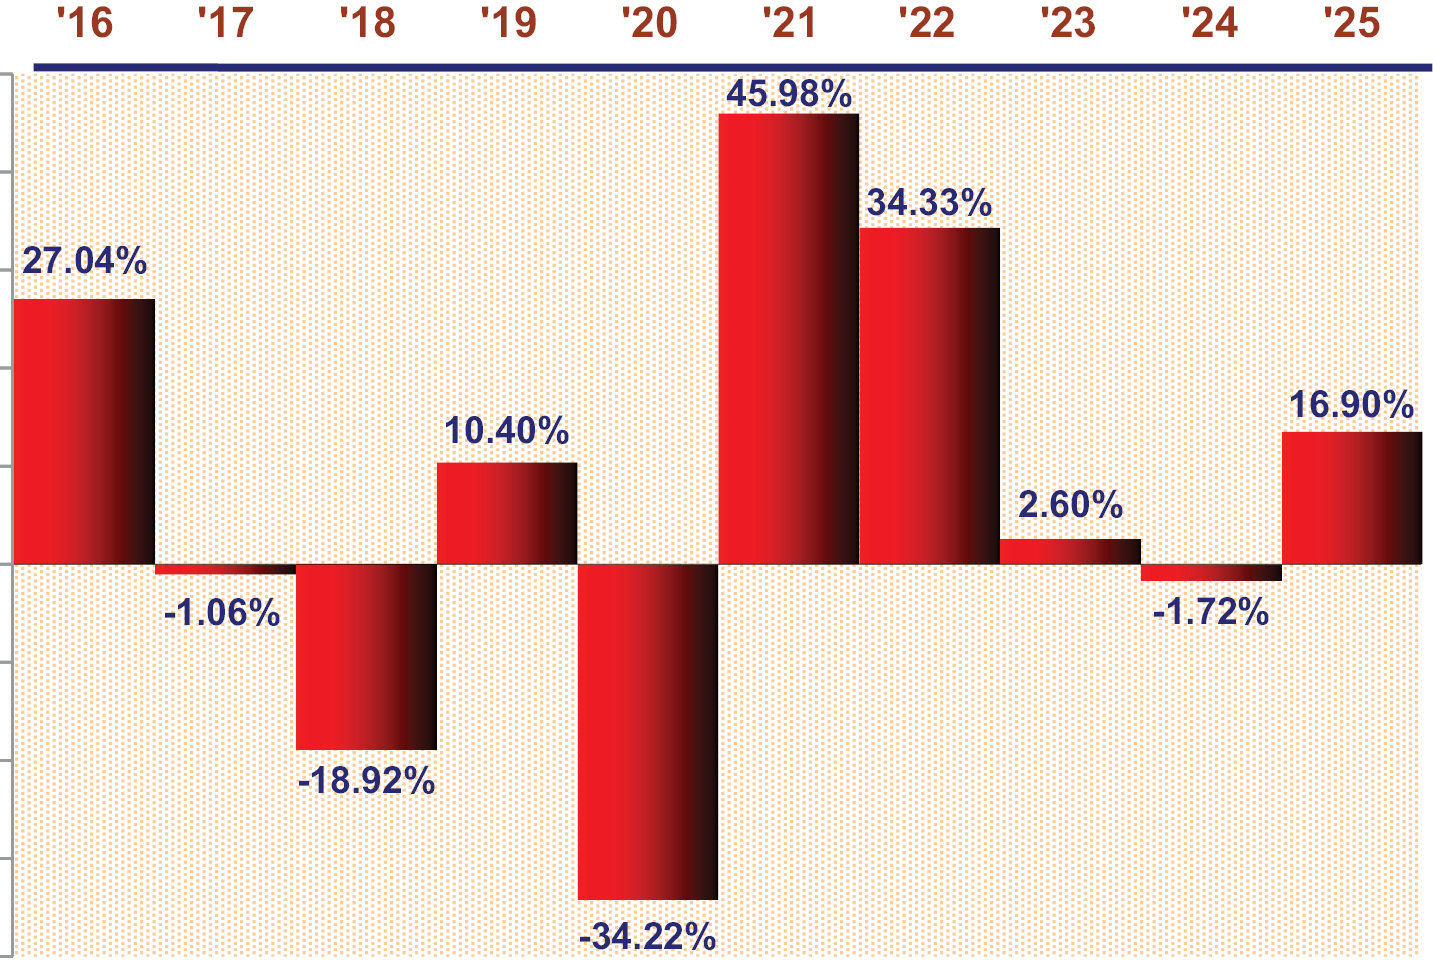
The year-to-date return for the Fund as of March 31, 2026, was 37.85%.
During the period shown in the bar chart, the best performance for a quarter was 30.90% (for the quarter ended December 31, 2020). The worst performance was (48.98)% (for the quarter ended March 31, 2020).
| Average Annual Total Returns as of 12/31/25 | One Year | Five Years | Ten Years |
| Global Energy Fund: | |||
| Return Before Taxes | 16.90% | 18.24% | 5.52% |
| Return After Taxes on Distributions(1) | 16.44% | 17.69% | 5.16% |
| Return After Taxes on Distributions and Sale of Fund Shares(1) | 10.86% | 15.13% | 4.58% |
| MSCI World Index (Net Return) (Reflects No Deductions for Fees and Expenses) | 21.09% | 12.14% | 12.16% |
| MSCI World Energy Index (Net Return) (Reflects No Deductions for Fees and Expenses) | 13.32% | 19.53% | 7.62% |
(1) After-tax returns are calculated using the historically highest individual federal marginal income tax rates and do not reflect the impact of state and local taxes. Actual after-tax returns depend on an investor’s tax situation and may differ from those shown, and after-tax returns shown are not relevant to investors who hold their Fund shares through tax-deferred arrangements, such as 401(k) plans or individual retirement accounts. In certain cases, the figure representing “Return After Taxes on Distributions and Sale of Fund Shares” may be higher than the other return figures for the same period. A higher after-tax return results when a capital loss occurs upon redemption and provides an assumed tax deduction that benefits the investor.
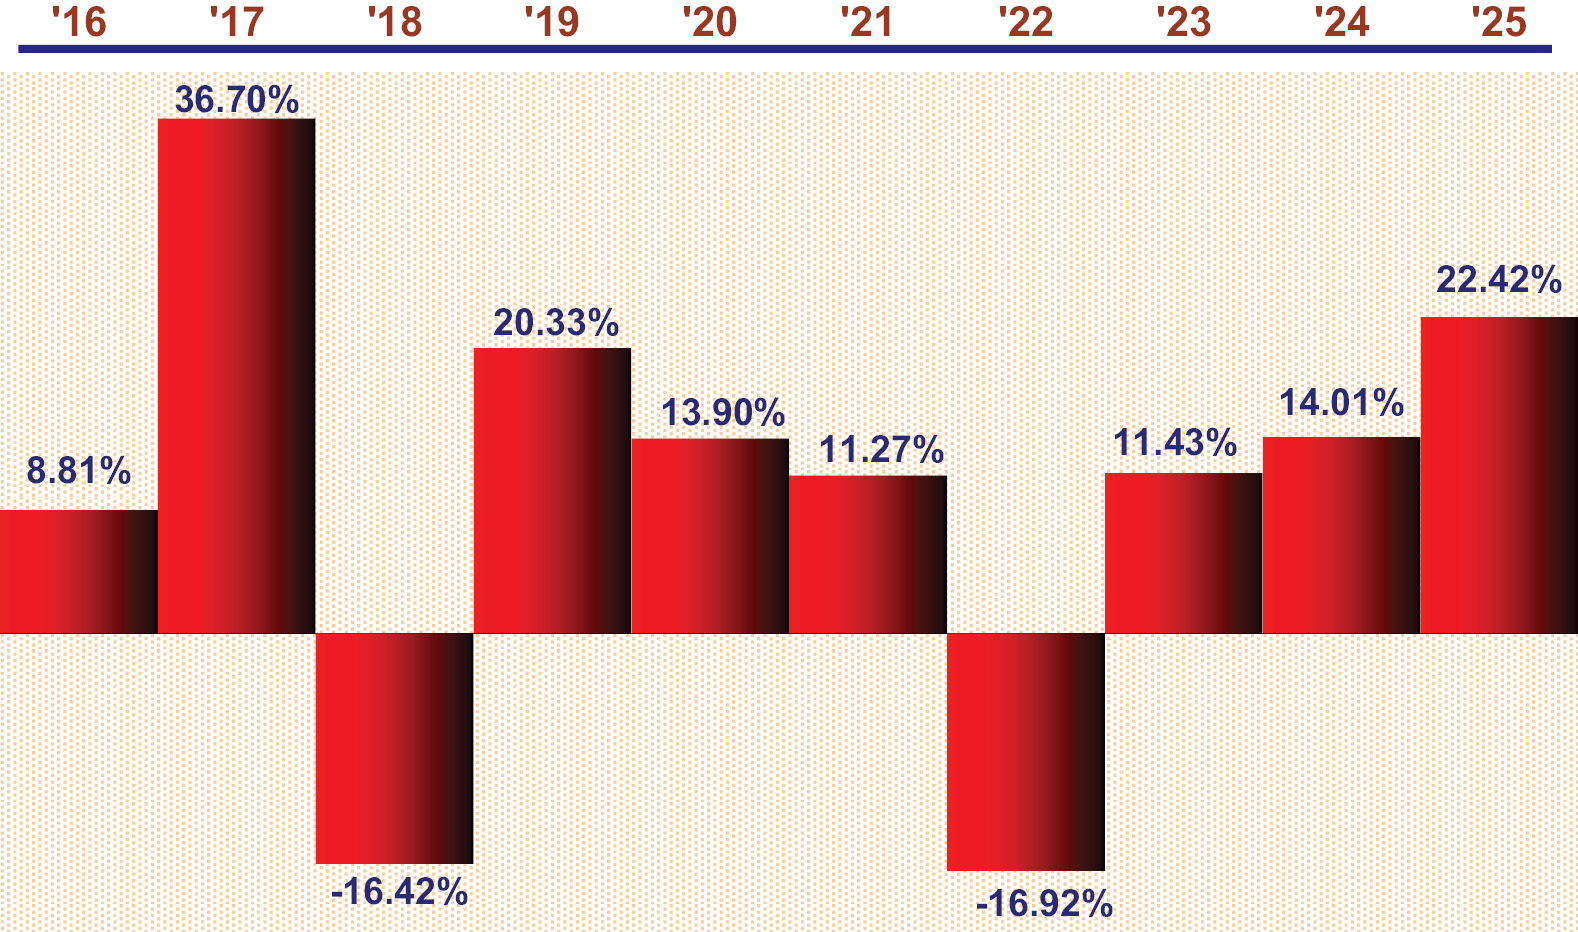
The annual returns bar chart demonstrates the risks of investing in the Global Innovators Fund by showing how the performance of the Fund’s Investor Class shares has varied from year to year. The table below also demonstrates these risks by showing how the Fund’s average annual returns compare with those of two broad-based securities market indices. Unlike the Fund’s returns, the index returns do not reflect any deductions for fees, expenses or taxes. For additional information on these indices, please see Index Descriptions in the prospectus. Past performance, before or after taxes, is not indicative of future performance. Updated performance information is available on the Fund’s website: www.gafunds.com.
The year-to-date return for the Fund as of March 31, 2026, was (6.14)%.
During the period shown in the bar chart, the best performance for a quarter was 27.36% (for the quarter ended June 30, 2020). The worst performance was (19.73)% (for the quarter ended June 30, 2022).
| Average Annual Total Returns as of 12/31/25 | One Year | Five Years | Ten Years |
| Global Innovators Fund: | |||
| Investor Class Return Before Taxes | 20.24% | 11.35% | 14.64% |
| Investor Class Return After Taxes on Distributions(1) | 16.10% | 8.41% | 12.64% |
| Investor Class Return After Taxes on Distributions and Sale of Fund Shares(1) | 14.90% | 8.50% | 11.84% |
| Institutional Class Return Before Taxes* | 20.54% | 11.63% | 14.92% |
| MSCI World Index (Net Return) (Reflects No Deductions for Fees and Expenses) | 21.09% | 12.14% | 12.16% |
* The Fund’s Institutional Class shares were issued on December 31, 2015. Performance information shown for the Institutional Class prior to December 31, 2015, is based on the performance of the Investor Class.
(1) After-tax returns are calculated using the historically highest individual federal marginal income tax rates and do not reflect the impact of state and local taxes. Actual after-tax returns depend on an investor’s tax situation and may differ from those shown, and after-tax returns shown are not relevant to investors who hold their Fund shares through tax-deferred arrangements, such as 401(k) plans or individual retirement accounts. In certain cases, the figure representing “Return After Taxes on Distributions and Sale of Fund Shares” may be higher than the other return figures for the same period. A higher after-tax return results when a capital loss occurs upon redemption and provides an assumed tax deduction that benefits the investor. After-tax returns are shown for Investor Class Shares only and after-tax returns for classes other than Investor Class will vary from returns shown for Investor Class.
The following performance information indicates some of the risks of investing in the Guinness Atkinson Asia Pacific Dividend Builder ETF.
The Guinness Atkinson Asia Pacific Dividend Builder ETF acquired the assets and liabilities of the predecessor mutual fund, the Guinness Atkinson Asia Pacific Dividend Builder Fund, on March 26, 2021. As a result of the transaction, the Fund adopted the accounting and performance history of its predecessor mutual fund, the Guinness
Atkinson Asia Pacific Dividend Builder Fund. The information shown below is for the predecessor mutual fund. The Fund’s total net operating expense ratio is lower than the net operating expense ratio of the predecessor mutual fund. Returns in the bar chart and table for the predecessor fund have not been adjusted.
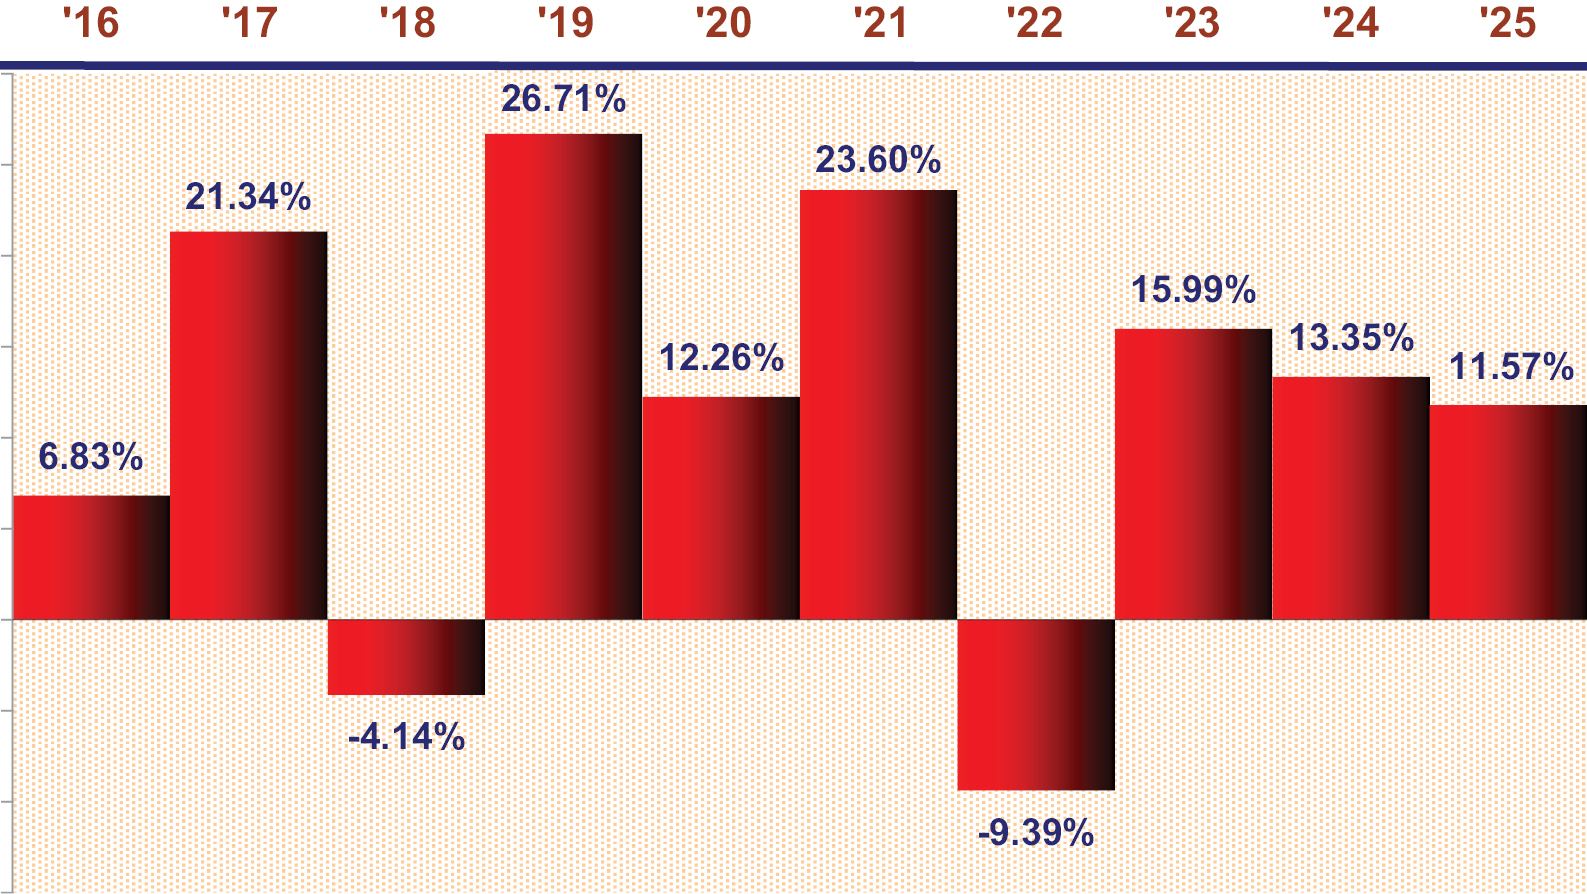
The annual returns bar chart demonstrates the risks of investing in the Guinness Atkinson Asia Pacific Dividend Builder ETF by showing how the predecessor mutual fund’s performance has varied from year to year. The table also demonstrates these risks by showing how the predecessor mutual fund’s average annual returns compare with those of a broad-based index. Unlike the predecessor mutual fund’s returns, the index returns do not reflect any deductions for fees, expenses or taxes. For additional information on these indices, please see Index Descriptions in the prospectus. Past performance, before or after taxes, is not indicative of future performance. Updated performance information is available from the Fund’s website, www.gafunds.com.
The year-to-date return for the Fund as of March 31, 2026, was (4.04)%.
During the period shown in the bar chart, the best performance for the predecessor mutual fund for a quarter was 20.34% (for the quarter ended December 31, 2020). The worst performance was (21.11)% (for the quarter ended March 31, 2020).
| Average Annual Total Returns as of 12/31/25 | One Year | Five Years | Ten Years |
| Guinness Atkinson Asia Pacific Dividend Builder ETF | |||
| Return Before Taxes | 22.42% | 7.53% | 9.37% |
| Return After Taxes on Distributions(1) | 21.43% | 5.73% | 7.71% |
| Return After Taxes on Distributions and Sale of Fund Shares(1) | 13.65% | 5.29% | 7.06% |
| MSCI AC Asia Pacific ex Japan Index(2) (Net Return) (Reflects No Deductions for Fees and Expenses) | 29.56% | 4.19% | 8.46% |
| MSCI AC Pacific ex Japan Index (Net Return) | 35.79% | 3.77% | 8.39% |
(1) This table shows returns for the predecessor mutual fund. After-tax returns are calculated using the historically highest individual federal marginal income tax rates and do not reflect the impact of state and local taxes. Actual after-tax returns depend on an investor’s tax situation and may differ from those shown, and after-tax returns shown are not relevant to investors who hold their mutual fund shares through tax-deferred arrangements, such as 401(k) plans or individual retirement
accounts. In certain cases, the figure representing “Return After Taxes on Distributions and Sale of Fund Shares” may be higher than the other return figures for the same period. A higher after-tax return results when a capital loss occurs upon redemption and provides an assumed tax deduction that benefits the investor.
(2) As of May 1, 2026, the Fund’s primary benchmark is MSCI AC Asia Pacific ex Japan Index (NR), which provides a more accurate and relevant performance evaluation. The change in benchmark does not reflect any change in the Fund’s investment objectives, policies or strategies.
The following performance information indicates some of the risks of investing in the Guinness Atkinson Dividend Builder ETF.
The Guinness Atkinson Dividend Builder ETF acquired the assets and liabilities of the predecessor mutual fund, the Guinness Atkinson Dividend Builder Fund, on March 26, 2021. As a result of the transaction, the Fund adopted the accounting and performance history of its predecessor mutual fund, the Guinness Atkinson Dividend Builder Fund. The information shown below is for the predecessor mutual fund. The Fund’s total net operating expense ratio is lower than the net operating expense ratio of the predecessor mutual fund. Returns in the bar chart and table for the predecessor fund have not been adjusted.
The annual returns bar chart demonstrates the risks of investing in the Guinness Atkinson Dividend Builder ETF by showing how the predecessor mutual fund’s performance has varied from year to year. The table also demonstrates these risks by showing how the predecessor mutual fund’s average annual returns compare with a broad-based securities market index. Unlike the predecessor mutual fund’s returns, these index returns do not reflect any deductions for fees, expenses or taxes. For additional information on these indices, please see Index Descriptions in the prospectus. Past performance, before or after taxes, is not indicative of future performance. Updated performance information is available from the Fund’s website www.gafunds.com.
The year-to-date return for the Fund as of March 31, 2026, was (1.71)%.
During the period shown in the bar chart, the best performance for a quarter was 15.33% (for the quarter ended June 30, 2020. The worst performance was (18.55)% (for the quarter ended March 31, 2020).
| Average Annual Total Returns as of 12/31/25 | One Year | Five Years | Ten Years |
| Guinness Atkinson Dividend Builder ETF | |||
| Return Before Taxes | 11.57% | 10.44% | 11.25% |
| Return After Taxes on Distributions(1) | 10.88% | 9.40% | 10.42% |
| Return After Taxes on Distributions and Sale of Fund Shares(1) | 7.33% | 8.05% | 9.12% |
| MSCI World Index (Net Return) (Reflects No Deductions for Fees and Expenses) | 21.09% | 12.14% | 12.16% |
(1) After-tax returns are calculated using the historically highest individual federal marginal income tax rates and do not reflect the impact of state and local taxes. Actual after-tax returns depend on an investor’s tax situation and may differ from those shown, and after-tax returns shown are not relevant to investors who hold their Fund shares through tax-deferred arrangements, such as 401(k) plans or individual retirement accounts. In certain cases, the figure representing “Return After Taxes on Distributions and Sale of Fund Shares” may be higher than the other return figures for the same period. A higher after-tax return results when a capital loss occurs upon redemption and provides an assumed tax deduction that benefits the investor.
No performance information is presented for the Fund because it has not yet been in operation for a full calendar year.
No performance information is presented for the Fund because it has not yet been in operation for a full calendar year.
The bar chart and table below provide some indication of the risks of investing in the Guinness Atkinson Smart Transportation & Technology ETF by showing how the fund’s performance has varied from year to year and by showing how the average annual total returns of the Fund compare with the average annual total returns of a broad-based market index. Unlike the Fund’s returns, the index returns do not reflect any deductions for fees, expenses or taxes. For additional information on these indices, please see Index Descriptions in the prospectus. Updated performance information is available from the Fund’s website, www.gafunds.com. Past performance, before or after taxes, is not indicative of future performance.
The annual returns bar chart demonstrates the risks of investing in the Guinness Atkinson Smart Transportation & Technology ETF by showing how the Fund’s performance has varied from year to year. The table below also demonstrates these risks by showing how the Fund’s average annual returns compare with those of a broad-based securities market index. Unlike the Fund’s returns, the index returns do not reflect any deductions for fees, expenses or
taxes. For additional information on these indices, please see Index Descriptions in the prospectus. Past performance, before or after taxes, is not indicative of future performance. Updated performance information is available on the Fund’s website www.gafunds.com.
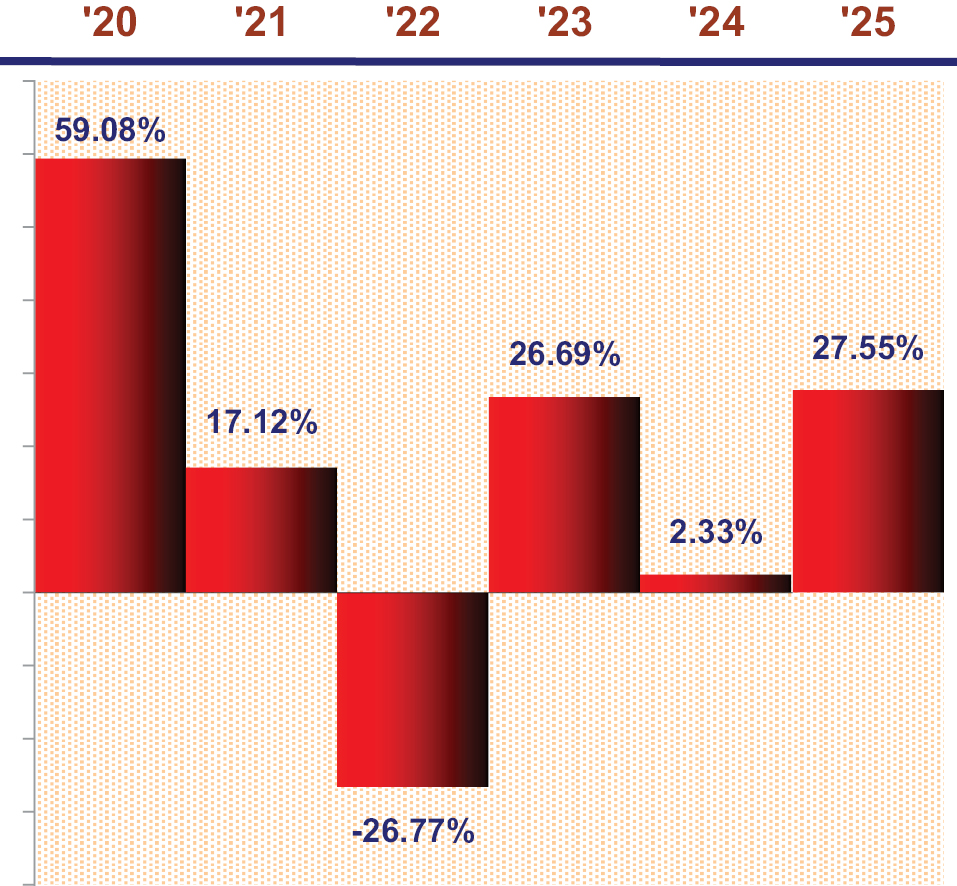
The year-to-date return for the Fund as of March 31, 2026, was 1.94%.
During the period shown in the bar chart, the best performance for a quarter was 30.64% (for the quarter ended December 31, 2020). The worst performance was (24.25)% (for the quarter ended March 31, 2020).
| Average Annual Total Returns as of 12/31/25 | One Year | Five Years | Since Inception (November 14, |
| Guinness Atkinson Smart Transportation & Technology ETF | |||
| Return Before Taxes | 27.55% | 7.24% | 15.19% |
| Return After Taxes on Distributions(1) | 27.44% | 6.91% | 14.70% |
| Return After Taxes on Distributions and Sale of Fund Shares(1) | 16.71% | 5.67% | 12.30% |
| MSCI World Index (Net Return) (Reflects No Deductions for Fees and Expenses) | 21.09% | 12.14% | 13.24% |
(1) After-tax returns are calculated using the historically highest individual federal marginal income tax rates and do not reflect the impact of state and local taxes. Actual after-tax returns depend on an investor’s tax situation and may differ from those shown, and after-tax returns shown are not relevant to investors who hold their Fund shares through tax-deferred arrangements, such as 401(k) plans or individual retirement accounts. In certain cases, the figure representing “Return After Taxes on Distributions and Sale of Fund Shares” may be higher than the other return figures for the same period. A higher after-tax return results when a capital loss occurs upon redemption and provides an assumed tax deduction that benefits the investor.
The bar chart and table below provide some indication of the risks of investing in the Guinness Atkinson Sustainable Energy ETF by showing how the fund’s performance has varied from year to year and by showing how the average annual total returns of the Fund compare with the average annual total returns of a broad-based market index. Unlike the Fund’s returns, the index returns do not reflect any deductions for fees, expenses or taxes. For additional information on these indices, please see Index Descriptions in the prospectus. Updated performance information is available from the Fund’s website, www.gafunds.com. Past performance does not necessarily indicate how the Fund will perform in future periods.
The annual returns bar chart demonstrates the risks of investing in the Guinness Atkinson Sustainable Energy ETF by showing how the Fund’s performance has varied from year to year. The table below also demonstrates these risks by showing how the Fund’s average annual returns compare with those of a broad-based securities market index. Unlike the Fund’s returns, the index returns do not reflect any deductions for fees, expenses or taxes. For additional information on these indices, please see Index Descriptions in the prospectus. Past performance, before or after taxes, is not indicative of future performance. Updated performance information is available on the Fund’s website www.gafunds.com.
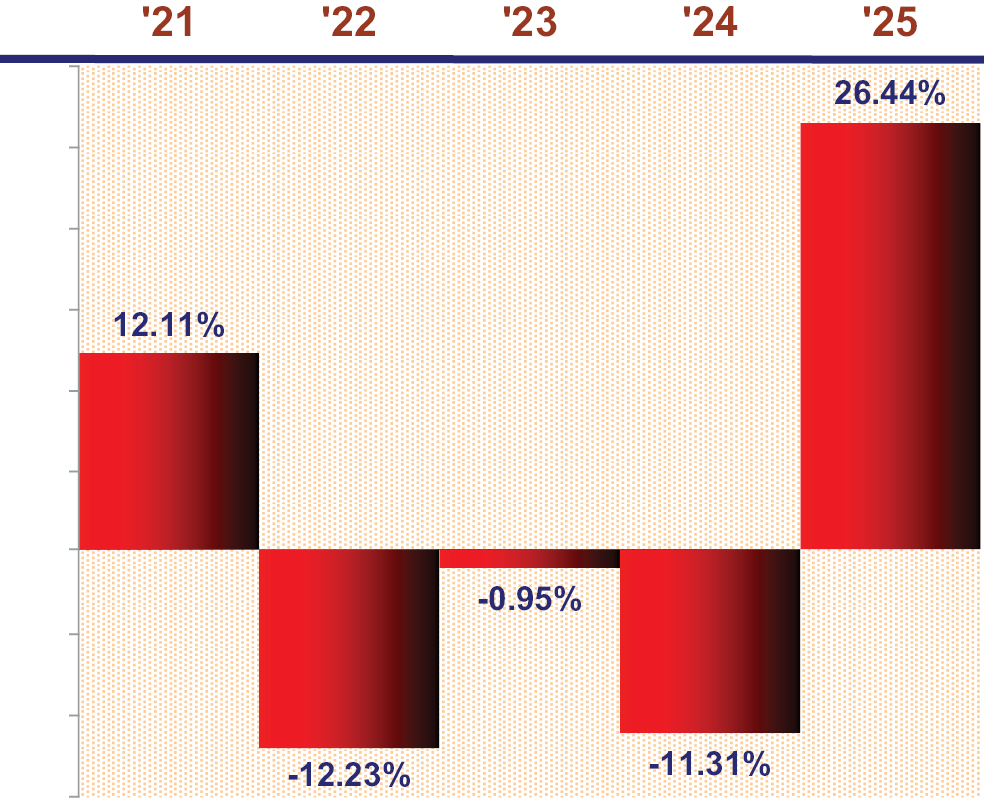
The year-to-date return for the Fund as of March 31, 2026, was (1.51)%.
During the period shown in the bar chart, the best performance for a quarter was 17.72% (for the quarter ended June 30, 2025). The worst performance was (15.99)% (for the quarter ended September 30, 2023).
| Average Annual Total Returns as of 12/31/25 | One Year | Five Years | Since |
| Guinness Atkinson Sustainable Energy ETF | |||
| Return Before Taxes | 26.44% | 1.80% | 5.14% |
| Return After Taxes on Distributions(1) | 26.36% | 1.46% | 4.81% |
| Return After Taxes on Distributions and Sale of Fund Shares(1) | 15.90% | 1.31% | 3.94% |
| MSCI World Index (Net Return) (Reflects No Deductions for Fees and Expenses) | 21.09% | 12.14% | 13.19% |
(1) After-tax returns are calculated using the historically highest individual federal marginal income tax rates and do not reflect the impact of state and local taxes. Actual after-tax returns depend on an investor’s tax situation and may differ from those shown, and after-tax returns shown are not relevant to investors who hold their Fund shares through tax-deferred arrangements, such as 401(k) plans or individual retirement accounts. In certain cases, the figure representing “Return After Taxes on Distributions and Sale of Fund Shares” may be higher than the other return figures for the same period. A higher after-tax return results when a capital loss occurs upon redemption and provides an assumed tax deduction that benefits the investor.
No performance information is presented for the Fund because it has not yet been in operation for a full calendar year.