Performance Management
|
Apr. 30, 2026 |
| Gabelli Growth Innovators ETF |
|
| Prospectus [Line Items] |
|
| Bar Chart and Performance Table [Heading] |
Performance
|
| Performance Narrative [Text Block] |
The bar chart and table that follow provide an indication of the risk of investing in the Growth Innovators Fund by showing changes in the Growth Innovators Fund’s performance from year to year and by showing how the Growth Innovators Fund’s average annual returns compared with those of a broad-based securities market index and an additional index that has investment characteristics similar to those of the Growth Innovators Fund. As with all mutual funds, the Growth Innovators Fund’s past performance (before and after taxes) does not predict how the Growth Innovators Fund will perform in the future. Updated information on the Growth Innovators Fund’s results can be obtained by visiting www.gabelli.com.
|
| Performance Past Does Not Indicate Future [Text] |
As with all mutual funds, the Growth Innovators Fund’s past performance (before and after taxes) does not predict how the Growth Innovators Fund will perform in the future.
|
| Performance Information Illustrates Variability of Returns [Text] |
The bar chart and table that follow provide an indication of the risk of investing in the Growth Innovators Fund by showing changes in the Growth Innovators Fund’s performance from year to year and by showing how the Growth Innovators Fund’s average annual returns compared with those of a broad-based securities market index and an additional index that has investment characteristics similar to those of the Growth Innovators Fund.
|
| Bar Chart [Heading] |
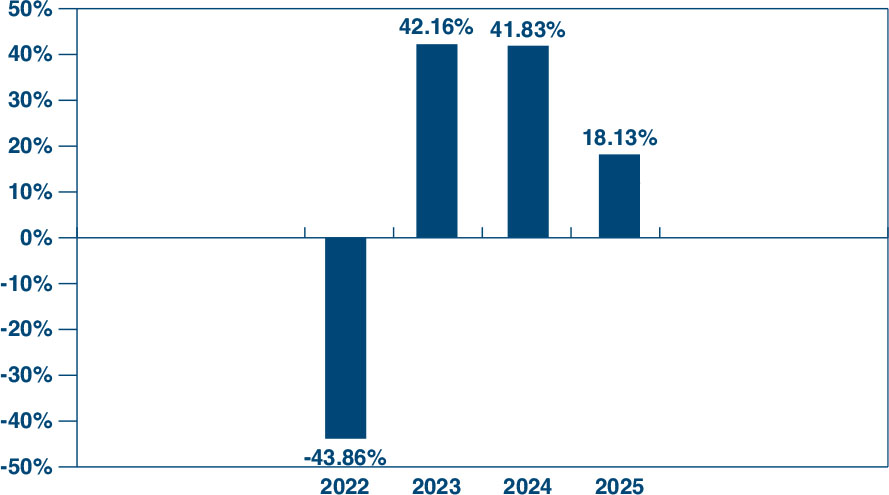
GROWTH INNOVATORS FUND (Total returns for the Year Ended December 31)
|
| Bar Chart [Table] |
| Years |
Returns |
| 2022 |
-43.86% |
| 2023 |
42.16% |
| 2024 |
41.83% |
| 2025 |
18.13% |
|
| Bar Chart Closing [Text Block] |
During the calendar years shown in the bar chart, the highest return for a quarter was 19.94% (quarter ended March 31, 2024) and the lowest return for a quarter was (31.27)% (quarter ended June 30, 2022).
|
| Highest Quarterly Return, Label [Optional Text] |
the highest return for a quarter
|
| Highest Quarterly Return |
19.94%
|
| Highest Quarterly Return, Date |
Mar. 31, 2024
|
| Lowest Quarterly Return, Label [Optional Text] |
the lowest return for a quarter
|
| Lowest Quarterly Return |
(31.27%)
|
| Lowest Quarterly Return, Date |
Jun. 30, 2022
|
| Performance Table Heading |
Average Annual Total Returns(for the years ended December 31, 2025,with the maximum sales charges, if applicable)
|
| Performance Table Uses Highest Federal Rate |
After-tax returns are calculated using the historical highest individual federal marginal income tax rates and do not reflect the impact of state and local taxes.
|
| Performance Table Not Relevant to Tax Deferred |
After-tax returns shown are not relevant to investors who hold their Fund shares through tax-deferred arrangements, such as 401(k) plans or individual retirement accounts, including “Roth” IRAs and SEP IRAs (collectively, “IRAs”).
|
| Performance Table Explanation after Tax Higher |
In some instances, the “Return After Taxes on Distributions and Sale of Fund Shares” may be greater than “Return Before Taxes” because the investor is assumed to be able to use the capital loss from the sale of Fund shares to offset other taxable gains.
|
| Performance [Table] |
Average Annual Total Returns
(for the years ended December 31, 2025,
with the maximum sales charges, if applicable) |
|
Past
One Year |
|
|
Since Inception
(February 12, 2021) |
|
| Growth Innovators Fund |
|
|
|
|
|
|
|
|
|
|
|
|
| Return Before Taxes |
|
|
|
18.13 |
% |
|
|
|
|
7.37 |
% |
|
| Return After Taxes on Distributions |
|
|
|
17.93 |
% |
|
|
|
|
7.34 |
% |
|
| Return After Taxes on Distributions and Sale of Fund Shares |
|
|
|
10.74 |
% |
|
|
|
|
5.78 |
% |
|
S&P 500 Index
(reflects no deduction for fees, expenses or taxes) |
|
|
|
17.88 |
% |
|
|
|
|
13.72 |
% |
|
Nasdaq Composite Index
(reflects no deduction for fees, expenses or taxes) |
|
|
|
21.14 |
% |
|
|
|
|
11.73 |
% |
|
|
| Performance Table Closing [Text Block] |
After-tax returns are calculated using the historical highest individual federal marginal income tax rates and do not reflect the impact of state and local taxes. In some instances, the “Return After Taxes on Distributions and Sale of Fund Shares” may be greater than “Return Before Taxes” because the investor is assumed to be able to use the capital loss from the sale of Fund shares to offset other taxable gains. Actual after-tax returns depend on an investor’s tax situation and may differ from those shown. After-tax returns shown are not relevant to investors who hold their Fund shares through tax-deferred arrangements, such as 401(k) plans or individual retirement accounts, including “Roth” IRAs and SEP IRAs (collectively, “IRAs”).
|
| Performance Availability Website Address [Text] |
www.gabelli.com
|
| Gabelli Love Our Planet & People ETF |
|
| Prospectus [Line Items] |
|
| Bar Chart and Performance Table [Heading] |
Performance
|
| Performance Narrative [Text Block] |
The bar chart and table that follow provide an indication of the risk of investing in the Love Our Planet Fund by showing changes in the Love Our Planet Fund’s performance from year to year and by showing how the Love Our Planet Fund’s average annual returns for one year, five years, and ten years, if applicable, compared with those of a broad-based securities market index. As with all mutual funds, the Love Our Planet Fund’s past performance (before and after taxes) does not predict how the Love Our Planet Fund will perform in the future. Updated information on the Love Our Planet Fund’s results can be obtained by visiting www.gabelli.com.
|
| Performance Past Does Not Indicate Future [Text] |
As with all mutual funds, the Love Our Planet Fund’s past performance (before and after taxes) does not predict how the Love Our Planet Fund will perform in the future.
|
| Performance Information Illustrates Variability of Returns [Text] |
The bar chart and table that follow provide an indication of the risk of investing in the Love Our Planet Fund by showing changes in the Love Our Planet Fund’s performance from year to year and by showing how the Love Our Planet Fund’s average annual returns for one year, five years, and ten years, if applicable, compared with those of a broad-based securities market index.
|
| Bar Chart [Heading] |
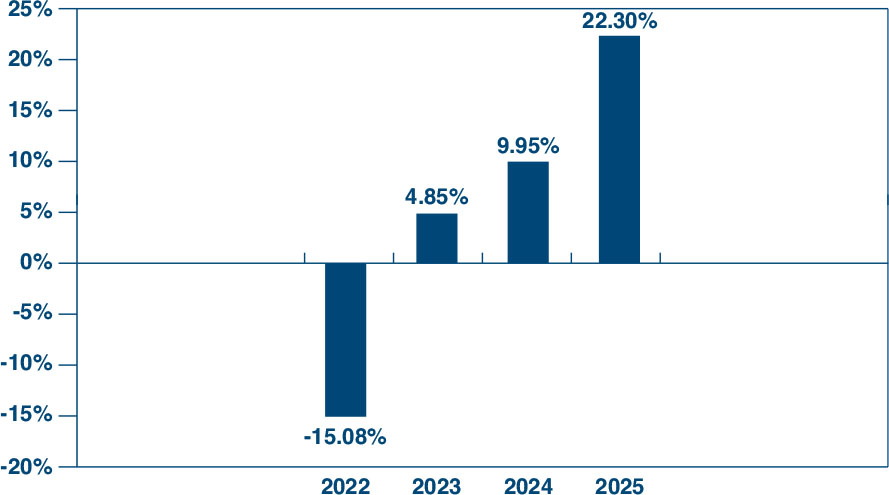
LOVE OUR PLANET FUND (Total returns for the Year Ended December 31)
|
| Bar Chart [Table] |
| Years |
Returns |
| 2022 |
-15.08% |
| 2023 |
4.85% |
| 2024 |
9.95% |
| 2025 |
22.30% |
|
| Bar Chart Closing [Text Block] |
During the calendar years shown in the bar chart, the highest return for a quarter was 9.38% (quarter ended December 31, 2022) and the lowest return for a quarter was (15.27)% (quarter ended June 30, 2022).
|
| Highest Quarterly Return, Label [Optional Text] |
highest return for a quarter
|
| Highest Quarterly Return |
9.38%
|
| Highest Quarterly Return, Date |
Dec. 31, 2022
|
| Lowest Quarterly Return, Label [Optional Text] |
lowest return for a quarter
|
| Lowest Quarterly Return |
(15.27%)
|
| Lowest Quarterly Return, Date |
Jun. 30, 2022
|
| Performance Table Heading |
Average Annual Total Returns(for the years ended December 31, 2025, with the maximum sales charges, if applicable)
|
| Performance Table Uses Highest Federal Rate |
After-tax returns are calculated using the historical highest individual federal marginal income tax rates and do not reflect the impact of state and local taxes.
|
| Performance Table Not Relevant to Tax Deferred |
After-tax returns shown are not relevant to investors who hold their Fund shares through tax-deferred arrangements, such as 401 (k) plans or individual retirement accounts, including “Roth” IRAs and SEP IRAs (collectively, “IRAs”).
|
| Performance Table Explanation after Tax Higher |
In some instances, the “Return After Taxes on Distributions and Sale of Fund Shares” may be greater than “Return Before Taxes” because the investor is assumed to be able to use the capital loss from the sale of Fund shares to offset other taxable gains.
|
| Performance [Table] |
Average Annual Total Returns
(for the years ended December 31, 2025,
with the maximum sales charges, if applicable) |
|
Past
One Year |
|
|
Since Inception
(January 29, 2021) |
|
| Love Our Planet Fund |
|
|
|
|
|
|
|
|
|
|
|
|
| Return Before Taxes |
|
|
|
22.30 |
% |
|
|
|
|
7.57 |
% |
|
| Return After Taxes on Distributions |
|
|
|
21.89 |
% |
|
|
|
|
6.90 |
% |
|
| Return After Taxes on Distributions and Sale of Fund Shares |
|
|
|
13.20 |
% |
|
|
|
|
5.63 |
% |
|
S&P 500 Index
(reflects no deduction for fees, expenses or taxes) |
|
|
|
17.88 |
% |
|
|
|
|
14.56 |
% |
|
|
| Performance Table Closing [Text Block] |
After-tax returns are calculated using the historical highest individual federal marginal income tax rates and do not reflect the impact of state and local taxes. In some instances, the “Return After Taxes on Distributions and Sale of Fund Shares” may be greater than “Return Before Taxes” because the investor is assumed to be able to use the capital loss from the sale of Fund shares to offset other taxable gains. Actual after-tax returns depend on an investor’s tax situation and may differ from those shown. After-tax returns shown are not relevant to investors who hold their Fund shares through tax-deferred arrangements, such as 401 (k) plans or individual retirement accounts, including “Roth” IRAs and SEP IRAs (collectively, “IRAs”).
|
| Performance Availability Website Address [Text] |
www.gabelli.com.
|
| Gabelli Global Technology Leaders ETF |
|
| Prospectus [Line Items] |
|
| Bar Chart and Performance Table [Heading] |
Performance
|
| Performance Narrative [Text Block] |
The bar chart and table that follow provide an indication of the risk of investing in the Global Technology Leaders Fund by showing changes in the Global Technology Leaders Fund’s performance from year to year and by showing how the Global Technology Leaders Fund’s average annual returns for one year, five years, and ten years, if applicable, compared with those of a broad-based securities market index. Prior to December 15, 2025, the Fund’s principal investment strategy was to invest at least 80% of the Fund’s assets in automation companies. Accordingly, performance prior to December 15, 2025 was attributable to the Fund’s prior investment strategy. As with all mutual funds, the Global Technology Leaders Fund’s past performance (before and after taxes) does not predict how the Global Technology Leaders Fund will perform in the future. Updated information on the Global Technology Leaders Fund’s results can be obtained by visiting www.gabelli.com.
|
| Performance Past Does Not Indicate Future [Text] |
As with all mutual funds, the Global Technology Leaders Fund’s past performance (before and after taxes) does not predict how the Global Technology Leaders Fund will perform in the future.
|
| Performance Information Illustrates Variability of Returns [Text] |
The bar chart and table that follow provide an indication of the risk of investing in the Global Technology Leaders Fund by showing changes in the Global Technology Leaders Fund’s performance from year to year and by showing how the Global Technology Leaders Fund’s average annual returns for one year, five years, and ten years, if applicable, compared with those of a broad-based securities market index.
|
| Bar Chart [Heading] |
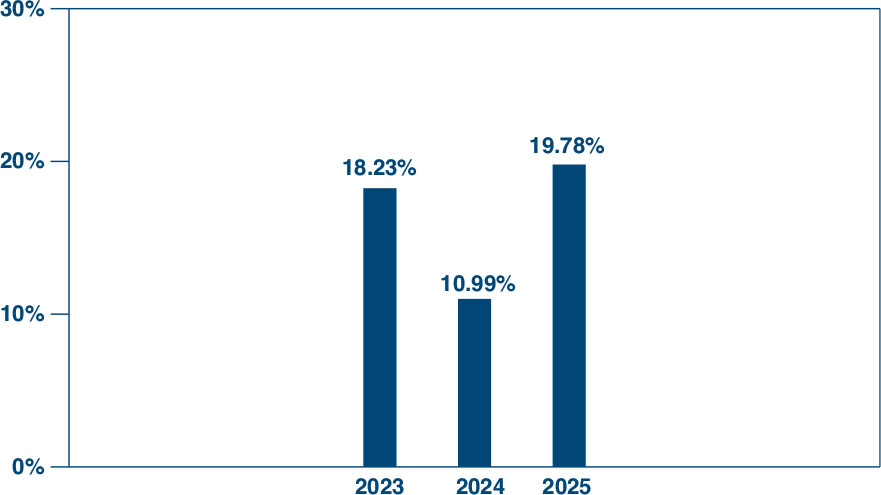
GLOBAL TECHNOLOGY LEADERS FUND(Total returns for the Year Ended December 31)
|
| Bar Chart [Table] |
| Years |
Returns |
| 2023 |
18.23% |
| 2024 |
10.99% |
| 2025 |
19.78% |
|
| Bar Chart Closing [Text Block] |
During the calendar years shown in the bar chart, the highest return for a quarter was 8.51% (quarter ended December 31, 2023) and the lowest return for a quarter was (3.38)% (quarter ended June 30, 2024).
|
| Highest Quarterly Return, Label [Optional Text] |
highest return for a quarter
|
| Highest Quarterly Return |
8.51%
|
| Highest Quarterly Return, Date |
Dec. 31, 2023
|
| Lowest Quarterly Return, Label [Optional Text] |
lowest return for a quarter
|
| Lowest Quarterly Return |
(3.38%)
|
| Lowest Quarterly Return, Date |
Jun. 30, 2024
|
| Performance Table Heading |
Average Annual Total Returns(for the years ended December 31, 2025,with the maximum sales charges, if applicable)
|
| Performance [Table] |
Average Annual Total Returns
(for the years ended December 31, 2025,
with the maximum sales charges, if applicable) |
|
Past
One Year |
|
|
Since Inception
(January 3, 2022) |
|
| Return Before Taxes |
|
|
|
19.78 |
% |
|
|
|
|
7.24 |
% |
|
| Return After Taxes On Distributions |
|
|
|
19.27 |
% |
|
|
|
|
6.87 |
% |
|
| Return After Taxes on Distributions and Sale of Fund Shares |
|
|
|
11.71 |
% |
|
|
|
|
5.46 |
% |
|
S&P 500 Index
(reflects no deduction for fees, expenses or taxes) |
|
|
|
17.88 |
% |
|
|
|
|
11.53 |
% |
|
|
| Performance Availability Website Address [Text] |
www.gabelli.com
|
| Gabelli Commercial Aerospace and Defense ETF |
|
| Prospectus [Line Items] |
|
| Bar Chart and Performance Table [Heading] |
Performance
|
| Performance Narrative [Text Block] |
The bar chart and table that follow provide an indication of the risk of investing in the Commercial Aerospace and Defense Fund by showing changes in the Fund’s performance from year to year and by showing how the Fund’s average annual returns for one year, five years, and ten years, if applicable, compared with those of a broad-based securities market index. Prior to March 10, 2023, the Fund operated under its prior name, the Gabelli Equity Income ETF. The Fund’s prior name reflected its former investment strategy of seeking to attain a high level of total return, with an emphasis on income, through investing at least 80% of its net assets in income producing equity securities. Accordingly, performance prior to March 10, 2023, was attributable to the Fund’s prior investment strategy. As with all mutual funds, the Aerospace and Defense Fund’s past performance (before and after taxes) does not predict how the Fund will perform in the future. Updated information on the Fund’s results can be obtained by visiting www.gabelli.com.
|
| Performance Past Does Not Indicate Future [Text] |
As with all mutual funds, the Aerospace and Defense Fund’s past performance (before and after taxes) does not predict how the Fund will perform in the future.
|
| Performance Information Illustrates Variability of Returns [Text] |
The bar chart and table that follow provide an indication of the risk of investing in the Commercial Aerospace and Defense Fund by showing changes in the Fund’s performance from year to year and by showing how the Fund’s average annual returns for one year, five years, and ten years, if applicable, compared with those of a broad-based securities market index.
|
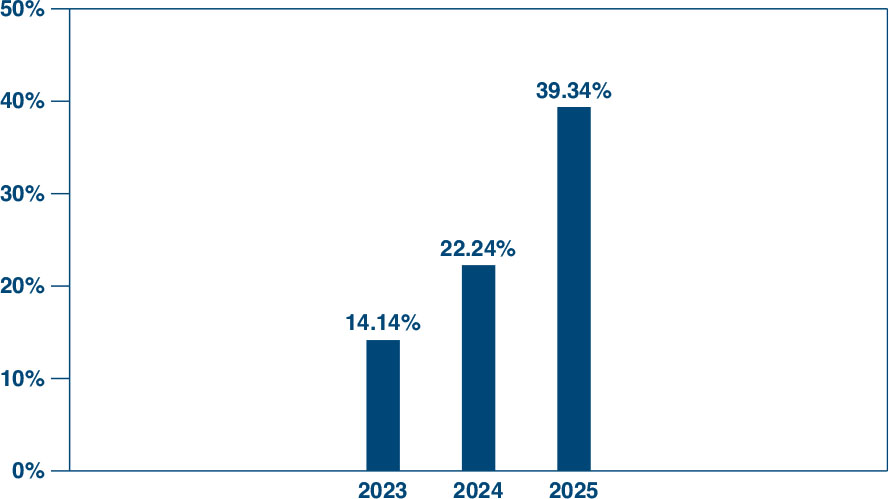
| Bar Chart [Table] |
| Years |
Returns |
| 2023 |
14.14% |
| 2024 |
22.24% |
| 2025 |
39.34% |
|
| Bar Chart Closing [Text Block] |
During the calendar years shown in the bar chart, the highest return for a quarter was 8.80% (quarter ended March 31, 2024) and the lowest return for a quarter was (6.99)% (quarter ended September 30, 2023).
|
| Highest Quarterly Return, Label [Optional Text] |
highest return for a quarter
|
| Highest Quarterly Return |
8.80%
|
| Highest Quarterly Return, Date |
Mar. 31, 2024
|
| Lowest Quarterly Return, Label [Optional Text] |
lowest return for a quarter
|
| Lowest Quarterly Return |
(6.99%)
|
| Lowest Quarterly Return, Date |
Sep. 30, 2023
|
| Performance Table Heading |
Average Annual Total Returns(for the years ended December 31, 2025,with the maximum sales charges, if applicable)
|
| Performance [Table] |
Average Annual Total Returns
(for the years ended December 31, 2025,
with the maximum sales charges, if applicable) |
|
Past
One Year |
|
|
Since Inception
(January 3, 2023) |
|
| Return Before Taxes |
|
|
|
39.34 |
% |
|
|
|
|
24.89 |
% |
|
| Return After Taxes On Distributions |
|
|
|
38.44 |
% |
|
|
|
|
24.24 |
% |
|
| Return After Taxes on Distributions and Sale of Fund Shares |
|
|
|
23.53 |
% |
|
|
|
|
19.60 |
% |
|
| S&P 500 Index |
|
|
|
17.88 |
% |
|
|
|
|
23.24 |
% |
|
|
| Performance Availability Website Address [Text] |
www.gabelli.com
|
| Gabelli Financial Services Opportunities ETF |
|
| Prospectus [Line Items] |
|
| Bar Chart and Performance Table [Heading] |
Performance
|
| Performance Narrative [Text Block] |
The bar chart and table that follow provide an indication of the risk of investing in the Financial Services Fund by showing changes in the Financial Services Fund’s performance from year to year and by showing how the Financial Services Fund’s average annual returns for one year, five years, and ten years, if applicable, compared with those of a broad-based securities market index. As with all mutual funds, the Financial Services Fund’s past performance (before and after taxes) does not predict how the Financial Services Fund will perform in the future. Updated information on the Financial Services Fund’s results can be obtained by visiting www.gabelli.com.
|
| Performance Past Does Not Indicate Future [Text] |
As with all mutual funds, the Financial Services Fund’s past performance (before and after taxes) does not predict how the Financial Services Fund will perform in the future.
|
| Performance Information Illustrates Variability of Returns [Text] |
The bar chart and table that follow provide an indication of the risk of investing in the Financial Services Fund by showing changes in the Financial Services Fund’s performance from year to year and by showing how the Financial Services Fund’s average annual returns for one year, five years, and ten years, if applicable, compared with those of a broad-based securities market index.
|
| Bar Chart [Heading] |
FINANCIAL SERVICES FUND (Total returns for the Year Ended December 31)
|
| Bar Chart [Table] |
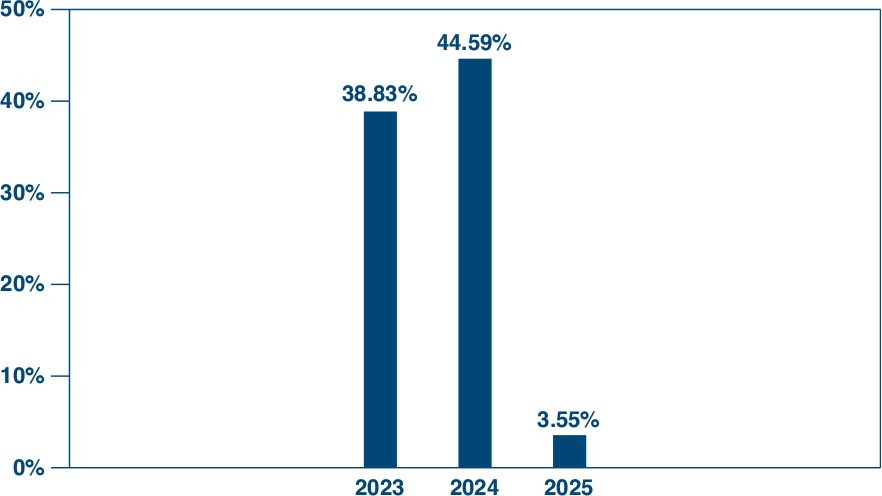
| Years |
Returns |
| 2023 |
38.83% |
| 2024 |
44.59% |
| 2025 |
3.55% |
|
| Bar Chart Closing [Text Block] |
During the calendar year shown in the bar chart, the highest return for a quarter was 18.38% (quarter ended December 31, 2023) and the lowest return for a quarter was 2.51% (quarter ended September 30, 2023).
|
| Performance Table Heading |
Average Annual Total Returns (for the years ended December 31, 2025)
|
| Performance [Table] |
|
Average Annual Total Returns
(for the years ended December 31, 2025) |
|
Past
One Year |
|
|
Since Inception
(May 10,
2022) |
|
| Return Before Taxes |
|
|
|
3.55 |
% |
|
|
|
|
22.37 |
% |
|
| Return After Taxes On Distributions |
|
|
|
2.74 |
% |
|
|
|
|
20.74 |
% |
|
| Return After Taxes on Distributions and Sale of Fund Shares |
|
|
|
2.11 |
% |
|
|
|
|
17.14 |
% |
|
| S&P 500 Financials Index |
|
|
|
15.02 |
% |
|
|
|
|
16.49 |
% |
|
| S&P 500 Index |
|
|
|
17.88 |
% |
|
|
|
|
17.65 |
% |
|
|
| Performance Availability Website Address [Text] |
www.gabelli.com
|
| Gabelli Financial Services Opportunities ETF | Gabelli Financial Services Opportunities ETF |
|
| Prospectus [Line Items] |
|
| Highest Quarterly Return, Label [Optional Text] |
highest return for a quarter
|
| Highest Quarterly Return |
18.38%
|
| Highest Quarterly Return, Date |
Dec. 31, 2023
|
| Lowest Quarterly Return, Label [Optional Text] |
lowest return for a quarter
|
| Lowest Quarterly Return |
2.51%
|
| Lowest Quarterly Return, Date |
Sep. 30, 2023
|
| Gabelli High Income ETF |
|
| Prospectus [Line Items] |
|
| Bar Chart and Performance Table [Heading] |
Performance
|
| Performance Narrative [Text Block] |
The Fund commenced operations on November 17, 2025, and, therefore, performance information is not yet available. Performance information will be available after the Fund has been in operation for one calendar year.
|
| Performance One Year or Less [Text] |
The Fund commenced operations on November 17, 2025, and, therefore, performance information is not yet available.
|
| Keeley Dividend ETF |
|
| Prospectus [Line Items] |
|
| Bar Chart and Performance Table [Heading] |
Performance
|
| Performance Narrative [Text Block] |
The Fund commenced operations on December 8, 2025, and, therefore, performance information is not yet available. Performance information will be available after the Fund has been in operation for one calendar year.
|
| Performance One Year or Less [Text] |
The Fund commenced operations on December 8, 2025, and, therefore, performance information is not yet available.
|
| Gabelli Opportunities in Live and Sports ETF |
|
| Prospectus [Line Items] |
|
| Bar Chart and Performance Table [Heading] |
Performance
|
| Performance Narrative [Text Block] |
The Fund commenced operations on December 31, 2025, and, therefore, performance information is not yet available. Performance information will be available after the Fund has been in operation for one calendar year.
|
| Performance One Year or Less [Text] |
Performance information will be available after the Fund has been in operation for one calendar year.
|
| Gabelli Equity Income ETF |
|
| Prospectus [Line Items] |
|
| Bar Chart and Performance Table [Heading] |
Performance
|
| Performance Narrative [Text Block] |
The Fund has not yet commenced operations, therefore, performance information is not yet available. Performance information will be available after the Fund has been in operation for one calendar year.
|
| Performance One Year or Less [Text] |
The Fund has not yet commenced operations, therefore, performance information is not yet available.
|
| Gabelli Small & Mid Cap ETF |
|
| Prospectus [Line Items] |
|
| Bar Chart and Performance Table [Heading] |
Performance
|
| Performance Narrative [Text Block] |
The Fund has not yet commenced operations, therefore, performance information is not yet available. Performance information will be available after the Fund has been in operation for one calendar year.
|
| Performance One Year or Less [Text] |
The Fund has not yet commenced operations, therefore, performance information is not yet available.
|
| Gabelli Micro Cap ETF |
|
| Prospectus [Line Items] |
|
| Bar Chart and Performance Table [Heading] |
Performance
|
| Performance Narrative [Text Block] |
The Fund has not yet commenced operations, therefore, performance information is not yet available. Performance information will be available after the Fund has been in operation for one calendar year.
|
| Performance One Year or Less [Text] |
The Fund has not yet commenced operations, therefore, performance information is not yet available.
|
| Gabelli Green Energy ETF |
|
| Prospectus [Line Items] |
|
| Bar Chart and Performance Table [Heading] |
Performance
|
| Performance Narrative [Text Block] |
The Fund has not yet commenced operations, therefore, performance information is not yet available. Performance information will be available after the Fund has been in operation for one calendar year.
|
| Performance One Year or Less [Text] |
Performance information will be available after the Fund has been in operation for one calendar year.
|