Shareholder Report
Feb. 28, 2026
USD ($)
$ / shares
WHAT WERE THE FUND COSTS FOR THE PAST YEAR? (based on a hypothetical $10,000 investment)
|
Class Name
|
Costs of a $10,000 investment
|
Costs paid as a percentage of a $10,000 investment
|
|
Institutional Class
|
$92
|
0.90%
|
HOW DID THE FUND PERFORM LAST YEAR AND WHAT AFFECTED ITS PERFORMANCE?
The Fund’s underperformance for fiscal year 2026 relative to the Russell Midcap Growth Total Return Index stemmed from the underperformance of the Fund’s holdings in the Industrials and Financials sectors, which detracted 5.11% and 2.59% from relative performance, respectively. These results were offset by positive performance of the Fund’s holdings in the Consumer Staples and Technology sectors, which contributed 2.70% and 3.03% to relative performance, respectively.
|
Top Contributors
|
|
|
↑
|
Amphenol Corp. - Class A
|
|
↑
|
Arista Networks, Inc.
|
|
↑
|
Monster Beverage Corp.
|
|
↑
|
IDEXX Laboratories, Inc.
|
|
↑
|
The Hershey Co.
|
|
Top Detractors
|
|
|
↓
|
Tyler Technologies, Inc.
|
|
↓
|
FactSet Research Systems, Inc.
|
|
↓
|
Copart, Inc.
|
|
↓
|
Pinterest, Inc. - Class A
|
|
↓
|
Morningstar, Inc.
|
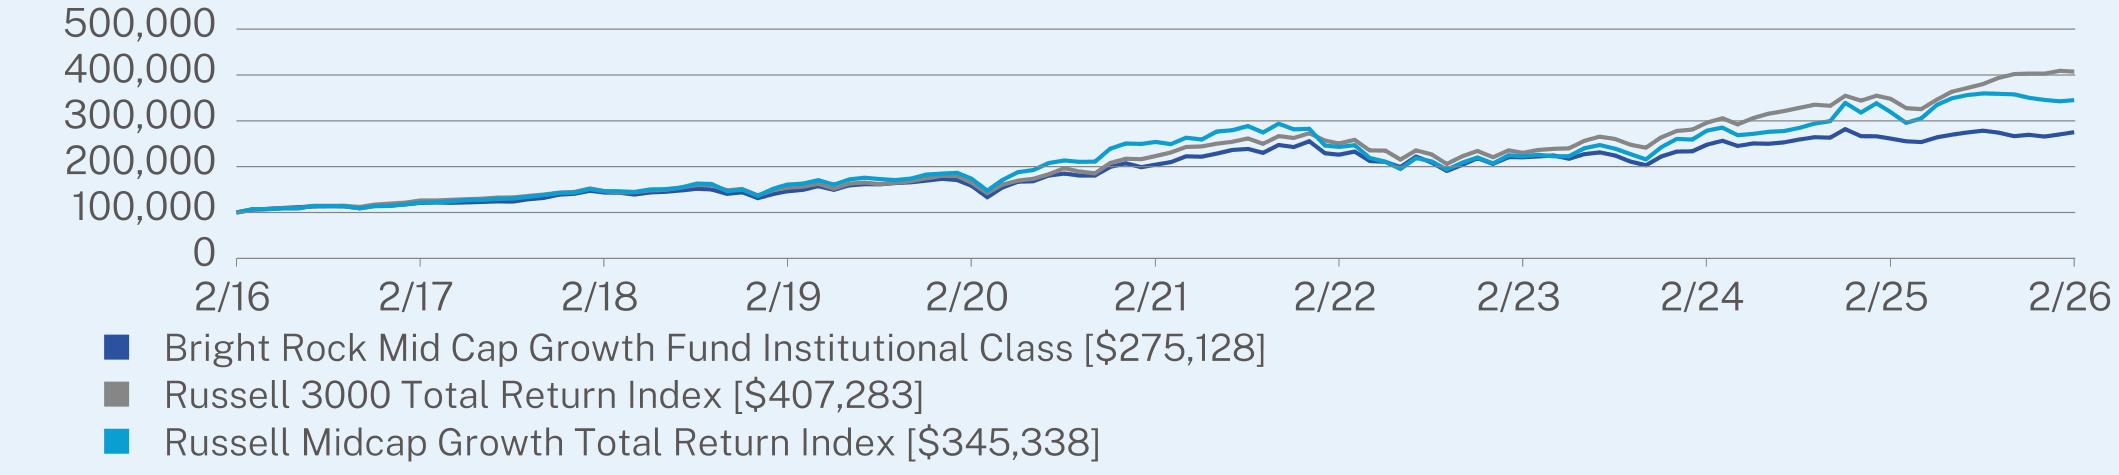
ANNUAL AVERAGE TOTAL RETURN (%)
|
|
1 Year
|
5 Year
|
10 Year
|
|
Institutional Class
|
5.31
|
6.14
|
10.65
|
|
Russell 3000 Total Return Index
|
17.02
|
12.80
|
15.08
|
|
Russell Midcap Growth Total Return Index
|
8.22
|
6.34
|
13.19
|
Visit https://www.brightrockfunds.com/literature.html for more recent performance information.
KEY FUND STATISTICS (as of February 28, 2026)
|
Net Assets
|
$98,637,929
|
|
Number of Holdings
|
36
|
|
Net Advisory Fee
|
$508,081
|
|
Portfolio Turnover
|
16%
|
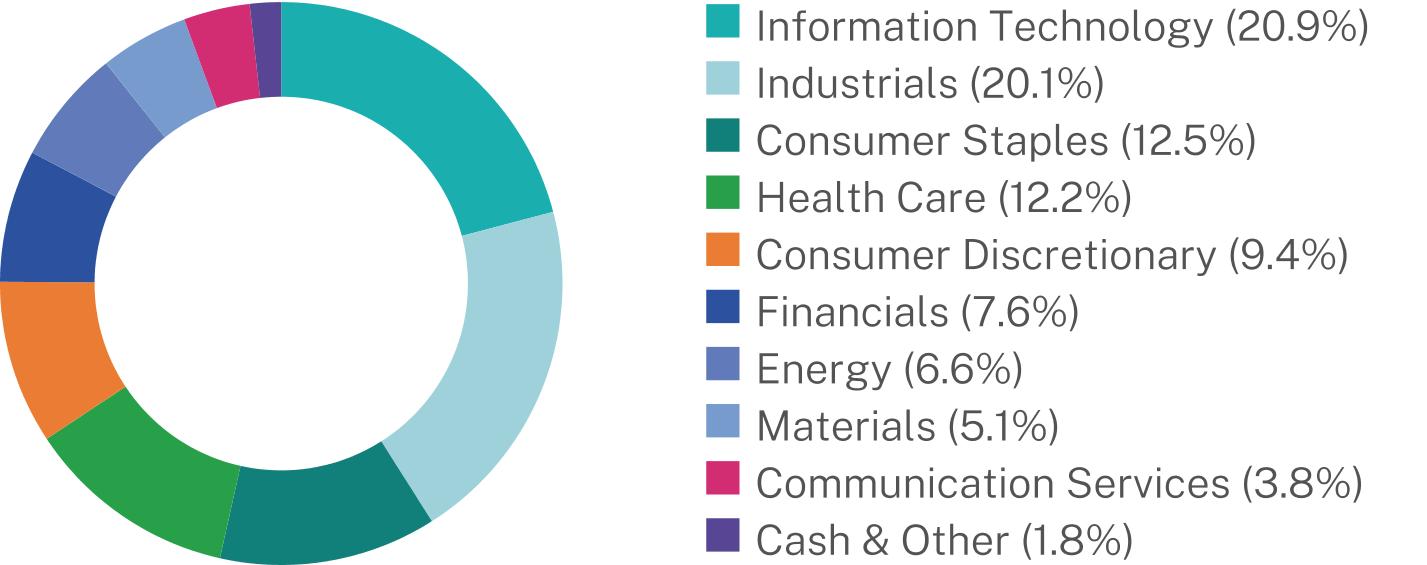
WHAT DID THE FUND INVEST IN? (% of net assets as of February 28, 2026)
|
Top 10 Issuers
|
(%)
|
|
Amphenol Corp.
|
6.4%
|
|
Arista Networks, Inc.
|
6.1%
|
|
The Hershey Co.
|
4.8%
|
|
Fastenal Co.
|
4.7%
|
|
IDEXX Laboratories, Inc.
|
4.7%
|
|
Monster Beverage Corp.
|
4.6%
|
|
AMETEK, Inc.
|
4.2%
|
|
Tractor Supply Co.
|
4.2%
|
|
ResMed, Inc.
|
4.0%
|
|
Jack Henry & Associates, Inc.
|
3.2%
|
Sector Breakdown*
This is a summary of certain changes to the Fund for the period of March 1, 2025, to February 28, 2026. For more complete information, you may review the Fund’s prospectus at https://www.brightrockfunds.com/literature.html or upon request at 1-866-273-7223.
Effective June 28, 2025, the Fund’s annual management fee rate was reduced from 0.75% to 0.45% of the Fund’s average daily net assets.
WHAT WERE THE FUND COSTS FOR THE PAST YEAR? (based on a hypothetical $10,000 investment)
|
Class Name
|
Costs of a $10,000 investment
|
Costs paid as a percentage of a $10,000 investment
|
|
Institutional Class
|
$74
|
0.71%
|
HOW DID THE FUND PERFORM LAST YEAR AND WHAT AFFECTED ITS PERFORMANCE?
The Fund’s underperformance for the fiscal year 2026 relative to the S&P 500 Total Return Index was driven primarily by our stock selection within the Technology sector. The Fund’s Technology sector holdings returned -8.37%, compared to 20.61% for the sector as a whole. 3 of the Fund’s 5 largest performance detractors were Roper Technologies, Inc., Accenture PLC, and Intuit, Inc. all of which are in the Technology sector.
|
Top Contributors
|
|
|
↑
|
Alphabet, Inc. - Class A
|
|
↑
|
Merck & Co., Inc.
|
|
↑
|
iShares U.S. Energy ETF
|
|
↑
|
TJX Cos., Inc.
|
|
↑
|
NextEra Energy, Inc.
|
|
Top Detractors
|
|
|
↓
|
UnitedHealth Group, Inc.
|
|
↓
|
Accenture PLC - Class A
|
|
↓
|
Roper Technologies, Inc.
|
|
↓
|
Intuit, Inc.
|
|
↓
|
Copart, Inc.
|
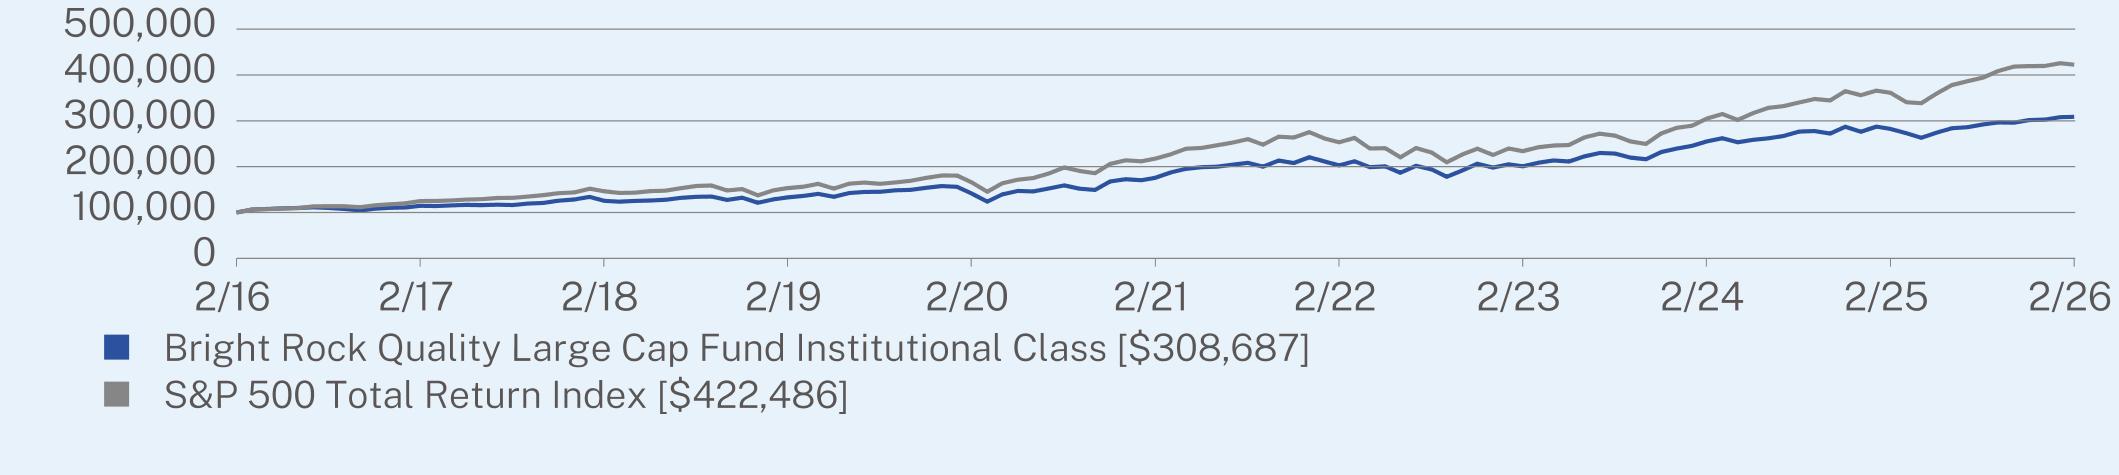
ANNUAL AVERAGE TOTAL RETURN (%)
|
|
1 Year
|
5 Year
|
10 Year
|
|
Institutional Class
|
9.37
|
11.92
|
11.93
|
|
S&P 500 Total Return Index
|
16.99
|
14.19
|
15.50
|
Visit https://www.brightrockfunds.com/literature.html for more recent performance information.
KEY FUND STATISTICS (as of February 28, 2026)
|
Net Assets
|
$438,328,874
|
|
Number of Holdings
|
43
|
|
Net Advisory Fee
|
$2,088,248
|
|
Portfolio Turnover
|
46%
|
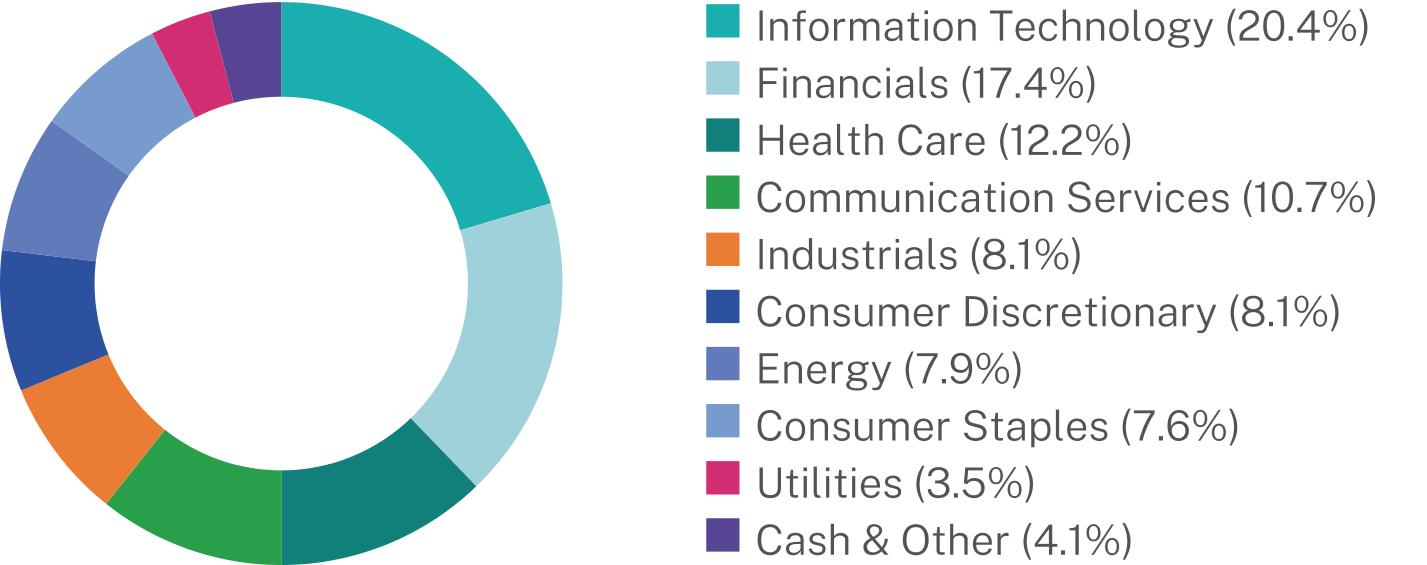
WHAT DID THE FUND INVEST IN? (% of net assets as of February 28, 2026)
|
Top 10 Issuers
|
(%)
|
|
Alphabet, Inc.
|
7.5%
|
|
Microsoft Corp.
|
5.7%
|
|
iShares U.S. Energy ETF
|
4.0%
|
|
Merck & Co., Inc.
|
4.0%
|
|
Mastercard, Inc.
|
3.5%
|
|
Chubb Ltd.
|
3.5%
|
|
TJX Cos., Inc.
|
3.4%
|
|
Apple, Inc.
|
3.4%
|
|
Thermo Fisher Scientific, Inc.
|
3.3%
|
|
Union Pacific Corp.
|
3.2%
|
Sector Breakdown*
This is a summary of certain changes to the Fund for the period of March 1, 2025, to February 28, 2026. For more complete information, you may review the Fund’s prospectus at https://www.brightrockfunds.com/literature.html or upon request at 1-866-273-7223.
Effective June 28, 2025, the Fund’s annual management fee rate was reduced from 0.65% to 0.45% of the Fund’s average daily net assets.
| [1] |
|
||
| [2] |
|