Exhibit 99.1
IGI Investor Presentation First Quarter 2026 May 2026
Forward Looking Statements 2 International General Insurance Holdings Ltd. This presentation contains “forward - looking statements” within the meaning of the “safe harbour” provisions of the Private Securities Litigation Reform Act of 1995. The expectations, estimates, and projections of the business of IGI may differ from its actual results and, consequently, you should not rely on forward - looking statements as predictions of future events. Words such as “ability,” “aim,” “impact,” “seek,” “strategy,” “expect,” “estimate,” “project,” “budget,” “forecast,” “anticipate,” “intend,” “plan,” “may,” “will,” “could,” “should,” “believe,” “predict,” “potential,” “continue,” “commitment,” “able,” “success” and similar expressions are intended to identify such forward - looking statements. Forward - looking statements contained in this presentation may include, but are not limited to, our expectations regarding the performance of our business, our financial results, our liquidity and capital resources, the outcome of our strategic initiatives, our expectations regarding other market conditions, and our growth prospects. These forward - looking statements involve significant risks and uncertainties that could cause the actual results to differ materially from the expected results. Most of these factors are outside of the control of IGI and are difficult to predict. Factors that may cause such differences include, but are not limited to: (1) changes in demand for IGI’s services together with the possibility that IGI may be adversely affected by other economic, business, and/or competitive factors globally and in the regions in which it operates; (2) competition, the ability of IGI to grow and manage growth profitably, and IGI’s ability to retain its key employees; (3) changes in applicable laws or regulations; (4) risks related to fluctuations in global currencies including the UK Pound Sterling, the Euro, and the U.S. Dollar; (5) the outcome of any legal proceedings that may be instituted against the Company; (6) the effects of the hostilities between Russia and Ukraine, and the sanctions imposed on Russia by the United States, European Union, United Kingdom and others; (7) the effects of military conflicts in the Middle East, including disruptions in the Strait of Hormuz and Persian Gulf and potential disruption of Red Sea international shipping routes; (8) the impact of the tariffs that have been imposed or may be imposed by the U.S. administration; (9) the potential impact of artificial intelligence technologies on the insurance industry and the ability of IGI to effectively deploy AI technologies; (10) the inability to maintain the listing of the Company’s common shares on Nasdaq; and (11) other risks and uncertainties indicated in IGI’s filings with the SEC. The foregoing list of factors is not exclusive. In addition, forward - looking statements are inherently based on various estimates and assumptions that are subject to the judgment of those preparing them and are also subject to significant economic, competitive, industry and other uncertainties and contingencies, all of which are difficult or impossible to predict and many of which are beyond the control of IGI. There can be no assurance that IGI’s financial condition or results of operations will be consistent with those set forth in such forward - looking statements. You should not place undue reliance upon any forward - looking statements, which speak only as of the date made. IGI does not undertake or accept any obligation or undertaking to release publicly any updates or revisions to any forward - looking statements to reflect any change in its expectations or any change in events, conditions, or circumstances on which any such statement is based except to the extent that it is required by law.
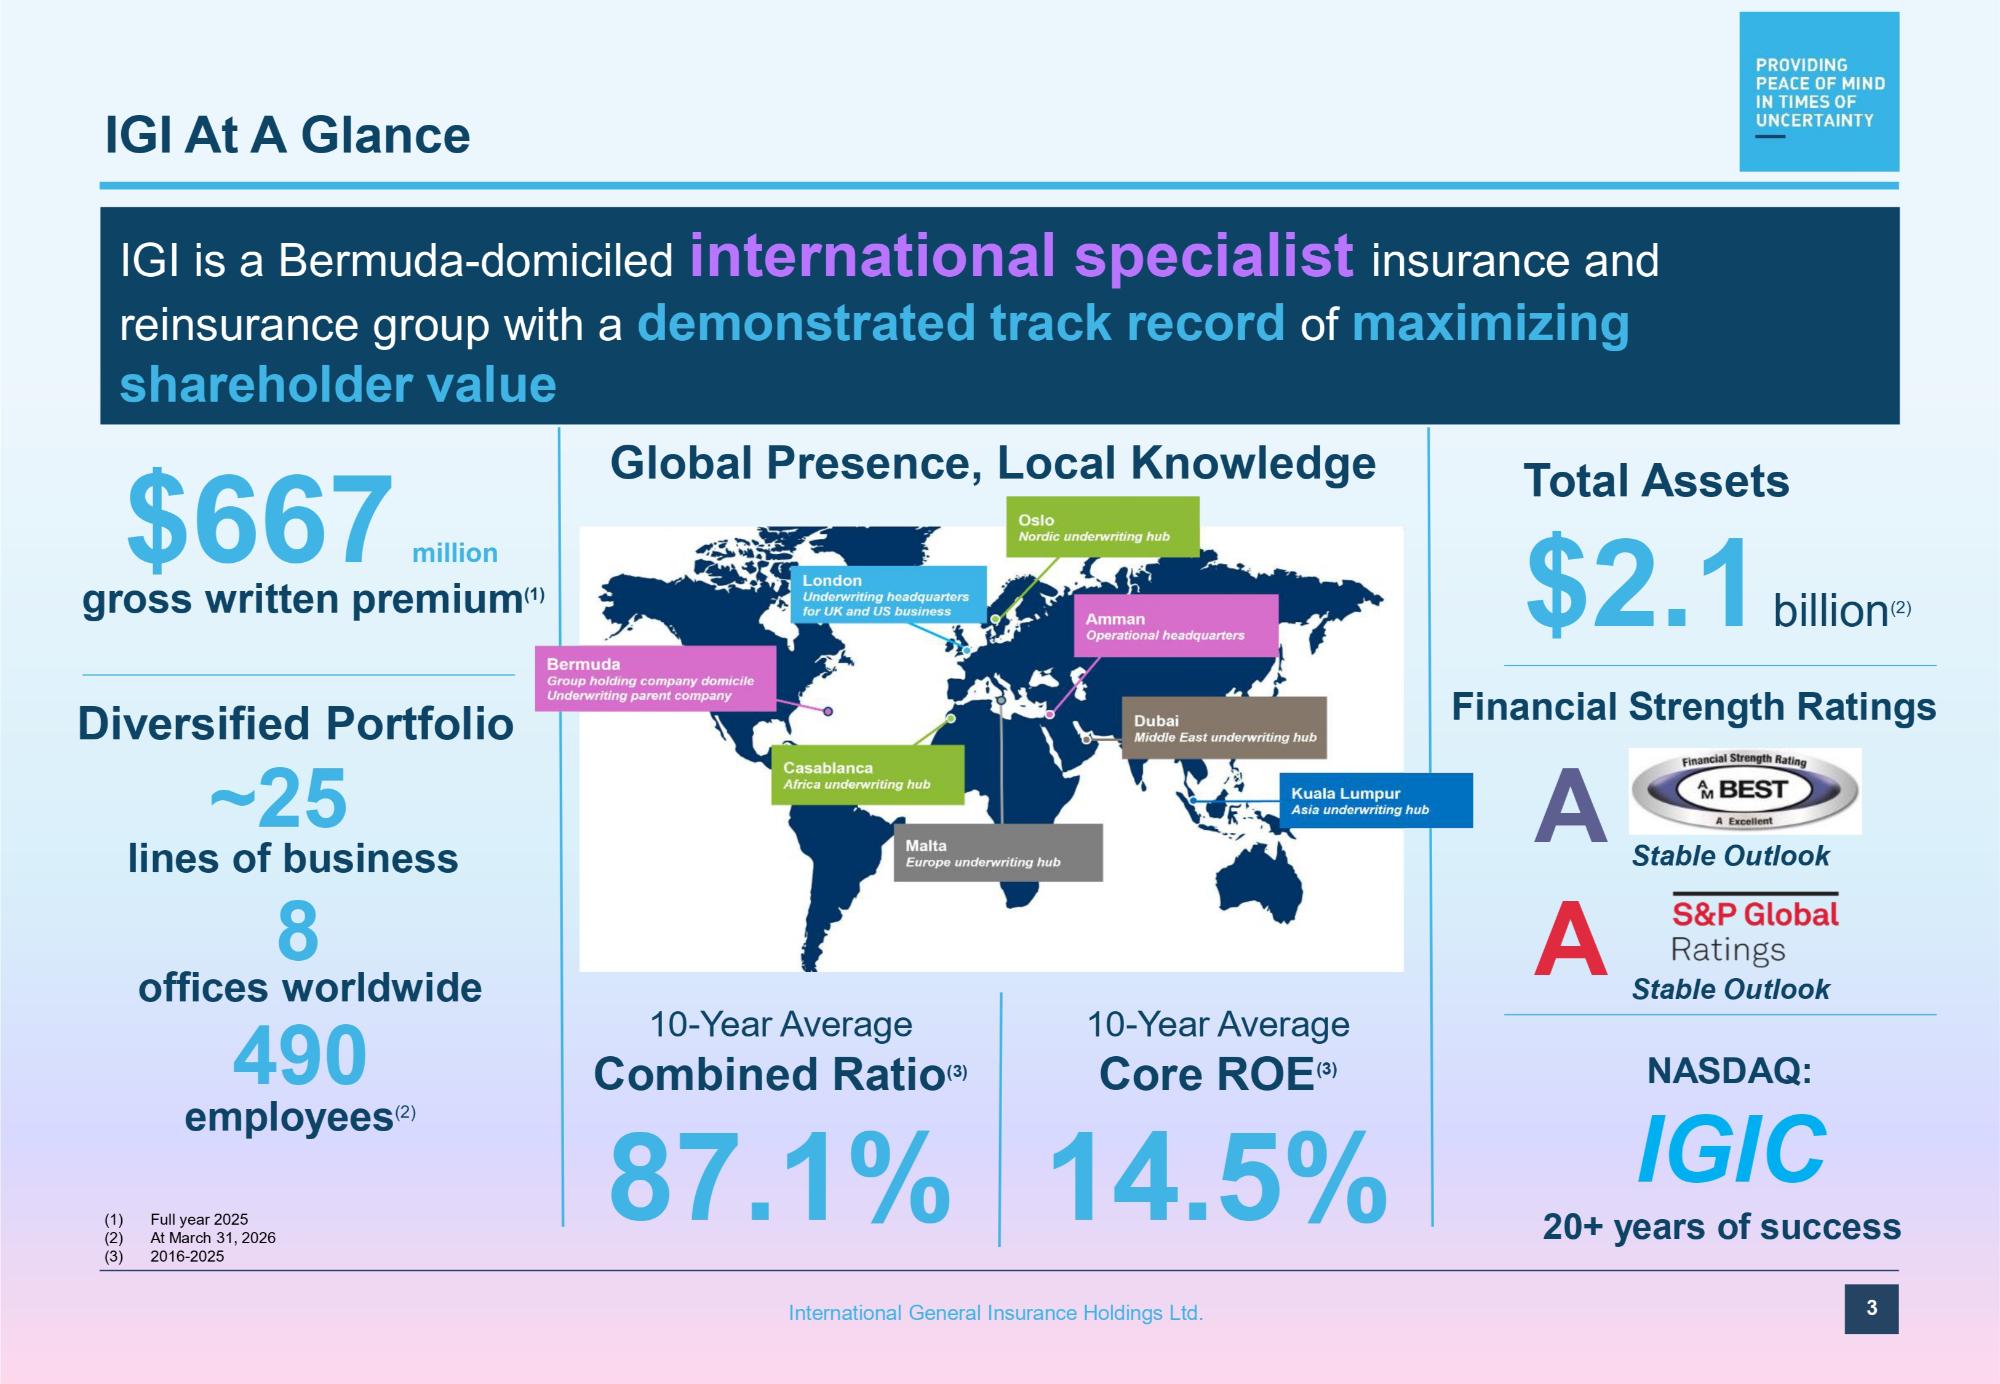
IGI At A Glance IGI is a Bermuda - domiciled international specialist insurance and reinsurance group with a demonstrated track record of maximizing shareholder value $667 million Total Assets $2. 1 b il l i o n (2) A A Stable Outlook Financial Strength Ratings 10 - Year Average Core ROE (3) 14.5% 10 - Year Average Combined Ratio (3) 87.1% Global Presence, Local Knowledge (1) Full year 2025 (2) At March 31, 2026 (3) 2016 - 2025 gross written premium (1) ~25 lines of business 8 offices worldwide 490 employees (2) Diversified Portfolio 3 International General Insurance Holdings Ltd. NASDAQ: IGIC 20+ years of success Stable Outlook
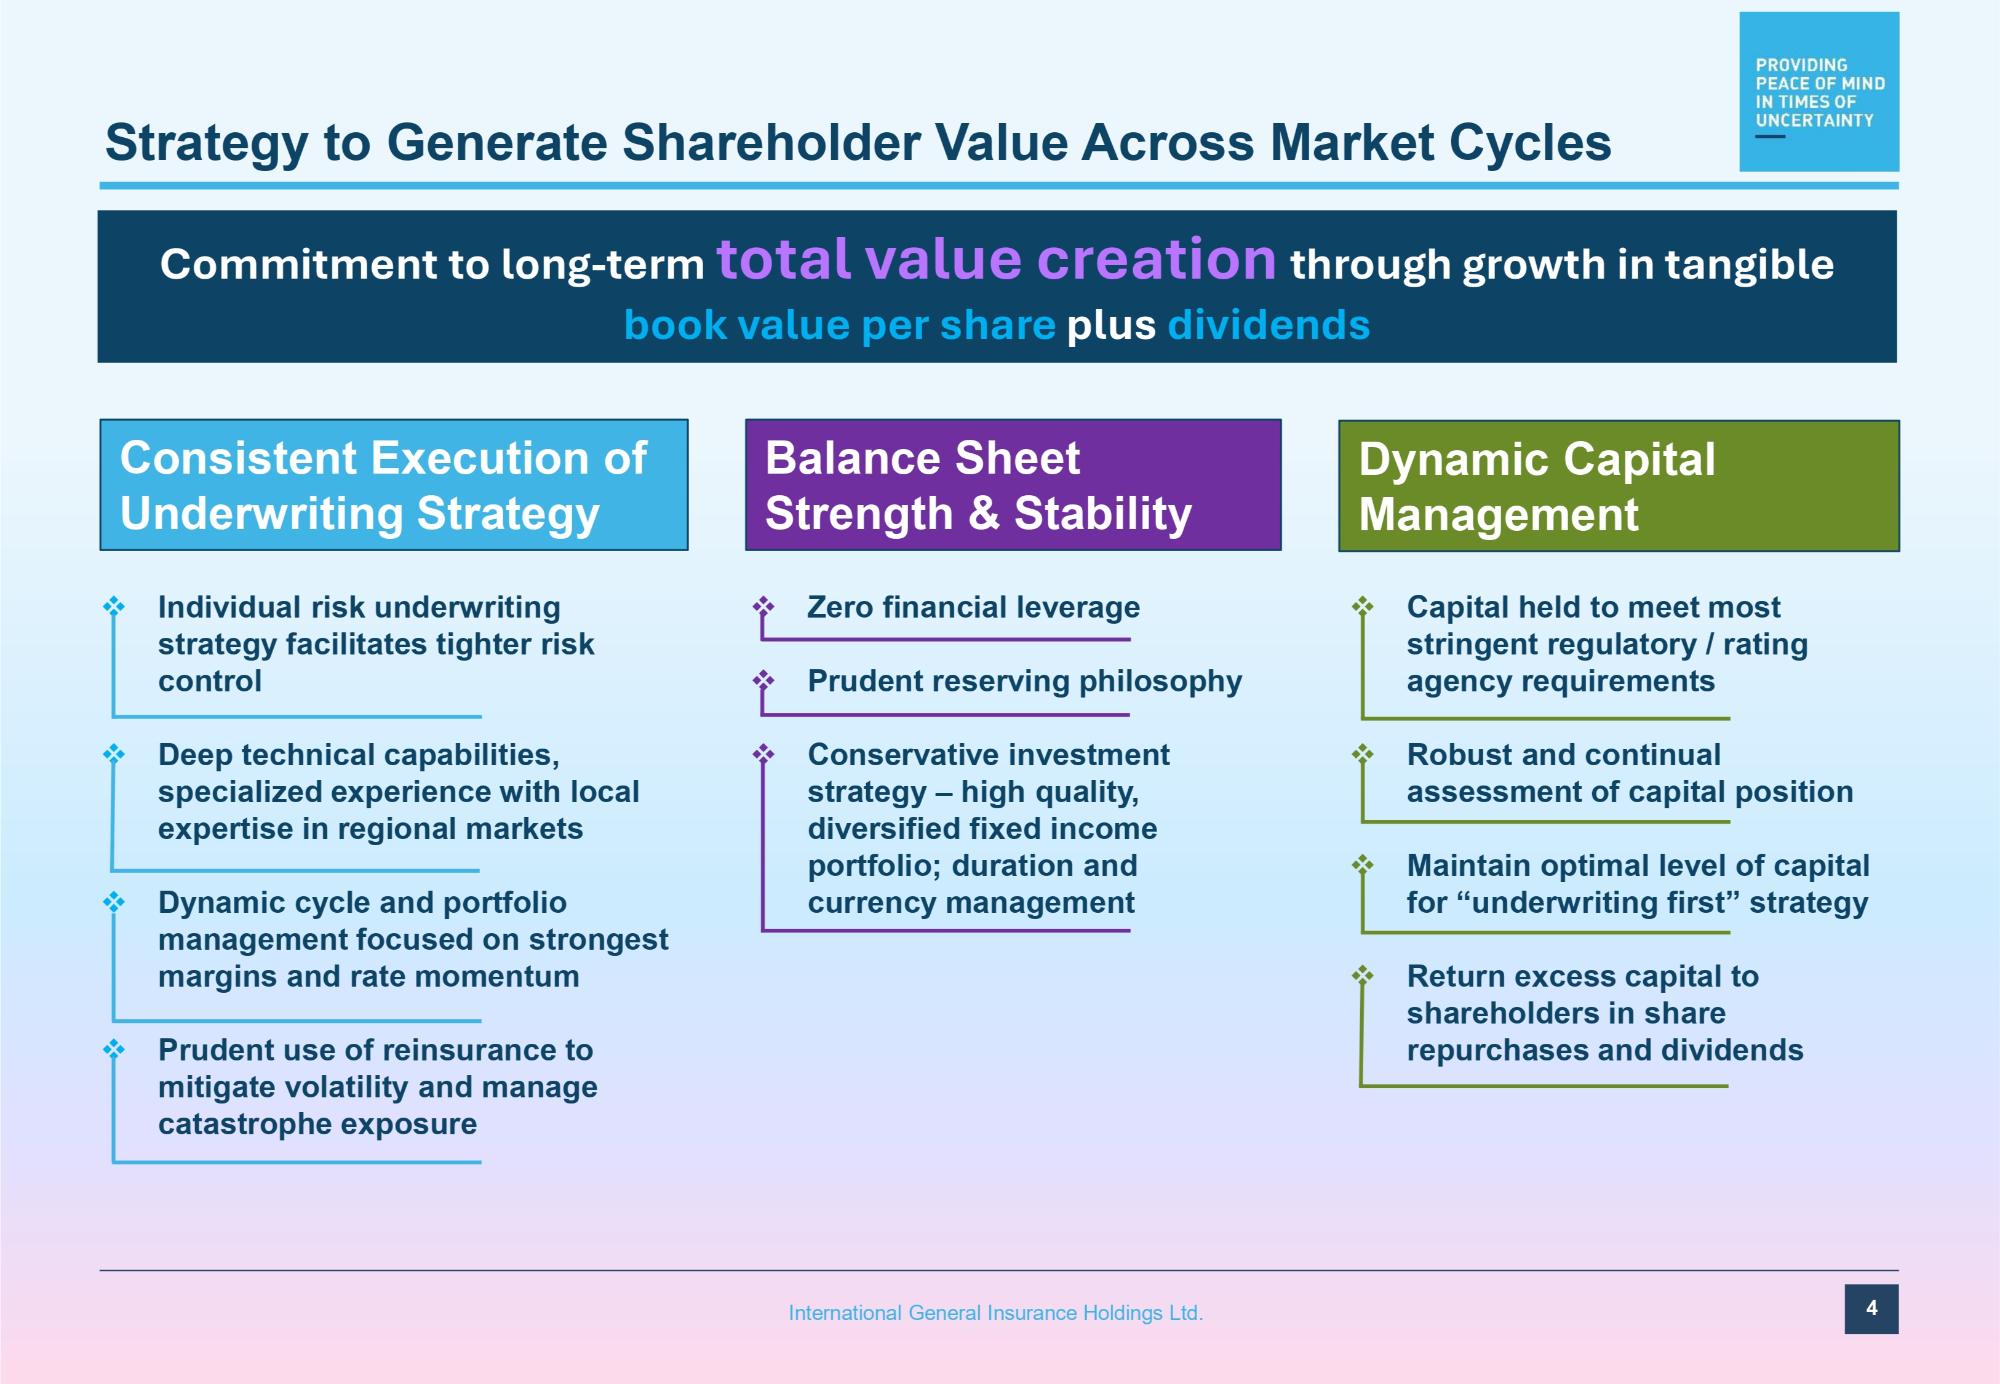
Strategy to Generate Shareholder Value Across Market Cycles Balance Sheet Strength & Stability Consistent Execution of Underwriting Strategy Dynamic Capital Management □ Individual risk underwriting strategy facilitates tighter risk control □ Deep technical capabilities, specialized experience with local expertise in regional markets □ Dynamic cycle and portfolio management focused on strongest margins and rate momentum □ Prudent use of reinsurance to mitigate volatility and manage catastrophe exposure □ Zero financial leverage □ Prudent reserving philosophy □ Conservative investment strategy – high quality, diversified fixed income portfolio; duration and currency management □ Capital held to meet most stringent regulatory / rating agency requirements □ Robust and continual assessment of capital position □ Maintain optimal level of capital for “underwriting first” strategy □ Return excess capital to shareholders in share repurchases and dividends Commitment to long - term total value creation through growth in tangible book value per share plus dividends 4 International General Insurance Holdings Ltd.
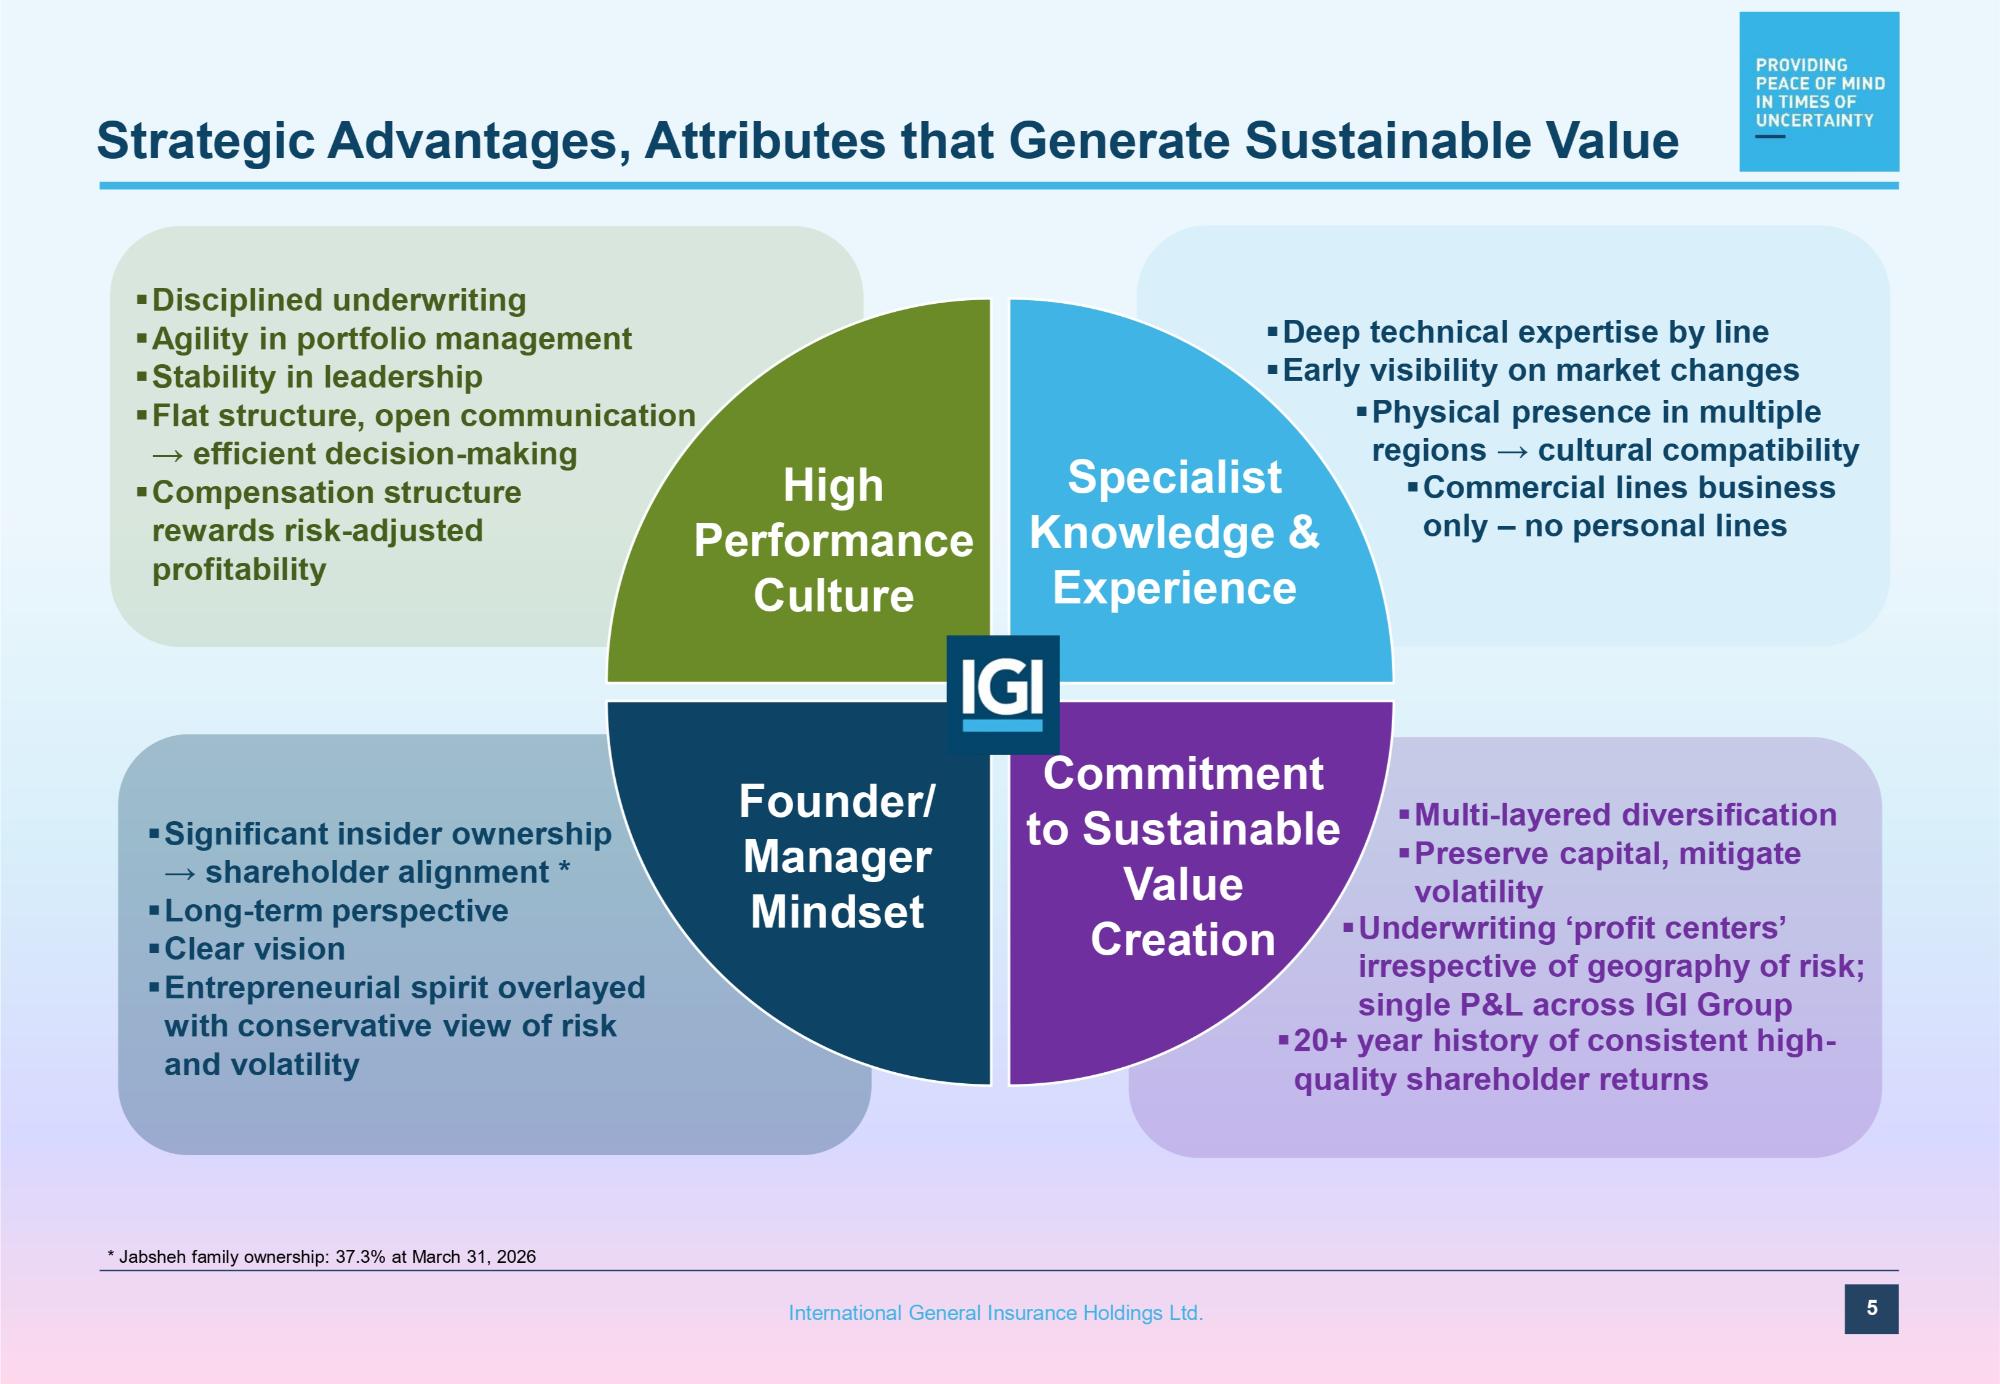
Strategic Advantages, Attributes that Generate Sustainable Value 5 International General Insurance Holdings Ltd. ▪ Disciplined underwriting ▪ Agility in portfolio management ▪ Stability in leadership ▪ Flat structure, open communication → efficient decision - making ▪ Compensation structure rewards risk - adjusted profitability ▪ Significant insider ownership → shareholder alignment * ▪ Long - term perspective ▪ Clear vision ▪ Entrepreneurial spirit overlayed with conservative view of risk and volatility ▪ Multi - layered diversification ▪ Preserve capital, mitigate volatility ▪ Commercial lines business only – no personal lines High Performance Culture Founder/ Manager Mindset Commitment to Sustainable Value Creation Specialist Knowledge & Experience ▪ 20+ year history of consistent high - quality shareholder returns * Jabsheh family ownership: 37.3% at March 31, 2026 ▪ Underwriting ‘profit centers’ irrespective of geography of risk; single P&L across IGI Group ▪ Deep technical expertise by line ▪ Early visibility on market changes ▪ Physical presence in multiple regions → cultural compatibility
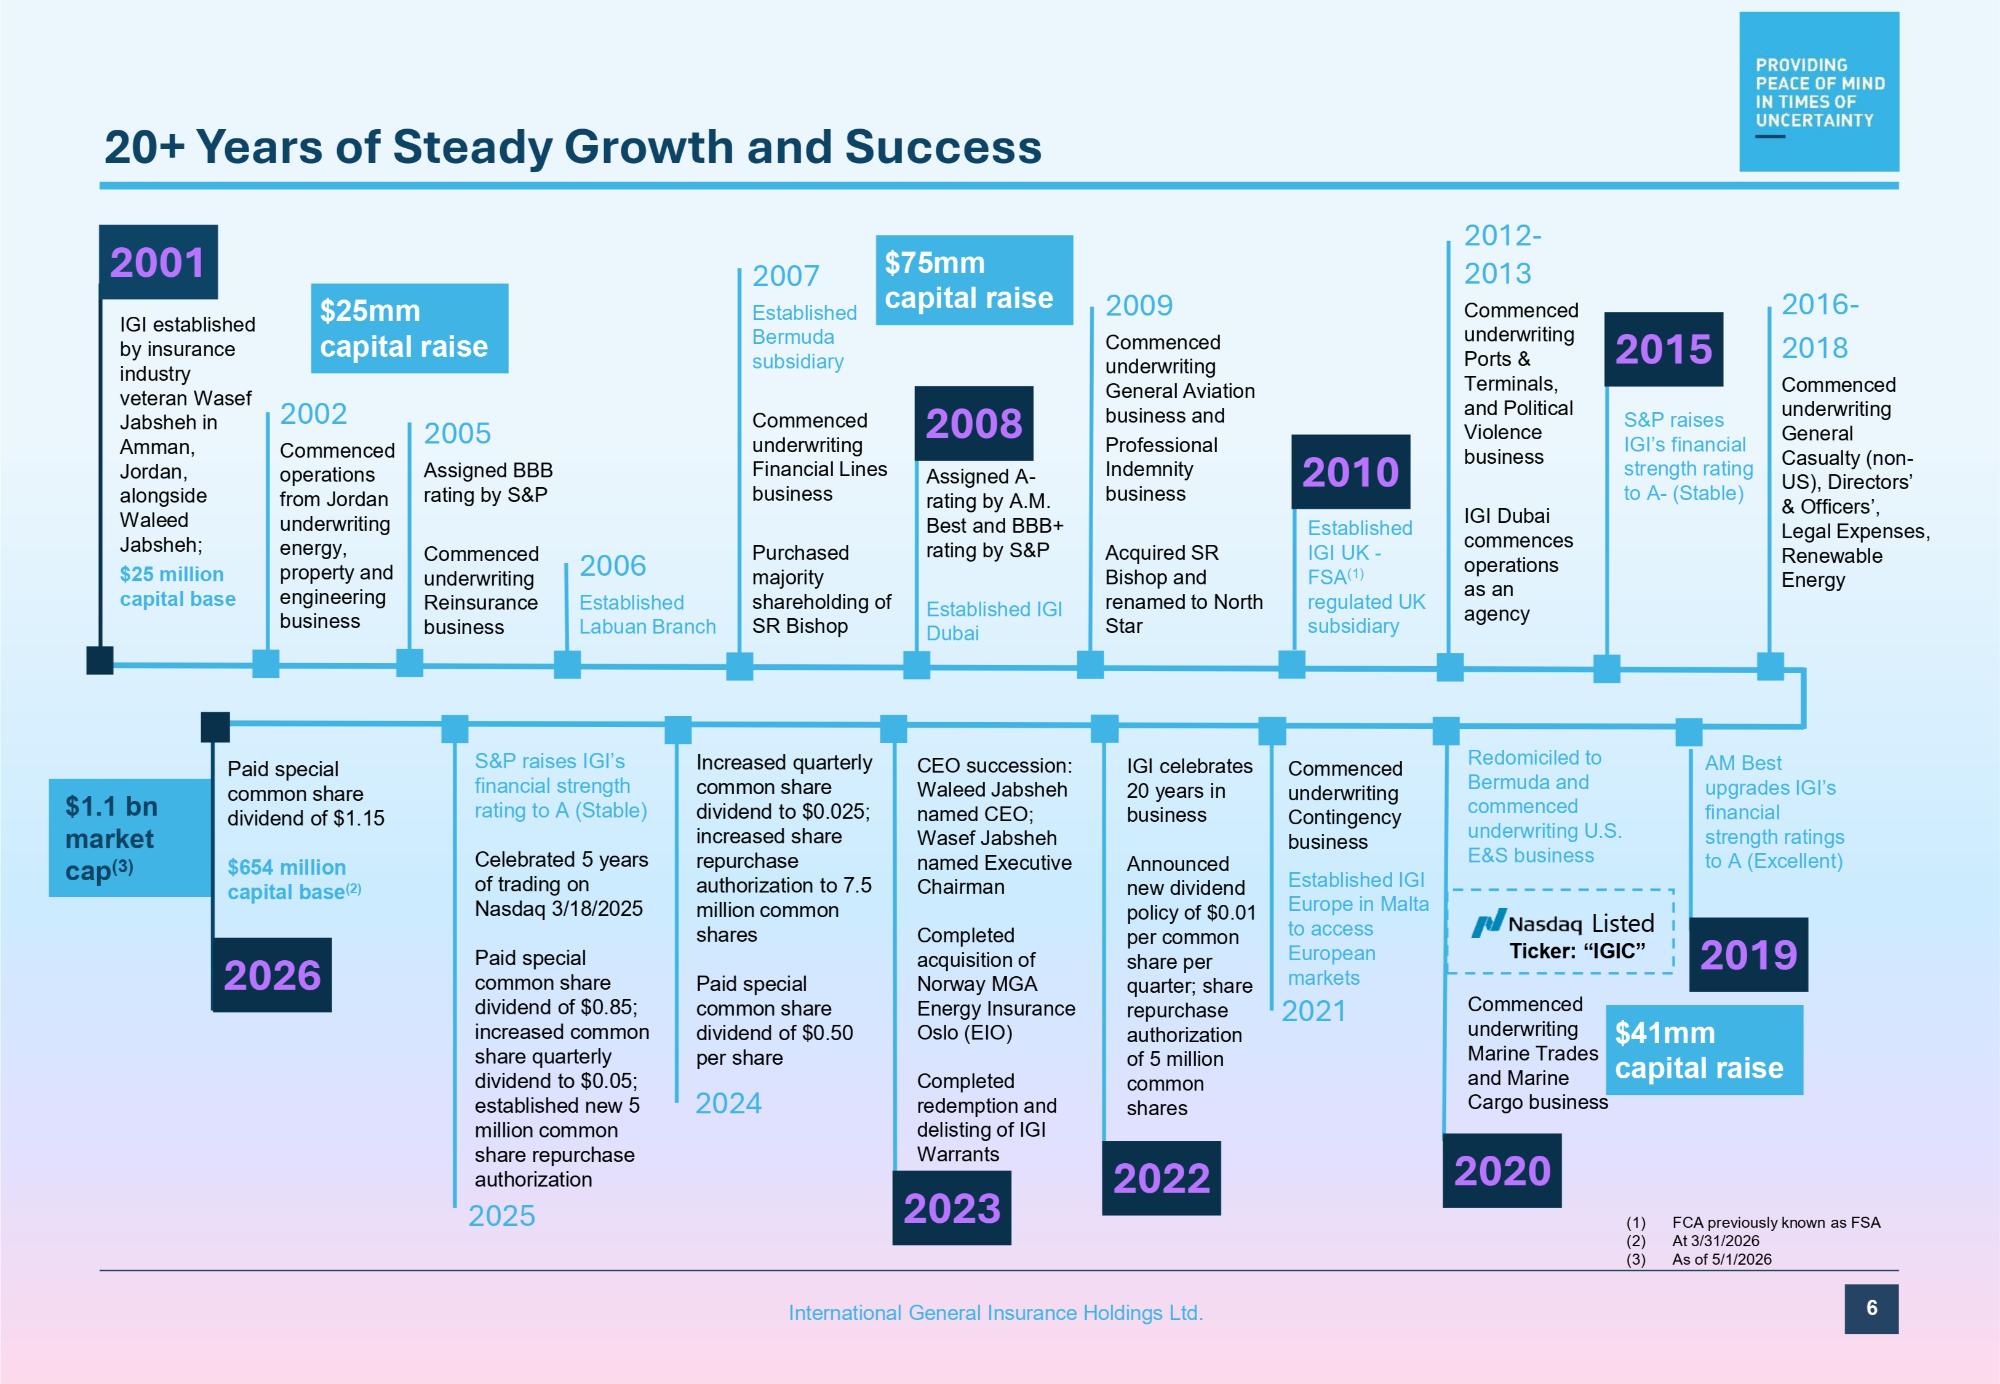
S&P raises IGI’s financial strength rating to A (Stable) Celebrated 5 years of trading on Nasdaq 3/18/2025 Paid special common share dividend of $1.15 $654 million capital base (2) 20+ Years of Steady Growth and Success (1) FCA previously known as FSA (2) At 3/31/2026 (3) As of 5/1/2026 Redomiciled to Bermuda and commenced underwriting U.S. E&S business Commenced underwriting Marine Trades and Marine Cargo business CEO succession: Waleed Jabsheh named CEO; Wasef Jabsheh named Executive Chairman Completed acquisition of Norway MGA Energy Insurance Oslo (EIO) Completed redemption and delisting of IGI Warrants IGI celebrates 20 years in business Announced new dividend policy of $0.01 per common share per quarter; share repurchase authorization of 5 million common shares 2002 Commenced operations from Jordan underwriting energy, property and engineering business 2005 Assigned BBB rating by S&P Commenced underwriting Reinsurance business Assigned A - rating by A.M. Best and BBB+ rating by S&P Established IGI Dubai Established IGI UK - FSA (1) regulated UK subsidiary 2016 - 2018 Commenced underwriting General Casualty (non - US), Directors’ & Officers’, Legal Expenses, Renewable Energy 2006 Established Labuan Branch 2007 Established Bermuda subsidiary Commenced underwriting Financial Lines business Purchased majority shareholding of SR Bishop 2009 Commenced underwriting General Aviation business and Professional Indemnity business Acquired SR Bishop and renamed to North Star AM Best upgrades IGI’s financial strength ratings to A (Excellent) S&P raises IGI’s financial strength rating to A - (Stable) $75mm capital raise $1.1 bn market cap (3) 2012 - 2013 Commenced underwriting Ports & Terminals, and Political Violence business IGI Dubai commences operations as an agency Commenced underwriting Contingency business Established IGI Europe in Malta to access European markets 2021 Listed Ticker: “IGIC” IGI established by insurance industry veteran Wasef Jabsheh in Amman, Jordan, alongside Waleed Jabsheh; $25 million capital base 2001 2010 $25mm capital raise 2022 2008 201G 2015 2020 2023 $41mm capital raise Increased quarterly common share dividend to $0.025; increased share repurchase authorization to 7.5 million common shares 2026 6 International General Insurance Holdings Ltd. Paid special common share dividend of $0.50 per share 2024 Paid special common share dividend of $0.85; increased common share quarterly dividend to $0.05; established new 5 million common share repurchase authorization 2025
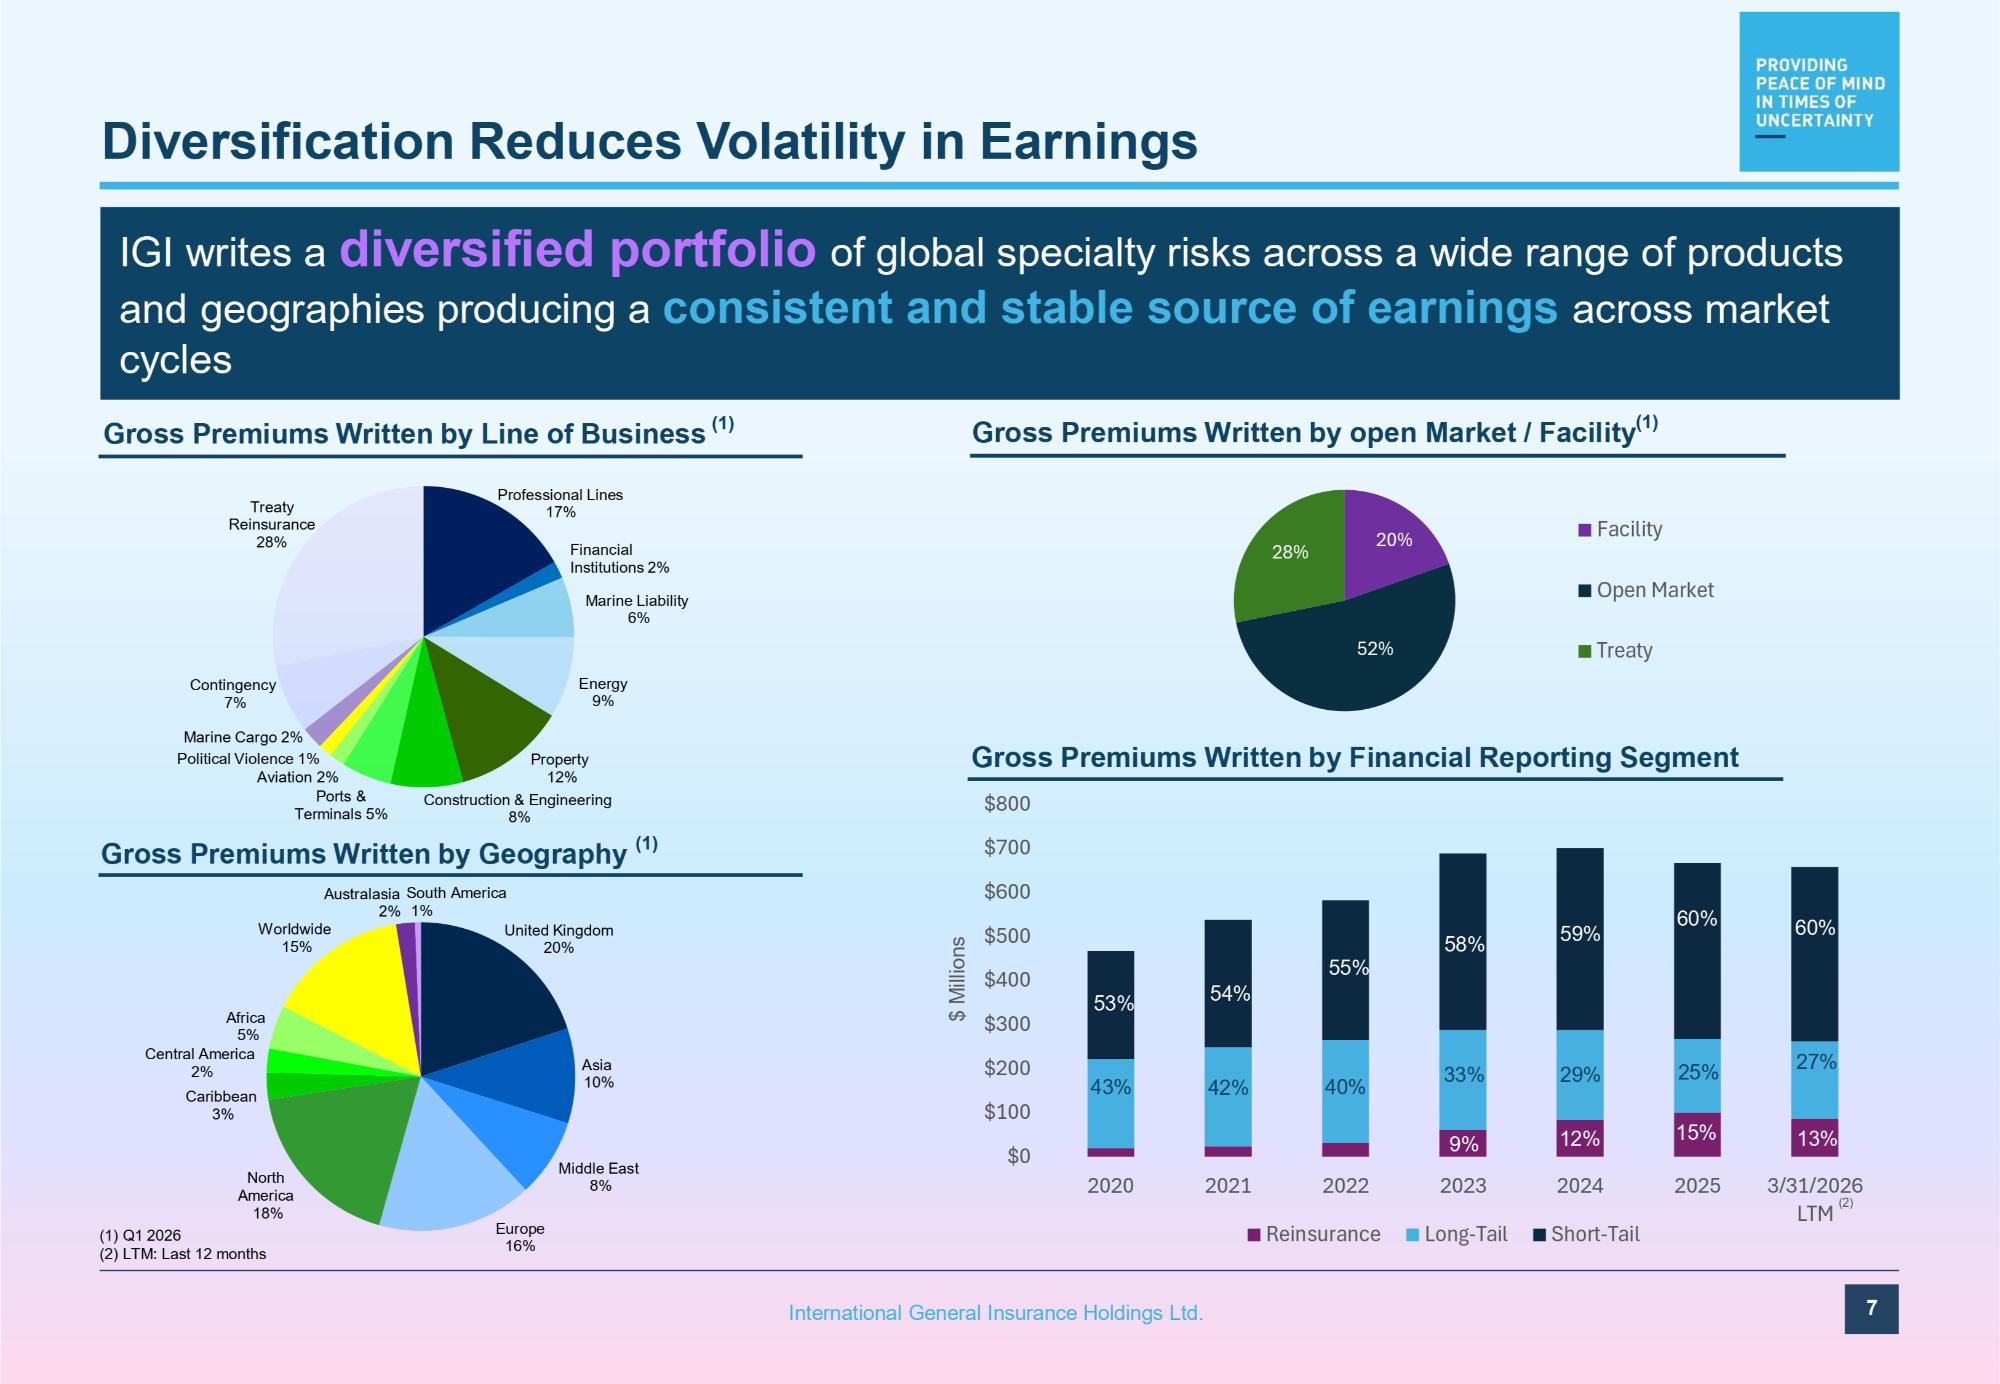
United Kingdom 20% Asia 10% Middle East 8% Europe 16% North America 18% Africa 5% Central America 2% Caribbean 3% Worldwide 15% Australasia South America 2% 1% $800 $700 $600 $500 $400 $300 $200 $100 $0 2020 2021 2025 3/31/2026 LTM 2022 Reinsurance 2023 Long - Tail 2024 Short - Tail Diversification Reduces Volatility in Earnings IGI writes a diversified portfolio of global specialty risks across a wide range of products and geographies producing a consistent and stable source of earnings across market cycles Gross Premiums Written by Financial Reporting Segment Gross Premiums Written by Geography (1) (1) Q1 2026 (2) LTM: Last 12 months 60% 25% 15% 59% 29% 12% 58% 33% 9% 55% 54% 53% 40% 42% 43% $ Millions Gross Premiums Written by Line of Business (1) Gross Premiums Written by open Market / Facility (1) Professional Lines 17% Financial Institutions 2% Marine Liability 6% Energy 9% Property 12% Construction & Engineering 8% Marine Cargo 2% Political Violence 1% Aviation 2% Ports & Terminals 5% Contingency 7% Treaty Reinsurance 28% 20% 52% 28% Facility Open Market Treaty 7 International General Insurance Holdings Ltd. 60% 13% 27% (2)
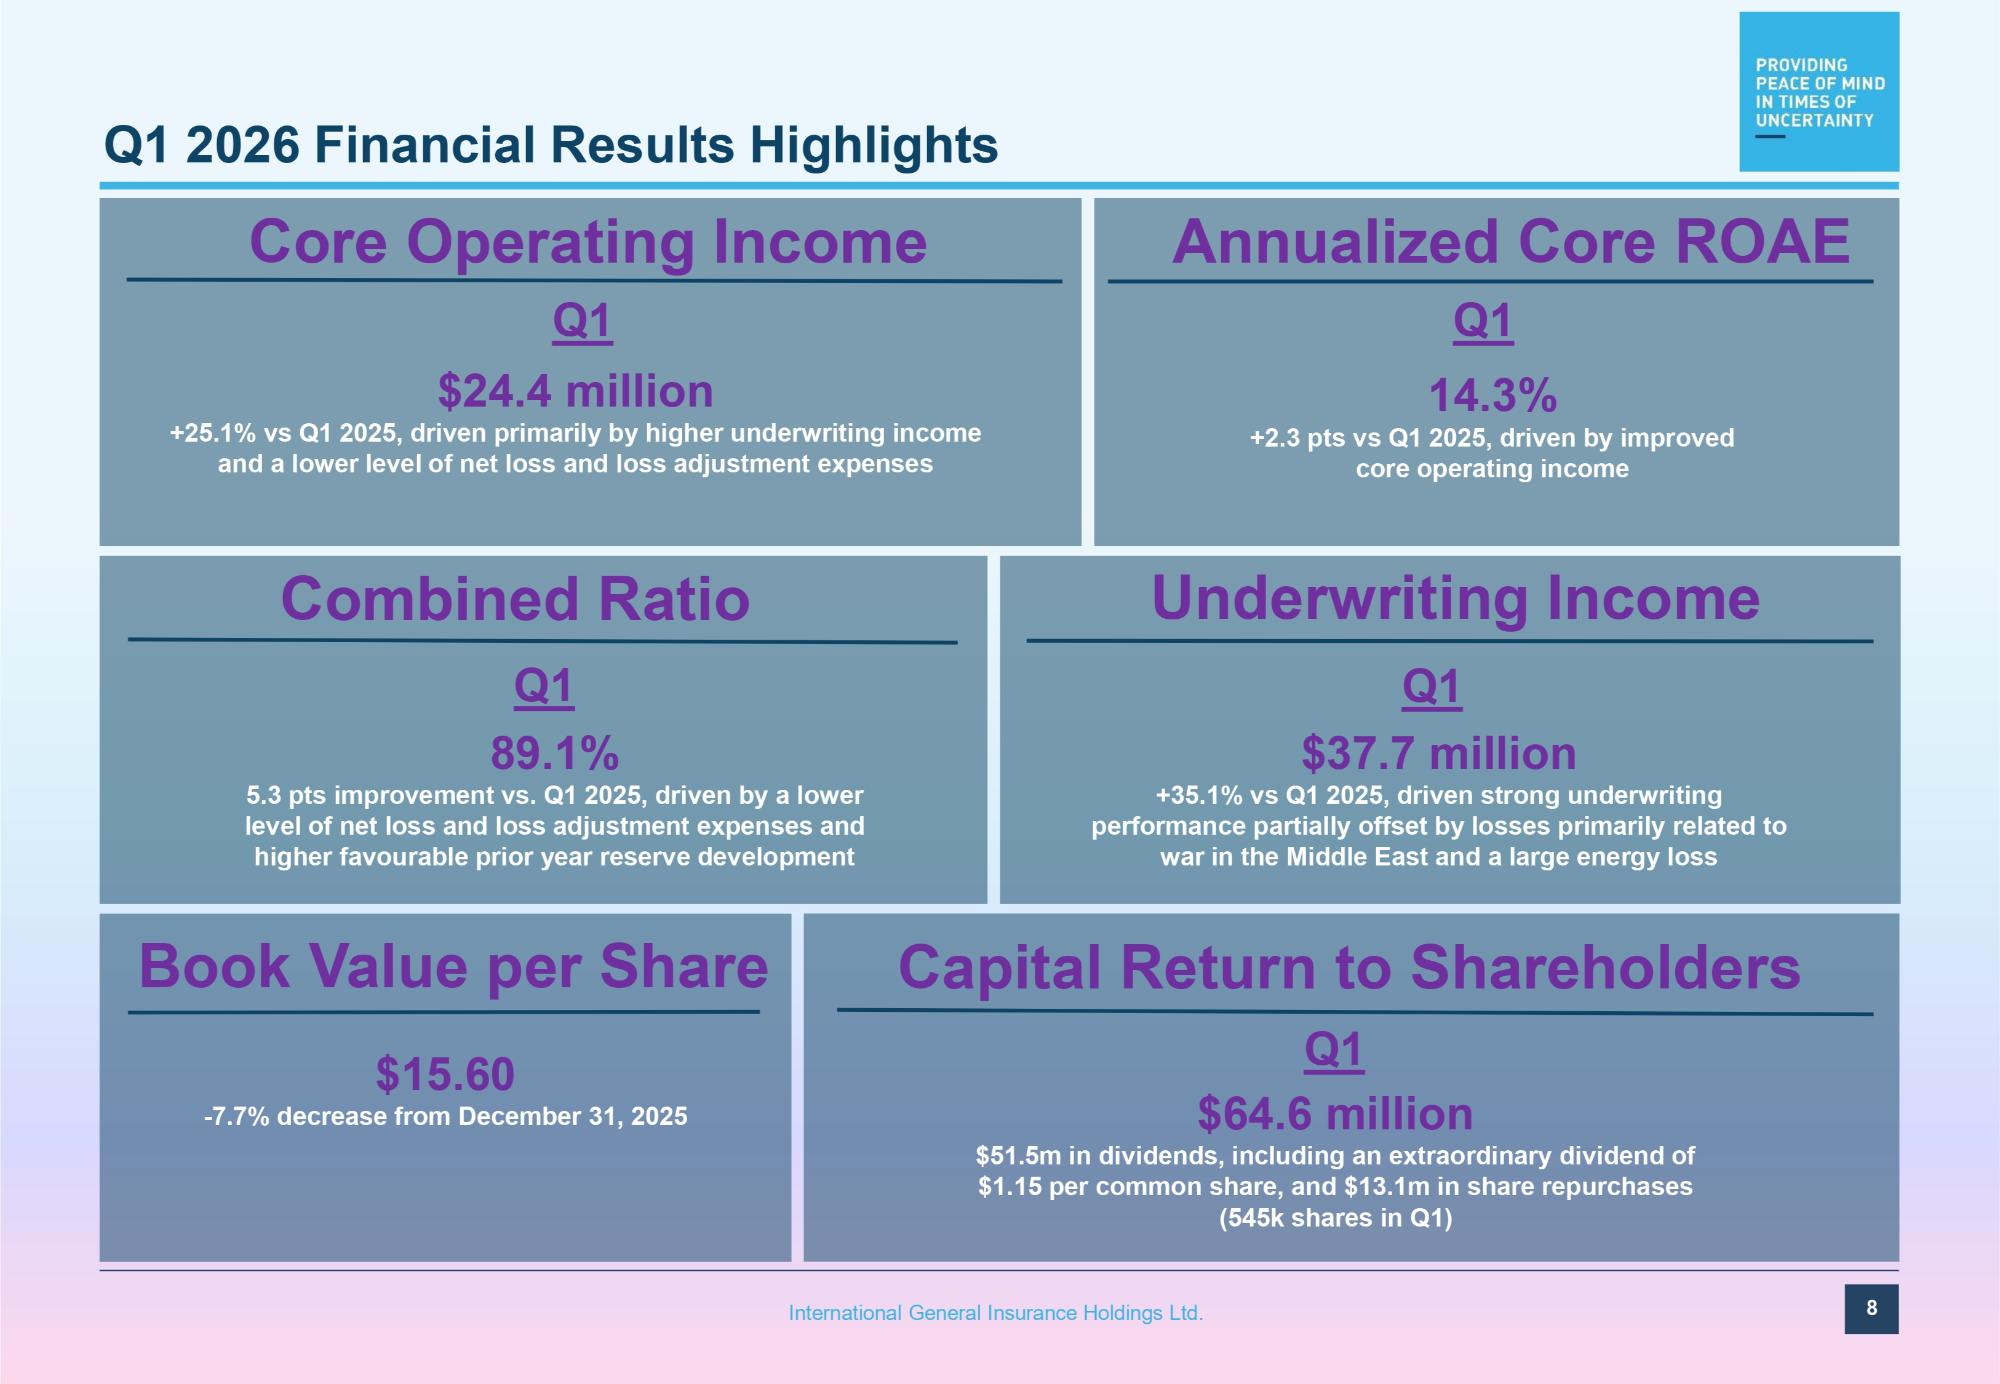
Q1 2026 Financial Results Highlights $15.60 - 7.7% decrease from December 31, 2025 Core Operating Income Combined Ratio Q1 89.1% 5 . 3 pts improvement vs . Q 1 2025 , driven by a lower level of net loss and loss adjustment expenses and higher favourable prior year reserve development Book Value per Share 8 International General Insurance Holdings Ltd. Annualized Core ROAE Q1 14.3% +2.3 pts vs Q1 2025, driven by improved core operating income Q1 $24.4 million +25.1% vs Q1 2025, driven primarily by higher underwriting income and a lower level of net loss and loss adjustment expenses Underwriting Income Q1 $37.7 million +35.1% vs Q1 2025, driven strong underwriting performance partially offset by losses primarily related to war in the Middle East and a large energy loss Capital Return to Shareholders Q1 $64.6 million $51.5m in dividends, including an extraordinary dividend of $1.15 per common share, and $13.1m in share repurchases (545k shares in Q1)
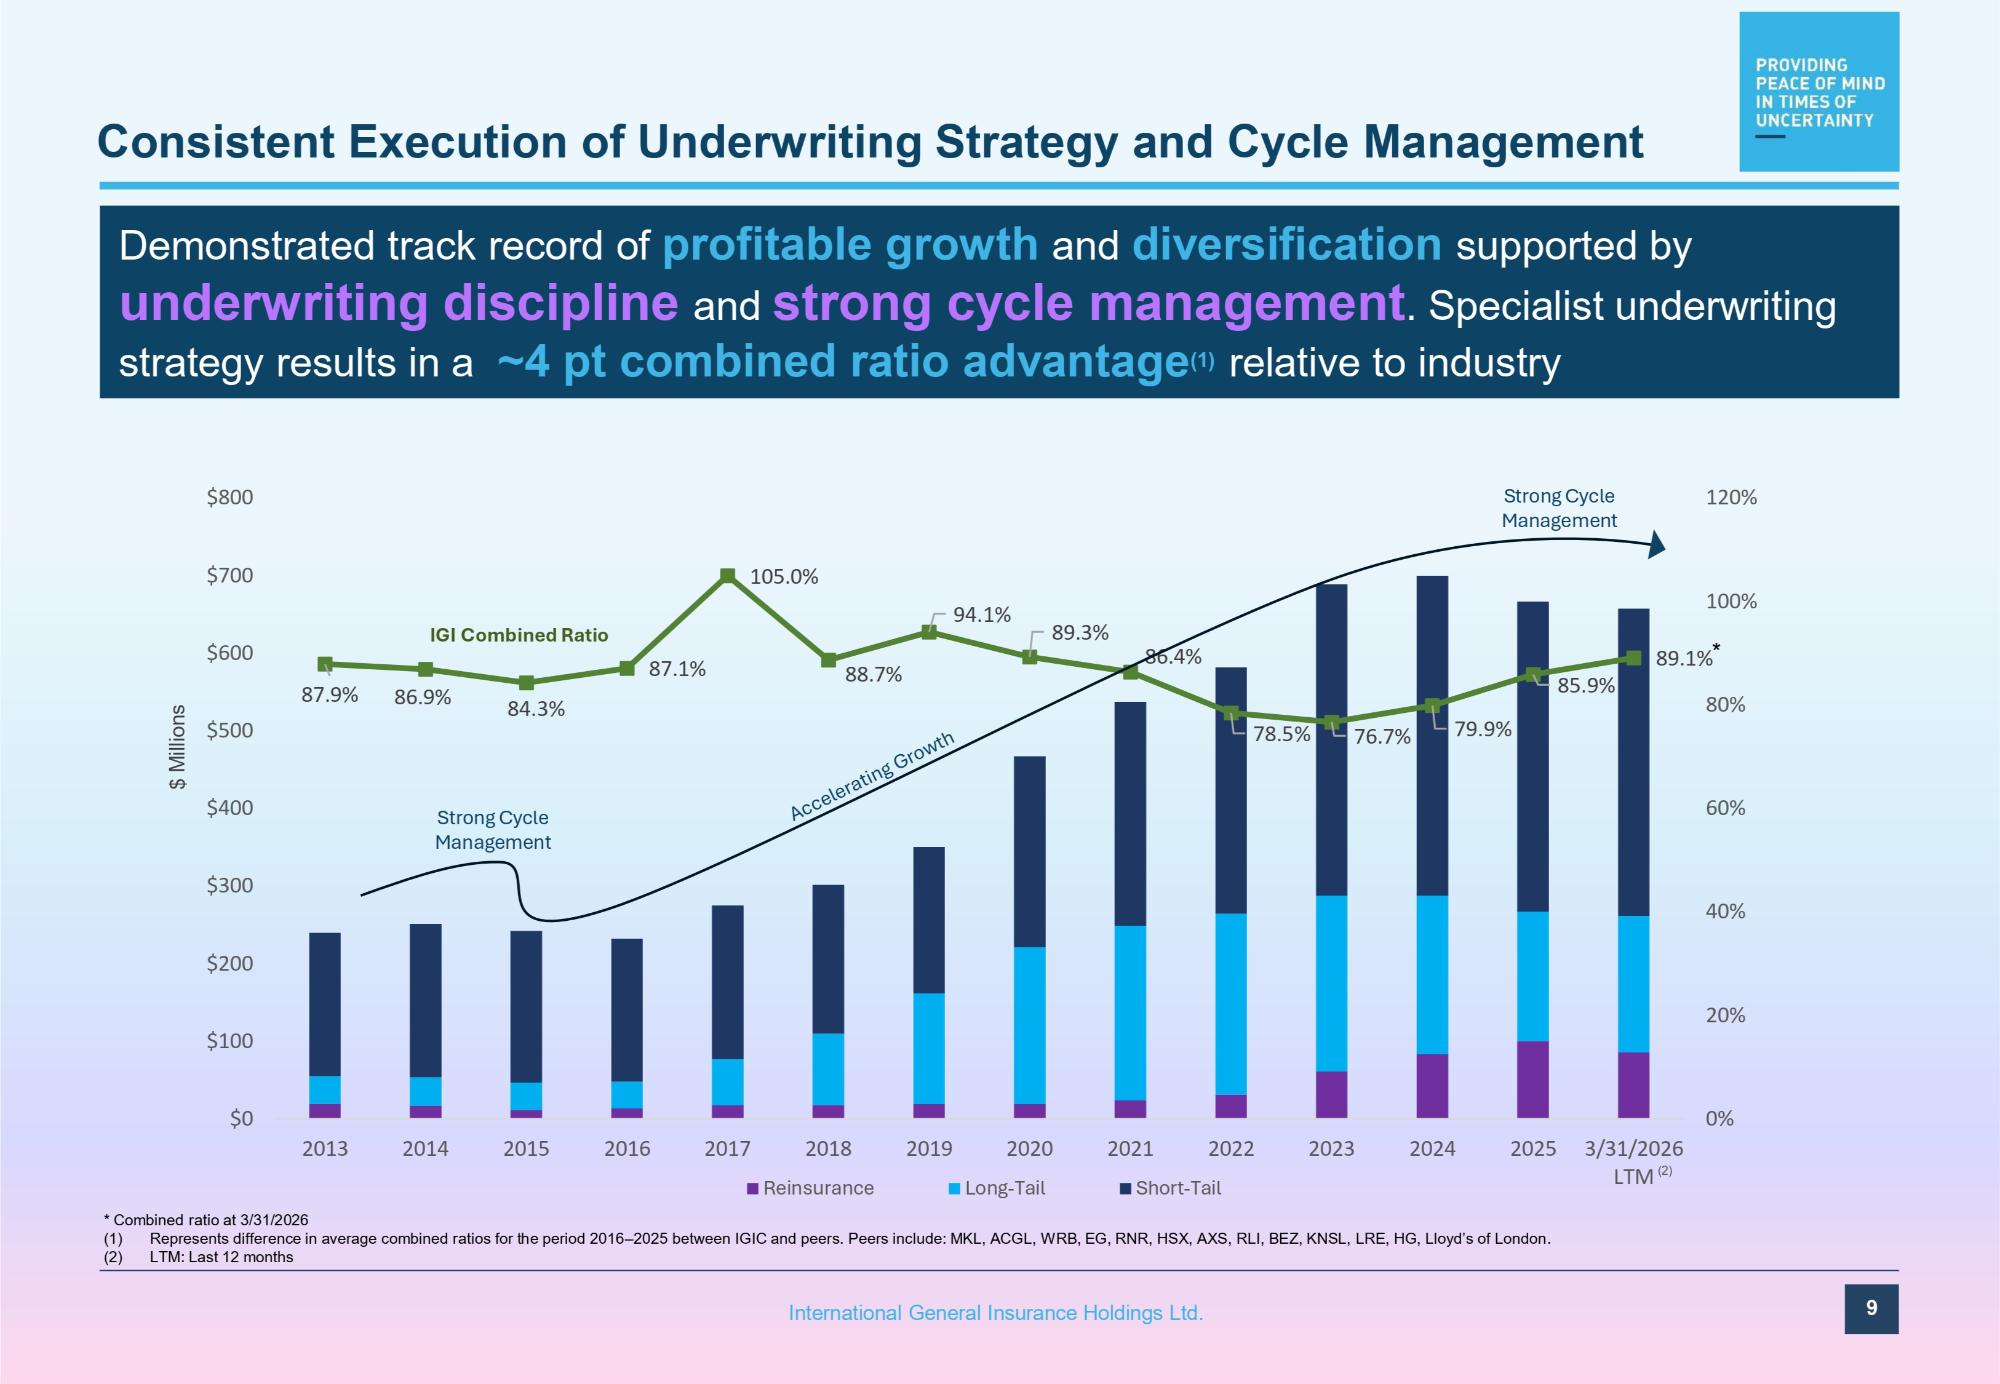
87.9% 86.9% 84.3% 87.1% 105.0% 88.7% 94.1% 89.3% 86.4% 78.5% 76.7% 79.9% 85.9% 89.1% 0% 20% 40% 60% 80% 100% 120% $0 $100 $200 $300 $400 $500 $600 $700 $800 2013 2014 2015 2016 2017 2019 2023 2024 2018 Reinsurance 2020 Long - Tail 2021 2022 Short - Tail * Combined ratio at 3/31/2026 (1) Represents difference in average combined ratios for the period 2016 – 2025 between IGIC and peers. Peers include: MKL, ACGL, WRB, EG, RNR, HSX, AXS, RLI, BEZ, KNSL, LRE, HG, Lloyd’s of London. (2) LTM: Last 12 months Strong Cycle Management $ Millions 9 International General Insurance Holdings Ltd. Consistent Execution of Underwriting Strategy and Cycle Management Demonstrated track record of profitable growth and diversification supported by underwriting discipline and strong cycle management . Specialist underwriting strategy results in a ~4 pt combined ratio advantage (1) relative to industry IGI Combined Ratio Strong Cycle Management 2025 3/31/2026 LTM (2) *
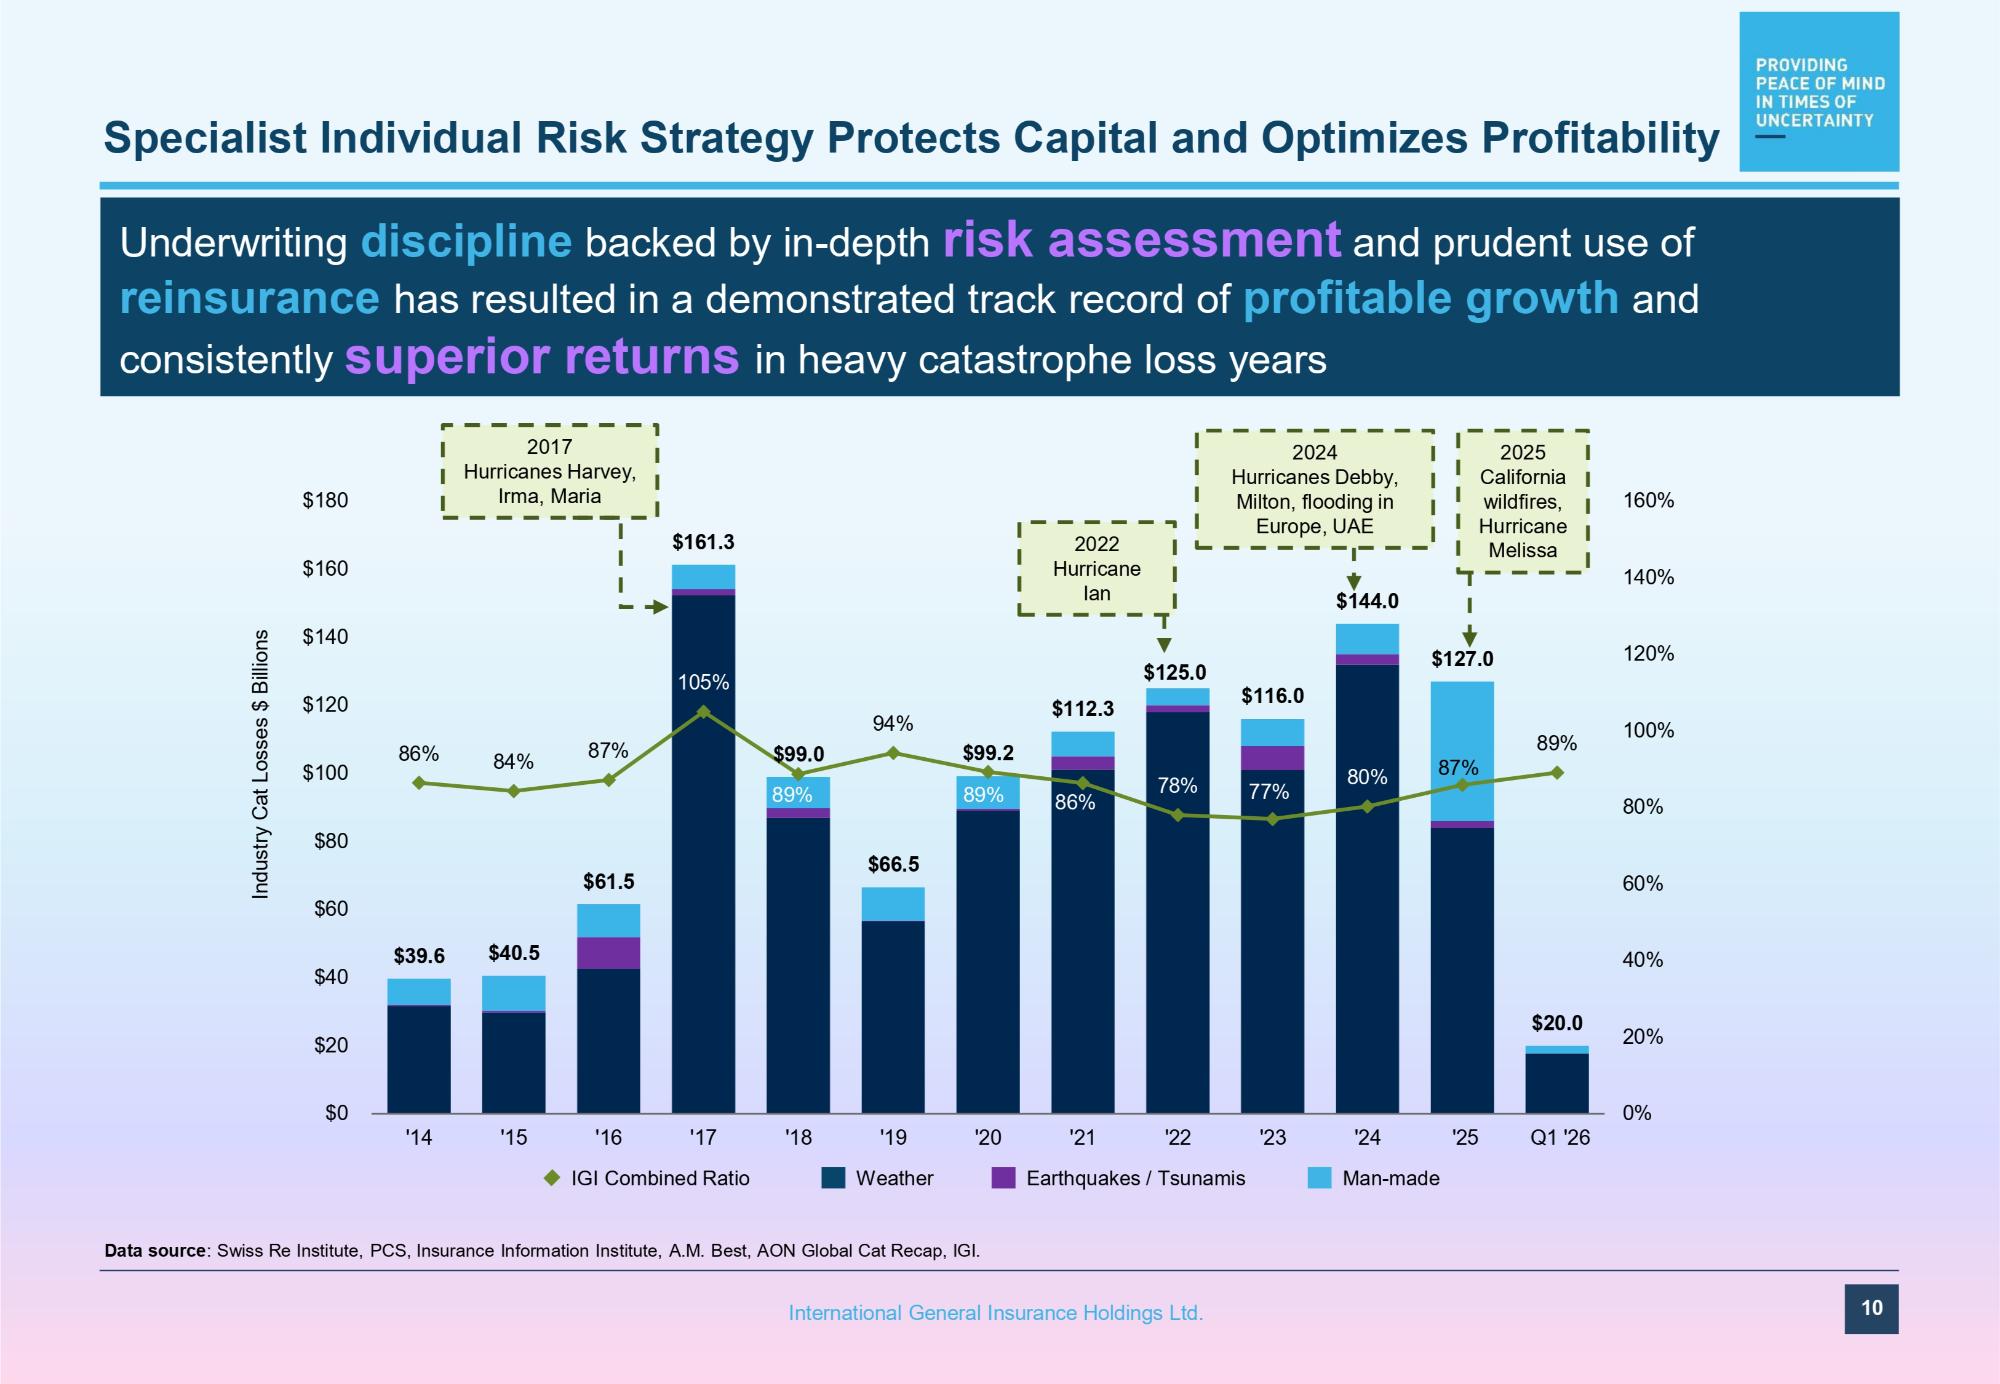
$39.6 $40.5 $61.5 $161.3 $99.0 $66.5 $99.2 $112.3 $125.0 $116.0 $144.0 $127.0 $20.0 86% 84% 87% 105% 89% 94% 89% 86% 78% 77% 80% 87% 89% 0% 20% 40% 60% 80% 100% 120% 140% 160% $0 $20 $40 $60 $80 $100 $120 $140 $160 $180 '14 '15 '18 '20 '23 '25 Q1 '26 Specialist Individual Risk Strategy Protects Capital and Optimizes Profitability Data source : Swiss Re Institute, PCS, Insurance Information Institute, A.M. Best, AON Global Cat Recap, IGI. 2017 Hurricanes Harvey, Irma, Maria '19 Weather '21 '22 Earthquakes / Tsunamis '24 Man - made '16 '17 IGI Combined Ratio Industry Cat Losses $ Billions 2022 Hurricane Ian 2024 Hurricanes Debby, Milton, flooding in Europe, UAE 2025 California wildfires, Hurricane Melissa Underwriting discipline backed by in - depth risk assessment and prudent use of reinsurance has resulted in a demonstrated track record of profitable growth and consistently superior returns in heavy catastrophe loss years 10 International General Insurance Holdings Ltd.
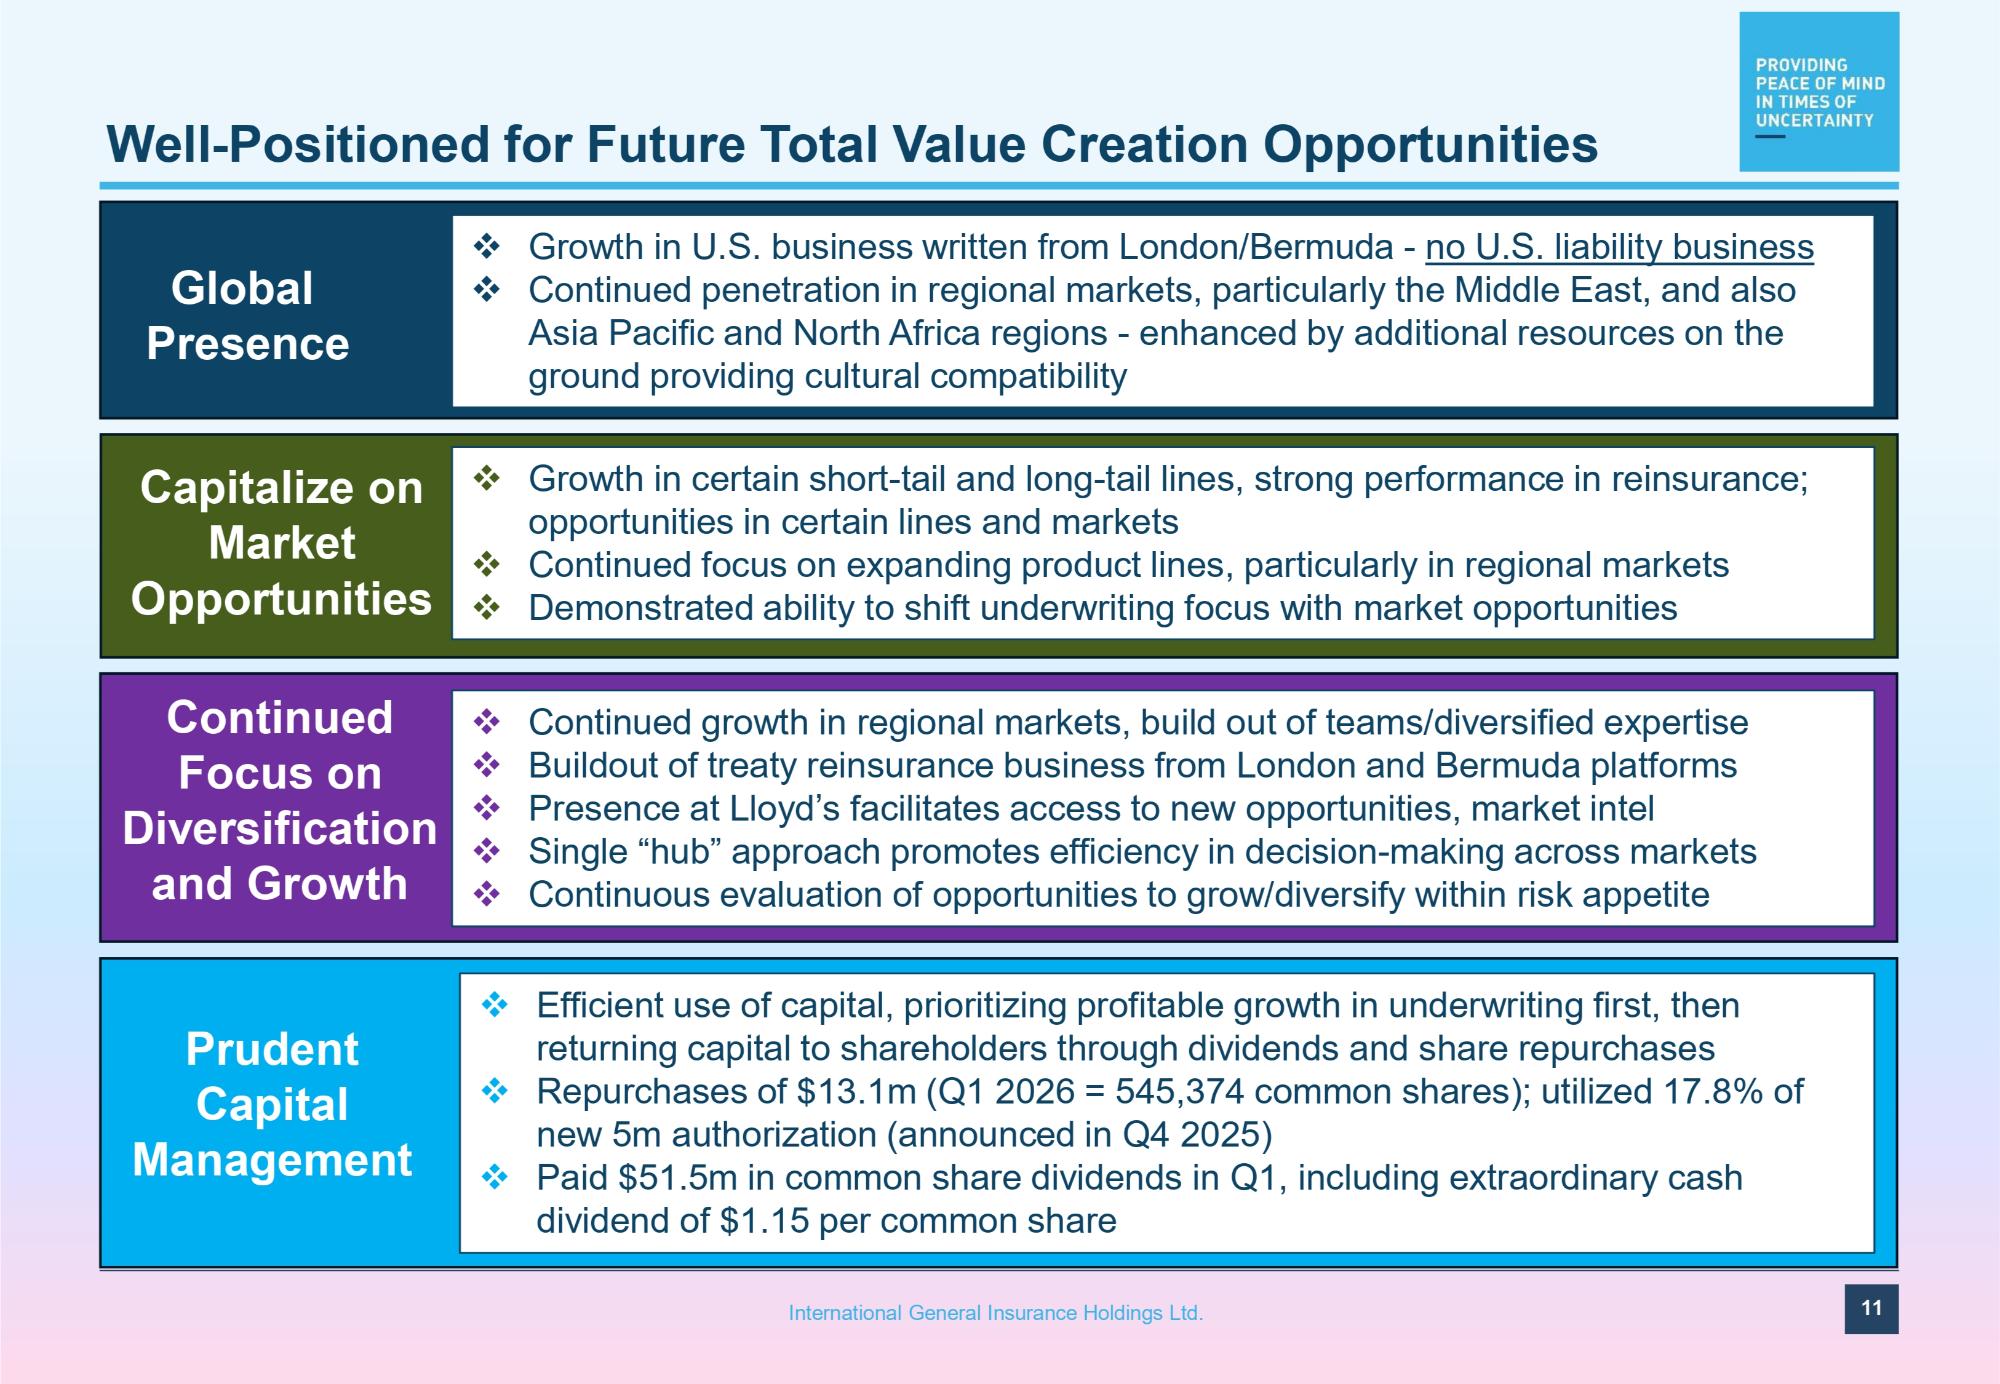
Well - Positioned for Future Total Value Creation Opportunities Global Presence □ Growth in U.S. business written from London/Bermuda - no U.S. liability business □ Continued penetration in regional markets, particularly the Middle East, and also Asia Pacific and North Africa regions - enhanced by additional resources on the ground providing cultural compatibility 11 International General Insurance Holdings Ltd. Capitalize on Market Opportunities Continued Focus on Diversification and Growth Prudent Capital Management □ Efficient use of capital, prioritizing profitable growth in underwriting first, then returning capital to shareholders through dividends and share repurchases □ Repurchases of $13.1m (Q1 2026 = 545,374 common shares); utilized 17.8% of new 5m authorization (announced in Q4 2025) □ Paid $51.5m in common share dividends in Q1, including extraordinary cash dividend of $1.15 per common share □ Continued growth in regional markets, build out of teams/diversified expertise □ Buildout of treaty reinsurance business from London and Bermuda platforms □ Presence at Lloyd’s facilitates access to new opportunities, market intel □ Single “hub” approach promotes efficiency in decision - making across markets □ Continuous evaluation of opportunities to grow/diversify within risk appetite □ Growth in certain short - tail and long - tail lines, strong performance in reinsurance; opportunities in certain lines and markets □ Continued focus on expanding product lines, particularly in regional markets □ Demonstrated ability to shift underwriting focus with market opportunities
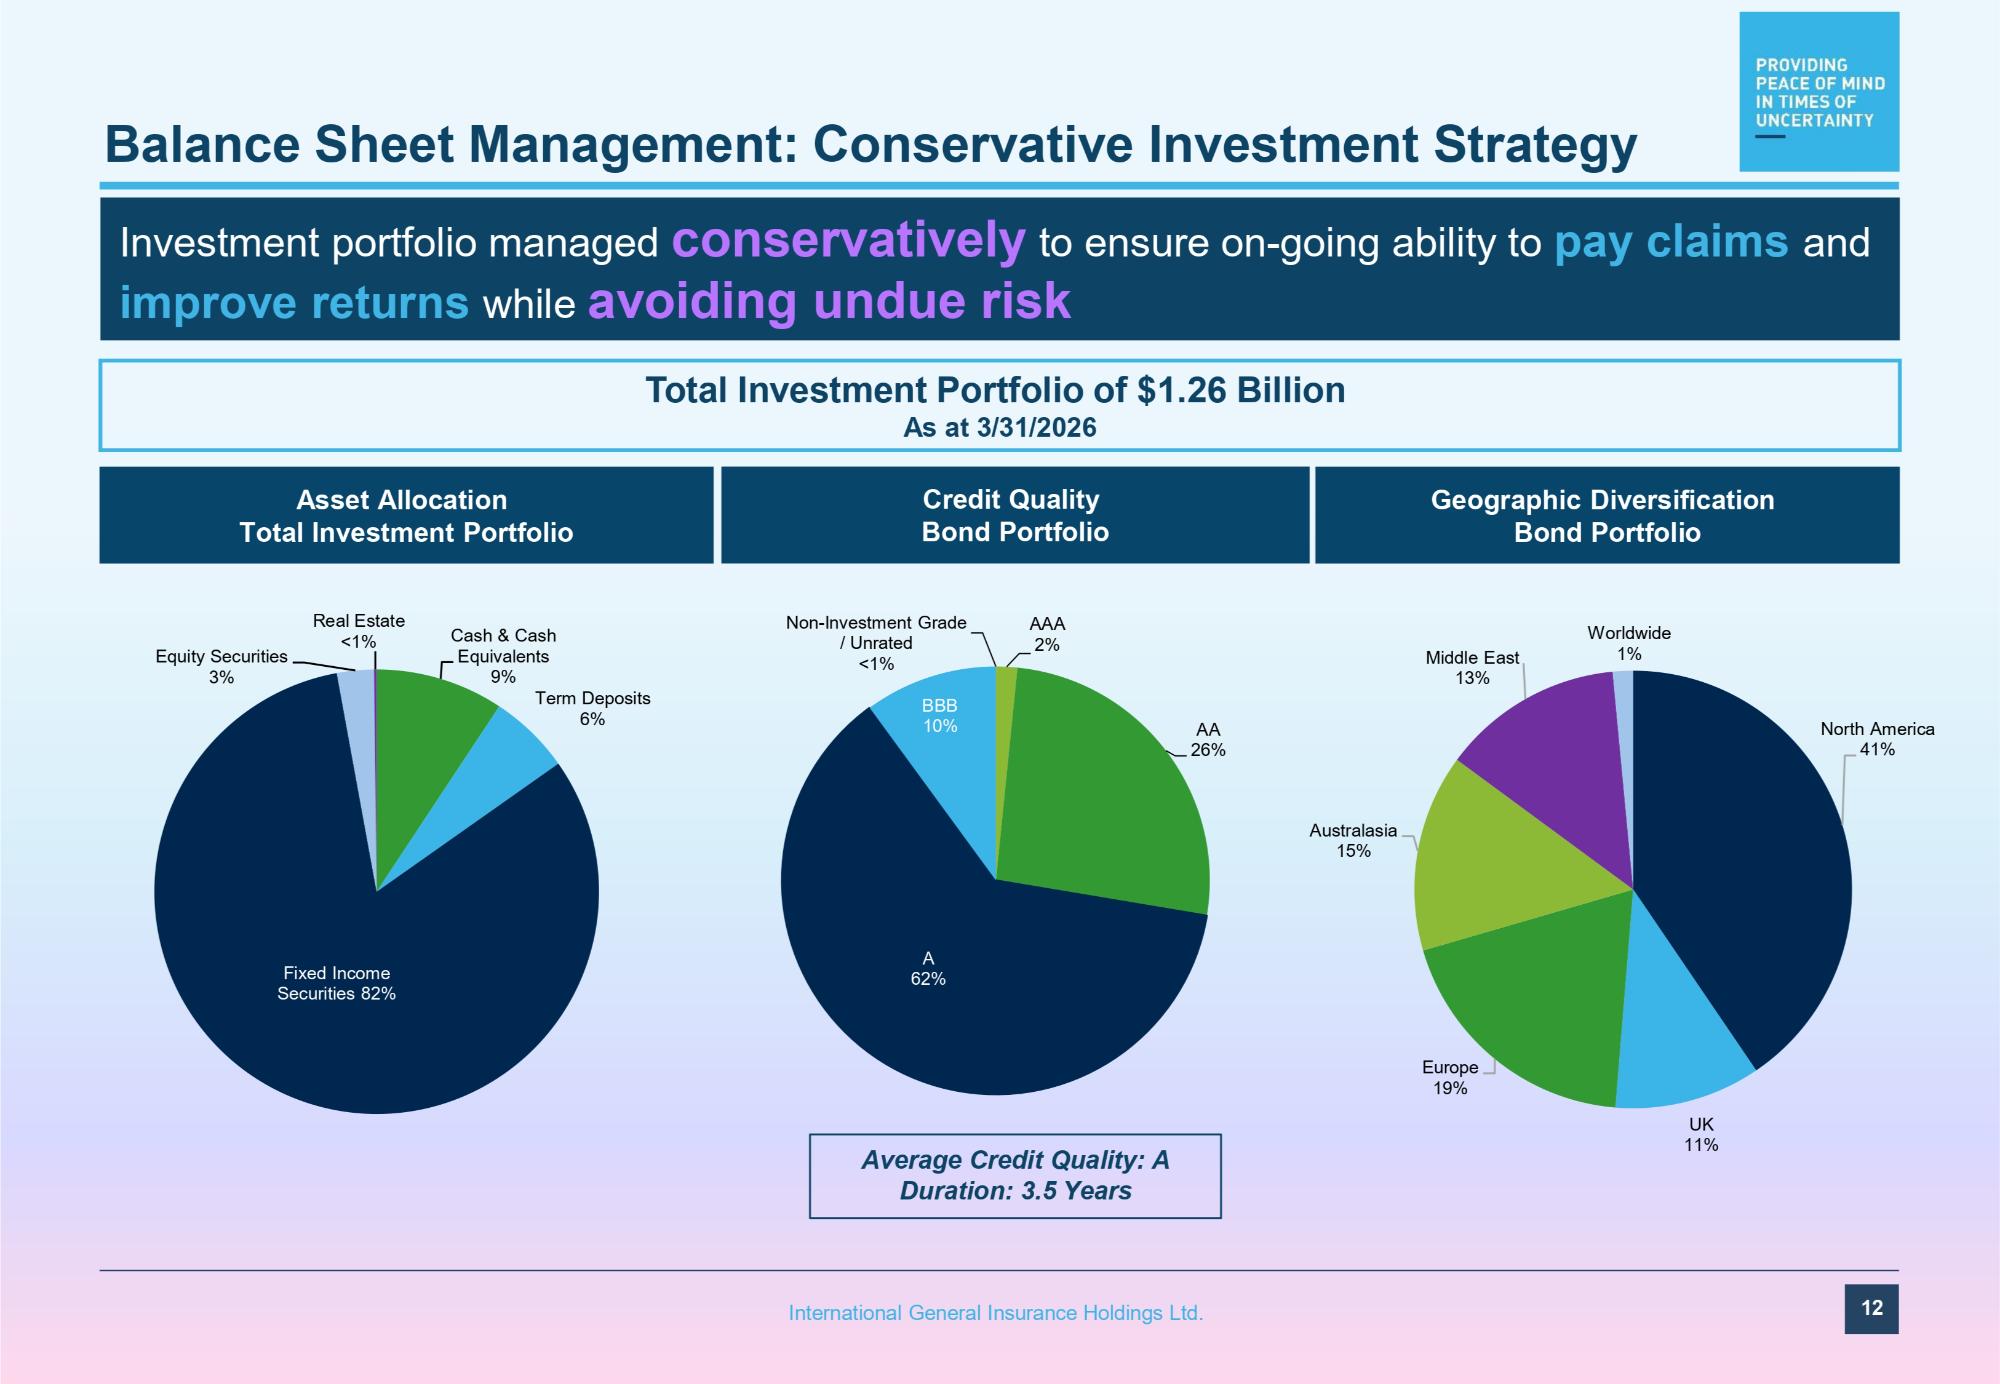
Balance Sheet Management: Conservative Investment Strategy Investment portfolio managed conservatively to ensure on - going ability to pay claims and improve returns while avoiding undue risk Average Credit Quality: A Duration: 3.5 Years Asset Allocation Total Investment Portfolio Credit Quality Bond Portfolio Total Investment Portfolio of $1.26 Billion As at 3/31/2026 Geographic Diversification Bond Portfolio Cash & Cash Equivalents 9% Term Deposits 6% Fixed Income Securities 82% Equity Securities 3% Real Estate <1% AAA 2% AA 26% A 62% BBB 10% Non - Investment Grade / Unrated <1% North America 41% 12 International General Insurance Holdings Ltd. UK 11% Europe 19% Australasia 15% Middle East 13% Worldwide 1%
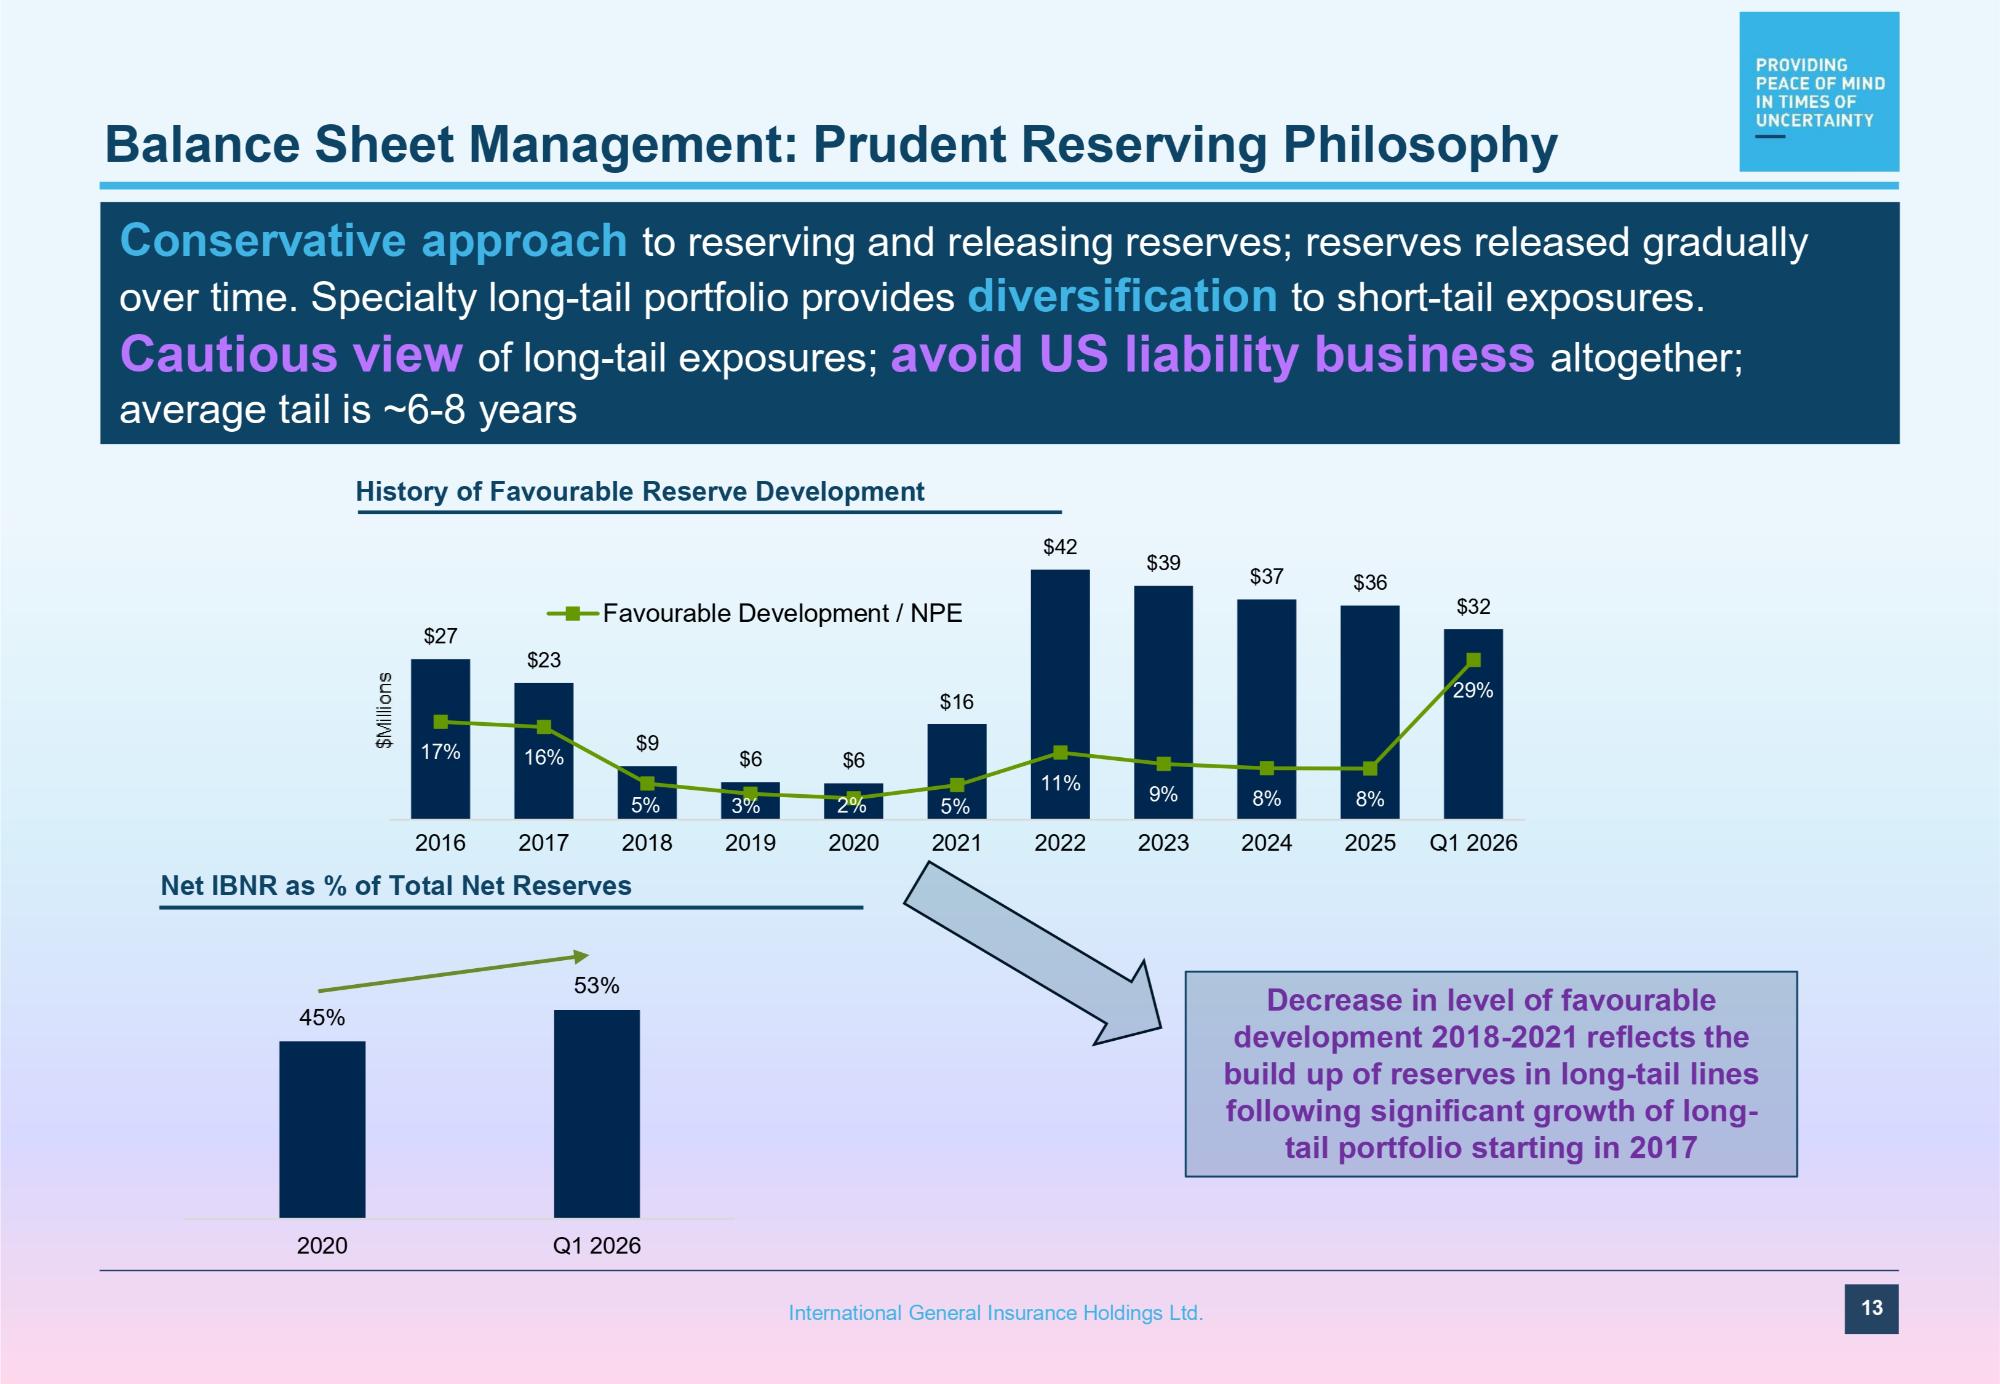
45% 53% 2020 Q1 2026 Balance Sheet Management: Prudent Reserving Philosophy History of Favourable Reserve Development Conservative approach to reserving and releasing reserves; reserves released gradually over time. Specialty long - tail portfolio provides diversification to short - tail exposures. Cautious view of long - tail exposures; avoid US liability business altogether; average tail is ~6 - 8 years Decrease in level of favourable development 2018 - 2021 reflects the build up of reserves in long - tail lines following significant growth of long - tail portfolio starting in 2017 $27 $23 $9 $6 $6 $16 $42 $39 $37 $36 $32 17% 16% 5% 3% 2% 5% 11% 9% 8% 8% 29% 2016 2017 2018 Net IBNR as % of Total Net Reserves 2019 2020 2021 2022 2023 2024 2025 Q1 2026 Favourable Development / NPE 13 International General Insurance Holdings Ltd.
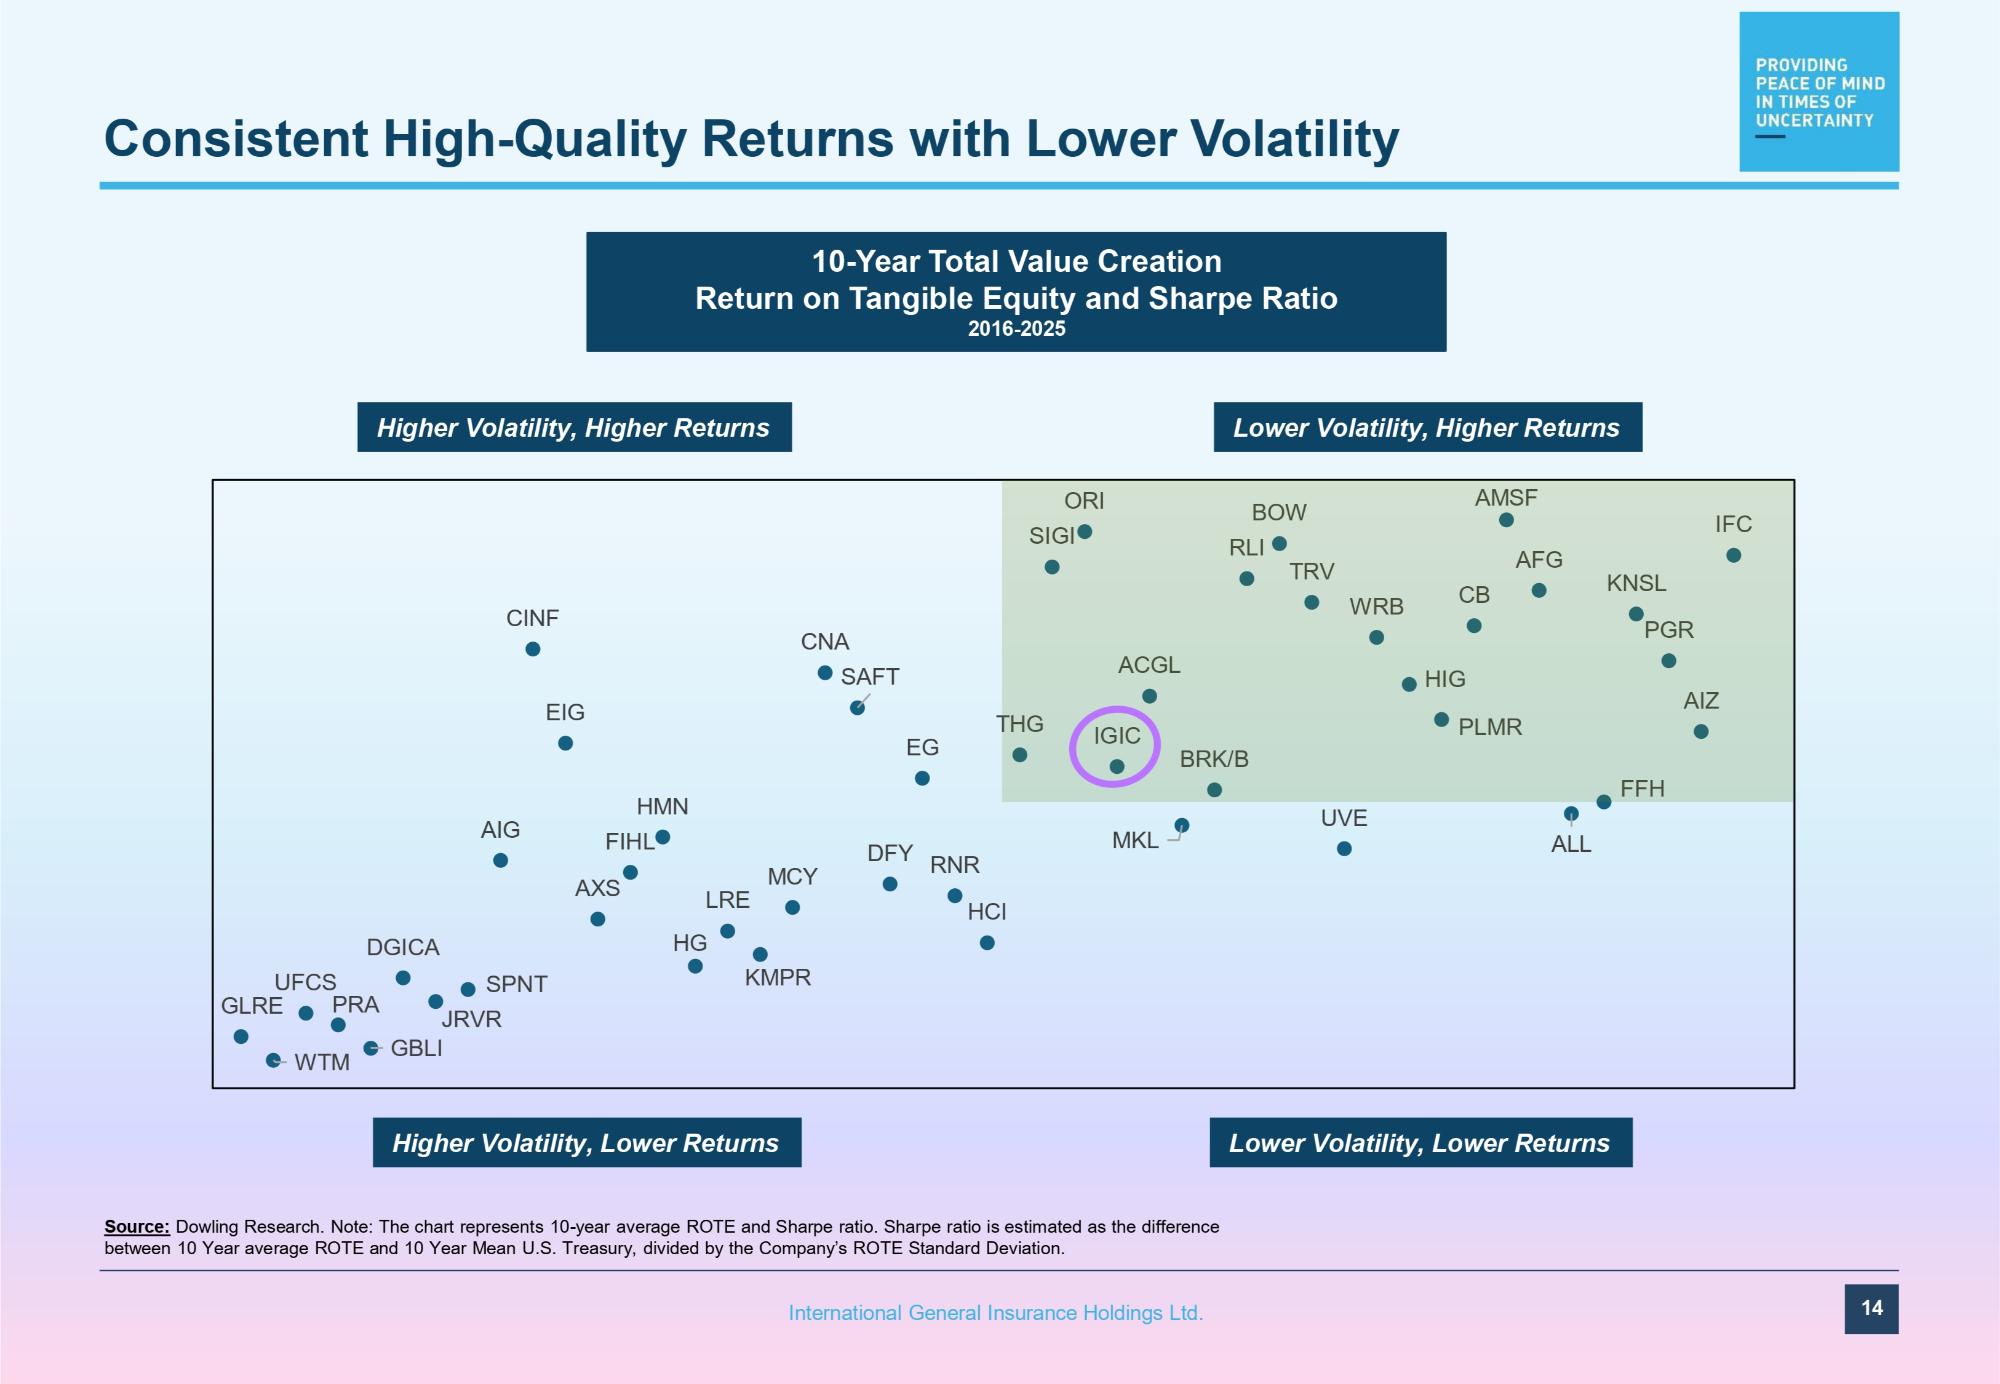
IFC KNSL PGR AIZ FFH AMSF AFG CB HIG PLMR RI BOW RLI TRV WRB ACGL IGIC BRK/B O SIGI THG CINF CNA SAFT EIG EG ALL UVE MKL DFY HMN FIHL AIG HCI AXS LRE HG KMPR DGICA UFCS SPNT GLRE PRA JRVR WTM GBLI Consistent High - Quality Returns with Lower Volatility 10 - Year Total Value Creation Return on Tangible Equity and Sharpe Ratio 2016 - 2025 14 International General Insurance Holdings Ltd. Lower Volatility, Higher Returns Higher Volatility, Higher Returns Higher Volatility, Lower Returns Lower Volatility, Lower Returns Source: Dowling Research. Note: The chart represents 10 - year average ROTE and Sharpe ratio. Sharpe ratio is estimated as the difference between 10 Year average ROTE and 10 Year Mean U.S. Treasury, divided by the Company’s ROTE Standard Deviation.
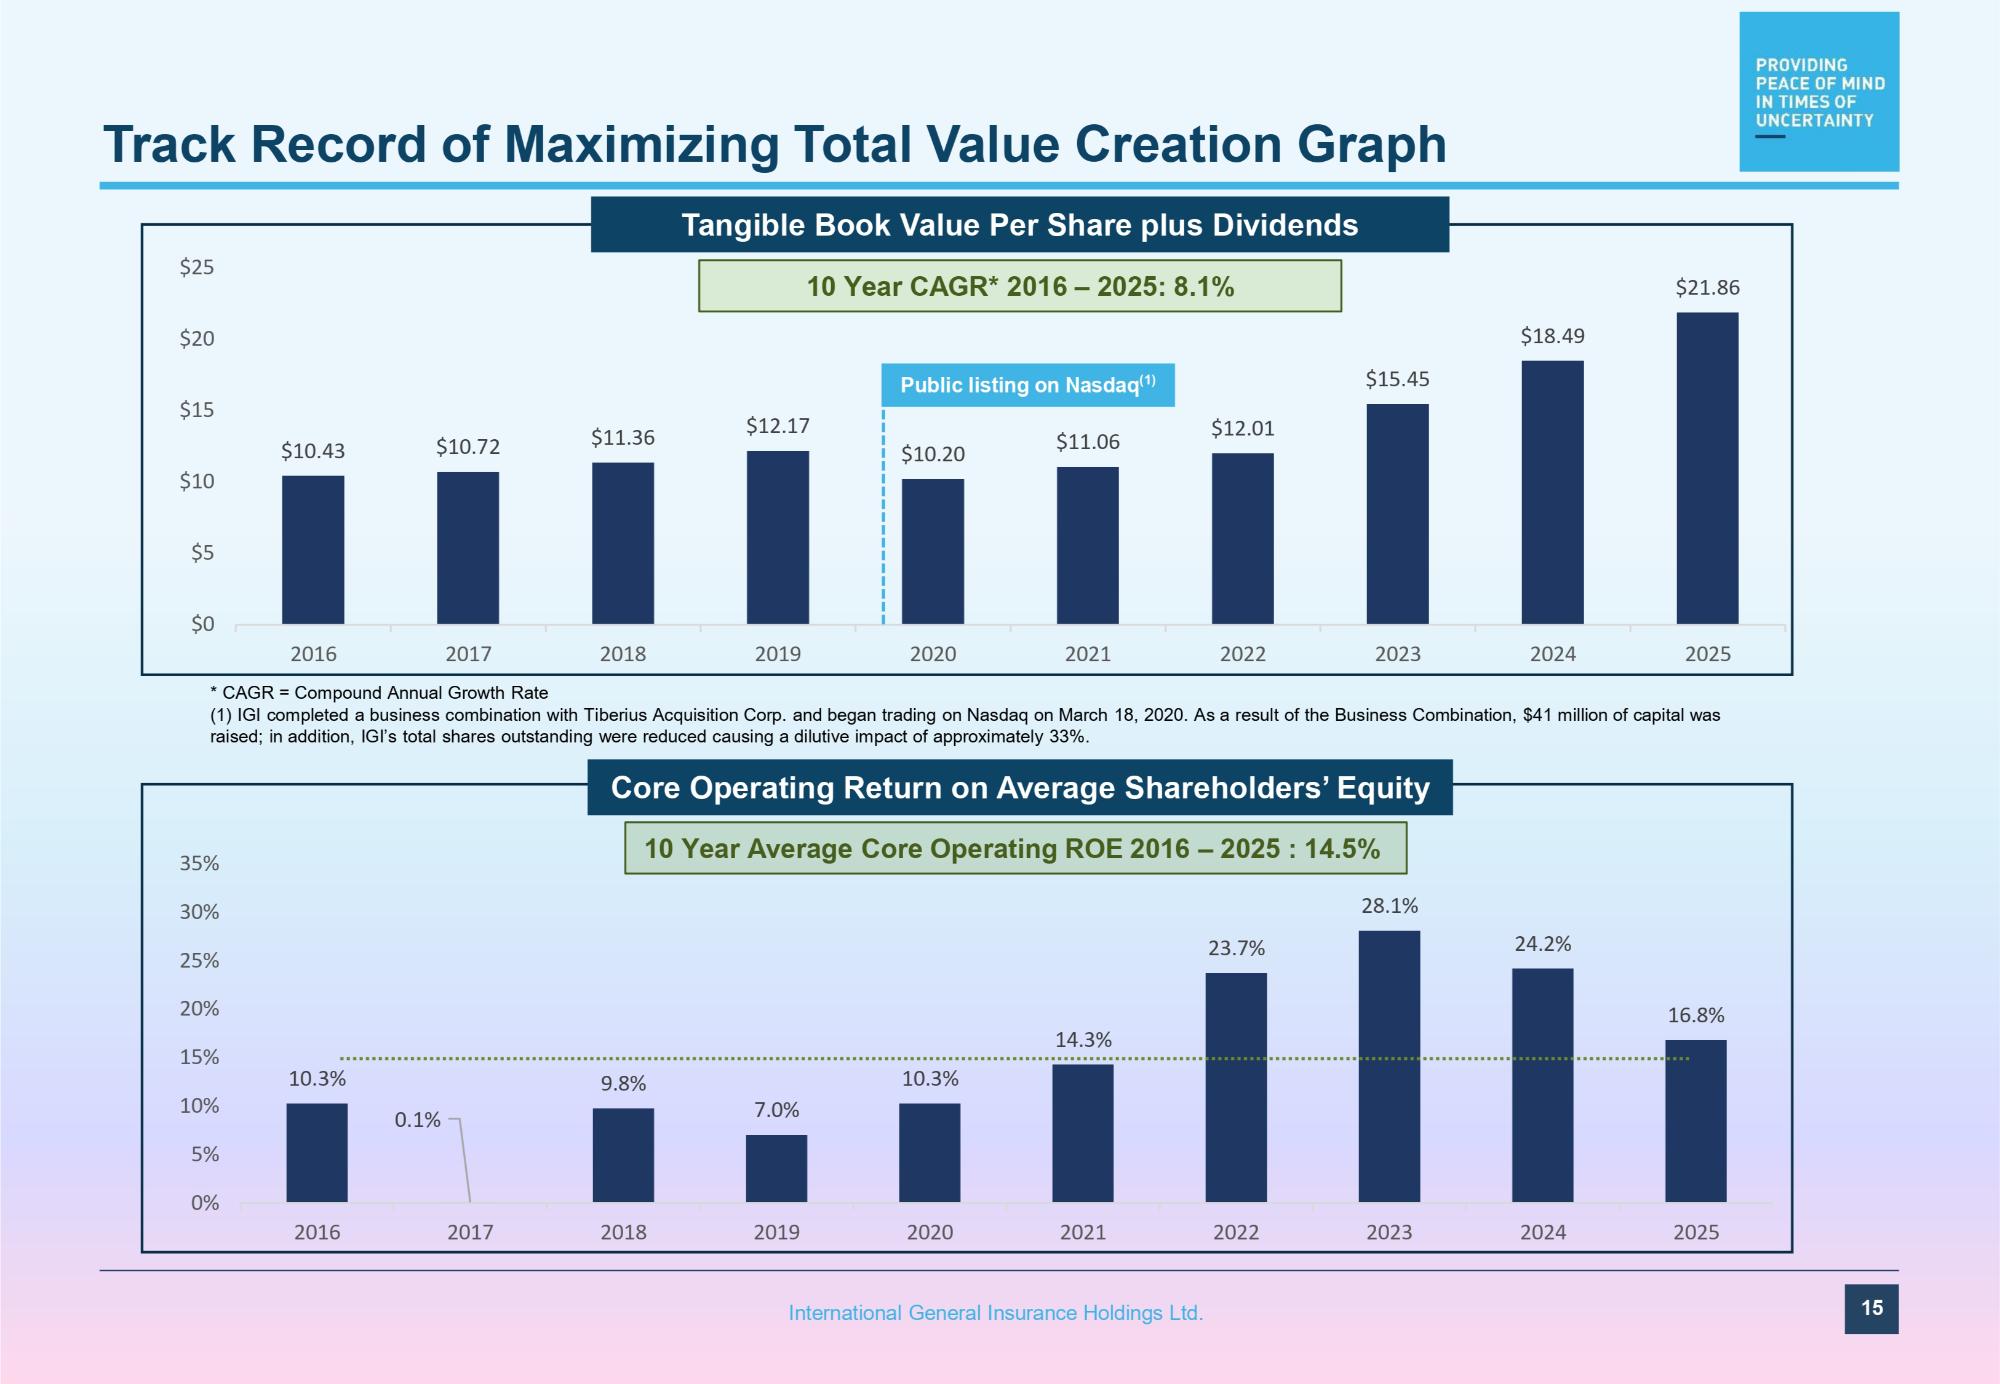
$10.43 $10.72 $11.36 $12.17 $10.20 $11.06 $12.01 $15.45 $18.49 $21.86 $15 $20 $25 10.3% 0.1% 9.8% 7.0% 10.3% 14.3% 23.7% 28.1% 24.2% 16.8% 5% 0% 10% 15% 20% 25% 30% 35% 2016 2017 2018 2019 2020 2021 2022 2023 2024 2025 Track Record of Maximizing Total Value Creation Graph 10 Year Average Core Operating ROE 2016 – 2025 : 14.5% 10 Year CAGR* 2016 – 2025: 8.1% Core Operating Return on Average Shareholders’ Equity Public listing on Nasdaq (1) $10 $5 $0 2016 2017 2018 2019 2020 2021 2022 2023 2024 2025 * CAGR = Compound Annual Growth Rate (1) IGI completed a business combination with Tiberius Acquisition Corp. and began trading on Nasdaq on March 18, 2020. As a result of the Business Combination, $41 million of capital was raised; in addition, IGI’s total shares outstanding were reduced causing a dilutive impact of approximately 33%. Tangible Book Value Per Share plus Dividends 15 International General Insurance Holdings Ltd.
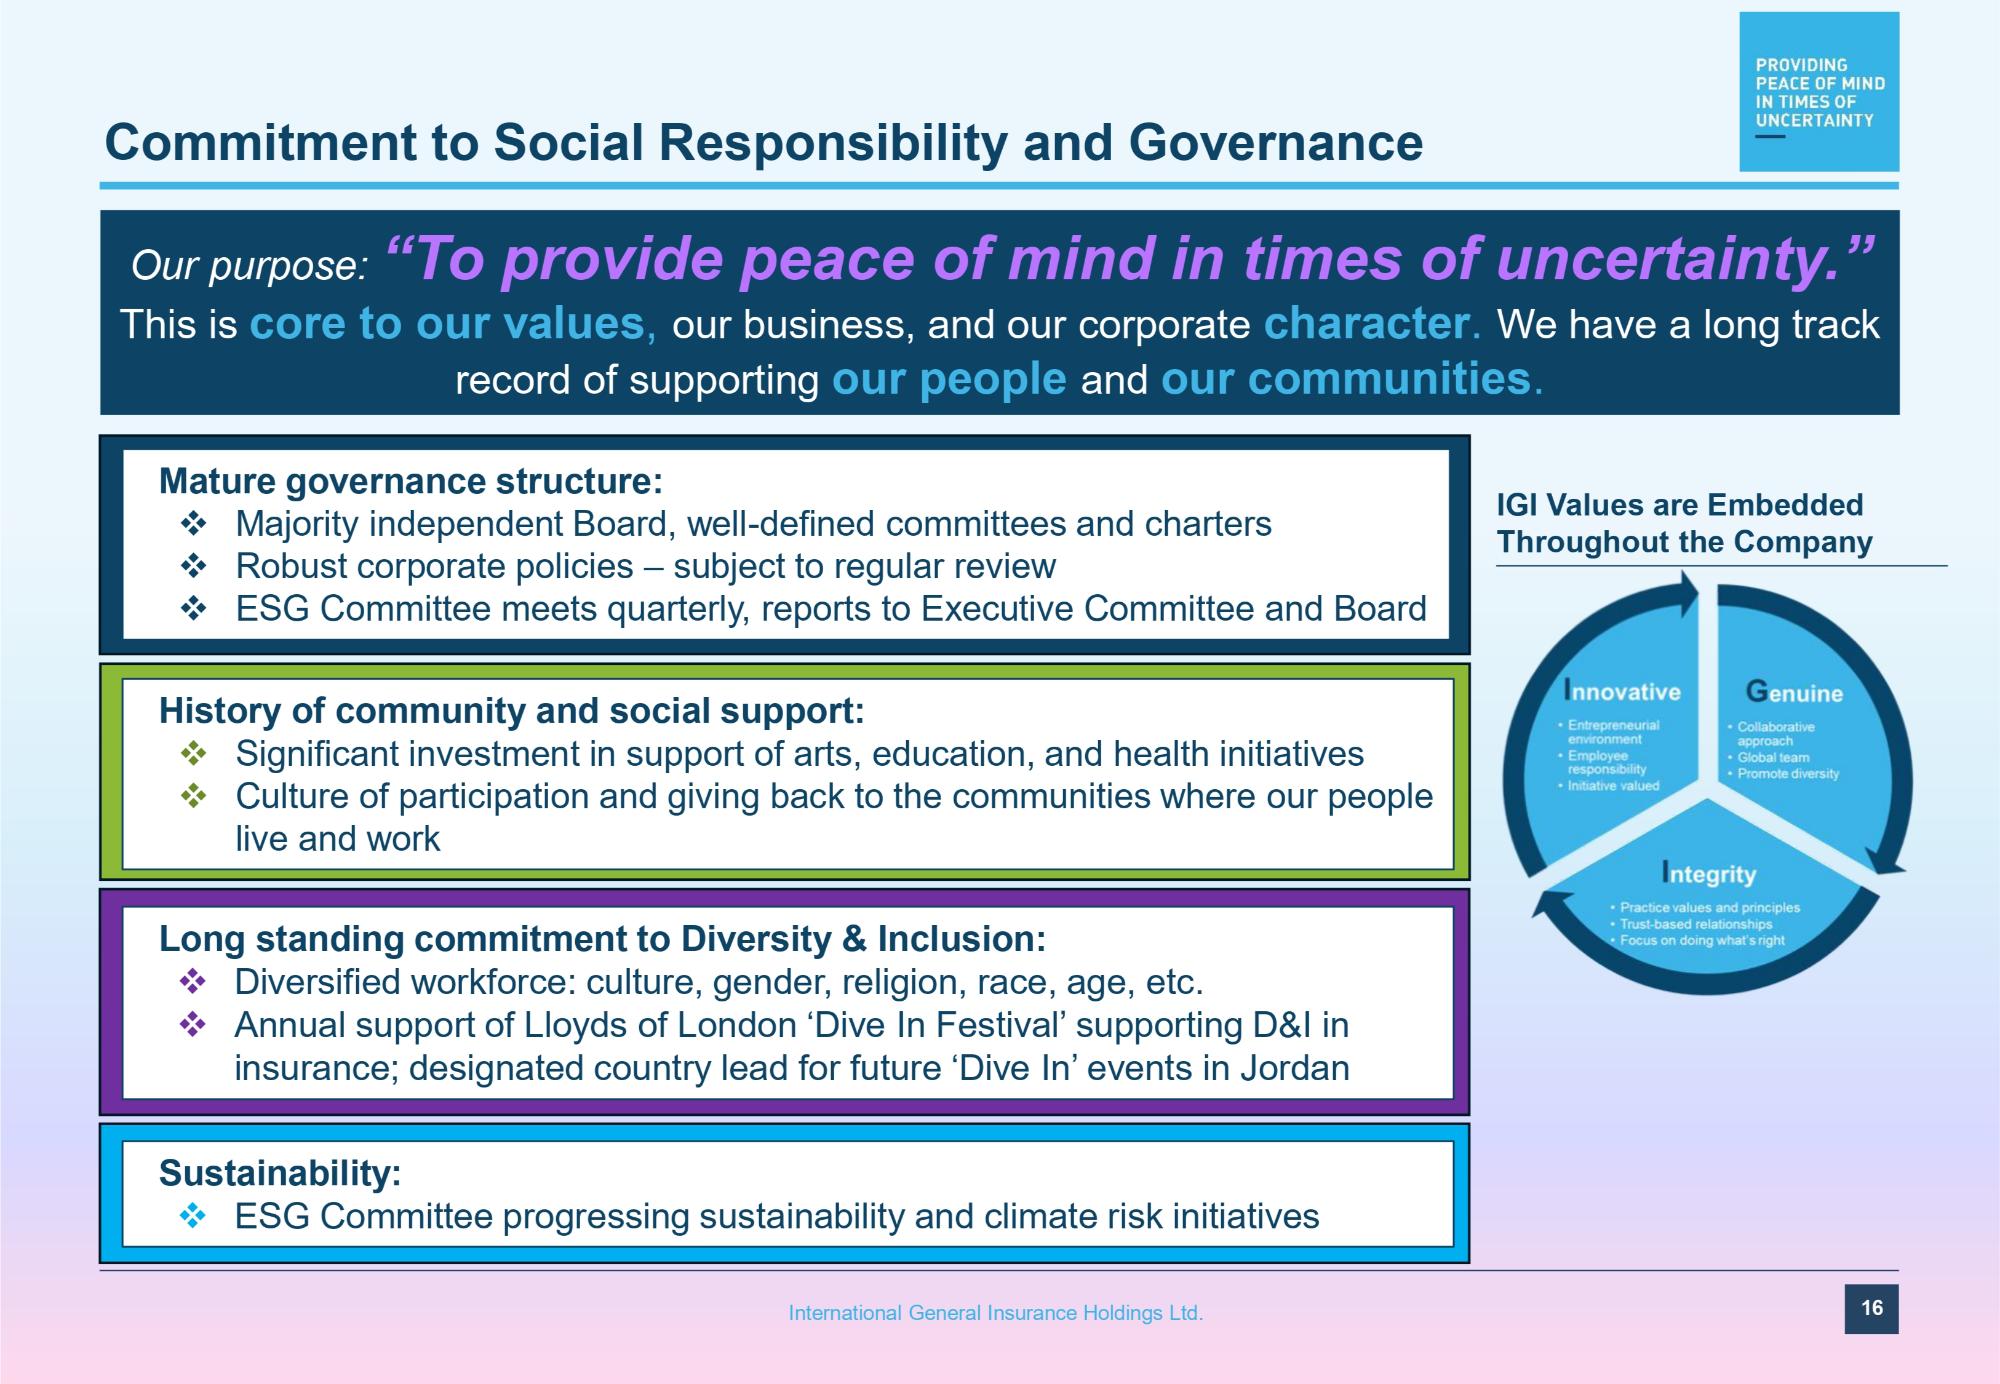
Commitment to Social Responsibility and Governance IGI Values are Embedded Throughout the Company Our purpose: “To provide peace of mind in times of uncertainty.” This is core to our values , our business, and our corporate character . We have a long track record of supporting our people and our communities . Mature governance structure: □ Majority independent Board, well - defined committees and charters □ Robust corporate policies – subject to regular review □ ESG Committee meets quarterly, reports to Executive Committee and Board History of community and social support: □ Significant investment in support of arts, education, and health initiatives □ Culture of participation and giving back to the communities where our people live and work Long standing commitment to Diversity & Inclusion: □ Diversified workforce: culture, gender, religion, race, age, etc. □ Annual support of Lloyds of London ‘Dive In Festival’ supporting D&I in insurance; designated country lead for future ‘Dive In’ events in Jordan Sustainability: □ ESG Committee progressing sustainability and climate risk initiatives 16 International General Insurance Holdings Ltd.
APPENDIX
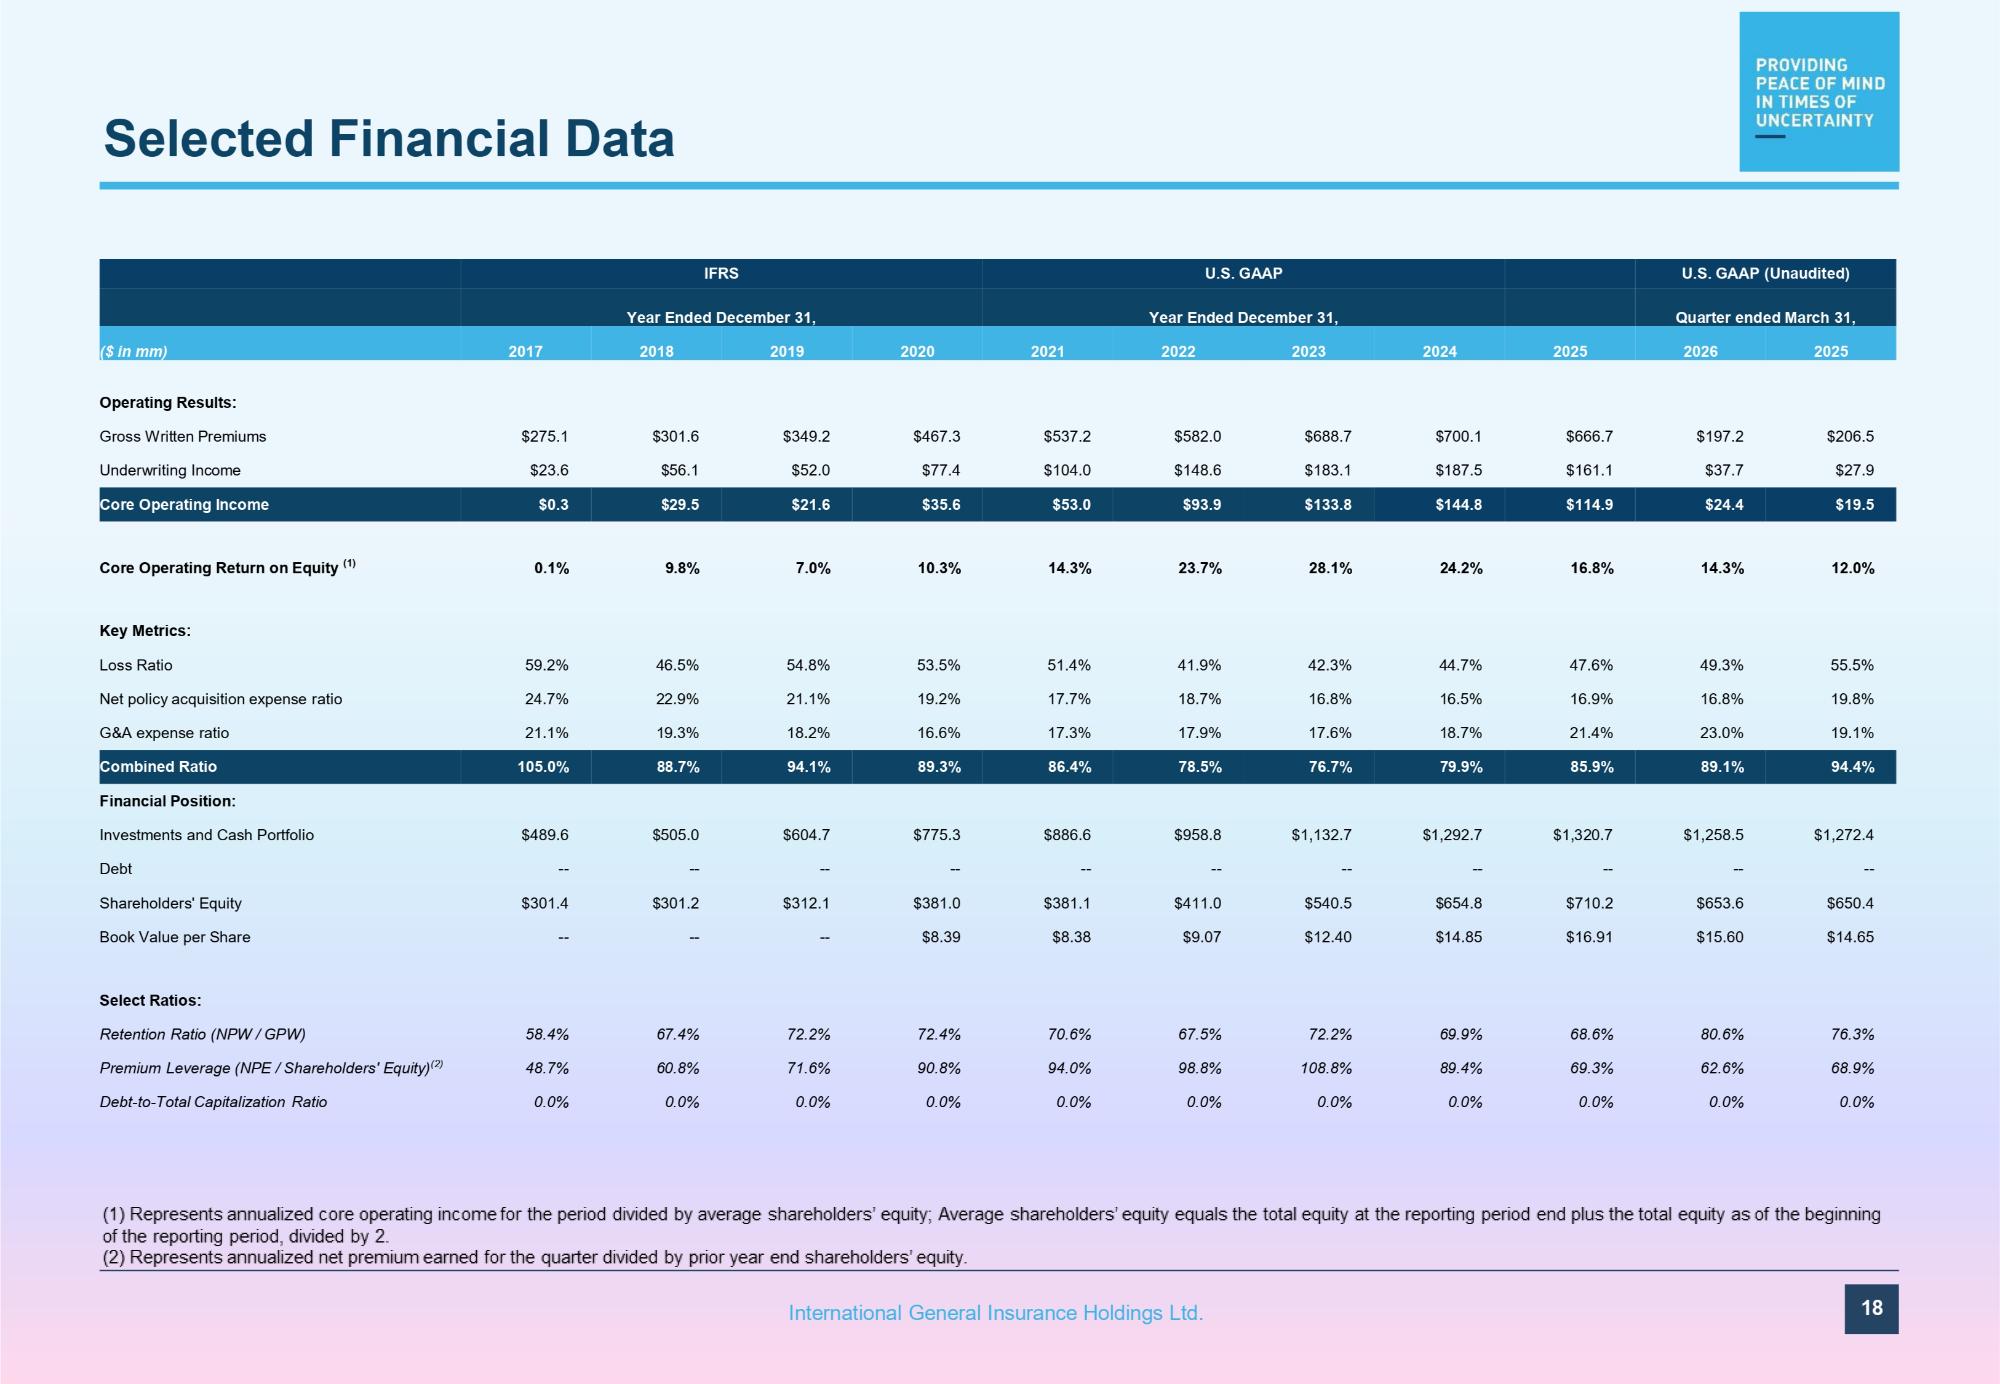
Selected Financial Data 18 International General Insurance Holdings Ltd. U.S. GAAP (Unaudited) U.S. GAAP IFRS Quarter ended March 31, Year Ended December 31, Year Ended December 31, 2025 2026 2025 2024 2023 2022 2021 2020 2019 2018 2017 ($ in mm) Operating Results: $206.5 $197.2 $666.7 $700.1 $688.7 $582.0 $537.2 $467.3 $349.2 $301.6 $275.1 Gross Written Premiums $27.9 $37.7 $161.1 $187.5 $183.1 $148.6 $104.0 $77.4 $52.0 $56.1 $23.6 Underwriting Income $19.5 $24.4 $114.9 $144.8 $133.8 $93.9 $53.0 $35.6 $21.6 $29.5 $0.3 Core Operating Income 12.0% 14.3% 16.8% 24.2% 28.1% 23.7% 14.3% 10.3% 7.0% 9.8% 0.1% Core Operating Return on Equity (1) Key Metrics: 55.5% 49.3% 47.6% 44.7% 42.3% 41.9% 51.4% 53.5% 54.8% 46.5% 59.2% Loss Ratio 19.8% 16.8% 16.9% 16.5% 16.8% 18.7% 17.7% 19.2% 21.1% 22.9% 24.7% Net policy acquisition expense ratio 19.1% 23.0% 21.4% 18.7% 17.6% 17.9% 17.3% 16.6% 18.2% 19.3% 21.1% G&A expense ratio 94.4% 89.1% 85.9% 79.9% 76.7% 78.5% 86.4% 89.3% 94.1% 88.7% 105.0% Combined Ratio Financial Position: $1,272.4 $1,258.5 $1,320.7 $1,292.7 $1,132.7 $958.8 $886.6 $775.3 $604.7 $505.0 $489.6 Investments and Cash Portfolio - - - - - - - - - - - - - - - - - - - - - - Debt $650.4 $653.6 $710.2 $654.8 $540.5 $411.0 $381.1 $381.0 $312.1 $301.2 $301.4 Shareholders' Equity $14.65 $15.60 $16.91 $14.85 $12.40 $9.07 $8.38 $8.39 - - - - - - Book Value per Share Select Ratios: 76.3% 80.6% 68.6% 69.9% 72.2% 67.5% 70.6% 72.4% 72.2% 67.4% 58.4% Retention Ratio (NPW / GPW) 68.9% 62.6% 69.3% 89.4% 108.8% 98.8% 94.0% 90.8% 71.6% 60.8% 48.7% Premium Leverage (NPE / Shareholders' Equity) (2) 0.0% 0.0% 0.0% 0.0% 0.0% 0.0% 0.0% 0.0% 0.0% 0.0% 0.0% Debt - to - Total Capitalization Ratio
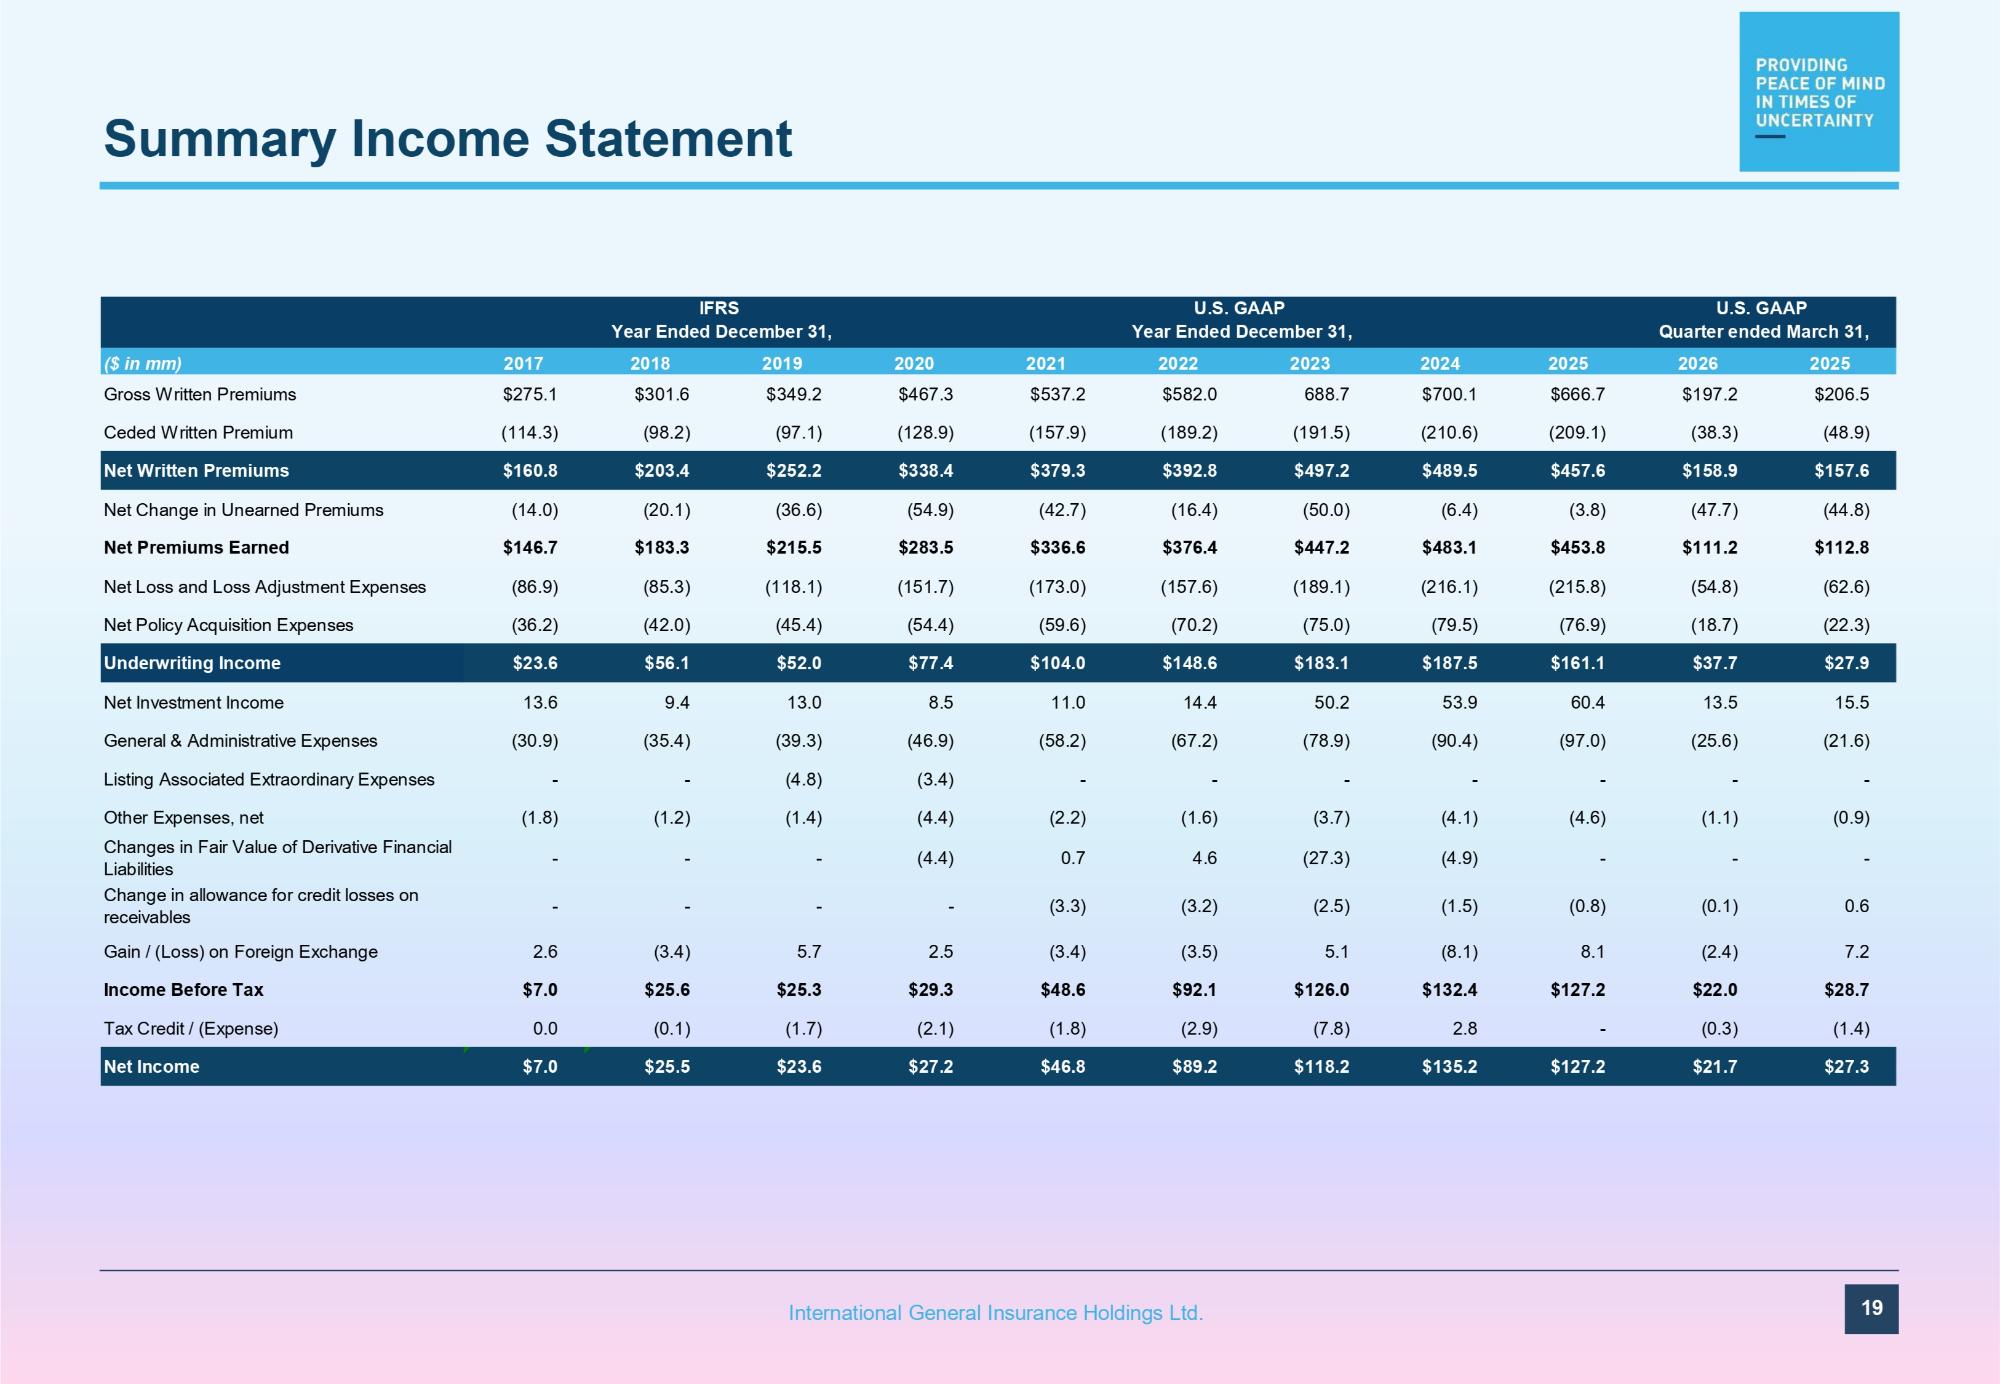
Summary Income Statement 19 International General Insurance Holdings Ltd. U.S. GAAP U.S. GAAP IFRS Quarter ended March 31, Year Ended December 31, Year Ended December 31, 2025 2026 2025 2024 2023 2022 2021 2020 2019 2018 2017 ($ in mm) $206.5 $197.2 $666.7 $700.1 688.7 $582.0 $537.2 $467.3 $349.2 $301.6 $275.1 Gross Written Premiums (48.9) (38.3) (209.1) (210.6) (191.5) (189.2) (157.9) (128.9) (97.1) (98.2) (114.3) Ceded Written Premium $157.6 $158.9 $457.6 $489.5 $497.2 $392.8 $379.3 $338.4 $252.2 $203.4 $160.8 Net Written Premiums (44.8) (47.7) (3.8) (6.4) (50.0) (16.4) (42.7) (54.9) (36.6) (20.1) (14.0) Net Change in Unearned Premiums $112.8 $111.2 $453.8 $483.1 $447.2 $376.4 $336.6 $283.5 $215.5 $183.3 $146.7 Net Premiums Earned (62.6) (54.8) (215.8) (216.1) (189.1) (157.6) (173.0) (151.7) (118.1) (85.3) (86.9) Net Loss and Loss Adjustment Expenses (22.3) (18.7) (76.9) (79.5) (75.0) (70.2) (59.6) (54.4) (45.4) (42.0) (36.2) Net Policy Acquisition Expenses $27.9 $37.7 $161.1 $187.5 $183.1 $148.6 $104.0 $77.4 $52.0 $56.1 $23.6 Underwriting Income 15.5 13.5 60.4 53.9 50.2 14.4 11.0 8.5 13.0 9.4 13.6 Net Investment Income (21.6) (25.6) (97.0) (90.4) (78.9) (67.2) (58.2) (46.9) (39.3) (35.4) (30.9) General & Administrative Expenses - - - - - - - (3.4) (4.8) - - Listing Associated Extraordinary Expenses (0.9) (1.1) (4.6) (4.1) (3.7) (1.6) (2.2) (4.4) (1.4) (1.2) (1.8) Other Expenses, net - - - (4.9) (27.3) 4.6 0.7 (4.4) - - - Changes in Fair Value of Derivative Financial Liabilities 0.6 (0.1) (0.8) (1.5) (2.5) (3.2) (3.3) - - - - Change in allowance for credit losses on receivables 7.2 (2.4) 8.1 (8.1) 5.1 (3.5) (3.4) 2.5 5.7 (3.4) 2.6 Gain / (Loss) on Foreign Exchange $28.7 $22.0 $127.2 $132.4 $126.0 $92.1 $48.6 $29.3 $25.3 $25.6 $7.0 Income Before Tax (1.4) (0.3) - 2.8 (7.8) (2.9) (1.8) (2.1) (1.7) (0.1) 0.0 Tax Credit / (Expense) $27.3 $21.7 $127.2 $135.2 $118.2 $89.2 $46.8 $27.2 $23.6 $25.5 $7.0 Net Income
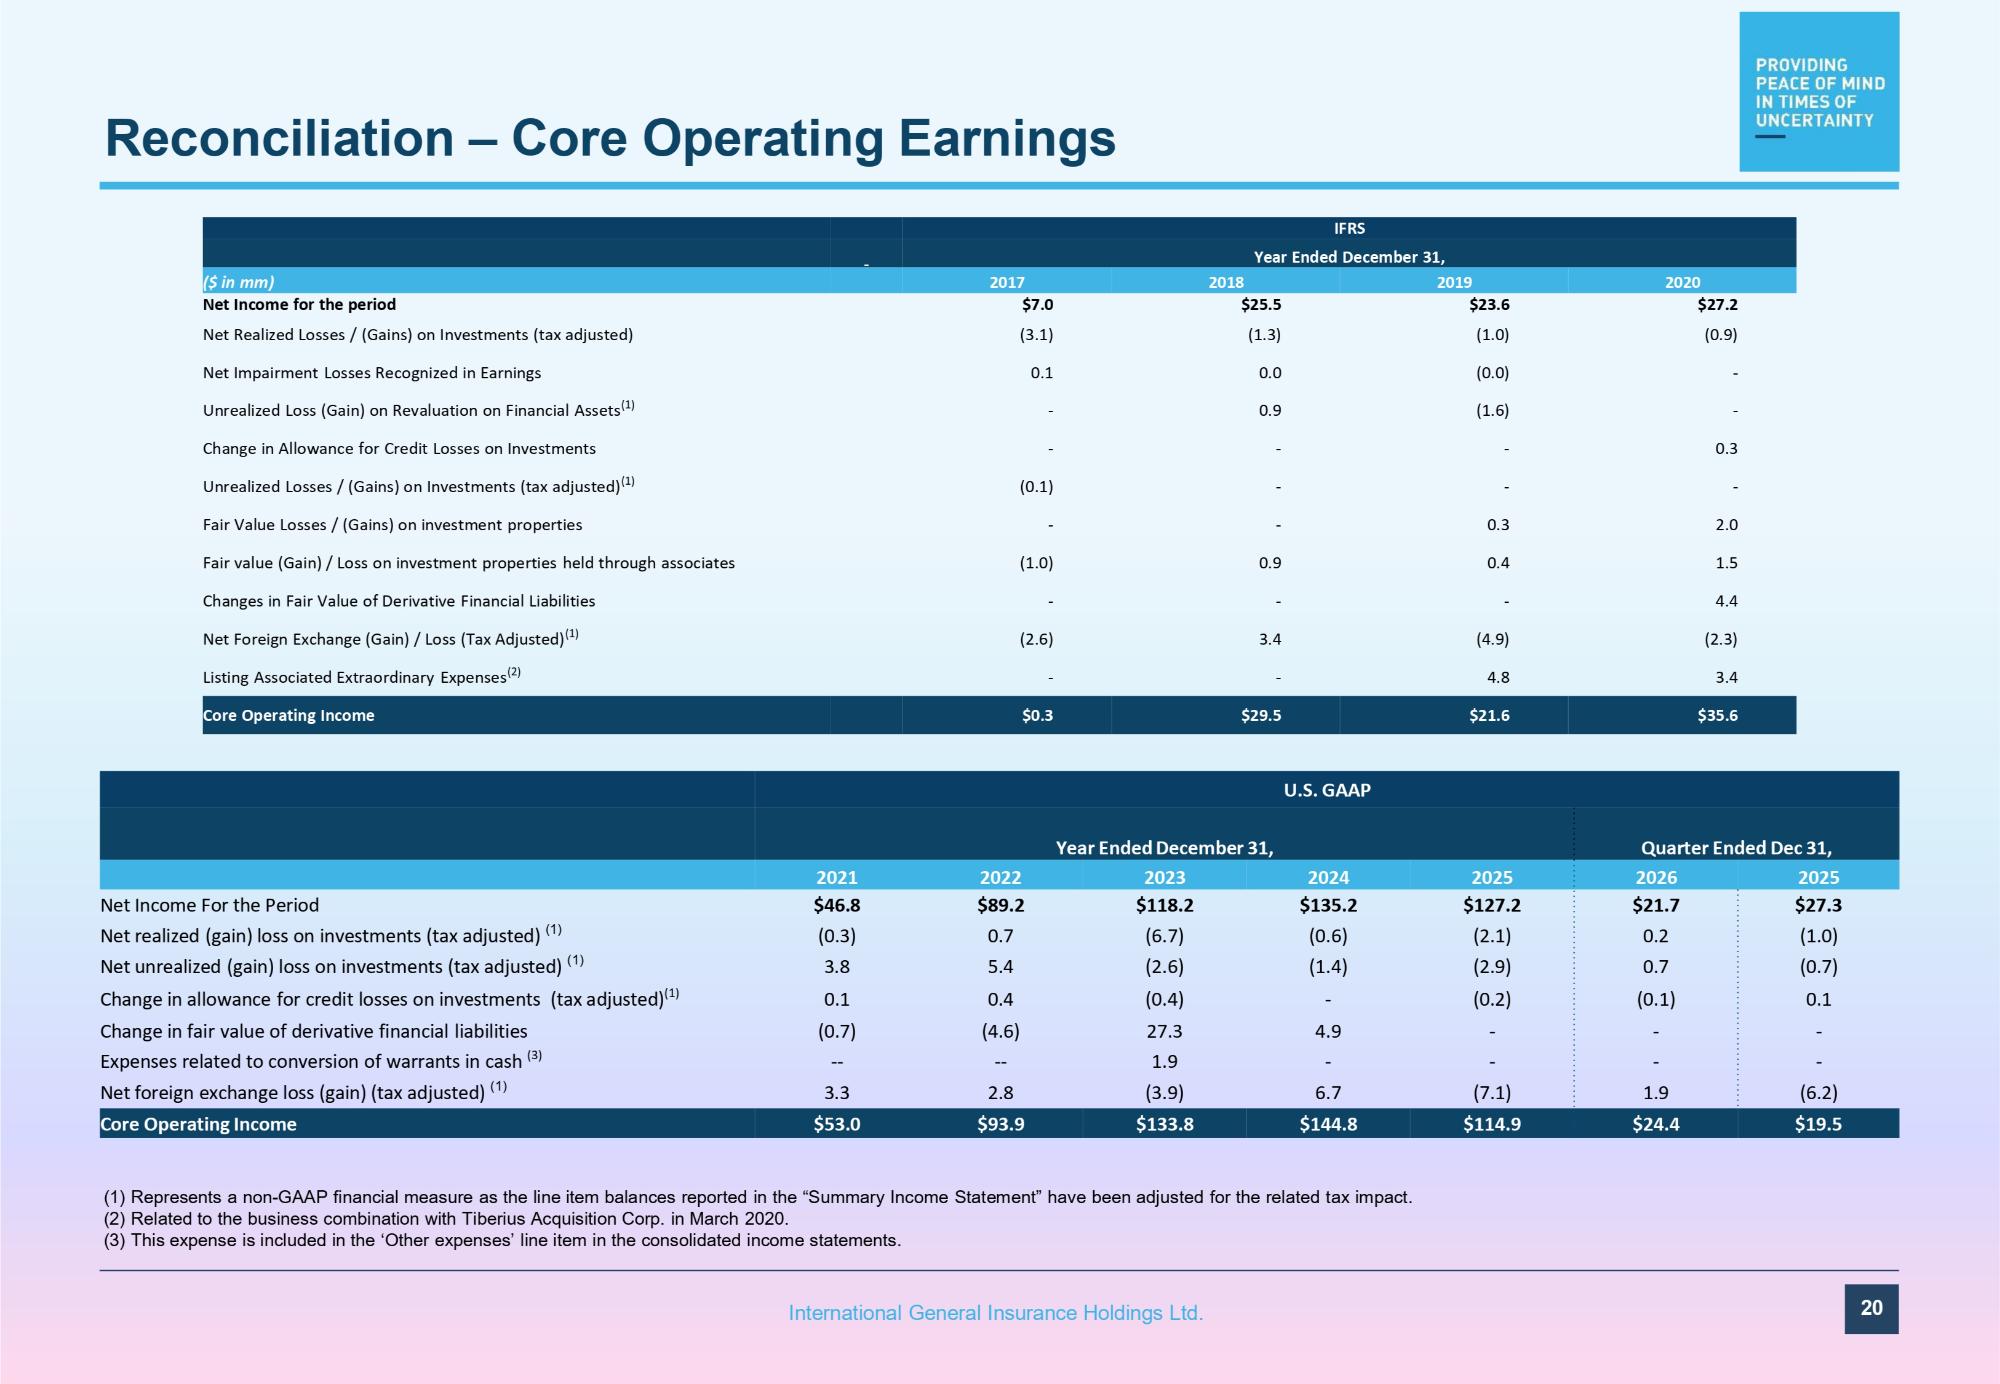
Reconciliation – Core Operating Earnings 20 International General Insurance Holdings Ltd. (1) Represents a non - GAAP financial measure as the line item balances reported in the “Summary Income Statement” have been adjusted for the related tax impact. (2) Related to the business combination with Tiberius Acquisition Corp. in March 2020. (3) This expense is included in the ‘Other expenses’ line item in the consolidated income statements. IFRS Year Ended December 31, 2020 2019 2018 2017 ($ in mm) $27.2 $23.6 $25.5 $7.0 Net Income for the period (0.9) (1.0) (1.3) (3.1) Net Realized Losses / (Gains) on Investments (tax adjusted) - (0.0) 0.0 0.1 Net Impairment Losses Recognized in Earnings - (1.6) 0.9 - Unrealized Loss (Gain) on Revaluation on Financial Assets (1) 0.3 - - - Change in Allowance for Credit Losses on Investments - - - (0.1) Unrealized Losses / (Gains) on Investments (tax adjusted) (1) 2.0 0.3 - - Fair Value Losses / (Gains) on investment properties 1.5 0.4 0.9 (1.0) Fair value (Gain) / Loss on investment properties held through associates 4.4 - - - Changes in Fair Value of Derivative Financial Liabilities (2.3) (4.9) 3.4 (2.6) Net Foreign Exchange (Gain) / Loss (Tax Adjusted) (1) 3.4 4.8 - - Listing Associated Extraordinary Expenses (2) $35.6 $21.6 $29.5 $0.3 Core Operating Income U.S. GAAP Quarter Ended Dec 31, Year Ended December 31, 2025 2026 2025 2024 2023 2022 2021 $27.3 $21.7 $127.2 $135.2 $118.2 $89.2 $46.8 Net Income For the Period (1.0) 0.2 (2.1) (0.6) (6.7) 0.7 (0.3) Net realized (gain) loss on investments (tax adjusted) (1) (0.7) 0.7 (2.9) (1.4) (2.6) 5.4 3.8 Net unrealized (gain) loss on investments (tax adjusted) (1) 0.1 (0.1) (0.2) - (0.4) 0.4 0.1 Change in allowance for credit losses on investments (tax adjusted) (1) - - - 4.9 27.3 (4.6) (0.7) Change in fair value of derivative financial liabilities - - - - 1.9 -- -- Expenses related to conversion of warrants in cash (3) (6.2) 1.9 (7.1) 6.7 (3.9) 2.8 3.3 Net foreign exchange loss (gain) (tax adjusted) (1) $19.5 $24.4 $114.9 $144.8 $133.8 $93.9 $53.0 Core Operating Income
Contact Us 21 International General Insurance Holdings Ltd. Investor Inquiries: Robin Sidders Head of Corporate Relations robin.sidders@iginsure.com Ahmad Jabsheh AVP, Corporate Relations ahmad.jabsheh@iginsure.com iginsure.com