(a) | | (b) | | (c) | | (d) | | (e) | | (f) | | (g) | | (h) | | (i) |
Average | Value of Initial Fixed $100 | |||||||||||||||
Summary | Summary | Average | Investment Based On: | |||||||||||||
Compensation | Compensation | Compensation | Compensation | Peer Group | ||||||||||||
Table Total | Actually Paid | Table Total for | Actually Paid to | Total Share- | Total Share- | |||||||||||
Year | for PEO | to PEO (1) | Non-PEO NEOs | Non-PEO NEOs (1) | Holder Return | Holder Return |
| Net Income | Net Income | |||||||
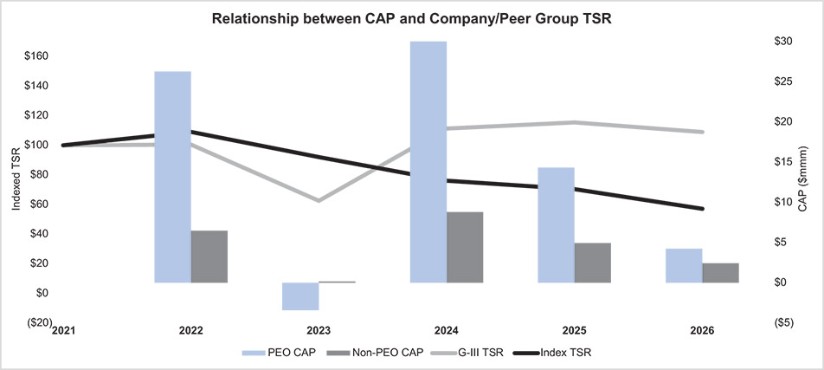
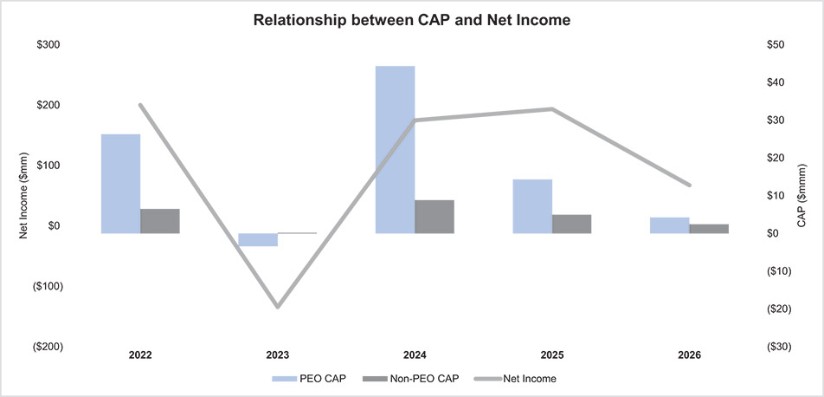
2026 | 12,508,253 | 9,057,121 | 6,584,492 | 5,843,218 | $ 108.89 | $ 57.16 | 67,353 | 110,669 | ||||||||
2025 | 16,652,646 | 14,323,483 | 5,979,871 | 4,945,556 | $ 115.46 | $ 70.42 | 193,293 | 269,859 | ||||||||
2024 | 31,431,039 | 44,305,949 | 5,295,148 | 8,807,666 | $ 111.28 | $ 76.07 | 174,740 | 240,599 | ||||||||
2023 | 5,790,860 | (3,406,531) | 3,371,945 | 169,702 | $ 62.57 | $ 92.06 | (134,382) | (138,170) | ||||||||
2022 | 24,942,778 | 26,290,697 | 5,854,421 | 6,494,397 | $ 100.48 | $ 109.04 | 200,101 | 270,976 | ||||||||
(1) | The dollar amounts shown in these columns reflect compensation actually paid (“CAP”) to Morris Goldfarb and our non-PEO NEOs, respectively, calculated in accordance with SEC rules. As required, the dollar amounts include (among other items) unpaid amounts of equity compensation that may be realized in future periods, and as such, the dollar amounts shown do not fully represent the actual final amount of compensation earned or actually paid to any individual during the applicable years. The adjustments made to each officer’s total compensation for each year to determine CAP are shown in the tables below. |
RECONCILIATION OF SUMMARY COMPENSATION TABLE TOTAL TO Compensation Actually Paid (“CAP”) TOTAL
As shown in the tables below, the CAP totals represent the Summary Compensation Table totals for the applicable year, but adjusted as required by SEC rules to include the fair value of current and prior year equity awards that are outstanding, vested, or forfeited during the applicable year, instead of the grant date value of awards granted during the applicable year.
Reported Summary | ||||||||
Compensation Table | Reported Value | Equity Award | Compensation Actually | |||||
Year | Total for PEO | of Equity Awards (1) | Adjustments (2) | Paid to PEO | ||||
2026 | 12,508,253 | (5,999,976) | 2,548,844 | 9,057,121 | ||||
2025 | 16,652,646 | (5,999,990) | 3,670,827 | 14,323,483 | ||||
2024 | 31,431,039 | (20,709,998) | 33,584,908 | 44,305,949 | ||||
2023 | 5,790,860 | (4,499,972) | (4,697,419) | (3,406,531) | ||||
2022 | 24,942,778 | (16,167,626) | 17,515,545 | 26,290,697 |
(1) | Represents the total of the amounts reported in the Stock Awards column of the Summary Compensation Table for the applicable year. |
(2) | The fair value of the of the equity component of the CAP calculation was determined in accordance with SEC methodology for this disclosure. Unlike the Summary Compensation Table, which includes a calculation of the grant date value of equity awards granted during the applicable year, the CAP table includes a calculation of equity fair value as follows: |
a. | for awards granted during the applicable year (and which are still outstanding), the year-end value; plus |
b. | for awards granted during prior years that were still outstanding as of the applicable year-end, the change in value as of the applicable year-end compared against the prior year-end; plus |
c. | for any awards granted in the applicable year that vested during the applicable year, the value as of the vesting date; plus |
d. | for awards granted in prior years that vested during the applicable year, the change in value as of the vesting date compared against the prior year-end; minus |
e. | for awards granted in prior years that were forfeited during the applicable year, the value as of the prior year-end. |
| (a) | | (b) | | (c) | | (d) | | (e) | | ||
PEO | Year over Year | Fair Value at | ||||||||||
Change in Fair | the End of the | |||||||||||
Year over Year | Fair Value as | Value of | Prior Year of | |||||||||
Year End Fair | Change in Fair | of Vesting Date | Equity Awards | Equity Awards | ||||||||
Value of | Value of | of Equity | Granted in | that Failed to | Total | |||||||
Outstanding | Outstanding and | Awards Granted | Prior Years that | Meet Vesting | Equity | |||||||
and Unvested | Unvested Equity | and Vested in | Vested in | Conditions | Award | |||||||
Year | Equity Awards | Awards | the Year | the Year | in the Year | Adjustments | ||||||
2026 | 5,208,530 | (2,330,802) | — | (328,884) | — | 2,548,844 | ||||||
2025 | 8,338,331 | (4,419,335) | — | (248,169) | — | 3,670,827 | ||||||
2024 | 31,251,023 | 1,186,386 | — | 1,147,500 | — | 33,584,908 | ||||||
2023 | 908,731 | (5,474,346) | — | (131,804) | — | (4,697,419) | ||||||
2022 | 4,322,272 | 769,298 | 12,167,656 | 256,319 | — | 17,515,545 |
The tables below reflect the average total compensation of our non-PEO NEOs, as calculated in the Summary Compensation Table for each of the years shown. Our non-PEO NEOs are the following individuals: for fiscal 2026, 2025 and 2024, Sammy Aaron, Neal Nackman, Jeffrey Goldfarb and Dana Perlman, who became an NEO on January 8, 2024.
Average Reported | ||||||||
Summary Compensation | Average Compensation | |||||||
Total Table for | Average Reported Value | Average Equity | Actually Paid | |||||
Year | Non-PEO NEOs | of Equity Awards (3) | Award Adjustments (4) | to Non-PEO NEOs | ||||
2026 | 6,584,492 | (3,837,457) | 3,096,183 | 5,843,218 | ||||
2025 | 5,979,871 | (1,674,986) | 640,672 | 4,945,556 | ||||
2024 | 5,295,148 | (1,199,983) | 4,712,501 | 8,807,666 | ||||
2023 | 3,371,945 | (1,666,643) | (1,535,600) | 169,702 | ||||
2022 | 5,854,421 | (2,420,636) | 3,060,612 | 6,494,397 |
(3) | Represents the total of the amounts reported in the Stock Awards column of the Summary Compensation Table for the applicable year. |
(4) | The fair value of the of the equity component of the CAP calculation was determined in accordance with SEC methodology for this disclosure. Unlike the Summary Compensation Table, which includes a calculation of the grant date value of equity awards granted during the applicable year, the CAP table includes a calculation of equity fair value as follows: |
a. | for awards granted during the applicable year (and which are still outstanding), the year-end value; plus |
b. | for awards granted during prior years that were still outstanding as of the applicable year-end, the change in value as of the applicable year-end compared against the prior year-end; plus |
c. | for any awards granted in the applicable year that vested during the applicable year, the value as of the vesting date; plus |
d. | for awards granted in prior years that vested during the applicable year, the change in value as of the vesting date compared against the prior year-end; minus |
e. | for awards granted in prior years that were forfeited during the applicable year, the value as of the prior year-end. |
| (a) | | (b) | | (c) | | (d) | | (e) | | ||
Non-PEO | Average | |||||||||||
NEO's | Year over Year | Fair Value at | ||||||||||
Average | Average Change | the End of the | ||||||||||
Year over Year | Fair Value as | in Fair Value | Prior Year of | |||||||||
Average Change | of Vesting Date | of Equity | Equity Awards | Total | ||||||||
Average | in Fair Value | of Equity | Awards Granted | that Failed to | Average | |||||||
Year End Fair | of Outstanding | Awards Granted | in Prior Years | Meet Vesting | Equity | |||||||
Value of | and Unvested | and Vested in | that Vested in | Conditions | Award | |||||||
Year | Equity Awards | Equity Awards | the Year | the Year | in the Year | Adjustments | ||||||
2026 | 3,515,351 | (282,046) | — | (137,121) | — | 3,096,183 | ||||||
2025 | 2,322,037 | (1,598,092) | — | (83,274) | — | 640,672 | ||||||
2024 | 2,792,521 | 1,504,330 | — | 415,650 | — | 4,712,501 | ||||||
2023 | 448,751 | (1,939,445) | — | (44,906) | — | (1,535,600) | ||||||
2022 | 1,411,940 | 294,826 | 1,113,980 | 239,867 | — | 3,060,612 |
(1) | The dollar amounts shown in these columns reflect compensation actually paid (“CAP”) to Morris Goldfarb and our non-PEO NEOs, respectively, calculated in accordance with SEC rules. As required, the dollar amounts include (among other items) unpaid amounts of equity compensation that may be realized in future periods, and as such, the dollar amounts shown do not fully represent the actual final amount of compensation earned or actually paid to any individual during the applicable years. The adjustments made to each officer’s total compensation for each year to determine CAP are shown in the tables below. |
As shown in the tables below, the CAP totals represent the Summary Compensation Table totals for the applicable year, but adjusted as required by SEC rules to include the fair value of current and prior year equity awards that are outstanding, vested, or forfeited during the applicable year, instead of the grant date value of awards granted during the applicable year.
Reported Summary | ||||||||
Compensation Table | Reported Value | Equity Award | Compensation Actually | |||||
Year | Total for PEO | of Equity Awards (1) | Adjustments (2) | Paid to PEO | ||||
2026 | 12,508,253 | (5,999,976) | 2,548,844 | 9,057,121 | ||||
2025 | 16,652,646 | (5,999,990) | 3,670,827 | 14,323,483 | ||||
2024 | 31,431,039 | (20,709,998) | 33,584,908 | 44,305,949 | ||||
2023 | 5,790,860 | (4,499,972) | (4,697,419) | (3,406,531) | ||||
2022 | 24,942,778 | (16,167,626) | 17,515,545 | 26,290,697 |
(1) | Represents the total of the amounts reported in the Stock Awards column of the Summary Compensation Table for the applicable year. |
(2) | The fair value of the of the equity component of the CAP calculation was determined in accordance with SEC methodology for this disclosure. Unlike the Summary Compensation Table, which includes a calculation of the grant date value of equity awards granted during the applicable year, the CAP table includes a calculation of equity fair value as follows: |
a. | for awards granted during the applicable year (and which are still outstanding), the year-end value; plus |
b. | for awards granted during prior years that were still outstanding as of the applicable year-end, the change in value as of the applicable year-end compared against the prior year-end; plus |
c. | for any awards granted in the applicable year that vested during the applicable year, the value as of the vesting date; plus |
d. | for awards granted in prior years that vested during the applicable year, the change in value as of the vesting date compared against the prior year-end; minus |
e. | for awards granted in prior years that were forfeited during the applicable year, the value as of the prior year-end. |
| (a) | | (b) | | (c) | | (d) | | (e) | | ||
PEO | Year over Year | Fair Value at | ||||||||||
Change in Fair | the End of the | |||||||||||
Year over Year | Fair Value as | Value of | Prior Year of | |||||||||
Year End Fair | Change in Fair | of Vesting Date | Equity Awards | Equity Awards | ||||||||
Value of | Value of | of Equity | Granted in | that Failed to | Total | |||||||
Outstanding | Outstanding and | Awards Granted | Prior Years that | Meet Vesting | Equity | |||||||
and Unvested | Unvested Equity | and Vested in | Vested in | Conditions | Award | |||||||
Year | Equity Awards | Awards | the Year | the Year | in the Year | Adjustments | ||||||
2026 | 5,208,530 | (2,330,802) | — | (328,884) | — | 2,548,844 | ||||||
2025 | 8,338,331 | (4,419,335) | — | (248,169) | — | 3,670,827 | ||||||
2024 | 31,251,023 | 1,186,386 | — | 1,147,500 | — | 33,584,908 | ||||||
2023 | 908,731 | (5,474,346) | — | (131,804) | — | (4,697,419) | ||||||
2022 | 4,322,272 | 769,298 | 12,167,656 | 256,319 | — | 17,515,545 |
The tables below reflect the average total compensation of our non-PEO NEOs, as calculated in the Summary Compensation Table for each of the years shown. Our non-PEO NEOs are the following individuals: for fiscal 2026, 2025 and 2024, Sammy Aaron, Neal Nackman, Jeffrey Goldfarb and Dana Perlman, who became an NEO on January 8, 2024.
Average Reported | ||||||||
Summary Compensation | Average Compensation | |||||||
Total Table for | Average Reported Value | Average Equity | Actually Paid | |||||
Year | Non-PEO NEOs | of Equity Awards (3) | Award Adjustments (4) | to Non-PEO NEOs | ||||
2026 | 6,584,492 | (3,837,457) | 3,096,183 | 5,843,218 | ||||
2025 | 5,979,871 | (1,674,986) | 640,672 | 4,945,556 | ||||
2024 | 5,295,148 | (1,199,983) | 4,712,501 | 8,807,666 | ||||
2023 | 3,371,945 | (1,666,643) | (1,535,600) | 169,702 | ||||
2022 | 5,854,421 | (2,420,636) | 3,060,612 | 6,494,397 |
(3) | Represents the total of the amounts reported in the Stock Awards column of the Summary Compensation Table for the applicable year. |
(4) | The fair value of the of the equity component of the CAP calculation was determined in accordance with SEC methodology for this disclosure. Unlike the Summary Compensation Table, which includes a calculation of the grant date value of equity awards granted during the applicable year, the CAP table includes a calculation of equity fair value as follows: |
a. | for awards granted during the applicable year (and which are still outstanding), the year-end value; plus |
b. | for awards granted during prior years that were still outstanding as of the applicable year-end, the change in value as of the applicable year-end compared against the prior year-end; plus |
c. | for any awards granted in the applicable year that vested during the applicable year, the value as of the vesting date; plus |
d. | for awards granted in prior years that vested during the applicable year, the change in value as of the vesting date compared against the prior year-end; minus |
e. | for awards granted in prior years that were forfeited during the applicable year, the value as of the prior year-end. |
| (a) | | (b) | | (c) | | (d) | | (e) | | ||
Non-PEO | Average | |||||||||||
NEO's | Year over Year | Fair Value at | ||||||||||
Average | Average Change | the End of the | ||||||||||
Year over Year | Fair Value as | in Fair Value | Prior Year of | |||||||||
Average Change | of Vesting Date | of Equity | Equity Awards | Total | ||||||||
Average | in Fair Value | of Equity | Awards Granted | that Failed to | Average | |||||||
Year End Fair | of Outstanding | Awards Granted | in Prior Years | Meet Vesting | Equity | |||||||
Value of | and Unvested | and Vested in | that Vested in | Conditions | Award | |||||||
Year | Equity Awards | Equity Awards | the Year | the Year | in the Year | Adjustments | ||||||
2026 | 3,515,351 | (282,046) | — | (137,121) | — | 3,096,183 | ||||||
2025 | 2,322,037 | (1,598,092) | — | (83,274) | — | 640,672 | ||||||
2024 | 2,792,521 | 1,504,330 | — | 415,650 | — | 4,712,501 | ||||||
2023 | 448,751 | (1,939,445) | — | (44,906) | — | (1,535,600) | ||||||
2022 | 1,411,940 | 294,826 | 1,113,980 | 239,867 | — | 3,060,612 |
Important Performance Measures
The following performance measures are the most important used by the Company to link executive compensation actually paid to the NEOs to company performance during fiscal 2026. See “Compensation Discussion and Analysis” for more information about how these measures impact our NEOs’ compensation.
Company-Selected Performance Measures |
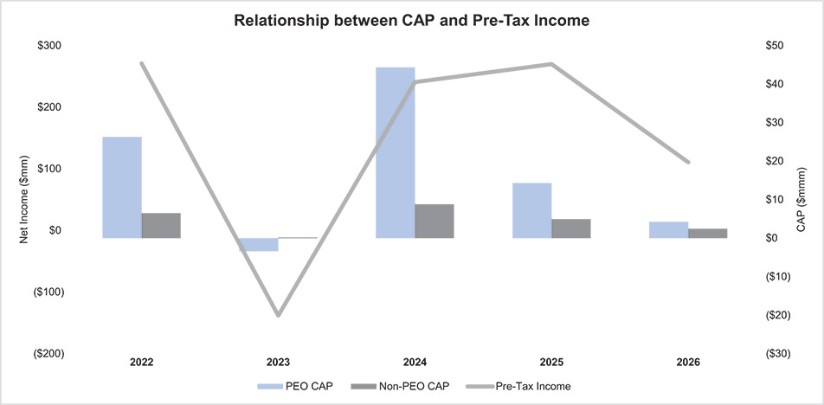
Adjusted Pre-Tax Income |
Percent Change in Basic Common Shares Outstanding |
Percent Change in Earnings Per Share |
Cumulative Adjusted Earnings before Interest and Taxes (EBIT) |
Return on Invested Capital (ROIC) |
Total Shareholder Return (TSR) |
(2) | The fair value of the of the equity component of the CAP calculation was determined in accordance with SEC methodology for this disclosure. Unlike the Summary Compensation Table, which includes a calculation of the grant date value of equity awards granted during the applicable year, the CAP table includes a calculation of equity fair value as follows: |
a. | for awards granted during the applicable year (and which are still outstanding), the year-end value; plus |
b. | for awards granted during prior years that were still outstanding as of the applicable year-end, the change in value as of the applicable year-end compared against the prior year-end; plus |
c. | for any awards granted in the applicable year that vested during the applicable year, the value as of the vesting date; plus |
d. | for awards granted in prior years that vested during the applicable year, the change in value as of the vesting date compared against the prior year-end; minus |
e. | for awards granted in prior years that were forfeited during the applicable year, the value as of the prior year-end. |
| (a) | | (b) | | (c) | | (d) | | (e) | | ||
PEO | Year over Year | Fair Value at | ||||||||||
Change in Fair | the End of the | |||||||||||
Year over Year | Fair Value as | Value of | Prior Year of | |||||||||
Year End Fair | Change in Fair | of Vesting Date | Equity Awards | Equity Awards | ||||||||
Value of | Value of | of Equity | Granted in | that Failed to | Total | |||||||
Outstanding | Outstanding and | Awards Granted | Prior Years that | Meet Vesting | Equity | |||||||
and Unvested | Unvested Equity | and Vested in | Vested in | Conditions | Award | |||||||
Year | Equity Awards | Awards | the Year | the Year | in the Year | Adjustments | ||||||
2026 | 5,208,530 | (2,330,802) | — | (328,884) | — | 2,548,844 | ||||||
2025 | 8,338,331 | (4,419,335) | — | (248,169) | — | 3,670,827 | ||||||
2024 | 31,251,023 | 1,186,386 | — | 1,147,500 | — | 33,584,908 | ||||||
2023 | 908,731 | (5,474,346) | — | (131,804) | — | (4,697,419) | ||||||
2022 | 4,322,272 | 769,298 | 12,167,656 | 256,319 | — | 17,515,545 |
(4) | The fair value of the of the equity component of the CAP calculation was determined in accordance with SEC methodology for this disclosure. Unlike the Summary Compensation Table, which includes a calculation of the grant date value of equity awards granted during the applicable year, the CAP table includes a calculation of equity fair value as follows: |
a. | for awards granted during the applicable year (and which are still outstanding), the year-end value; plus |
b. | for awards granted during prior years that were still outstanding as of the applicable year-end, the change in value as of the applicable year-end compared against the prior year-end; plus |
c. | for any awards granted in the applicable year that vested during the applicable year, the value as of the vesting date; plus |
d. | for awards granted in prior years that vested during the applicable year, the change in value as of the vesting date compared against the prior year-end; minus |
e. | for awards granted in prior years that were forfeited during the applicable year, the value as of the prior year-end. |
| (a) | | (b) | | (c) | | (d) | | (e) | | ||
Non-PEO | Average | |||||||||||
NEO's | Year over Year | Fair Value at | ||||||||||
Average | Average Change | the End of the | ||||||||||
Year over Year | Fair Value as | in Fair Value | Prior Year of | |||||||||
Average Change | of Vesting Date | of Equity | Equity Awards | Total | ||||||||
Average | in Fair Value | of Equity | Awards Granted | that Failed to | Average | |||||||
Year End Fair | of Outstanding | Awards Granted | in Prior Years | Meet Vesting | Equity | |||||||
Value of | and Unvested | and Vested in | that Vested in | Conditions | Award | |||||||
Year | Equity Awards | Equity Awards | the Year | the Year | in the Year | Adjustments | ||||||
2026 | 3,515,351 | (282,046) | — | (137,121) | — | 3,096,183 | ||||||
2025 | 2,322,037 | (1,598,092) | — | (83,274) | — | 640,672 | ||||||
2024 | 2,792,521 | 1,504,330 | — | 415,650 | — | 4,712,501 | ||||||
2023 | 448,751 | (1,939,445) | — | (44,906) | — | (1,535,600) | ||||||
2022 | 1,411,940 | 294,826 | 1,113,980 | 239,867 | — | 3,060,612 |