1

Exhibit 99.2

Q1 2026 Prepared Remarks
Good afternoon, and thanks for joining us.
Match Group entered 2026 with tangible
progress on the three-phase transformation
we outlined last year: Reset, Revitalize, and
Resurgence.
We completed the Reset phase in 2025 and
are now well into Revitalize, focused on
improving product experiences, strengthening
the ecosystem, and rebuilding growth.
We are operating with greater focus and
discipline. The portfolio is sharper, execution
is faster, and we are leveraging our scale
more effectively through our ‘1MG’ approach.
We are reinvesting where we see clear
opportunities to improve user outcomes, while
continuing to return meaningful capital to
shareholders.
Our progress is showing up in three areas:
•First, leading indicators at Tinder® are
showing momentum, reflecting better
product experiences for Gen Z, and
that progress is increasingly
translating into top-line metrics like
Monthly Active Users (“MAU”), Payers, and Direct Revenue.
•Second, Hinge® continues to scale, combining strong revenue growth, rapid product
innovation, particularly in AI-driven features, and continued international expansion.
•And third, we continue to streamline our portfolio and organizational structure, simplifying how
we operate and focusing resources on our highest-conviction opportunities.
Looking ahead, our objective is to drive a Resurgence with our audience by re-establishing Tinder as
a growth business during 2027 through restoring durable user engagement and relevance at scale.
And all of this is happening alongside disciplined financial execution. In Q1’26, we exceeded our
revenue and Adjusted EBITDA expectations on the back of strength at Tinder. Steve will walk through
the details shortly.
1 Retention measures the share of existing users who remain active after 30 days.
2
Tinder’s Product-led Turnaround
From the beginning, I’ve said this will be a product-led turnaround, starting with user outcomes and
moving up the funnel to user growth.
Our most important leading indicators, Sparks and Sparks Coverage, continue to improve.
In March, Sparks, the number of users
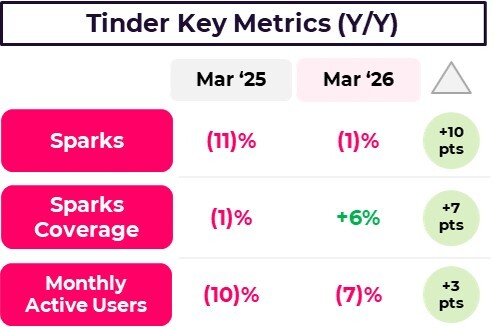
engaging in six-way conversations, were
down only 1% year-over-year (“Y/Y”), a
meaningful improvement from down 11% Y/Y
in March 2025. Sparks Coverage, which
measures the percentage of our users who
experience a Spark in a given period, was up
6% Y/Y in March, compared to down 1% Y/Y
in March 2025. These are our clearest signals
of product efficacy and real connection, and
they are improving.
As we’ve said before, our belief is: improving
Sparks leads to better retention and stronger word-of-mouth, driving MAU over time. We are now
starting to see that play out.
MAU declines continued to moderate in March, down 7% Y/Y, the slowest rate of decline in 31
months, compared to down 10% Y/Y in March 2025. This improvement was driven by a few factors:
First, user retention1 increased, up 1% Y/Y in March after multiple years of decline. U.S. Gen Z
women retention, a critical cohort for ecosystem health, was up 3% Y/Y in March.
Second, registrations returned to growth for the first time since June 2024, up 1% Y/Y in March,
compared to down 12% Y/Y in March 2025. This is proof that the brand is resonating through
marketing and word-of-mouth, driving new users into the experience.
We’re seeing this progress across different geographies and demographics, including in markets
where we’ve had the most ground to recover.
Progress may not always be linear, but the Y/Y trajectory of these leading indicators and user
engagement underscores our confidence in the strategy and we expect it to translate into revenue
growth over time.
3
Let me highlight a few of the efforts driving these improvements, many of which we showcased at our
Tinder Sparks event in March, which is available on our IR website.
First, recommendations. We’ve sharpened how Tinder understands what users are looking for and
how we deliver matches across the ecosystem. By learning preferences earlier, showing more
relevant profiles, and better serving both active and returning users, we’re helping people find
matches faster and driving more conversations with particularly strong gains for women.
Next, product innovation. Features like Astrology
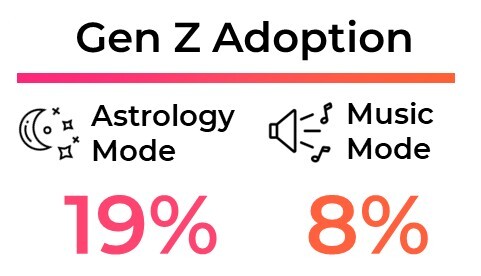
Mode and Music Mode are gaining traction with Gen Z
following their mid-March launch, reaching 19% and
8% adoption, respectively. We’re also seeing
encouraging early signals on user outcomes. For
example, in our early read, women who swipe on
Astrology cards are more likely to reach a Spark than
with non-Astro cards.
Like Double Date, these signals show new modes are
resonating by making discovery more expressive and lower pressure, which is exactly what Gen Z
users have been asking for.
And finally, Trust & Safety. We continue to scale Face Check™ into more regions, including the
recent launch in the UK and Singapore. Face Check is improving authenticity and user trust, with
particularly strong trends in the U.S. where net promoter scores have been trending higher.
Importantly, the revenue impact from our ongoing user experience tests remains within the range we
planned.
Simply put, Tinder works better now. We are not at the finish line, but the turnaround is clearly
underway.
2 Based on a random weighted sample of in-app profile views. Bad actors include accounts that engage in deceptive or harmful behaviors,
including spam, scam attempts, or operating automated fake profiles (bots).
4
Hinge: Product-led Growth at Scale
Hinge continues to build thoughtful, best-in-category experiences for highly intentioned daters. The
team remains focused on a key objective: helping users get out on great dates. That clarity is driving
its product roadmap, which is both rapidly advancing the core experience and introducing new and
compelling features.
Starting with the core experience, Hinge
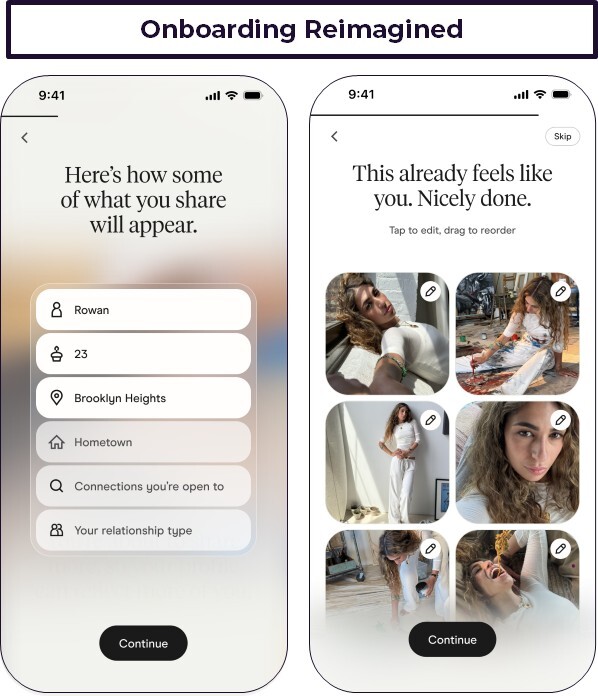
is strengthening profile quality through a
redesigned onboarding experience that
encourages users to slow down and reflect
on what they’re looking for before viewing
profiles. Structured prompts help users
more clearly communicate their relationship
goals, personality, and preferences from the
start. The experience is also more
interactive, giving users more visibility into
how they are represented and improving
confidence during profile creation. We plan
to expand this globally by the end of Q2.
In parallel, Hinge continues to strengthen
trust within the experience with Face
Check, which is now fully rolled out in the
U.S., UK, Australia, Canada, Brazil, and
Mexico, with additional markets planned for
Q2. In these markets, the feature has
reduced interactions with bad actors2 by
20-30%, with minimal impact on revenue.
Originally developed by Tinder, Face Check showcases portfolio-wide innovation, enabling Hinge to
quickly iterate and bring the feature to market faster.
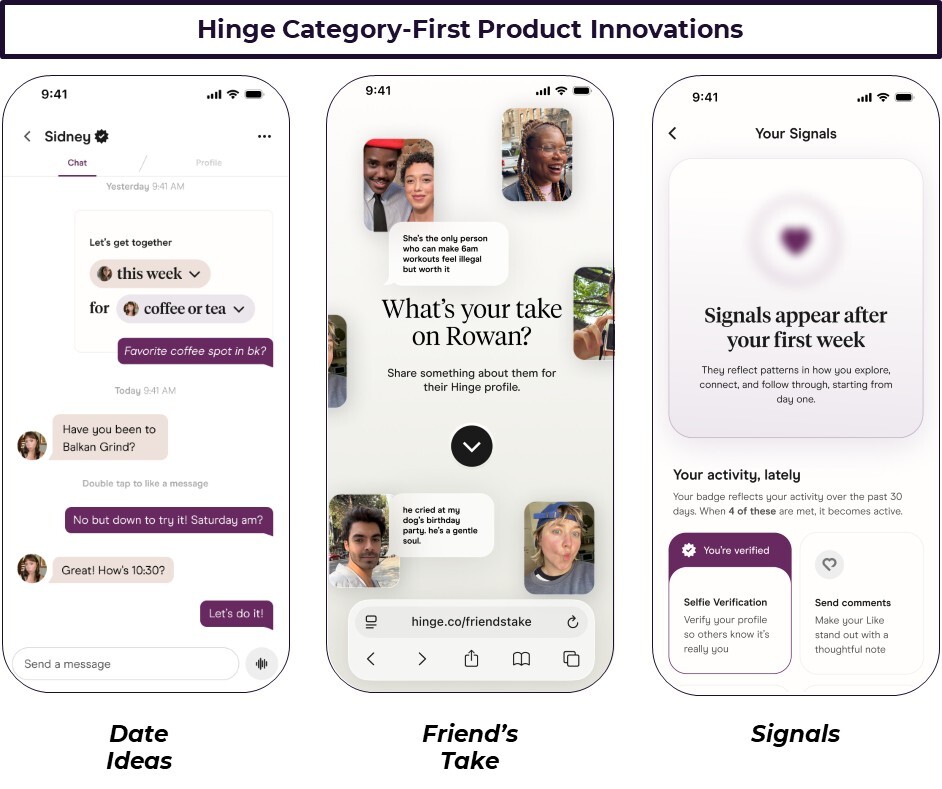
Building on its stronger core experience, Hinge is introducing a set of category-first features designed
to better express intent and help users move from connection to date:
•First, Hinge is reducing friction in getting to great dates with Date Ideas, (formerly Direct
to Date), which allows users to propose a date idea and time upfront to clarify intent and move
matches to real-life meetings faster. Early feedback has been encouraging, with nearly 9%
adoption in testing (one of the highest rates we’ve seen for a new profile feature) and users
expressing genuine excitement on social media. So far, users are defaulting to familiar, low-
effort date ideas like dinner, drinks, and walks, while custom date ideas skew toward light,
conversational activities like bowling, arcades, museums, and mini golf.
•Second, Hinge is expanding the role friends play on daters' profiles with Friend’s Take,
which addresses two core tensions: representing yourself authentically and navigating dating
alone, without community. Building on Hinge’s prompt-native format, the feature allows users
5
to invite trusted friends (on and off Hinge) to contribute short reflections to their profiles, adding
credibility and helping users get to know one another more deeply. Friend’s Take will begin
testing by the end of Q2, with broader rollout expected in Q3. We see potential for it to be a
top-of-funnel driver, similar to Voice Prompts a couple of years ago.
•Third, Hinge began testing Signals, a new feature designed to make effort and
intentionality more visible. When users consistently demonstrate thoughtful participation by
doing things like completing their profile, responding to messages, and engaging in meaningful
conversations, they earn a Signals badge on their profile. This badge “signals” to others on the
app their level of effort and intentionality, addressing a longstanding friction point in the
category, particularly for women and younger daters. Early results show improvements in
dating outcomes and user behaviors that benefit the overall ecosystem. As we invest in these
types of intentional features, we are creating new surface areas to potentially monetize later.
Hinge demonstrates the simple principle that when product-market fit is strong and user outcomes are
clear, growth follows and the model scales. Hinge continues to lead the category in product innovation
through its consistent focus on user outcomes, and it’s led to strong financial results. We are excited
to see the impact of Hinge’s product roadmap on the business this year, as it continues on its path to
be a $1 billion business by 2027.
6
‘1MG’ Strategy in Action
We’re continuing the work we began last year to simplify the organization and operate more effectively
as 1MG.
As part of this effort, we’ve folded our MG Asia business unit into our E&E business unit. This brings
our two Asia-based businesses, Azar® and Pairs™, closer to the rest of the company, removes a
management layer, and improves efficiency while maintaining in-region, cross-brand go-to-market
capabilities. We expect this change to result in roughly $15 million in annualized cost savings,
including stock-based compensation.
It also enables more cohesive portfolio management, faster execution, and to apply shared
capabilities and resources.
On Azar, as we previously disclosed, Apple temporarily removed the app from the App Store on
February 22, 2026. The team moved quickly to make adjustments, which led to the reinstatement of a
new version on April 6, 2026. While still early, registrations and MAU are beginning to recover, but the
new app experience is monetizing at lower levels than the previous version. We are testing changes
to the product to improve monetization, but expect continued pressure on Azar Direct Revenue over
the balance of the year.
With the consolidation of MG Asia into E&E, we’ve transitioned our Seoul-based MG AI team of more
than 20 talented data scientists and machine-learning engineers to report into Tinder’s CTO. This
team will continue building shared 1MG technologies, including AI-driven photo uploading and AI-
enabled recommendation algorithms, but will now operate with closer alignment to our largest
business unit.
In addition, we’re shifting nearly 30 product, engineering, and analytics employees from Azar to Tinder
in Seoul. These moves concentrate resources into Tinder at a critical moment, supported by excellent
executive leadership, an accelerating product roadmap, and improving business momentum.
Following this move, we will have a nearly 60 person team focused on Tinder in Seoul, making it our
third largest tech hub after Palo Alto and LA.
We’ve also made progress in unifying performance marketing by further centralizing teams and
resources into a 1MG organization that buys digital media across brands. We spend nearly $600
million globally across 20+ brands, with significant efficiencies available to us as coordination ramps.
We are also bringing certain areas of E&E closer together with Tinder, starting with the executive
layer, where I now directly oversee both business units. This has unlocked significant opportunities for
better coordination and synergies, including the marketing changes I just mentioned. As I have dug
into E&E the last few weeks, we’ve identified many areas where Tinder and E&E results can be
improved through tighter coordination, collaboration, and integration.
Finally, this couldn’t be a 2026 earnings call without discussing AI. We see AI as a core enabler of
improving user outcomes, enhancing product experiences, increasing relevance, and accelerating
development and iteration across the portfolio. To support this, we’ve launched a global AI enablement
program that gives every employee access to leading AI tools, with the goal of becoming an AI-native
company. We’re also reassessing our hiring plans with AI enablement in mind and plan to reduce
headcount growth over the remainder of the year. And we’re standing up a cross-company AI
7
leadership team to help ensure consistent deployment of capabilities and avoid fragmentation across
brands.
These changes are about operating more simply and more effectively. We’re simplifying the portfolio,
focusing resources on our highest-conviction opportunities, and adapting quickly to where we believe
the category is going, not where it’s been. That’s 1MG in practice.
Final Thoughts
Stepping back, we have aligned our business around distinct user intents, with each brand serving a
different and important role. Together, they expand our reach across a broad and growing market for
human connection.
Within that framework, in April we made a $100 million investment for a significant minority stake in
Sniffies, a differentiated platform with strong product-market fit and a highly engaged user base. We
have the option to acquire the remaining equity in the future, similar to the approach we took with our
initial investment in Hinge in 2017.
Sniffies reinforces our commitment with non-heterosexual men, which represent a large and growing
portion of the category. We see a clear opportunity to lend our expertise in areas like Trust & Safety
and geographic expansion, while preserving what makes the platform unique to its community. As part
of this investment, we plan to wind down our gay male app, Archer, which we expect to result in
roughly $10 million in annualized cost savings, including stock-based compensation.
We’ve built a stronger foundation and are now seeing that translate into real momentum. By improving
how people connect and delivering better outcomes for users, we’re setting the business up for
durable growth. That’s what gives us confidence in the path to Resurgence.
8
Q1 2026 Financial Performance
We delivered a strong start to the year, exceeding both our revenue and Adjusted EBITDA
expectations. The outperformance was primarily driven by better-than-expected Direct Revenue and
Payer trends at Tinder and a benefit associated with Canada’s rescission of its digital services tax. I’ll
walk through the key drivers of the quarter and then turn to our guidance. Unless otherwise noted, all
amounts are on an as reported basis and comparisons will be discussed on a year-over-year (“Y/Y”)
basis. More details can be found in the financial table below and in the financials supplement found on
our IR website.
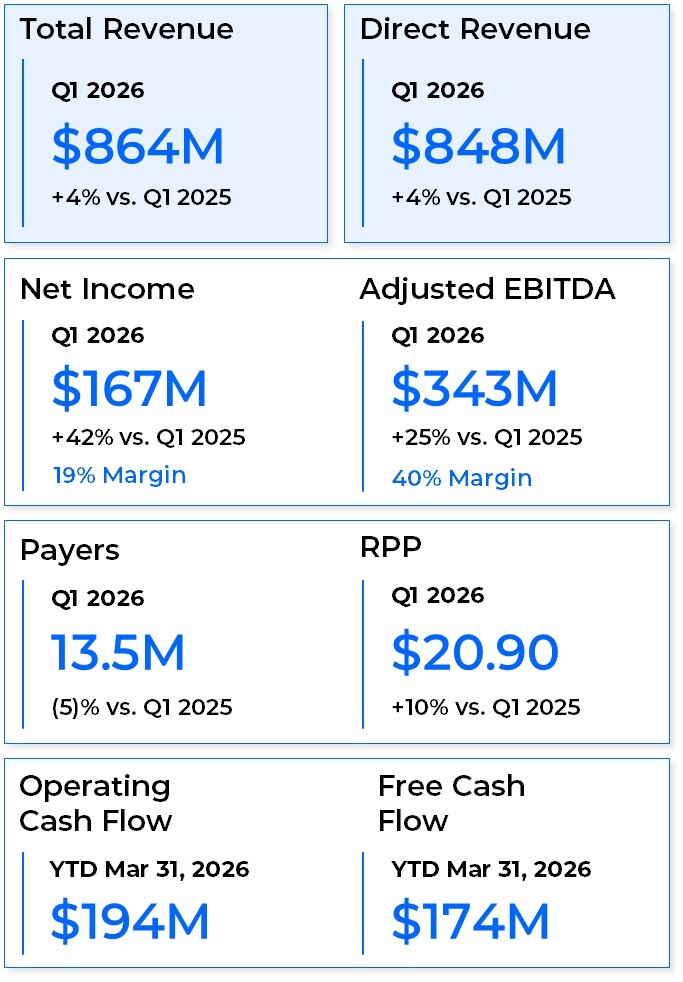
In Q1, Match Group’s Total Revenue was $864 million, up 4%, flat on a foreign exchange (“FX”)
neutral basis (“FXN”). FX was $3 million better than expected at the time of our last earnings call.
Payers declined 5% to 13.5 million, while RPP increased 10% to $20.90. Indirect revenue of $16
million was down 14%, largely driven by a decrease in spend from top advertisers as compared to a
record quarter the prior year. In Q1, Match Group’s Adjusted EBITDA was $343 million, up 25%,
representing an Adjusted EBITDA Margin of 40%. Canada’s rescission of its digital service tax
positively impacted Adjusted EBITDA by $11 million in the quarter.
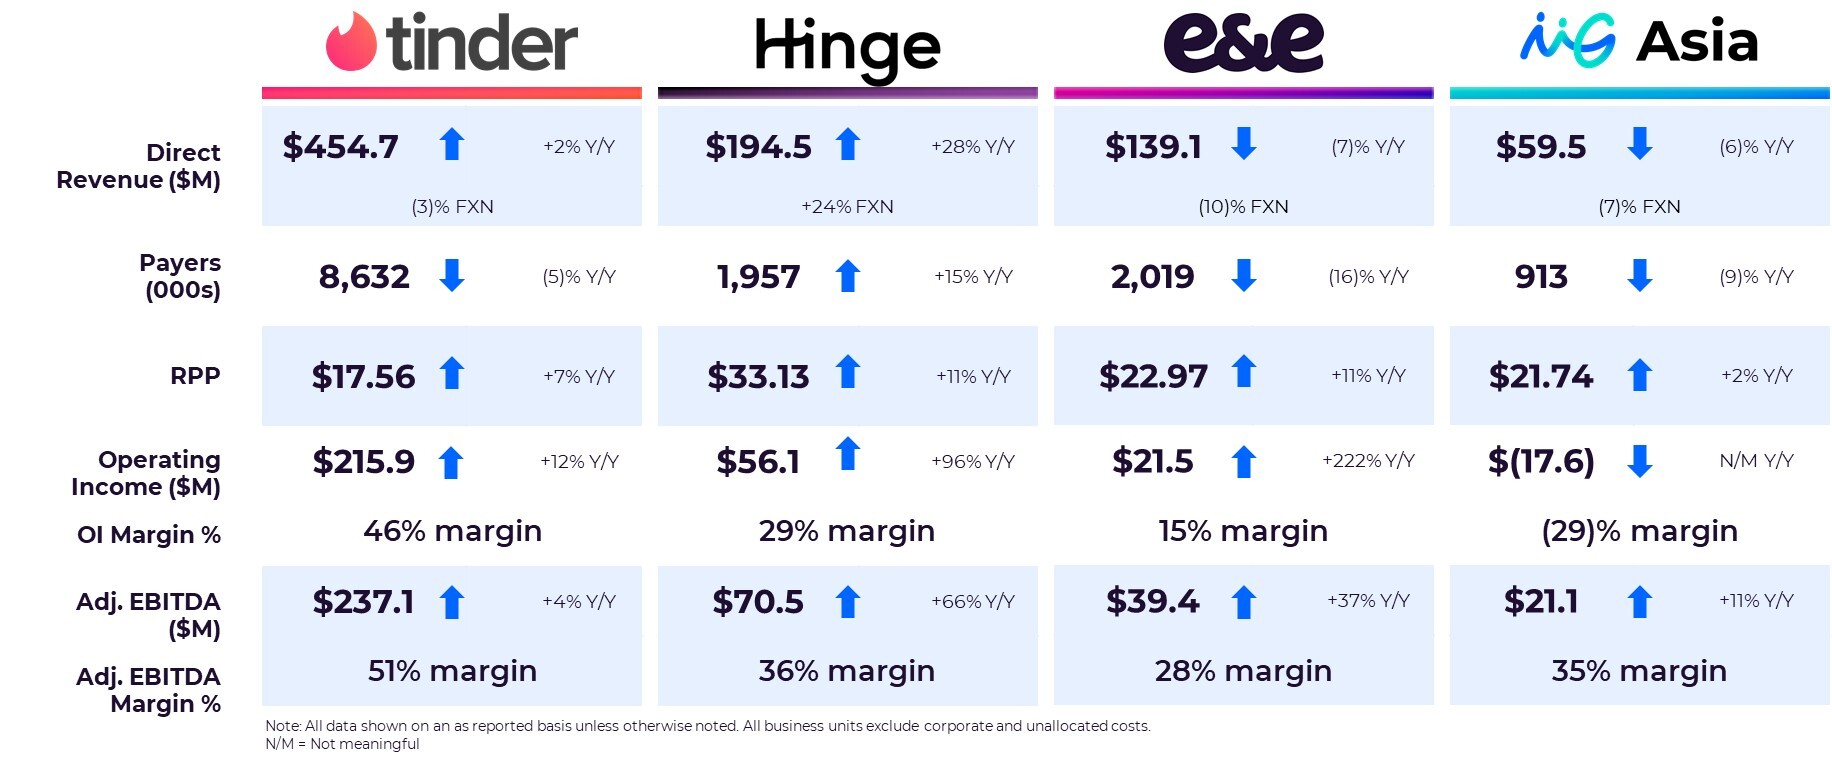
•Tinder Direct Revenue in Q1 was $455 million, up 2% and down 3% FXN. Q1 Direct Revenue
includes an approximately $5 million negative impact from user experience testing in the
quarter. Payers declined 5% Y/Y to 8.6 million, a marked improvement from the 8% Y/Y
decline in Q4 2025. RPP increased 7% to $17.56. Adjusted EBITDA in the quarter was $237
million, up 4%, representing an Adjusted EBITDA margin of 51%.
•Hinge maintained momentum in Q1 with Direct Revenue of $194 million, up 28% and up 24%
FXN. Payers increased 15% Y/Y to 2.0 million, and RPP increased 11% to $33.13. Adjusted
EBITDA was $71 million, up 66% Y/Y, representing an Adjusted EBITDA Margin of 36%.
•E&E Direct Revenue in Q1 was $139 million, down 7% and down 10% FXN. Payers
decreased 16% to 2.0 million, while RPP increased 11% to $22.97. Adjusted EBITDA was $39
million, up 37%, representing an Adjusted EBITDA Margin of 28%.
9
•MG Asia delivered Direct Revenue in Q1 of $60 million, down 6% and down 7% FXN. Azar
Direct Revenue was down 6% and down 9% FXN. Azar Direct Revenue was negatively
impacted by an estimated $3 million from its temporary removal from the App Store. Pairs
Direct Revenue was down 6% and down 4% FXN. Across MG Asia, Payers declined 9% to
approximately 900 thousand, while RPP increased 2% to $21.74. Adjusted EBITDA was $21
million, up 11%, representing an Adjusted EBITDA Margin of 35%.
As a result of the organizational changes associated with MG Asia that Spencer discussed, beginning
with our Q2 2026 results, we will combine the MG Asia and E&E business units into a single operating
segment called E&E and report Match Group results across three operating segments: Tinder, Hinge
and E&E.
Consolidated Operating Costs and Expenses
Including stock-based compensation (“SBC”) expense, total expenses in Q1 were down 5%.
•Cost of revenue decreased 11% and represented 24% of Total Revenue, down four points as
a percentage of Total Revenue, primarily driven by alternative payment savings.
•Selling and marketing costs increased $6 million, or 4%, but remained flat at 19% of Total
Revenue, as a result of increased marketing spend at Tinder and Hinge partially offset by
reduced marketing spend at E&E and MG Asia.
•General and administrative costs decreased 20%, down three points as a percentage of
Total Revenue to 10%, driven by the Canadian digital services tax reversal of $11 million, and
lower employee compensation, including SBC.
•Product development costs decreased 3%, down one point as a percentage of Total
Revenue, at 14%.
•Depreciation and amortization increased by $16 million to $48 million due to impairments of
intangible assets at Azar totaling $25 million, resulting from changes required to reinstate the
app in the Apple App Store.
3 Leverage is calculated utilizing the non-GAAP measure Adjusted EBITDA as the denominator. For a reconciliation of the non-GAAP
measure for each period presented, see page 12.
4 As defined on page 14.
5 Forward rate as of April 29, 2026.
10
Capital Allocation & Liquidity
Our trailing twelve-month gross leverage was 3.1x and net leverage3 was 2.3x at the end of Q1. We
ended the quarter with $1.0 billion of cash, cash equivalents, and short-term investments on hand,
and plan to use $424 million of cash to pay off the 2026 convertible notes on, or before, their maturity
in June.
Year-to-date through Q1, we delivered Operating Cash Flow of $194 million and Free Cash Flow
(“FCF”) of $174 million. We repurchased 2.0 million shares at an average price of $31 per share on a
trade date basis, for a total of $60 million, paid $44 million in dividends, and deployed $75 million of
cash towards net settlement of employee equity awards, equating to 103% of FCF. Between April 1
and April 30, 2026, we repurchased an additional 700 thousand shares at an average price of $32 per
share on a trade date basis, for a total of $22 million. As of April 30, 2026, we’ve reduced diluted
shares outstanding4 by 5% Y/Y. We also used $100 million in cash on hand to acquire a minority stake
in Sniffies, which we announced on April 27, 2026. Our capital allocation strategy, centered on
returning capital to shareholders through buybacks and a dividend, remains unchanged.
Financial Guidance
Q2 2026
We expect Q2 Total Revenue for Match Group of $850 million to $860 million, down 2% to flat Y/Y.
This range assumes a one point tailwind from FX5. FXN, we expect Total Revenue to be down 1% to
3% Y/Y. Q2 Total Revenue guidance assumes a $10 million negative impact from Tinder’s user
experience tests and a $20 million negative impact from lower Azar Direct Revenue.
We expect Match Group Adjusted EBITDA of $325 million to $330 million, representing a 13% Y/Y
increase, and an Adjusted EBITDA margin of 38% at the mid-points of the ranges, as we remain
financially disciplined and continue to optimize our cost structure while making the necessary
investments that we believe will drive long-term growth in the business.
Total Revenue | Adjusted EBITDA | |||
Q2 2026 | $850 to $860 million | $325 to $330 million |
11
Appendix
Reconciliations of GAAP to Non-GAAP Measures
Reconciliation of Net Income to Adjusted EBITDA
Three Months Ended March 31, 2026 | |||||||||||||
Tinder | Hinge | E&E | MG Asia | Corporate & unallocated costs | Eliminations | Total Match Group | |||||||
(Dollars in thousands) | |||||||||||||
Net income attributable to Match Group, Inc. shareholders | $166,837 | ||||||||||||
Add back: | |||||||||||||
Net income attributable to noncontrolling interests(a) | 8 | ||||||||||||
Income tax provision(a) | 33,686 | ||||||||||||
Other income, net(a) | (6,640) | ||||||||||||
Interest expense(a) | 42,525 | ||||||||||||
Operating income (loss)(b) | $215,924 | $56,112 | $21,496 | $(17,595) | $(39,521) | $— | $236,416 | ||||||
Stock-based compensation expense | 19,576 | 12,682 | 7,685 | 5,367 | 13,257 | — | 58,567 | ||||||
Depreciation | 1,552 | 1,723 | 6,573 | 3,195 | 1,089 | — | 14,132 | ||||||
Impairment and amortization of intangibles | — | — | 3,664 | 30,103 | — | — | 33,767 | ||||||
Adjusted EBITDA | $237,052 | $70,517 | $39,418 | $21,070 | $(25,175) | $— | $342,882 | ||||||
Revenue | $468,638 | $194,497 | $142,675 | $59,801 | $— | $(1,677) | $863,934 | ||||||
Net Income Margin | 19% | ||||||||||||
Operating Income (Loss) Margin(b) | 46% | 29% | 15% | (29)% | NA | NA | 27% | ||||||
Adjusted EBITDA Margin | 51% | 36% | 28% | 35% | NA | NA | 40% | ||||||
Three Months Ended March 31, 2025 | |||||||||||||
Tinder | Hinge | E&E | MG Asia | Corporate & unallocated costs | Eliminations | Total Match Group | |||||||
(Dollars in thousands) | |||||||||||||
Net income attributable to Match Group, Inc. shareholders | $117,570 | ||||||||||||
Add back: | |||||||||||||
Net income attributable to redeemable noncontrolling interestsa | 1 | ||||||||||||
Income tax provisiona | 22,382 | ||||||||||||
Other income, neta | (2,616) | ||||||||||||
Interest expensea | 35,256 | ||||||||||||
Operating income (loss)(b) | $193,348 | $28,625 | $6,678 | $3,447 | $(59,505) | $— | $172,593 | ||||||
Stock-based compensation expense | 25,315 | 13,232 | 12,227 | 4,834 | 14,786 | — | 70,394 | ||||||
Depreciation | 9,805 | 718 | 6,317 | 3,674 | 1,215 | — | 21,729 | ||||||
Amortization of intangibles | — | — | 3,453 | 7,025 | — | — | 10,478 | ||||||
Adjusted EBITDA | $228,468 | $42,575 | $28,675 | $18,980 | $(43,504) | $— | $275,194 | ||||||
Revenue | $463,416 | $152,243 | $152,429 | $63,823 | $— | $(733) | $831,178 | ||||||
Net Income Margin | 14% | ||||||||||||
Operating Income Margin(b) | 42% | 19% | 4% | 5% | NA | NA | 21% | ||||||
Adjusted EBITDA Margin | 49% | 28% | 19% | 30% | NA | NA | 33% | ||||||
______________________
(a) These items are not allocated to a segment.
(b) At a segment level, the closest GAAP measure is operating income as items outside operating income are not allocated to segments.
12
Reconciliation of Operating Cash Flow to Free Cash Flow
Three months ended March 31, 2026 | |
(In thousands) | |
Net cash provided by operating activities | $194,358 |
Capital expenditures | (20,384) |
Free Cash Flow | $173,974 |
Reconciliation of Net Income to Adjusted EBITDA used in Leverage Ratios
Twelve months ended March 31, 2026 | |
(In thousands) | |
Net income attributable to Match Group, Inc. shareholders | $662,713 |
Add back: | |
Net loss attributable to noncontrolling interests | 22 |
Income tax provision | 143,846 |
Other income, net | (25,049) |
Interest expense | 154,820 |
Stock-based compensation expense | 246,375 |
Depreciation | 59,515 |
Impairment and amortization of intangibles | 61,837 |
Adjusted EBITDA | $1,304,079 |
Reconciliation of Forecasted Net Income to Forecasted Adjusted EBITDA
Three Months Ended June 30, 2026 | |
(In millions) | |
Net income attributable to Match Group, Inc. shareholders | $160 to $165 |
Add back: | |
Income tax provision | 40 |
Other income, net | (6) |
Interest expense | 43 |
Stock-based compensation expense | 65 |
Depreciation and amortization of intangibles | 23 |
Adjusted EBITDA | $325 to $330 |
Revenue | $850 to $860 |
Net Income Margin (at the mid-point of the ranges) | 19% |
Adjusted EBITDA Margin (at the mid-point of the ranges) | 38% |
13
Reconciliation of GAAP Revenue to Non-GAAP Revenue, Excluding Foreign Exchange
Effects
Three Months Ended March 31, | |||||||
2026 | $ Change | % Change | 2025 | ||||
(Dollars in millions, rounding differences may occur) | |||||||
Total Revenue, as reported | $863.9 | $32.8 | 4% | $831.2 | |||
Foreign exchange effects | (31.6) | ||||||
Total Revenue, excluding foreign exchange effects | $832.3 | $1.1 | —% | $831.2 | |||
Direct Revenue, as reported | $847.9 | $35.4 | 4% | $812.4 | |||
Foreign exchange effects | (31.1) | ||||||
Direct Revenue, excluding foreign exchange effects | $816.7 | $4.3 | 1% | $812.4 | |||
Tinder Direct Revenue, as reported | $454.7 | $7.3 | 2% | $447.4 | |||
Foreign exchange effects | (20.5) | ||||||
Tinder Direct Revenue, excluding foreign exchange effects | $434.2 | $(13.2) | (3)% | $447.4 | |||
Hinge Direct Revenue, as reported | $194.5 | $42.3 | 28% | $152.2 | |||
Foreign exchange effects | (5.9) | ||||||
Hinge Direct Revenue, excluding foreign exchange effects | $188.6 | $36.3 | 24% | $152.2 | |||
E&E Direct Revenue, as reported | $139.1 | $(10.0) | (7)% | $149.2 | |||
Foreign exchange effects | (4.7) | ||||||
E&E Direct Revenue, excluding foreign exchange effects | $134.5 | $(14.7) | (10)% | $149.2 | |||
MG Asia Direct Revenue, as reported | $59.5 | $(4.1) | (6)% | $63.7 | |||
Foreign exchange effects | (0.1) | ||||||
MG Asia Direct Revenue, excluding foreign exchange effects | $59.5 | $(4.2) | (7)% | $63.7 | |||
Azar Direct Revenue | $34.2 | $(2.4) | (6)% | $36.5 | |||
Foreign exchange effects | (0.8) | ||||||
Azar Direct Revenue, excluding foreign exchange effects | $33.4 | $(3.1) | (9)% | $36.5 | |||
Pairs Direct Revenue, as reported | $25.4 | $(1.8) | (6)% | $27.1 | |||
Foreign exchange effects | 0.7 | ||||||
Pairs Direct Revenue, excluding foreign exchange effects | $26.1 | $(1.1) | (4)% | $27.1 | |||
14
Dilutive Securities
Match Group has various tranches of dilutive securities. The table below details these securities and their potentially dilutive
impact (shares in millions; rounding differences may occur).
Average Exercise Price | 4/30/2026 | ||
Share Price | $37.42 | ||
Absolute Shares | 233.3 | ||
Equity Awards | |||
Options | $18.79 | 0.1 | |
RSUs and subsidiary denominated equity awards | 9.0 | ||
Total Dilution - Equity Awards | 9.1 | ||
Outstanding Warrants | |||
Warrants expiring on September 15, 2026 (5.0 million outstanding) | $130.08 | — | |
Warrants expiring on April 15, 2030 (7.1 million outstanding) | $130.14 | — | |
Total Dilution - Outstanding Warrants | — | ||
Total Dilution | 9.1 | ||
% Dilution | 3.8% | ||
Total Diluted Shares Outstanding | 242.4 |
______________________
The dilutive securities presentation above is calculated using the methods and assumptions described below; these are
different from GAAP dilution, which is calculated based on the treasury stock method.
Options — The table above assumes the options are settled net of the option exercise price and employee withholding
taxes, as is our practice, and the dilutive effect is presented as the net shares that would be issued upon exercise.
Withholding taxes paid by the Company on behalf of the employees upon exercise is estimated to be $4.4 million, assuming
the stock price in the table above and a 50% estimated employee withholding tax rate.
RSUs and subsidiary denominated equity awards — The table above assumes RSUs are settled net of employee
withholding taxes, as is our practice, and the dilutive effect is presented as the net number of shares that would be issued
upon vesting. Withholding taxes paid by the Company on behalf of the employees upon vesting is estimated to be
$336.1 million, assuming the stock price in the table above and a 50% withholding rate.
All performance-based and market-based awards reflect the expected shares that will vest based on current performance or
market estimates. The table assumes no change in the fair value estimate of the subsidiary denominated equity awards from
the values used for GAAP purposes at March 31, 2026.
Exchangeable Senior Notes — The Company has two series of Exchangeable Senior Notes outstanding. In the event of an
exchange, each series of Exchangeable Senior Notes can be settled in cash, shares, or a combination of cash and shares.
At the time of each Exchangeable Senior Notes issuance, the Company purchased call options with a strike price equal to
the exchange price of each series of Exchangeable Senior Notes (“Note Hedge”), which can be used to offset the dilution of
each series of the Exchangeable Senior Notes. No dilution is reflected in the table above for any of the Exchangeable Senior
Notes because it is the Company’s intention to settle the Exchangeable Senior Notes with cash equal to the face amount of
the notes; any shares issued would be offset by shares received upon exercise of the Note Hedge.
Warrants — At the time of the issuance of each series of Exchangeable Senior Notes, the Company also sold warrants for
the number of shares with the strike prices reflected in the table above. The cash generated from the exercise of the
warrants is assumed to be used to repurchase Match Group shares and the resulting net dilution, if any, is reflected in the
table above.
15
Non-GAAP Financial Measures
Match Group reports Adjusted EBITDA, Adjusted EBITDA Margin, Free Cash Flow, and Revenue Excluding Foreign
Exchange Effects, all of which are supplemental measures to U.S. generally accepted accounting principles (“GAAP”). The
Adjusted EBITDA, Adjusted EBITDA Margin, and Free Cash Flow measures are among the primary metrics by which we
evaluate the performance of our business, on which our internal budget is based and by which management is
compensated. Revenue Excluding Foreign Exchange Effects provides a comparable framework for assessing the
performance of our business without the effect of exchange rate differences when compared to prior periods. We believe that
investors should have access to the same set of tools that we use in analyzing our results. These non-GAAP measures
should be considered in addition to results prepared in accordance with GAAP but should not be considered a substitute for
or superior to GAAP results. Match Group endeavors to compensate for the limitations of the non-GAAP measures
presented by providing the comparable GAAP measures and descriptions of the reconciling items, including quantifying such
items, to derive the non-GAAP measures. We encourage investors to examine the reconciling adjustments between the
GAAP and non-GAAP measures, which we describe below. Interim results are not necessarily indicative of the results that
may be expected for a full year.
Definitions of Non-GAAP Measures
Adjusted EBITDA is defined as net income attributable to Match Group, Inc. shareholders excluding: (1) net income
attributable to noncontrolling interests; (2) income tax provision or benefit; (3) other income (expense), net; (4) interest
expense; (5) depreciation; (6) acquisition-related items consisting of (i) amortization of intangible assets and impairments of
goodwill and intangible assets, if applicable and (ii) gains and losses recognized on changes in fair value of contingent
consideration arrangements, as applicable; and (7) stock-based compensation expense. We believe Adjusted EBITDA is
useful to analysts and investors as this measure allows a more meaningful comparison between our performance and that of
our competitors. Adjusted EBITDA has certain limitations because it excludes certain expenses. At a segment level, the
closest GAAP measure is operating income as items outside operating income are not allocated to segments.
Adjusted EBITDA Margin is defined as Adjusted EBITDA divided by revenues. We believe Adjusted EBITDA Margin is
useful for analysts and investors as this measure allows a more meaningful comparison between our performance and that
of our competitors. Adjusted EBITDA Margin has certain limitations in that it does not take into account the impact to our
consolidated statement of operations of certain expenses.
Free Cash Flow is defined as net cash provided by operating activities, less capital expenditures. We believe Free Cash
Flow is useful to investors because it represents the cash that our operating businesses generate, before taking into account
non-operational cash movements. Free Cash Flow has certain limitations in that it does not represent the total increase or
decrease in the cash balance for the period, nor does it represent the residual cash flow for discretionary expenditures.
Therefore, we think it is important to evaluate Free Cash Flow along with our consolidated statement of cash flows.
We look at Free Cash Flow as a measure of the strength and performance of our businesses, not for valuation purposes. In
our view, applying “multiples” to Free Cash Flow is inappropriate because it is subject to timing, seasonality and one-time
events. We manage our business for cash, and we think it is of utmost importance to maximize cash – but our primary
valuation metric is Adjusted EBITDA.
Revenue Excluding Foreign Exchange Effects is calculated by translating current period revenues using prior period
exchange rates. The percentage change in Revenue Excluding Foreign Exchange Effects is calculated by determining the
change in current period revenues over prior period revenues where current period revenues are translated using prior
period exchange rates. We believe the impact of foreign exchange rates on Match Group, due to its global reach, may be an
important factor in understanding period over period comparisons if movement in rates is significant. Since our results are
reported in U.S. dollars, international revenues are favorably impacted as the U.S. dollar weakens relative to other
currencies, and unfavorably impacted as the U.S. dollar strengthens relative to other currencies. We believe the presentation
of revenue excluding foreign exchange effects in addition to reported revenue helps improve the ability to understand Match
Group’s performance because it excludes the impact of foreign currency volatility that is not indicative of Match Group’s core
operating results.
16
Non-Cash Expenses That Are Excluded From Our Non-GAAP Measures
Stock-based compensation expense consists principally of expense associated with the grants of RSUs, performance-
based RSUs, and market-based awards. These expenses are not paid in cash, and we include the related shares in our fully
diluted shares outstanding using the treasury stock method; however, performance-based RSUs and market-based awards
are included only to the extent the applicable performance or market condition(s) have been met (assuming the end of the
reporting period is the end of the contingency period). To the extent stock-based awards are settled on a net basis, we remit
the required tax-withholding amounts from our current funds.
Depreciation is a non-cash expense relating to our property and equipment and is computed using the straight-line method
to allocate the cost of depreciable assets to operations over their estimated useful lives, or, in the case of leasehold
improvements, the lease term, if shorter.
Amortization of intangible assets and impairments of goodwill and intangible assets are non-cash expenses related
primarily to acquisitions. At the time of an acquisition, the identifiable definite-lived intangible assets of the acquired company,
such as customer lists, trade names and technology, are valued and amortized over their estimated lives. Value is also
assigned to (i) acquired indefinite-lived intangible assets, which consist of trade names and trademarks, and (ii) goodwill,
which are not subject to amortization. An impairment is recorded when the carrying value of an intangible asset or goodwill
exceeds its fair value. We believe that intangible assets represent costs incurred by the acquired company to build value
prior to acquisition and the related amortization and impairment charges of intangible assets or goodwill, if applicable, are not
ongoing costs of doing business.
Additional Definitions
Tinder consists of the world-wide activity of the brand Tinder®.
Hinge consists of the world-wide activity of the brand Hinge®.
Evergreen & Emerging (“E&E”) consists of the world-wide activity of our Evergreen brands, including Match®, Meetic®,
OkCupid®, Plenty Of Fish®, and a number of demographically focused brands and our Emerging brands including, BLK®,
ChispaTM, The League®, Upward®, YuzuTM, Salams®, HERTM, and other smaller brands.
Match Group Asia (“MG Asia”) consists of the world-wide activity of the brands Pairs® and Azar®.
Sparks the number of users engaging in six-way conversations on Tinder.
Sparks Coverage the percentage of our users who experience a Spark in a given period on Tinder.
Direct Revenue is revenue that is received directly from end users of our services and includes both subscription and à la
carte revenue.
Indirect Revenue is revenue that is not received directly from end users of our services, a majority of which is advertising
revenue.
Payers are unique users at a brand level in a given month from whom we earned Direct Revenue. When presented as a
quarter-to-date or year-to-date value, Payers represents the average of the monthly values for the respective period
presented. At a consolidated level and a business unit level to the extent a business unit consists of multiple brands,
duplicate Payers may exist when we earn revenue from the same individual at multiple brands in a given month, as we are
unable to identify unique individuals across brands in the Match Group portfolio.
Revenue Per Payer (“RPP”) is the average monthly revenue earned from a Payer and is Direct Revenue for a period
divided by the Payers in the period, further divided by the number of months in the period.
Monthly Active User (“MAU”) is a unique registered user at a brand level who has visited the brand’s app or, if applicable,
their website in the given month. For measurement periods that span multiple months, the average of each month is used. At
a consolidated level and a business unit level to the extent a business unit consists of multiple brands, duplicate users will
exist within MAU when the same individual visits multiple brands in a given month.
Leverage on a gross basis is calculated as principal debt balance divided by Adjusted EBITDA for the period referenced.
17
Leverage on a net basis is calculated as principal debt balance less cash and cash equivalents and short-term investments
divided by Adjusted EBITDA for the period referenced.
Safe Harbor Statement Under the Private Securities Litigation Reform Act of 1995
These prepared remarks and our conference call, which will be held at 5:00 p.m. Eastern Time on May 5, 2026, may contain
“forward-looking statements” within the meaning of the Private Securities Litigation Reform Act of 1995. All statements that
are not historical facts are “forward looking statements.” The use of words such as “anticipates,” “estimates,” “expects,”
“plans,” “believes,” “will,” and “would,” among others, generally identify forward-looking statements. These forward-looking
statements include, among others, statements relating to: Match Group’s future financial performance, Match Group’s
business prospects and strategy, anticipated trends, and other similar matters. These forward-looking statements are based
on management’s current expectations and assumptions about future events, which are inherently subject to uncertainties,
risks and changes in circumstances that are difficult to predict. Actual results could differ materially from those contained in
these forward-looking statements for a variety of reasons, including, among others: failure to retain existing users or add new
users, or if users do not convert to paying users; competition; risks related to our restructuring and reorganization activities;
our ability to attract and retain users through cost-effective marketing efforts; our reliance on a variety of third-party platforms,
in particular, mobile app stores; our ability to realize reductions in in-app purchase fees; inappropriate actions by certain of
our users could be attributed to us or may not be adequately prevented by us; dependence on our key personnel; volatile
global economic conditions; operational and financial risks in connection with acquisitions; impairment charges related to our
intangible assets; operations in various international markets, including certain markets in which we have limited experience;
foreign currency exchange rate fluctuations; challenges in measuring our user metrics and other estimates; the limited
operating history of our newer brands and services makes it difficult to evaluate our current business and future prospects;
impacts of climate change; the integrity of our and third parties’ systems and infrastructure; cyberattacks on our systems and
infrastructure and cyberattacks experienced by third parties; our ability to access, collect, and use personal data about our
users; breaches or unauthorized access of personal and confidential or sensitive user information that we maintain and
store; challenges with properly managing the use of artificial intelligence; risks related to credit card payments; risks related
to our use of “open source” software; complex and evolving U.S., foreign, and international laws and regulations; our ability
to protect our intellectual property rights or accusations that we infringe upon the intellectual property rights of others;
adverse outcomes in litigation; risks related to our taxation in multiple jurisdictions; risks related to our indebtedness; and
risks relating to ownership of our common stock. Certain of these and other risks and uncertainties are discussed in Match
Group’s filings with the Securities and Exchange Commission. Other unknown or unpredictable factors that could also
adversely affect Match Group’s business, financial condition and results of operations may arise from time to time. In light of
these risks and uncertainties, these forward-looking statements may not prove to be accurate. Accordingly, you should not
place undue reliance on these forward-looking statements, which only reflect the views of Match Group management as of
the date of these prepared remarks. Match Group does not undertake to update these forward-looking statements.