Exhibit 99.1


LOGO

Ouster Announces Results for First Quarter 2026

Record product revenue, achieving 13th straight quarter of growth

Lidar and camera shipments of more than 12,600 units

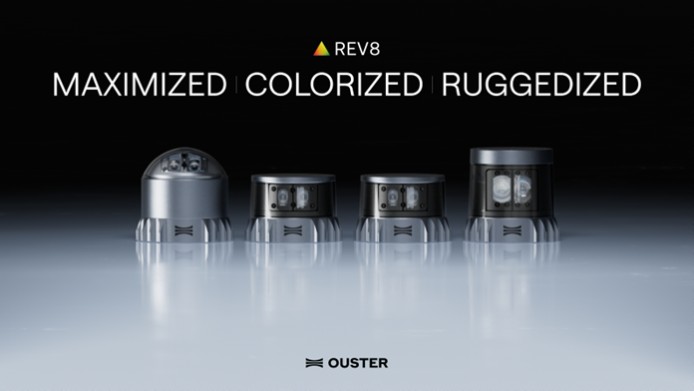
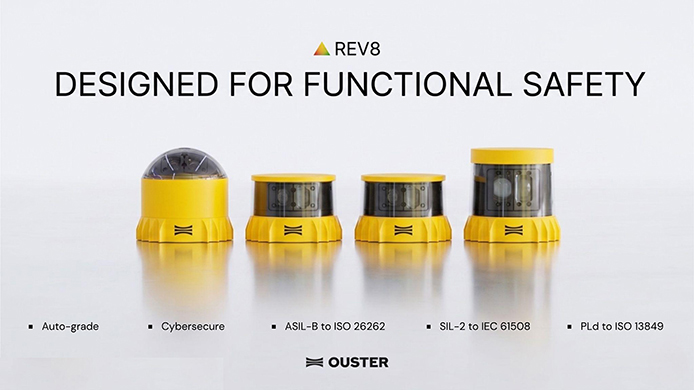
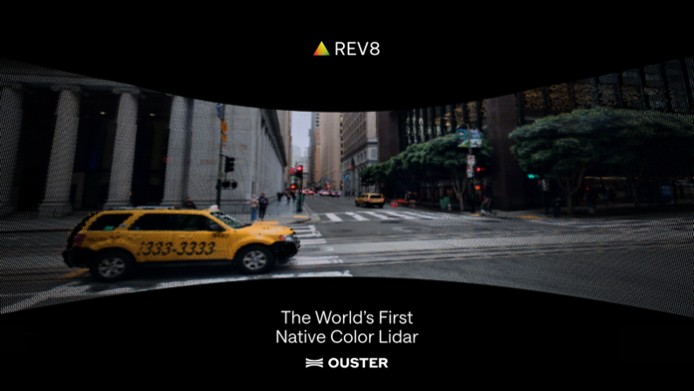
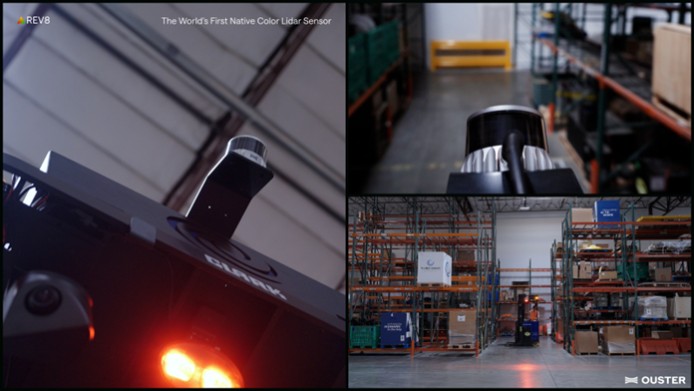
New Rev8 OS digital lidar with native color sensing, 2x range and resolution, and functional safety

SAN FRANCISCO, CA – [May 5, 2026 at 4:05 PM ET] – Ouster, Inc. (Nasdaq: OUST) (“Ouster” or the “Company”), a leader in sensing and perception for Physical AI, announced today financial results for the three months ended March 31, 2026.

“Our first quarter demonstrated strong execution across our portfolio, delivering record product revenue and validating the growing demand for our solutions across key markets. We won new million-dollar contracts for Ouster BlueCity and secured several million-dollar deals to power industrial automation. Stereolabs has already proven to be a perfect complement, and the rapid integration and commercial success of our expanded camera vision portfolio was a tailwind during the quarter, with strong demand from companies building foundational AI models and advanced robotics platforms,” said Ouster CEO Angus Pacala.

“We are continuing the momentum of our unified sensing and perception platform with the introduction of our revolutionary Rev8 OS family, powered by our next-generation L4 Ouster Silicon. This launch represents a paradigm shift in AI perception as Rev8 sets a new standard for sensing, featuring the world’s first native-color lidar sensors with industry-leading resolution, range, and reliability designed for functional safety, affordability, and scale. By combining native color and perception across our entire product portfolio, we have solidified Ouster’s role as the foundational sensing and perception platform for Physical AI as we provide unified products and solutions that accelerate customer innovation and unlock new applications that sense, think, act, and learn in the physical world.”

First Quarter 2026 Highlights:


$49 million in revenue, up 49% year over year and down 22% sequentially. Total revenue of $62 million in the fourth quarter of 2025 included royalties of approximately $21 million, primarily one-time and related to long-term IP license contracts.


Product revenue was $48 million, up 55% year over year and 18% sequentially.


Shipped more than 12,600 lidar and camera sensors for revenue, of which lidar was approximately 65% of the total.


GAAP gross margin of 43%, up 200 bps year over year and down 1,700 bps sequentially.


GAAP net loss of $17 million, an improvement of $5 million year over year and down $21 million sequentially.


Non-GAAP gross margin1 of 46%, flat year over year and down 1,600 bps sequentially.


Adjusted EBITDA1 loss of $7 million, up $1 million year over year and down $20 million sequentially.


Cash, cash equivalents, restricted cash, and short-term investments of $175 million as of March 31, 2026.

 
1 

Adjusted EBITDA and non-GAAP gross margin are non-GAAP financial measures. See Non-GAAP Financial Measures for additional information and reconciliations of these measures to their respective most directly comparable financial measures calculated in accordance with U.S. GAAP.


Revenue

Ouster delivered first quarter revenue of $49 million, an increase of 49% year over year and a decrease of 22% sequentially. Product revenue was $48 million, up 55% year over year and 18% sequentially primarily driven by customers in the smart infrastructure and industrial verticals, for use cases in warehouse automation, yard logistics, and intelligent transportation. The Company shipped over 12,600 sensors, of which lidar was approximately 65% of the total.

Gross Margin

GAAP gross margin was 43%, compared with 41% in the first quarter of 2025 and 60% in the fourth quarter of 2025. Volume growth and operating efficiencies lifted profitability year over year. Non-GAAP gross margin was 46%, compared with 46% in the first quarter of 2025 and 62% in the fourth quarter of 2025. Non-GAAP gross margin excludes the impact of stock-based compensation expenses, and certain other items outside of ordinary operations.

Second Quarter 2026 Outlook:

For the second quarter of 2026, Ouster expects to achieve $49.5 million to $52.5 million in total revenue. This includes a full quarter of Stereolabs operations.

Upcoming Investor Events

Ouster management will participate in the following upcoming investor events:


Craig-Hallum Annual Institutional Investor Conference – May 28, 2026 in Minneapolis


Rosenblatt Securities 6th Annual Age of AI Scaling Summit – June 9, 2026 (virtual)


TD Cowen Inaugural Disruptive Technology Summit – June 17, 2026 in New York City

Conference Call Information

Ouster will host a conference call and live webcast for analysts and investors at 5:00 p.m. ET today, May 5, 2026 to discuss its financial results and business outlook. Interested parties may listen to a live webcast of the conference call. Registration for the webcast can be completed by visiting the following website: https://edge.media-server.com/mmc/p/pt46y4as. The webcast will be available for replay for at least 30 days after the conference call on Ouster’s investor website at https://investors.ouster.com/.

About Ouster

Ouster (Nasdaq: OUST) is a leader in sensing and perception for Physical AI across industrial, robotics, automotive, and smart infrastructure. With a unified platform of high-performance digital lidar, cameras, AI compute, sensor fusion and perception software, and AI models, Ouster delivers solutions that improve quality of life in the physical world. Headquartered in San Francisco, CA, Ouster has a global presence serving thousands of customers with offices in the Americas, Europe, and Asia-Pacific. For more information about our products, visit www.ouster.com, contact our sales team, or connect with us on X or LinkedIn.


Forward-Looking Statements

This press release contains forward-looking statements within the meaning of the Private Securities Litigation Reform Act of 1995. The Company intends such forward-looking statements to be covered by the safe harbor provisions for forward-looking statements contained in Section 27A of the Securities Act of 1933, as amended and Section 21E of the Securities Exchange Act of 1934, as amended. Such statements are based upon current plans, estimates and expectations of management that are subject to various risks and uncertainties that could cause actual results to differ materially from such statements. The inclusion of forward-looking statements should not be regarded as a representation that such plans, estimates and expectations will be achieved. Words such as “anticipate,” “expect,” “project,” “intend,” “believe,” “may,” “will,” “should,” “plan,” “could,” “continue,” “target,” “contemplate,” “estimate,” “forecast,” “guidance,” “predict,” “possible,” “potential,” “pursue,” “likely,” and the negative of these terms and similar expressions are intended to identify forward-looking statements, though not all forward-looking statements use these words or expressions. All statements, other than statements of historical fact, including statements regarding our future financial results and financial condition, our strategy, our market positioning, development of and demand for our products, the impact of our recent acquisition of Stereolabs, and future investor conference attendance, constitute forward-looking statements. All forward-looking statements are subject to risks and uncertainties that may cause actual results to differ materially from those that we expected, including, but not limited to, risks related to Ouster’s limited operating history and history of losses; the substantial research and development costs needed to develop and commercialize new products; Ouster’s limited sales history and the ability to maintain confidence in the Company’s long-term business prospect among customers in target markets; fluctuations in its operating results; its ability to maintain competitive average selling prices, high sales volumes and reduce product costs; competition in Ouster’s industry; the negotiating power and product standards of its customers; the adoption of its products and the growth of the lidar market generally; product quality and liability risks; Ouster’s future capital needs and ability to secure additional capital on favorable terms or at all; market acceptance of lidar and Ouster’s forecasts for market growth; Ouster’s ability to manage growth, including growing the sales and marketing organization; risks related to international operations, including international manufacturing; cancellation or postponement of contracts or unsuccessful implementations; the Company’s ability to manage its inventory; credit risk of customers; Ouster’s ability to use tax attributes; Ouster’s dependence on key third party suppliers, in particular Benchmark Electronics, Inc., Fabrinet, and other suppliers; supply chain constraints and challenges; conditions in the industries the Company targets or the global economy; Ouster’s ability to recruit and retain key personnel; its ability to complete, successfully integrate or achieve the anticipated benefits of new acquisitions or investments, including the Stereolabs acquisition; changes to trade policy, tariffs, and import/export regulations may have a material adverse effect on Ouster’s business, financial condition and results of operations; risks related to the use of AI tools by us and others; Ouster’s ability to adequately protect and enforce its intellectual property rights; legal and regulatory risks; risks related to operating as a public company; and other important factors discussed in the Company’s Annual Report on Form 10-K for the year ended December 31, 2025, and updated by the Company’s Quarterly Report on Form 10-Q for the quarterly period ended March 31, 2026, once filed, and as may be further updated from time to time in the Company’s other filings with the SEC. Readers are urged to consider these factors carefully and in the totality of the circumstances when evaluating these forward-looking statements, and not to place undue reliance on any of them. Any such forward-looking statements represent management’s reasonable estimates and beliefs as of the date of this press release. While Ouster may elect to update such forward-looking statements at some point in the future, it disclaims any obligation to do so, other than as may be required by law, even if subsequent events cause its views to change.

In addition, see information below concerning non-GAAP financial measures.


Non-GAAP Financial Measures

In addition to its results determined in accordance with generally accepted accounting principles in the United States (“GAAP”), Ouster believes the non-GAAP measures of Non-GAAP Gross Profit, Non-GAAP Gross Margin and Adjusted EBITDA are useful in evaluating its operating performance. Ouster calculates Non-GAAP Gross Profit as gross profit (loss) excluding amortization of acquired intangibles, acquisition and integration-related charges, and stock-based compensation expense. Non-GAAP Gross Margin is calculated as Non-GAAP Gross Profit divided by revenues. Adjusted EBITDA is calculated as net loss excluding interest expense (income), net, other (income) expense, net, stock-based compensation expense, provision for (benefit from) income taxes, amortization of acquired intangibles, depreciation expenses, acquisition and integration-related charges, certain litigation expenses, gain on lease termination and other items. Ouster believes that Non-GAAP Gross Profit, Non-GAAP Gross Margin, and Adjusted EBITDA may be helpful to investors because it provides consistency and comparability with past financial performance and may be helpful in comparison with other companies, some of which use similar non-GAAP information to supplement their GAAP results. Adjusted EBITDA is also used by the Board and management as a performance metric for compensation purposes. The non-GAAP financial information is presented for supplemental informational purposes only and should not be considered a substitute for financial information presented in accordance with GAAP, and may be different from similarly titled non-GAAP measures used by other companies. Reconciliation tables of the most comparable GAAP financial measures to the non-GAAP financial measures are included at the end of this press release.


OUSTER, INC.

CONDENSED CONSOLIDATED BALANCE SHEETS

(unaudited)

(in thousands)


     March 31,
2026
    December 31,
2025
 

Assets


Current assets:


Cash and cash equivalents

   $ 78,720     $ 67,413  

Restricted cash, current

     647       1,467  

Short-term investments

     94,398       141,172  

Accounts receivable, net

     26,195       27,753  

Inventory

     29,878       23,566  

Prepaid expenses and other current assets

     21,169       17,517  


Total current assets

     251,007       278,888  

Property and equipment, net

     33,826       31,891  

Operating lease, right-of-use assets

     13,865       13,452  

Goodwill

     38,525       —   

Unbilled receivable, non-current portion

     5,240       8,560  

Intangible assets, net

     35,007       13,316  

Restricted cash, non-current

     1,100       1,100  

Other non-current assets

     2,942       2,309  


Total assets

   $ 381,512     $ 349,516  


Liabilities and stockholders’ equity


Current liabilities:


Accounts payable

   $ 17,403     $ 19,984  

Accrued and other current liabilities

     38,193       26,200  

Contract liabilities, current

     24,159       20,705  

Operating lease liability, current portion

     4,561       4,142  


Total current liabilities

     84,316       71,031  

Operating lease liability, non-current portion

     12,824       12,938  

Contract liabilities, non-current portion

     2,951       3,106  

Deferred tax liability

     5,147       —   

Other non-current liabilities

     653       703  


Total liabilities

     105,891       87,778  


Commitments and contingencies


Stockholders’ equity:


Common stock

     48       48  

Additional paid-in capital

     1,267,048       1,235,580  

Accumulated deficit

     (990,913     (973,448

Accumulated other comprehensive (loss) income

     (562     (442


Total stockholders’ equity

     275,621       261,738  


Total liabilities and stockholders’ equity

   $ 381,512     $ 349,516  


OUSTER, INC.

CONDENSED CONSOLIDATED STATEMENTS OF OPERATIONS AND COMPREHENSIVE LOSS

(unaudited)

(in thousands, except share and per share data)


     Three Months Ended March 31,     Three Months
Ended
December 31,
 
     2026     2025     2025  

Revenue:


Product revenue

   $ 48,231     $ 31,105     $ 40,971  

Royalties

     347       1,527       21,207  


Total revenue

     48,578       32,632       62,178  


Cost of revenue

     27,740       19,149       24,726  

Gross profit

     20,838       13,483       37,452  

Operating expenses:


Research and development

     16,082       14,985       15,261  

Sales and marketing

     7,840       6,423       6,782  

General and administrative

     16,128       15,905       14,505  


Total operating expenses

     40,050       37,313       36,548  


Income (loss) from operations

     (19,212     (23,830     904  

Other income (expense):


Interest income

     2,474       1,705       2,746  

Other income (expense), net

     (175     303       749  


Total other income, net

     2,299       2,008       3,495  


Income (loss) before income taxes

     (16,913     (21,822     4,399  

Provision for income tax expense

     552       195       414  


Net income (loss)

   $ (17,465   $ (22,017   $ 3,985  


Other comprehensive income (loss)


Changes in unrealized gain (loss) on available for sale securities

   $ (120   $ 46     $ (2

Foreign currency translation adjustments

           80       42  


Total comprehensive income (loss)

   $ (17,585   $ (21,891   $ 4,025  


Net income (loss) per common share:


Basic

   $ (0.28   $ (0.42   $ 0.07  


Diluted

   $ (0.28   $ (0.42   $ 0.06  


Weighted-average shares used to compute basic and diluted net income (loss) per share


Basic

     61,824,843       52,488,199       60,468,355  

Diluted

     61,824,843       52,488,199       64,733,573  


OUSTER, INC.

CONDENSED CONSOLIDATED STATEMENTS OF CASH FLOWS

(unaudited)

(in thousands)


     Three Months Ended March 31,  
     2026     2025  

CASH FLOWS FROM OPERATING ACTIVITIES


Net loss

   $ (17,465   $ (22,017

Adjustments to reconcile net loss to net cash used in operating activities:


Depreciation and amortization

     2,703       1,795  

Loss on write-off and disposal of property and equipment

     —        16  

Gain on lease termination

     —        (65

Stock-based compensation

     7,494       8,498  

Deferred taxes

     (360     —   

Reduction of revenue related to stock warrant issued to customer

     1,101       397  

Amortization of right-of-use asset

     820       1,245  

Accretion on short-term investments

     (454     (822

Change in fair value of warrant liabilities

     —        (112

(Recovery) provision for inventory write-down

     (488     261  

Recovery of doubtful accounts

     —        (16

Realized gain on sale of available for sale securities

     (9     —   

Changes in operating assets and liabilities, net of effects of business acquisition:


Accounts receivable

     6,472       4,137  

Inventory

     (3,665     1,051  

Prepaid expenses and other assets

     (153     (3,883

Accounts payable

     (3,536     4,120  

Accrued and other liabilities

     134       8,691  

Contract liabilities

     1,020       (6,515

Operating lease liability

     (895     (1,660


Net cash used in operating activities

     (7,281     (4,879


CASH FLOWS FROM INVESTING ACTIVITIES


Purchases of property and equipment

     (2,561     (552

Purchase of short-term investments

     (10,802     (13,858

Proceeds from sales and maturities of short-term investments

     57,919       27,000  

Acquisition of Stereolabs, net of cash acquired

     (27,493     —   


Net cash provided by investing activities

     17,063       12,590  


CASH FLOWS FROM FINANCING ACTIVITIES


Proceeds from exercise of stock options

     94       28  

Payments received to fund employees tax obligation for vested RSUs

     611       632  


Net cash provided by financing activities

     705       660  


Effect of exchange rates on cash and cash equivalents

     —        80  


Net increase in cash, cash equivalents and restricted cash

     10,487       8,451  

Cash, cash equivalents and restricted cash at beginning of period

     69,980       48,099  


Cash, cash equivalents and restricted cash at end of period

   $ 80,467     $ 56,550  


OUSTER, INC.

RECONCILIATION OF GAAP TO NON-GAAP FINANCIAL MEASURES

(unaudited)

(in thousands)


     Three Months Ended
March 31,
    Three Months Ended
December 31,
 
     2026     2025     2025  

GAAP net income (loss)

   $ (17,465   $ (22,017   $ 3,985  

Interest income, net

     (2,474     (1,705     (2,746

Other income, net

     175       (303     (749

Stock-based compensation expense(1)

     7,494       8,498       7,271  

Provision for income tax expense

     552       195       414  

Amortization of acquired intangibles(2)

     1,709       1,120       1,134  

Depreciation expense(2)

     994       675       941  

Acquisition and integration-related charges(4)

     2,252       —        2,537  

Litigation (recovery) expenses(3)

     (119     5,793       358  

Gain on lease termination

     —        (65     —   


Adjusted EBITDA

   $ (6,882   $ (7,809   $ 13,145  


(1) 

Includes stock-based compensation expense as follows:


     Three Months
Ended March 31,
     Three Months
Ended
December 31,
 
     2026      2025      2025  

Cost of revenue

   $ 826      $ 1,137      $ 901  

Research and development

     2,616        4,305        2,829  

Sales and marketing

     766        1,106        854  

General and administrative

     3,286        1,950        2,687  


Total stock-based compensation

   $ 7,494      $ 8,498      $ 7,271  


(2) 

Includes depreciation and amortization expense as follows:


     Three Months
Ended March 31,
     Three Months Ended
December 31,
 
     2026      2025      2025  

Cost of revenue

   $ 1,311      $ 924      $ 1,027  

Research and development

     880        642        808  

Sales and marketing

     316        172        163  

General and administrative

     196        57        77  


Total depreciation and amortization expense

   $ 2,703      $ 1,795      $ 2,075  


(3) 

Represents litigation costs consisting primarily of legal fees and the estimated and actual costs to resolve the outstanding litigation cases offset by the estimated amounts recoverable and recovered under insurance, indemnity and contribution agreements for such costs.

(4) 

Includes legal and accounting fees and transition related services and are not considered normal, recurring, cash operating expenses necessary to operate the Company’s business.


     Three Months Ended
March 31,
    Three Months Ended
December 31,
 
     2026     2025     2025  

Gross profit on GAAP basis

   $ 20,838     $ 13,483     $ 37,452  

Stock-based compensation

     826       1,137       901  

Amortization of acquired intangible assets

     862       457       467  


Gross profit on non-GAAP basis

   $ 22,526     $ 15,077     $ 38,820  


Gross margin on GAAP basis

     43     41     60

Gross margin on non-GAAP basis

     46     46     62

Contacts

For Investors

investors@ouster.io

For Media

press@ouster.io


LOGO

Caption 1: New Rev8 OS digital lidar with native color sensing, 2x range and resolution.


LOGO

Caption 2: Ouster Rev8 OS Family: auto-grade, cybersecure, and designed for ASIL-B, SIL-2, and PLd functional safety certifications.


LOGO

Caption 3: Native color point cloud, captured by Ouster Rev8 OS1 Max in San Francisco, CA.


LOGO

Caption 4: Ouster’s native color Rev8 OS1, designed for functional safety and reliability.


LOGO

Caption 5: Stereolabs ZED X Nano, a wrist-mount stereo camera built for robotic manipulation and Physical AI.