
Exhibit 99.1
For Presentation on May 6, 2026 Jackson Financial Inc. First Quarter 2026 Financial Results
Forward - Looking Statements and Non - GAAP Measures The information in this document contains forward - looking statements about future events and circumstances and their effects upo n revenues, expenses and business opportunities. Generally speaking, any statement in this document not based upon historical fact is a forward - looking statement. Forward - lookin g statements can also be identified by the use of forward - looking or conditional words, such as “could,” “should,” “can,” “continue,” “estimate,” “forecast,” “intend,” “look,” “m ay,” “expect,” “believe,” “anticipate,” “plan,” “predict,” “remain,” “future,” “confident,” and “commit” or similar expressions. In particular, statements regarding plans, strategies, pro spects, targets and expectations regarding the business and industry are forward - looking statements. They reflect expectations, are not guarantees of performance and speak only as of t he dates the statements are made. We caution investors that these forward - looking statements are subject to known and unknown risks and uncertainties that may cause actual r esults to differ materially from those projected, expressed, or implied. Other factors that could cause actual results to differ materially from those in the forward - looking stat ements include those reflected in Part I, Item 1A, Risk Factors and Part II, Item 7, Management’s Discussion and Analysis of Financial Condition and Results of Operations in the For m 1 0 - K for the year ended December 31, 2025, as filed with the U.S. Securities and Exchange Commission (the “SEC”) on February 24, 2026, and elsewhere in Jackson Financial Inc.’s fil ings filed with the SEC. Except as required by law, Jackson Financial Inc. does not undertake to update such forward - looking statements. You should not rely unduly on forward - looki ng statements. Certain financial data included in this document consists of non - GAAP (“Generally Accepted Accounting Principles”) financial mea sures. These non - GAAP financial measures may not be comparable to similarly titled measures presented by other entities, nor should they be construed as an alternative to other fin ancial measures determined in accordance with U.S. GAAP. Although the Company believes these non - GAAP financial measures provide useful information to investors in measuring the f inancial performance and condition of its business, investors are cautioned not to place undue reliance on any non - GAAP financial measures and ratios included in this document. A r econciliation of the non - GAAP financial measures to the most directly comparable U.S. GAAP financial measures can be found under “Non - GAAP Financial Measures” in the Appendix of th is document. Certain financial data included in this document consists of statutory accounting principles (“statutory”) financial measures , i ncluding “total adjusted capital.” These statutory financial measures are included in or derived from the Jackson National Life Insurance Company (“JNL”) annual and/or quarterly statemen ts filed with the Michigan Department of Insurance and Financial Services and are available in the investor relations section of the Company’s website at investors.jackson.com/ fin ancials/statutory - filings. We routinely use our investor relations website, at investors.jackson.com, as a primary channel for disclosing key informatio n t o our investors. We may use our website as a means of disclosing material, non - public information and for complying with our disclosure obligations. Accordingly, investors should mo nitor our investor relations website, in addition to following our press releases, filings with the SEC, public conference calls, presentations, and webcasts, some of which may c ont ain material and previously non - public information. We and certain of our senior executives may also use social media channels to communicate with our investors and the public abou t o ur Company and other matters, and those communications could be deemed to be material information. The information contained on, or that may be accessed through , our website, our social media channels, or our executives’ social media channels is not incorporated by reference into and is not part of this document. 2
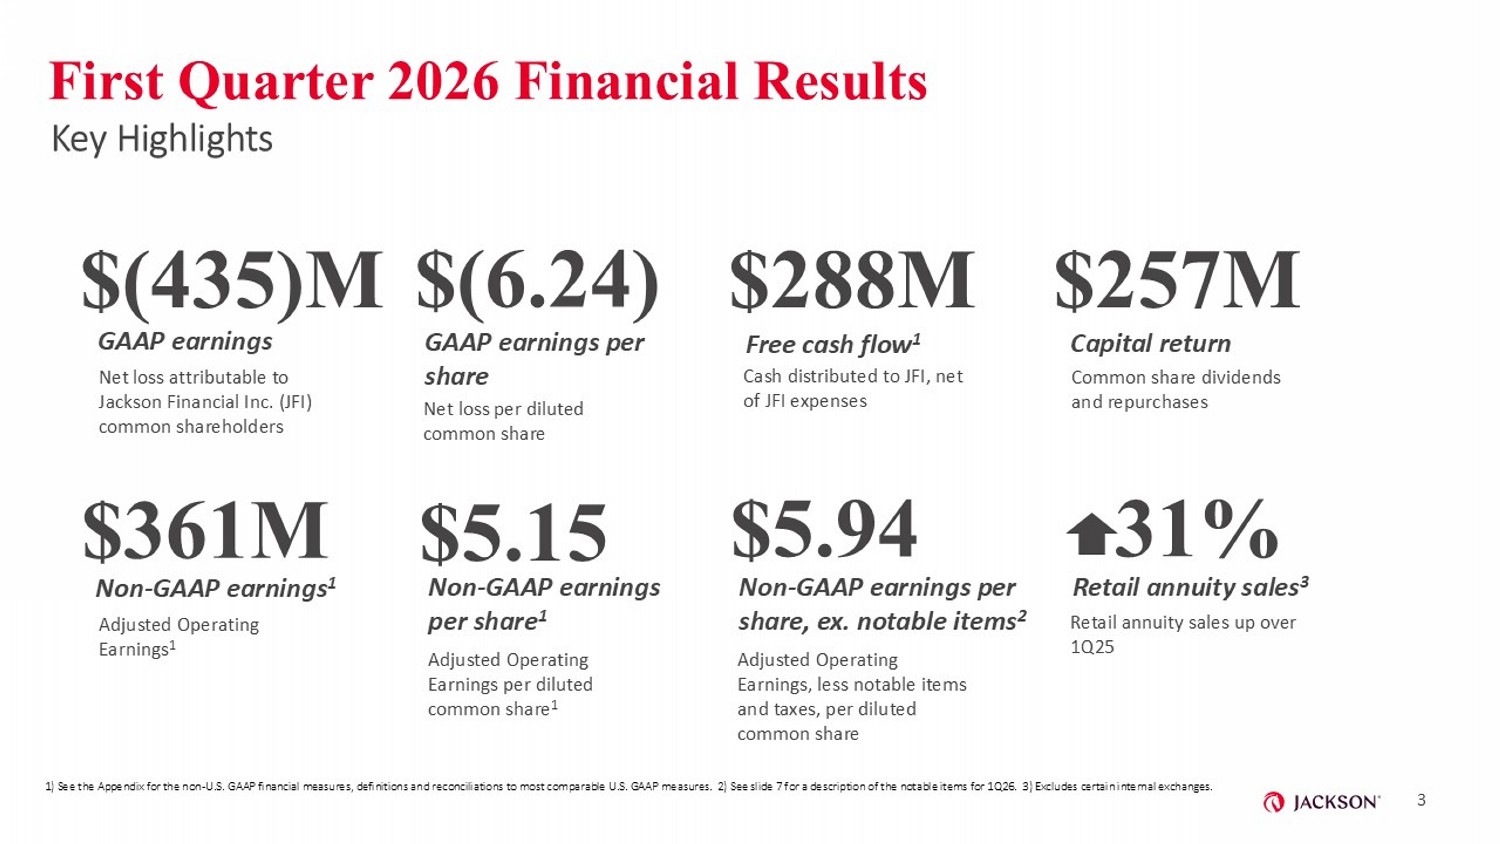
First Quarter 202 6 Financial Results Key Highlights $(435)M GAAP earnings $361M Non - GAAP earnings 1 $(6.24) GAAP earnings per share $5.15 Non - GAAP earnings per share 1 $288M Free cash flow 1 $257M Capital return 31% Retail annuity sales 3 Net loss attributable to Jackson Financial Inc. (JFI) common shareholders Net loss per diluted common share Cash distributed to JFI, net of JFI expenses Common share dividends and repurchases Adjusted Operating Earnings 1 Adjusted Operating Earnings per diluted common share 1 Retail annuity sales up over 1Q25 3 1) See the Appendix for the non - U.S. GAAP financial measures, definitions and reconciliations to most comparable U.S. GAAP measu res. 2) See slide 7 for a description of the notable items for 1Q26. 3) Excludes certain internal exchanges. $5.94 Non - GAAP earnings per share, ex. notable items 2 Adjusted Operating Earnings, less notable items and taxes, per diluted common share
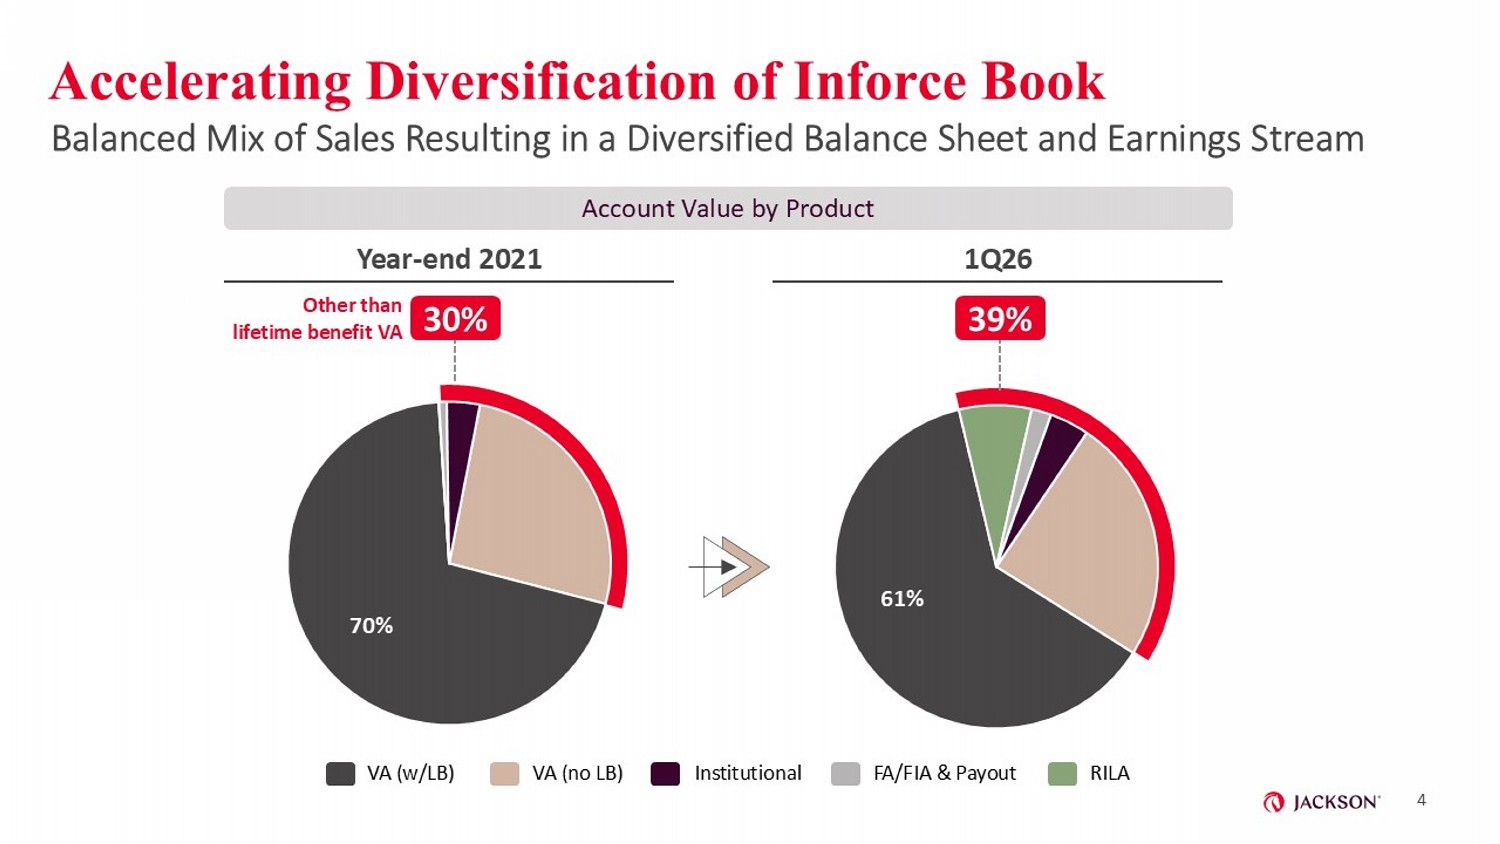
Accelerating Diversification of Inforce Book Balanced Mix of Sales Resulting in a Diversified Balance Sheet and Earnings Stream 4 1Q26 Year - end 2021 Other than lifetime benefit VA 30% 39% VA (w/LB) VA (no LB) Institutional FA/FIA & Payout RILA 70% 61% Account Value by Product
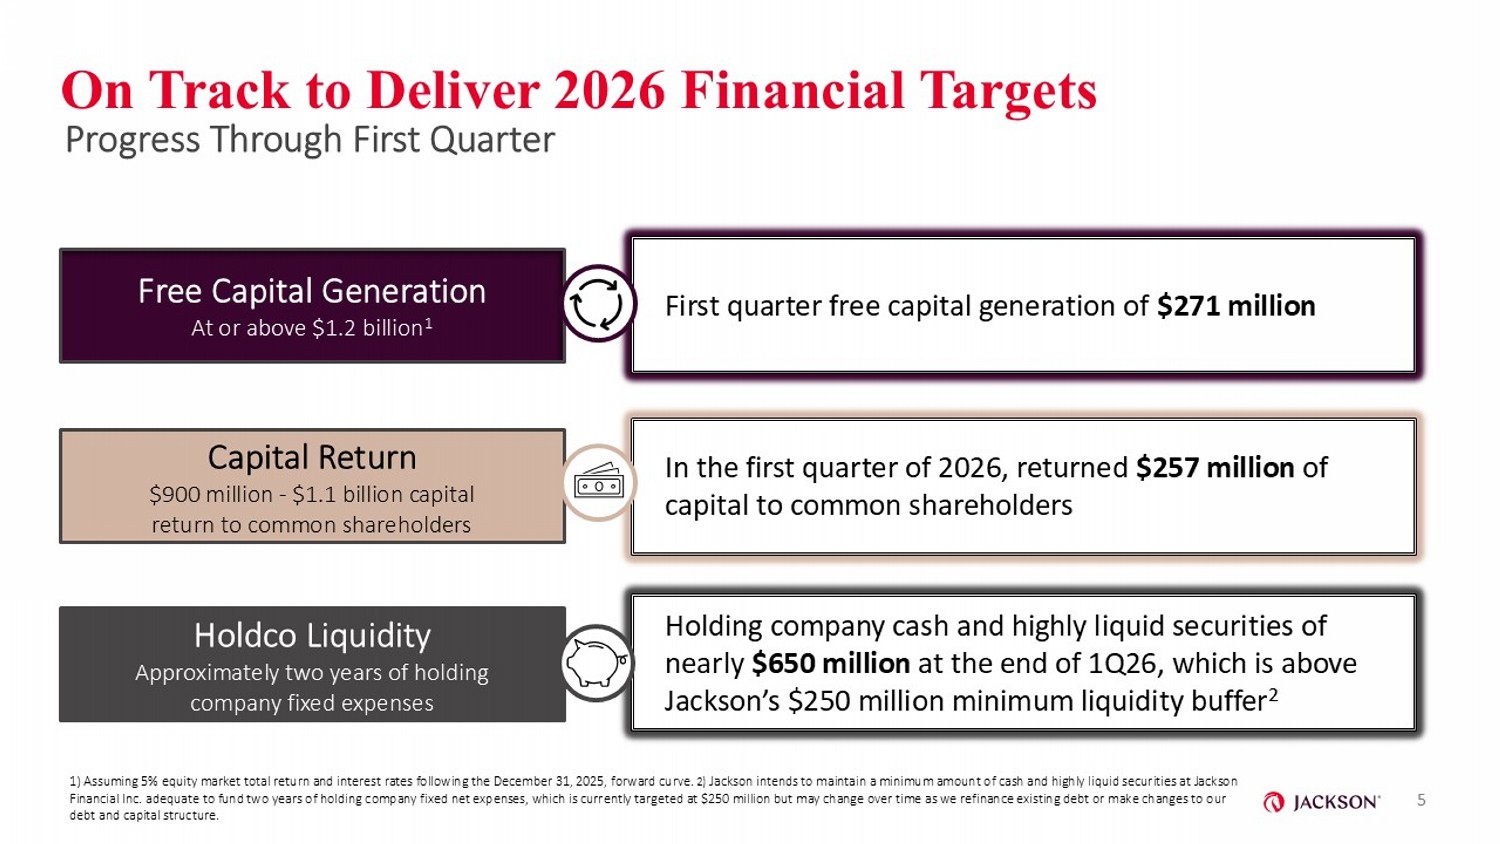
Holdco Liquidity Approximately two years of holding company fixed expenses Capital Return $900 million - $1.1 billion capital return to common shareholders Holding company cash and highly liquid securities of nearly $650 million at the end of 1Q26, which is above Jackson’s $250 million minimum liquidity buffer 2 In the first quarter of 2026, returned $257 million of capital to common shareholders Free Capital Generation At or above $1.2 billion 1 First quarter free capital generation of $271 million On Track to Deliver 2026 Financial Targets 5 1) Assuming 5% equity market total return and interest rates following the December 31, 2025, forward curve . 2) Jackson intends to maintain a minimum amount of cash and highly liquid securities at Jackson Financial Inc. adequate to fund two years of holding company fixed net expenses, which is currently targeted at $250 million but may change over time as we refinance existing debt or make changes to our debt and capital structure. Progress Through First Quarter
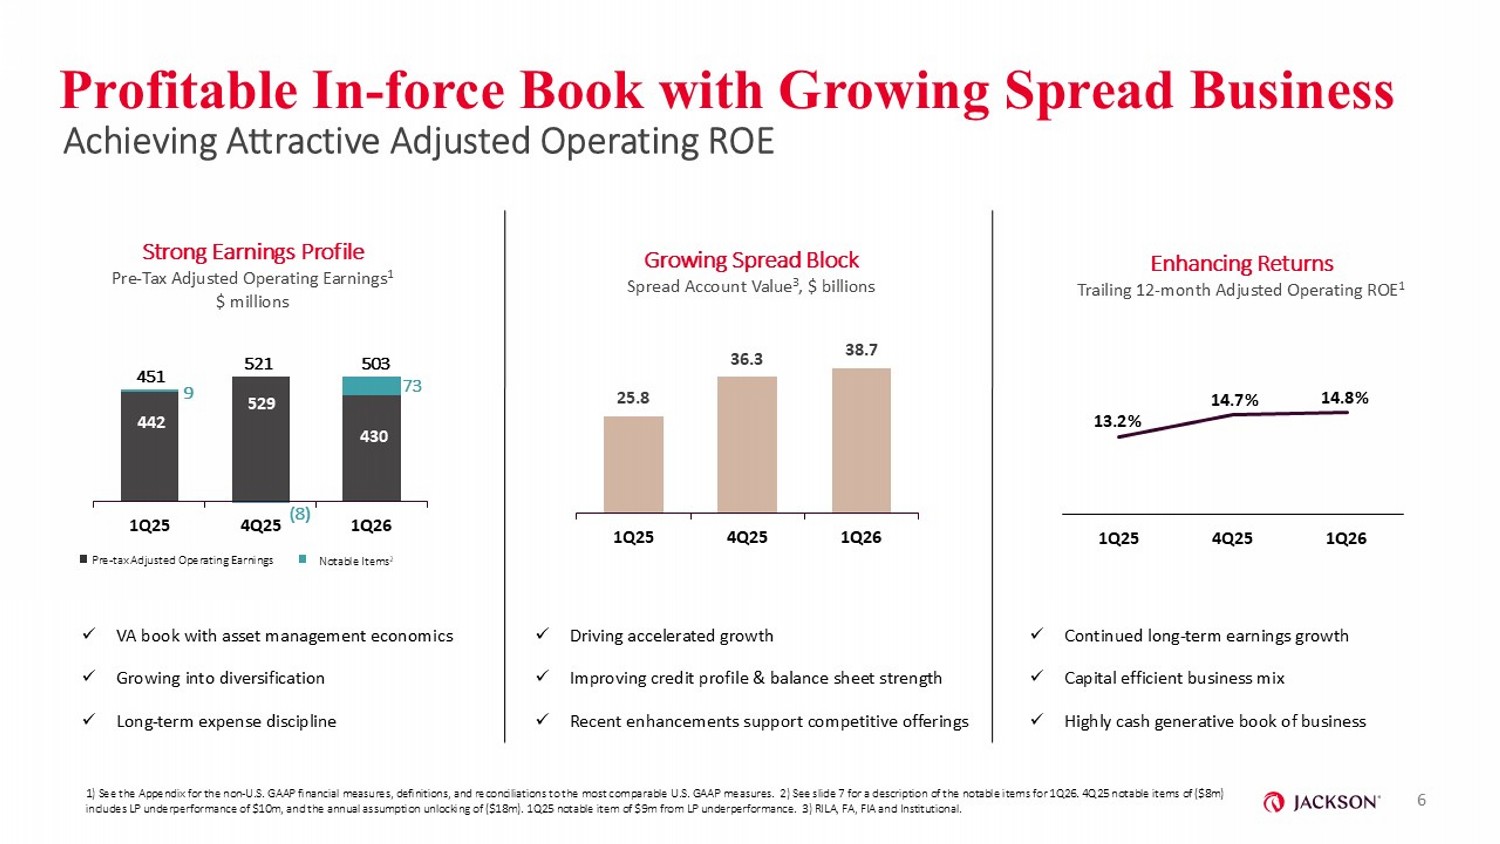
13.2% 14.7% 14.8% 1Q25 4Q25 1Q26 442 529 430 9 (8) 73 1Q25 4Q25 1Q26 451 503 Profitable In - force Book with Growing Spread Business 1) See the Appendix for the non - U.S. GAAP financial measures, definitions, and reconciliations to the most comparable U.S. GAAP measures. 2) See slide 7 for a description of the notable items for 1Q26. 4Q25 notable items of ($8m) includes LP underperformance of $10m, and the annual assumption unlocking of ($18m). 1Q25 notable item of $9m from LP underpe rfo rmance. 3) RILA, FA, FIA and Institutional. 6 Achieving Attractive Adjusted Operating ROE x VA book with asset management economics x Growing into diversification x Long - term expense discipline Strong Earnings Profile Pre - Tax Adjusted Operating Earnings 1 $ millions Enhancing Returns Trailing 12 - month Adjusted Operating ROE 1 25.8 36.3 38.7 1Q25 4Q25 1Q26 x Driving accelerated growth x Improving credit profile & balance sheet strength x Recent enhancements support competitive offerings Growing Spread Block Spread Account Value 3 , $ billions x Continued long - term earnings growth x Capital efficient business mix x Highly cash generative book of business 521 Pre - tax Adjusted Operating Earnings Notable Items 2
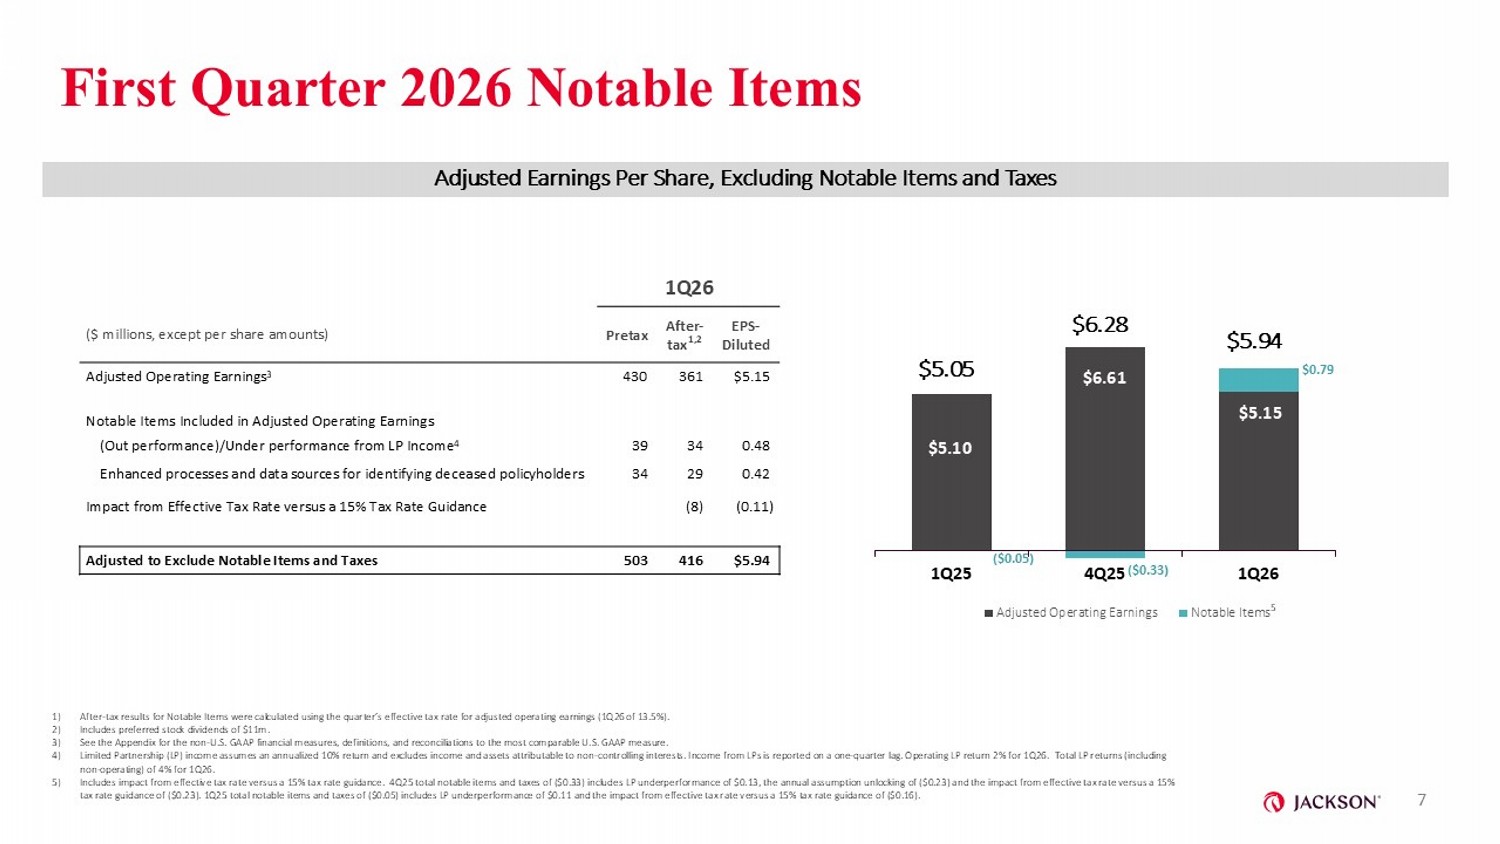
First Quarter 2026 Notable Items 1Q26 EPS - Diluted After - tax 1,2 Pretax ($ millions, except per share amounts) $5.15 361 430 Adjusted Operating Earnings 3 Notable Items Included in Adjusted Operating Earnings 0.48 34 39 (Out performance)/Under performance from LP Income 4 0.42 29 34 Enhanced processes and data sources for identifying deceased policyholders (0.11) (8) Impact from Effective Tax Rate versus a 15% Tax Rate Guidance $5.94 416 503 Adjusted to Exclude Notable Items and Taxes 1) After - tax results for Notable Items were calculated using the quarter’s effective tax rate for adjusted operating earnings (1Q26 of 13.5%). 2) Includes preferred stock dividends of $11m. 3) See the Appendix for the non - U.S. GAAP financial measures, definitions, and reconciliations to the most comparable U.S. GAAP mea sure. 4) Limited Partnership (LP) income assumes an annualized 10% return and excludes income and assets attributable to non - controlling interests. Income from LPs is reported on a one - quarter lag. Operating LP return 2% for 1Q26. Total LP returns (including non - operating) of 4% for 1Q26. 5) Includes impact from effective tax rate versus a 15% tax rate guidance. 4Q25 total notable items and taxes of ($0.33) includ es LP underperformance of $0.13, the annual assumption unlocking of ($0.23) and the impact from effective tax rate versus a 15% tax rate guidance of ($0.23). 1Q25 total notable items and taxes of ($0.05) includes LP underperformance of $0.11 and the imp act from effective tax rate versus a 15% tax rate guidance of ($0.16). 7 $5.10 $6.61 $5.15 ($0.05) ($0.33) $0.79 1Q25 4Q25 1Q26 Adjusted Operating Earnings Notable Items $5.05 $6.28 $5.94 Adjusted Earnings Per Share, Excluding Notable Items and Taxes 5
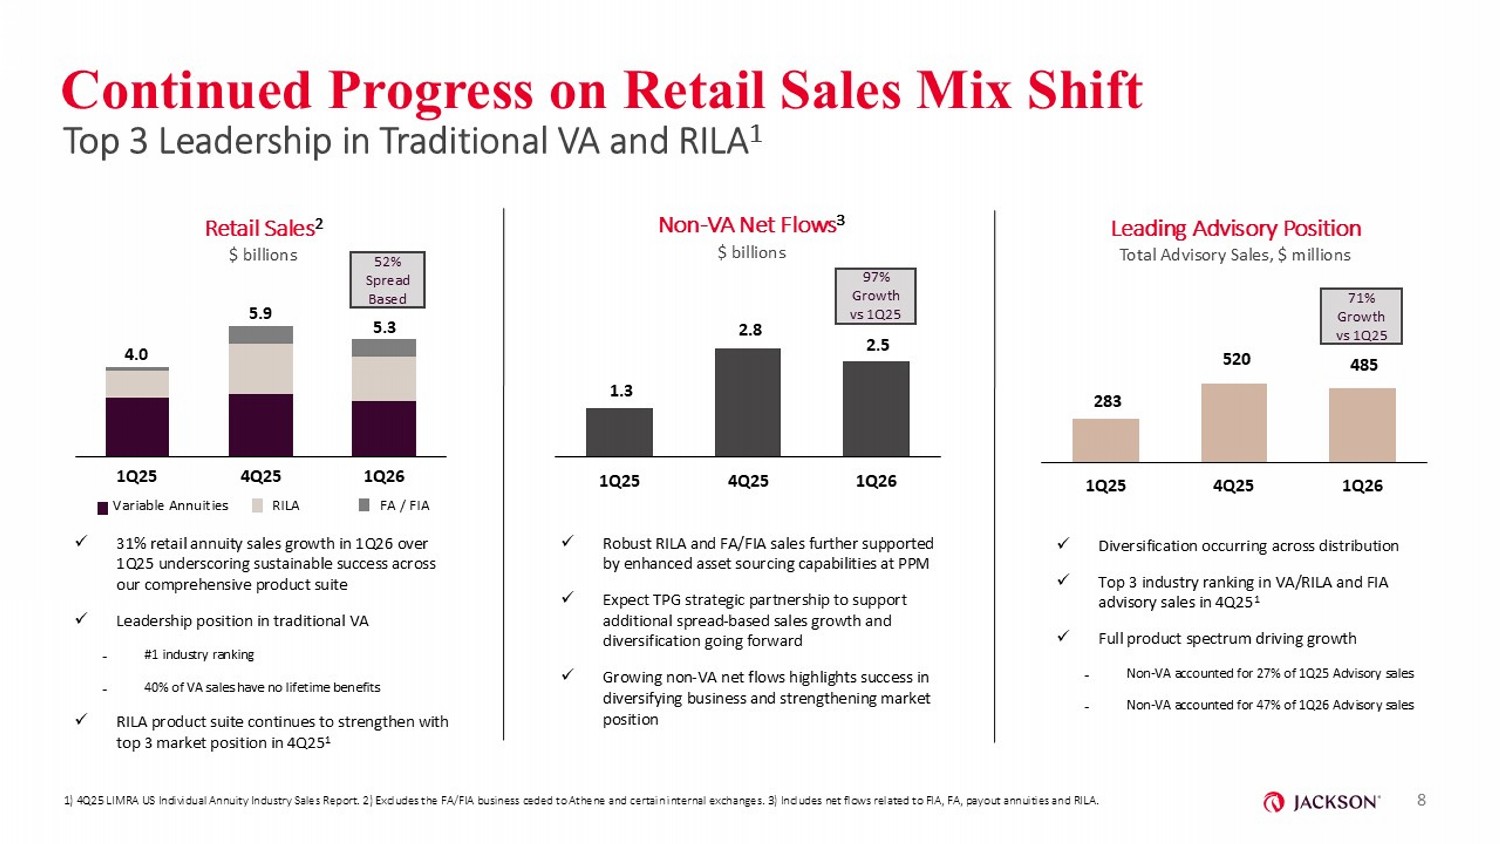
8 Retail Sales 2 $ billions Leading Advisory Position Total Advisory Sales, $ millions Non - VA Net Flows 3 $ billions 4.0 5.9 5.3 1Q25 4Q25 1Q26 Continued Progress on Retail Sales Mix Shift Top 3 Leadership in Traditional VA and RILA 1 1) 4Q25 LIMRA US Individual Annuity Industry Sales Report. 2) Excludes the FA/FIA business ceded to Athene and certain intern al exchanges. 3) Includes net flows related to FIA, FA, payout annuities and RILA. 1.3 2.8 2.5 1Q25 4Q25 1Q26 283 520 485 1Q25 4Q25 1Q26 52% Spread Based 97% Growth vs 1Q25 x 31% retail annuity sales growth in 1Q26 over 1Q25 underscoring sustainable success across our comprehensive product suite x Leadership position in traditional VA ₋ #1 industry ranking ₋ 40% of VA sales have no lifetime benefits x RILA product suite continues to strengthen with top 3 market position in 4Q25 1 x Robust RILA and FA/FIA sales further supported by enhanced asset sourcing capabilities at PPM x Expect TPG strategic partnership to support additional spread - based sales growth and diversification going forward x Growing non - VA net flows highlights success in diversifying business and strengthening market position x Diversification occurring across distribution x Top 3 industry ranking in VA/RILA and FIA advisory sales in 4Q25 1 x Full product spectrum driving growth ₋ Non - VA accounted for 27% of 1Q25 Advisory sales ₋ Non - VA accounted for 47% of 1Q26 Advisory sales 71% Growth vs 1Q25 Variable Annuities RILA FA / FIA
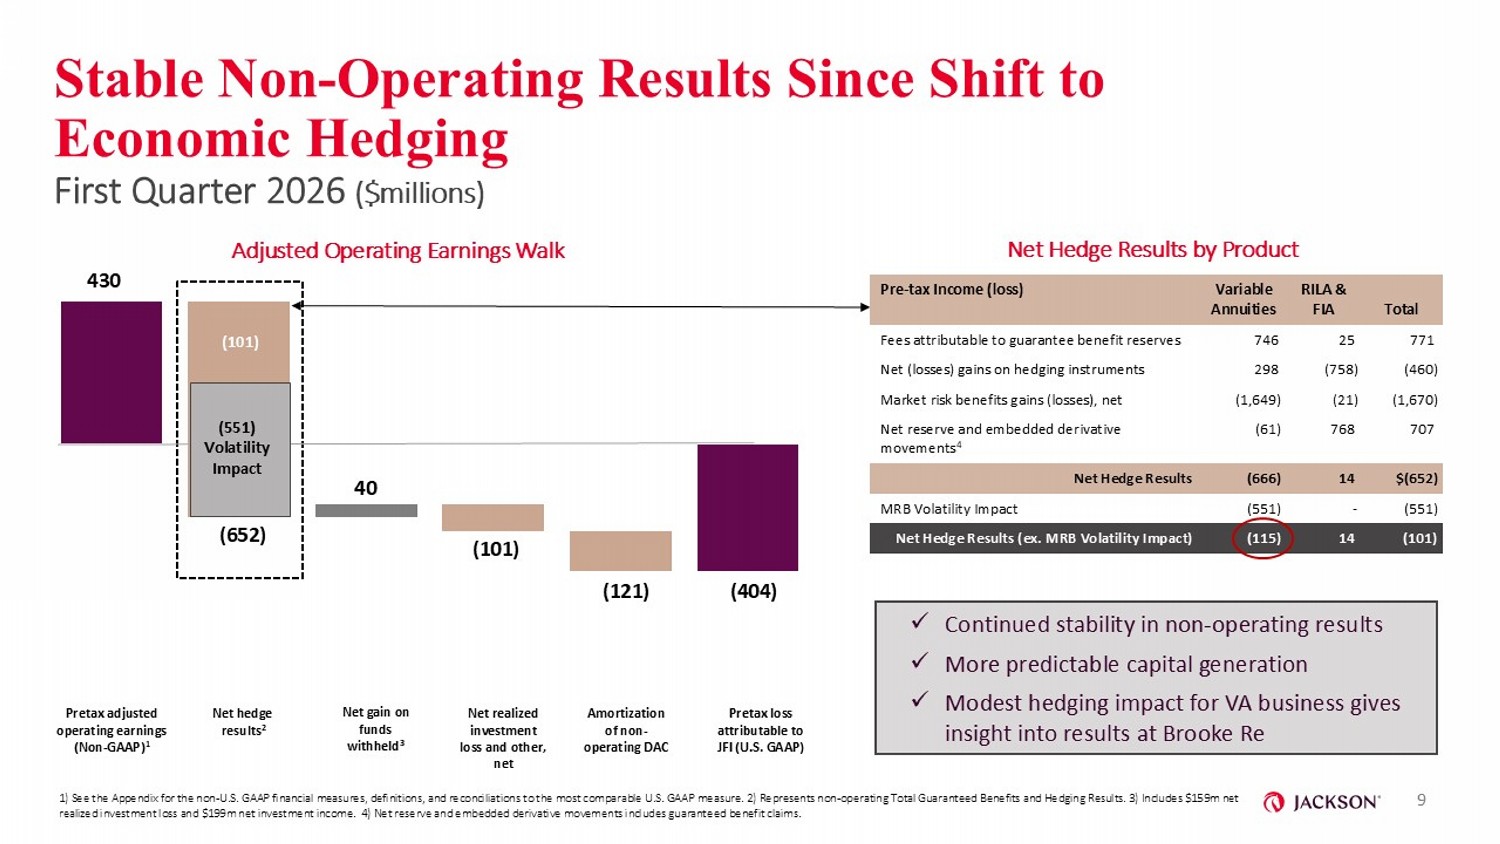
Stable Non - Operating Results Since Shift to Economic Hedging First Quarter 2026 ($millions) Pretax loss attributable to JFI (U.S. GAAP) Pretax adjusted operating earnings (Non - GAAP) 1 Net gain on funds withheld 3 (101) 1) See the Appendix for the non - U.S. GAAP financial measures, definitions, and reconciliations to the most comparable U.S. GAAP measure. 2) Represents non - operating Total Guaranteed Benefits and Hedging Results. 3) Includes $159m net realized investment loss and $199m net investment income. 4) Net reserve and embedded derivative movements includes guarante ed benefit claims. (121) 430 40 9 (404) Net hedge results 2 Net realized investment loss and other, net (652) Amortization of non - operating DAC Total RILA & FIA Variable Annuities Pre - tax Income (loss) 771 25 746 Fees attributable to guarantee benefit reserves (460) (758) 298 Net (losses) gains on hedging instruments (1,670) (21) (1,649) Market risk benefits gains (losses), net 707 768 (61) Net reserve and embedded derivative movements 4 $(652) 14 (666) Net Hedge Results (551) - (551) MRB Volatility Impact (101) 14 (115) Net Hedge Results (ex. MRB Volatility Impact) (101) Adjusted Operating Earnings Walk Net Hedge Results by Product x Continued stability in non - operating results x More predictable capital generation x Modest hedging impact for VA business gives insight into results at Brooke Re (551) Volatility Impact
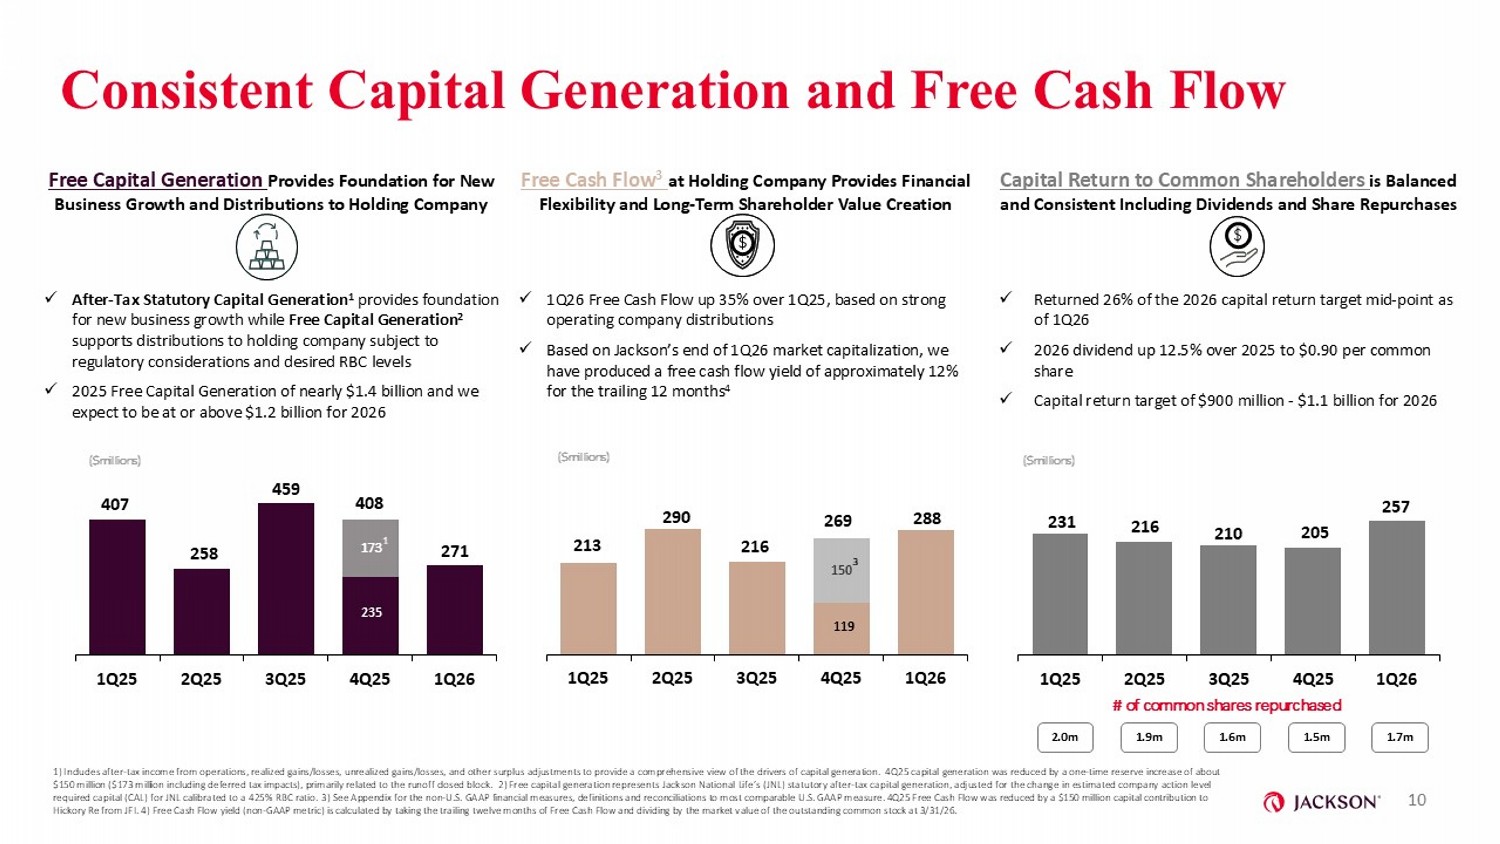
Consistent Capital Generation and Free Cash Flow 1) Includes after - tax income from operations, realized gains/losses, unrealized gains/losses, and other surplus adjustments to p rovide a comprehensive view of the drivers of capital generation. 4Q25 capital generation was reduced by a one - time reserve inc rease of about $150 million ($173 million including deferred tax impacts), primarily related to the runoff closed block. 2) Free capital generation represents Jackson National Life’s (JNL) statutory after - tax capital generation, adjusted for the change in estimated company action level required capital (CAL) for JNL calibrated to a 425% RBC ratio. 3 ) See Appendix for the non - U.S. GAAP financial measures, definitions and reconciliations to most comparable U.S. GAAP measure. 4 Q25 Free Cash Flow was reduced by a $150 million capital contribution to Hickory Re from JFI. 4) Free Cash Flow yield (non - GAAP metric) is calculated by taking the trailing twelve months of Free Cash F low and dividing by the market value of the outstanding common stock at 3/31/26. 10 Free Capital Generation Provides Foundation for New Business Growth and Distributions to Holding Company x After - Tax Statutory Capital Generation 1 provides foundation for new business growth while Free Capital Generation 2 supports distributions to holding company subject to regulatory considerations and desired RBC levels x 2025 Free Capital Generation of nearly $1.4 billion and we expect to be at or above $1.2 billion for 2026 Free Cash Flow 3 at Holding Company Provides Financial Flexibility and Long - Term Shareholder Value Creation x 1Q26 Free Cash Flow up 35% over 1Q25, based on strong operating company distributions x Based on Jackson’s end of 1Q26 market capitalization, we have produced a free cash flow yield of approximately 12% for the trailing 12 months 4 Capital Return to Common Shareholders is Balanced and Consistent Including Dividends and Share Repurchases x Returned 26% of the 2026 capital return target mid - point as of 1Q26 x 2026 dividend up 12.5% over 2025 to $0.90 per common share x Capital return target of $900 million - $1.1 billion for 2026 407 258 459 235 271 173 1Q25 2Q25 3Q25 4Q25 1Q26 213 290 216 119 288 150 1Q25 2Q25 3Q25 4Q25 1Q26 231 216 210 205 257 1Q25 2Q25 3Q25 4Q25 1Q26 408 269 1 3 # of common shares repurchased 2.0m 1.9m 1.6m 1.5m 1.7m ($millions) ($millions) ($millions)
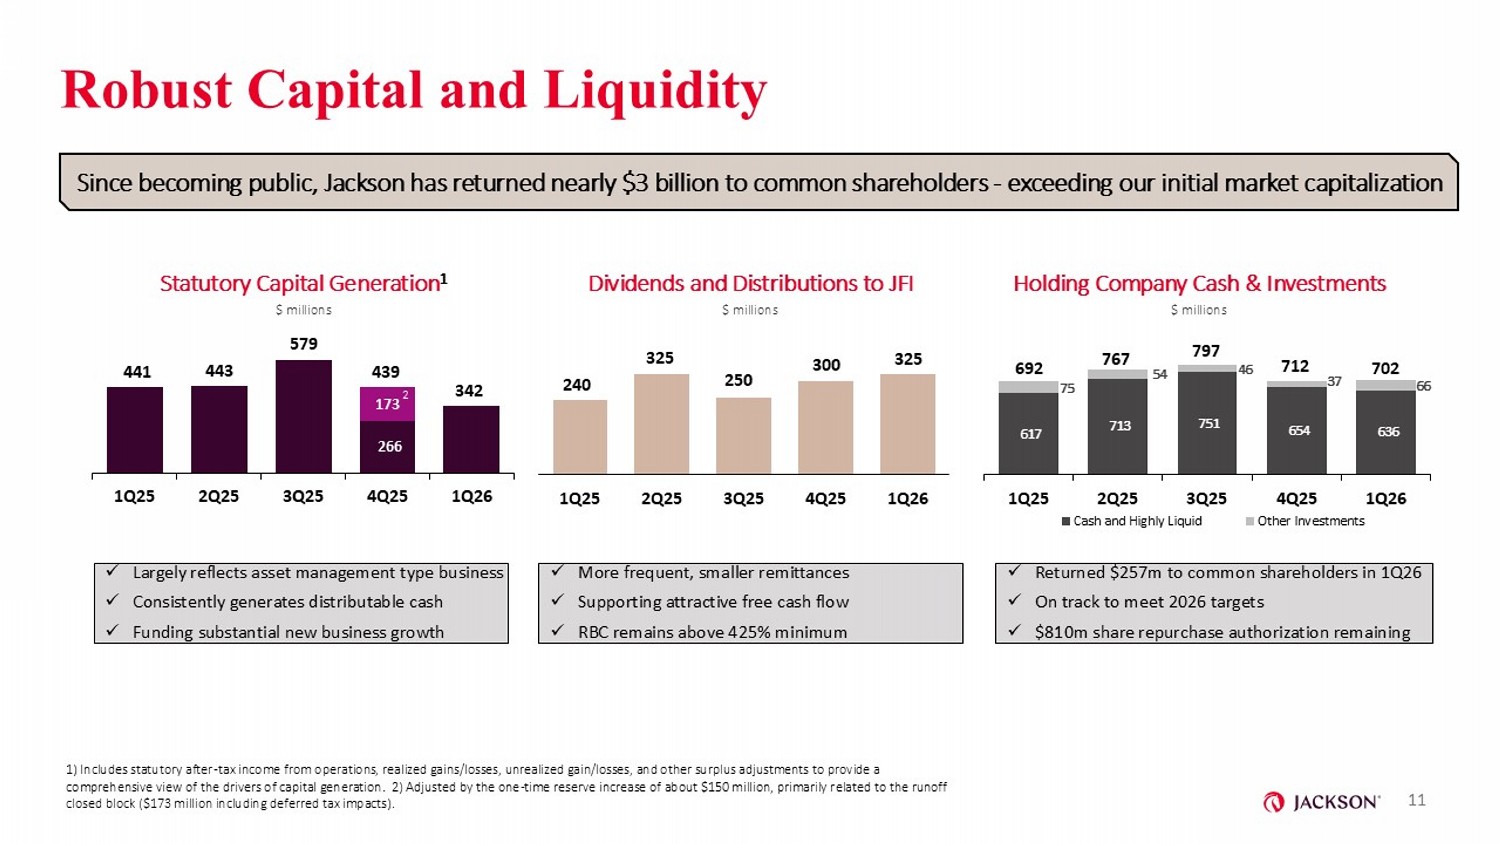
Robust Capital and Liquidity 11 240 325 250 300 325 1Q25 2Q25 3Q25 4Q25 1Q26 Statutory Capital Generation 1 $ millions 1) Includes statutory after - tax income from operations, realized gains/losses, unrealized gain/losses, and other surplus adjustm ents to provide a comprehensive view of the drivers of capital generation. 2) Adjusted by the one - time reserve increase of about $150 million, pr imarily related to the runoff closed block ($173 million including deferred tax impacts). 617 713 751 654 636 75 54 46 37 66 1Q25 2Q25 3Q25 4Q25 1Q26 Cash and Highly Liquid Other Investments 712 Since becoming public, Jackson has returned nearly $3 billion to common shareholders - exceeding our initial market capitalizati on 692 767 702 797 441 443 579 266 342 173 1Q25 2Q25 3Q25 4Q25 1Q26 439 Dividends and Distributions to JFI $ millions Holding Company Cash & Investments $ millions x Largely reflects asset management type business x Consistently generates distributable cash x Funding substantial new business growth x More frequent, smaller remittances x Supporting attractive free cash flow x RBC remains above 425% minimum x Returned $257m to common shareholders in 1Q26 x On track to meet 2026 targets x $810m share repurchase authorization remaining 2
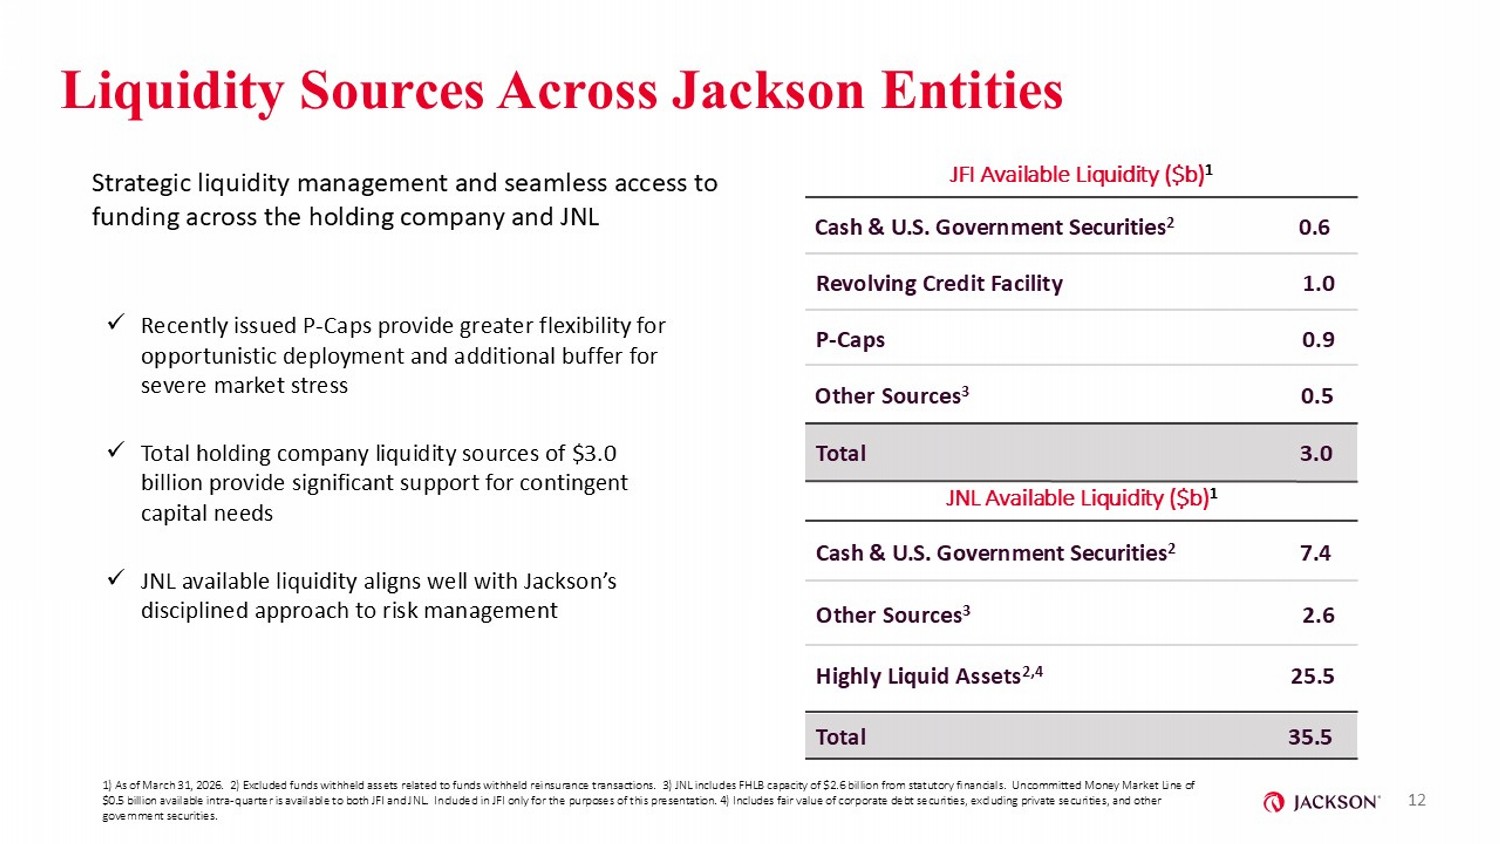
Liquidity Sources Across Jackson Entities x Recently issued P - Caps provide greater flexibility for opportunistic deployment and additional buffer for severe market stress x Total holding company liquidity sources of $3.0 billion provide significant support for contingent capital needs x JNL available liquidity aligns well with Jackson’s disciplined approach to risk management Total 3.0 JFI Available Liquidity ($b) 1 P - Caps 0.9 Other Sources 3 0.5 Revolving Credit Facility 1.0 Cash & U.S. Government Securities 2 0.6 Total 35.5 JNL Available Liquidity ($b) 1 Highly Liquid Assets 2,4 25.5 Other Sources 3 2.6 Cash & U.S. Government Securities 2 7.4 12 Strategic liquidity management and seamless access to funding across the holding company and JNL 1) As of March 31, 2026. 2) Excluded funds withheld assets related to funds withheld reinsurance transactions. 3) JNL inclu des FHLB capacity of $2.6 billion from statutory financials. Uncommitted Money Market Line of $0.5 billion available intra - quarter is available to both JFI and JNL. Included in JFI only for the purposes of this presentati on. 4) Includes fair value of corporate debt securities, excluding private securities, and other government securities.
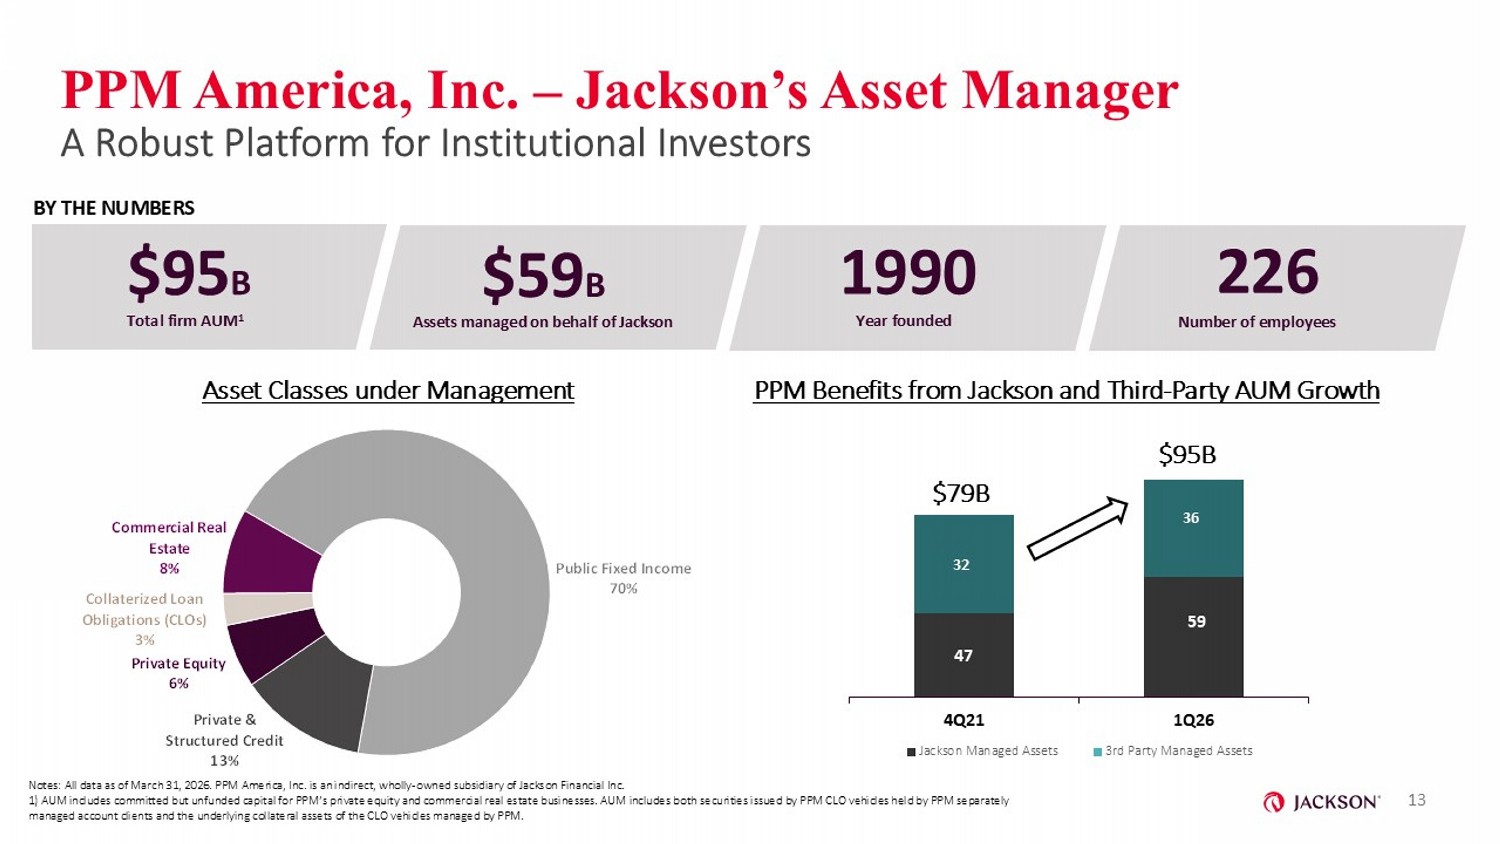
47 59 32 36 4Q21 1Q26 Jackson Managed Assets 3rd Party Managed Assets $95B PPM America, Inc. – Jackson’s Asset Manager A Robust Platform for Institutional Investors Notes: All data as of March 31, 2026. PPM America, Inc. is an indirect, wholly - owned subsidiary of Jackson Financial Inc. 1) AUM includes committed but unfunded capital for PPM’s private equity and commercial real estate businesses. AUM includes b oth securities issued by PPM CLO vehicles held by PPM separately managed account clients and the underlying collateral assets of the CLO vehicles managed by PPM. $ 94 B $ 58 B 1990 22 4 Year of founding Number of employees Total firm AUM 2 Assets managed on behalf of Jackson 13 BY THE NUMBERS $ 95 B $ 59 B 1990 22 6 Year founded Number of employees Total firm AUM 1 Assets managed on behalf of Jackson $79B Asset Classes under Management PPM Benefits from Jackson and Third - Party AUM Growth Public Fixed Income 70% Private & Structured Credit 13% Private Equity 6% Collaterized Loan Obligations (CLOs) 3% Commercial Real Estate 8%
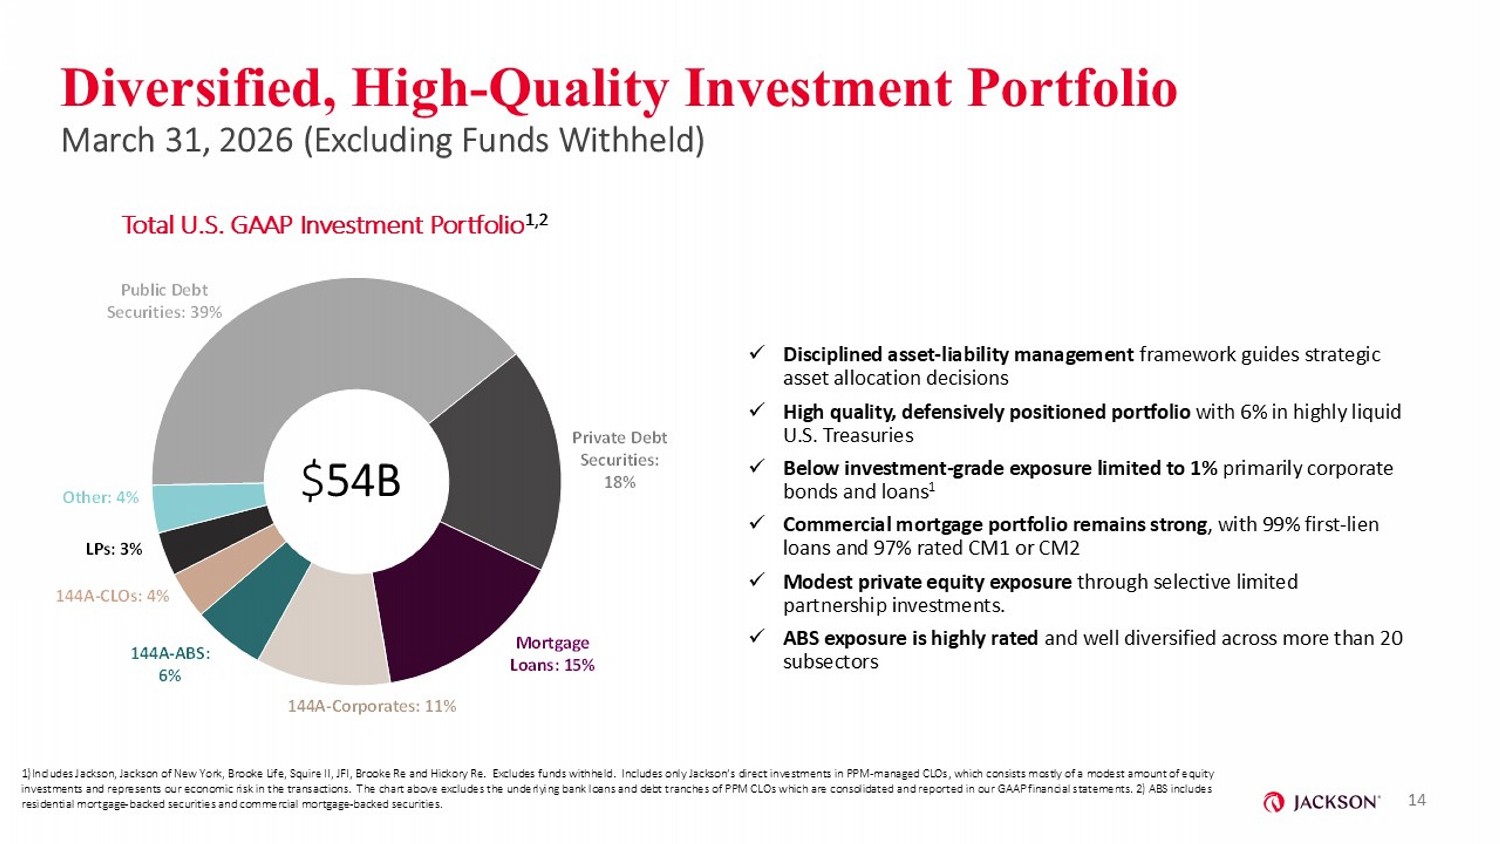
Public Debt Securities: 39% Private Debt Securities: 18% Mortgage Loans: 15% 144A - Corporates: 11% 144A - ABS: 6% 144A - CLOs: 4% LPs: 3% Other: 4% Diversified, High - Quality Investment Portfolio March 31, 2026 (Excluding Funds Withheld) Total U.S. GAAP Investment Portfolio 1,2 14 $ 54B 1)Includes Jackson, Jackson of New York, Brooke Life, Squire II, JFI, Brooke Re and Hickory Re. Excludes funds withheld. In clu des only Jackson’s direct investments in PPM - managed CLOs, which consists mostly of a modest amount of equity investments and represents our economic risk in the transactions. The chart above excludes the underlying bank loans and deb t t ranches of PPM CLOs which are consolidated and reported in our GAAP financial statements. 2) ABS includes residential mortgage - backed securities and commercial mortgage - backed securities. x Disciplined asset - liability management framework guides strategic asset allocation decisions x High quality, defensively positioned portfolio with 6% in highly liquid U.S. Treasuries x Below investment - grade exposure limited to 1% primarily corporate bonds and loans 1 x Commercial mortgage portfolio remains strong , with 99% first - lien loans and 97% rated CM1 or CM2 x Modest private equity exposure through selective limited partnership investments. x ABS exposure is highly rated and well diversified across more than 20 subsectors
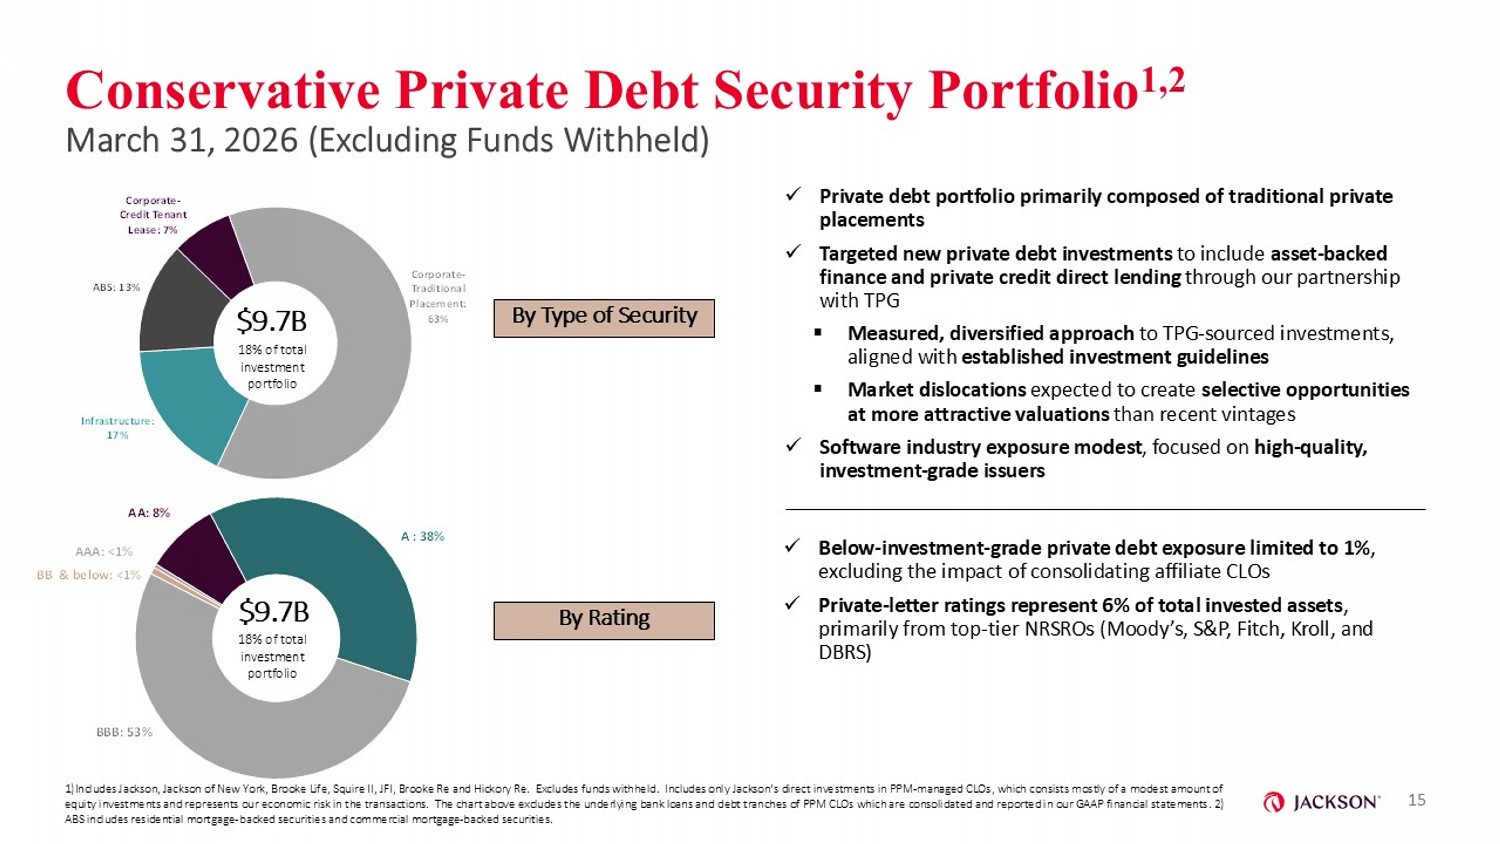
Corporate - Traditional Placement: 63% Infrastructure: 17% ABS: 13% Corporate - Credit Tenant Lease: 7% $9.7B Conservative Private Debt Security Portfolio 1,2 March 31, 2026 (Excluding Funds Withheld) 15 $9.7B By Type of Security By Rating 18% of total investment portfolio 18% of total investment portfolio x Private debt portfolio primarily composed of traditional private placements x Targeted new private debt investments to include asset - backed finance and private credit direct lending through our partnership with TPG ▪ Measured, diversified approach to TPG - sourced investments, aligned with established investment guidelines ▪ Market dislocations expected to create selective opportunities at more attractive valuations than recent vintages x Software industry exposure modest , focused on high - quality, investment - grade issuers x Below - investment - grade private debt exposure limited to 1% , excluding the impact of consolidating affiliate CLOs x Private - letter ratings represent 6% of total invested assets , primarily from top - tier NRSROs (Moody’s, S&P, Fitch, Kroll, and DBRS) 1)Includes Jackson, Jackson of New York, Brooke Life, Squire II, JFI, Brooke Re and Hickory Re. Excludes funds withheld. In clu des only Jackson’s direct investments in PPM - managed CLOs, which consists mostly of a modest amount of equity investments and represents our economic risk in the transactions. The chart above excludes the underlying bank loans and debt tranches of PPM CLOs which are consolidated and reported in our GAAP financial statements. 2) ABS includes residential mortgage - backed securities and commercial mortgage - backed securities. AAA: <1% AA: 8% A : 38% BBB: 53% BB & below: <1%
16 2026 Capital Return Targets on Track While Maintaining a Strong Balance Sheet 16 On track to deliver on 2026 key financial targets Maintained strong balance sheet and robust levels of financial flexibility Demonstrated distribution strength and consistent capital generation Well - positioned to create long - term value for shareholders

Appendix
Non - GAAP Financial Measures In addition to presenting our results of operations and financial condition in accordance with U.S. GAAP, we use and report s ele cted non - GAAP financial measures. Management believes that the use of these non - GAAP financial measures, together with relevant U.S. GAAP financial measures, provides a better understanding of our results of op era tions, financial condition and the underlying performance drivers of our business. These non - GAAP financial measures should be considered supplementary to our results of operations and financial condition that are pres ent ed in accordance with U.S. GAAP. Other companies may use similarly titled non - GAAP financial measures that are calculated differently from the way we calculate such measures. Consequently, our non - GAAP financial measures may not be comparable to similar measures used by other companies. These non - GAAP financial measures should not be viewed as substitutes for the most directly comparable financial measures calculated i n accordance with U.S. GAAP. Adjusted Operating Earnings Adjusted Operating Earnings is an after - tax non - GAAP financial measure, which we believe should be used to evaluate our financia l performance on a consolidated basis by excluding certain items that may be highly variable from period to period due to accounting treatment under U.S. GAAP or that are non - recurring in nature, as well as certa in other revenues and expenses that we do not view as driving our underlying performance. Adjusted Operating Earnings should not be used as a substitute for net income as calculated in accordance with U .S. GAAP. However, we believe the adjustments to net income are useful for gaining an understanding of our overall results of operations. Adjusted Operating Earnings equals our Net income (loss) attributable to Jackson Financial Inc. common shareholders (which ex clu des income attributable to non - controlling interest and dividends on preferred stock) adjusted to eliminate the impact of the items described in the following numbered paragraphs. These items are excluded as th ey may vary significantly from period to period due to near - term market conditions or are otherwise not directly comparable or reflective of the underlying performance of our business. We believe these exclusions p rov ide investors a better picture of the drivers of our underlying performance. 1) Net Hedging Results: Comprised of: (i) fees attributed to guaranteed benefits; (ii) net gains (losses) on hedging instruments which includes: (a) cha nges in the fair value of freestanding derivatives, and related commissions and expenses, used to manage the risk associated with market risk benefits and other benefit features, excluding ear ned income from periodic settlements and changes in settlement accruals on cross - currency swaps; and (b) investment income and change in fair value of certain non - derivative assets used to manage the risk asso ciated with market risk benefits and other benefit features; and (iii) the movements in reserves, market risk benefits, benefit features accounted for as embedded derivative instruments adjusted to exclude the cos t of hedging for certain indexed annuity products, and related claims and benefit payments (excluding impacts of actuarial assumption updates and model enhancements). We believe excluding these items removes th e impact to both revenue and related expenses associated with Net Hedging Results. 2) Amortization of DAC Associated with Non - Operating Items at Date of Transition to LDTI: Amortization of the balance of unamortized deferred acquisition costs, at January 1, 2021, the date of transition to current Long Duration Targeted Improvements (LDTI) accounting guidance, associated with items excluded from pretax adjusted operating ea rnings prior to transition. 3) Actuarial Assumption Updates and Model Enhancements: The impact on the valuation of MRBs and embedded derivatives arising from our annual actuarial assumption updates and model e nha ncements review. 4) Net Realized Investment Gains and Losses: Comprised of: ( i ) realized investment gains and losses associated with the periodic sales or disposals of securities, excluding those held wi thi n our trading portfolio; (ii) impairments of securities, after adjustment for the non - credit component of the impairment charges; and (iii) foreign currency g ain or loss on foreign denominated funding agreements and associated cross - currency swaps. 5) Change in Value of Funds Withheld Embedded Derivative and Net Investment Income on Funds Withheld Assets: Composed of: (i) the change in fair value of funds withheld embedded derivatives; and (ii) net investment income on funds withheld assets related to funds withheld reinsurance transactions. 6) Other Items: Comprised of: (i) the impact of investments that are consolidated in our financial statements due to U.S. GAAP accounting req uir ements, such as our investments in collateralized loan obligations (CLOs), but for which the consolidation effects are not consistent with our economic interest or exposure to those entities; (ii ) impacts from derivatives not included in Net Hedging Results or Net Realized Investment Gains or Losses (see 1. and 4. above), excluding earned income from periodic settlements and changes in settlement ac cruals on cross - currency swaps; (iii) investment income (loss) related to mark - to - market on TPG shares, which are subject to certain sales restrictions; and (iv) one - time or other non - recurring items. Operating Income Taxes are calculated using the prevailing corporate federal income tax rate of 21% while taking into account any items recognized d iff erently in our financial statements and federal income tax returns, including the dividends received deduction and other tax credits. For interim reporting periods, the Company uses an es timated annual effective tax rate in computing its tax provision including consideration of discrete items. 18
Non - GAAP Financial Measures Adjusted Book Value Attributable to Common Shareholders Adjusted Book Value Attributable to Common Shareholders excludes Preferred Stock and Accumulated Other Comprehensive Income ( Los s) (AOCI) attributable to Jackson Financial Inc. (JFI), which does not include AOCI arising from investments held within the funds withheld account related to the Athene Reinsurance Transaction. We exclude AOC I a ttributable to JFI from Adjusted Book Value Attributable to Common Shareholders because our invested assets are generally invested to closely match the duration of our liabilities, which are longer duratio n i n nature, and therefore we believe period - to - period fair market value fluctuations in AOCI to be inconsistent with this objective. We believe excluding AOCI attributable to JFI is more useful to investors in analyzing t ren ds in our business because it removes those short - term fluctuations. Changes in AOCI within the funds withheld account related to the Athene Reinsurance Transaction offset the related non - operating earnings from the Athe ne Reinsurance Transaction resulting in a minimal net impact on Adjusted Book Value of JFI. Adjusted Operating Return on Equity Attributable to Common Shareholders We use Adjusted Operating Return on Equity (ROE) Attributable to Common Shareholders to manage our business and evaluate our fin ancial performance which: (i) excludes items that vary from period - to - period due to accounting treatment under U.S. GAAP or that are non - recurring in nature, as such items may distort the underlying performanc e of our business; and (ii) is calculated by dividing our Adjusted Operating Earnings by average Adjusted Book Value Attributable to Common Shareholders. Adjusted Book Value Attributable to Common Shareholders and Adjusted Operating ROE Attributable to Common Shareholders should no t be used as substitutes for total shareholders’ equity and ROE as calculated using annualized net income and average equity in accordance with U.S. GAAP. However, we believe the adjustments to equity an d e arnings are useful to gaining an understanding of our overall results of operations. Free Cash Flow Free cash flow is Jackson Financial Inc. (Parent Company only) net cash provided by (used in) operating activities less prefe rre d stock dividends and capital contributions to PPM or other subsidiaries, plus the return of capital from our subsidiaries. Free cash flow should not be used as a substitute for JFI’s (Parent Company only) net cash pr ovi ded by (used in) operating activities calculated in accordance with U.S. GAAP. However, we believe these adjustments are useful to gaining an understanding of our overall available cash flow at JFI for return of capi tal to common shareholders and other corporate initiatives. Notable Items Notable items reflect the impact on our results of certain items or events that may or may not have been anticipated and resu lte d in volatility in the Company's earnings expectations. The presentation of notable items is intended to help investors better understand our results for the period and to evaluate and forecast those results. 19
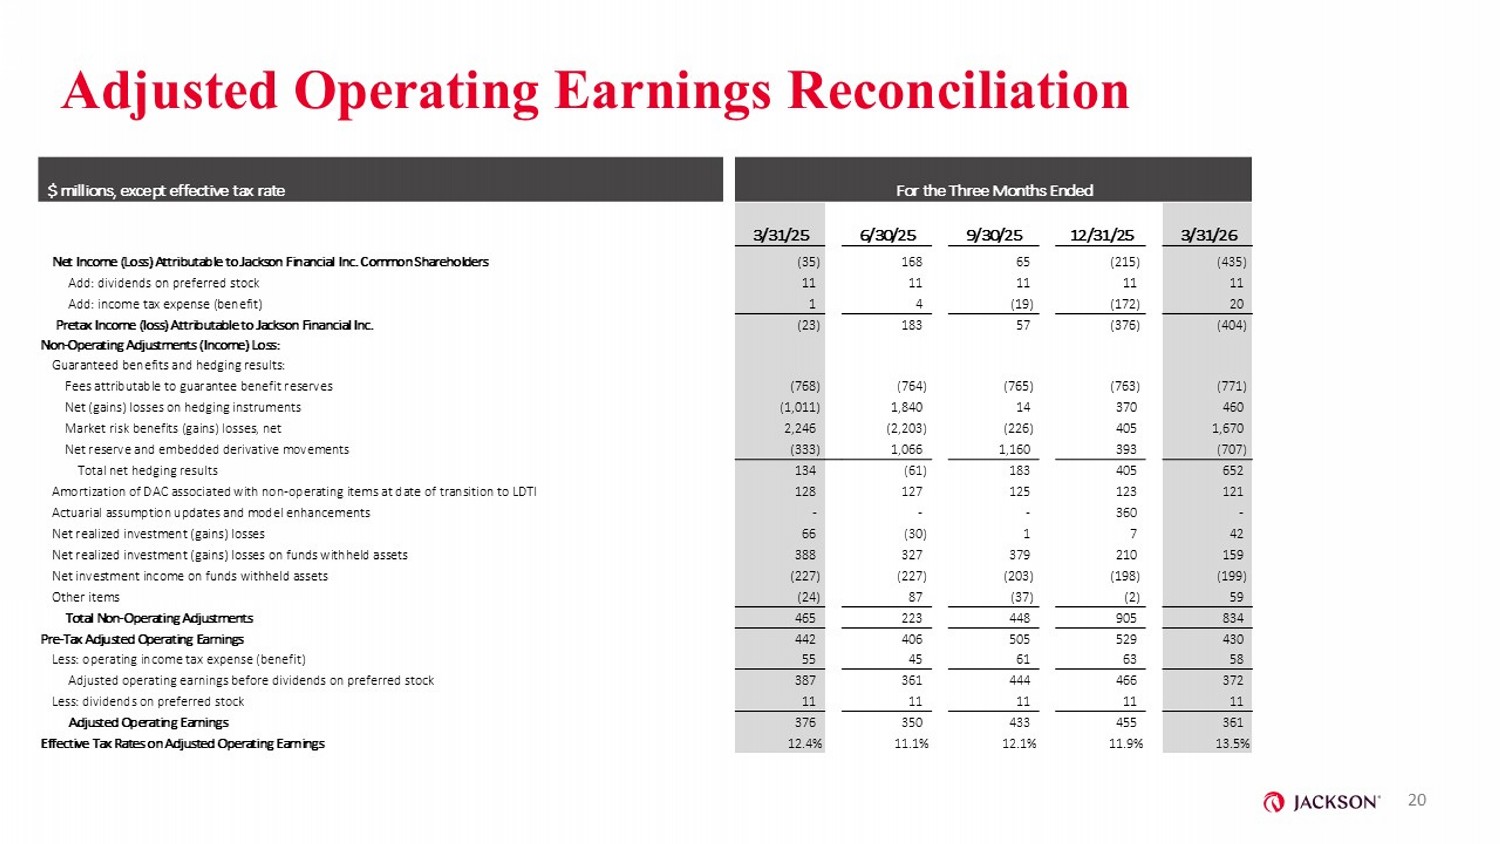
Adjusted Operating Earnings Reconciliation For the Twelve Months Ended For the Three Months Ended $ millions, except effective tax rate 12/31/25 12/31/24 3/31/26 12/31/25 9/30/25 6/30/25 3/31/25 (17) 902 (435) (215) 65 168 (35) Net Income (Loss) Attributable to Jackson Financial Inc. Common Shareholders 44 44 11 11 11 11 11 Add: dividends on preferred stock (186) 46 20 (172) (19) 4 1 Add: income tax expense (benefit) (159) 992 (404) (376) 57 183 (23) Pretax Income (loss) Attributable to Jackson Financial Inc. Non - Operating Adjustments (Income) Loss: Guaranteed benefits and hedging results: (3,060) (3,122) (771) (763) (765) (764) (768) Fees attributable to guarantee benefit reserves 1,213 5,856 460 370 14 1,840 (1,011) Net (gains) losses on hedging instruments 222 (4,243) 1,670 405 (226) (2,203) 2,246 Market risk benefits (gains) losses, net 2,286 1,224 (707) 393 1,160 1,066 (333) Net reserve and embedded derivative movements 661 (285) 652 405 183 (61) 134 Total net hedging results 503 541 121 123 125 127 128 Amortization of DAC associated with non - operating items at date of transition to LDTI 360 419 - 360 - - - Actuarial assumption updates and model enhancements 44 11 42 7 1 (30) 66 Net realized investment (gains) losses 1,304 1,052 159 210 379 327 388 Net realized investment (gains) losses on funds withheld assets (855) (1,024) (199) (198) (203) (227) (227) Net investment income on funds withheld assets 24 (28) 59 (2) (37) 87 (24) Other items 2,041 686 834 905 448 223 465 Total Non - Operating Adjustments 1,882 1,678 430 529 505 406 442 Pre - Tax Adjusted Operating Earnings 224 191 58 63 61 45 55 Less: operating income tax expense (benefit) 1,658 1,487 372 466 444 361 387 Adjusted operating earnings before dividends on preferred stock 44 44 11 11 11 11 11 Less: dividends on preferred stock 1,614 1,443 361 455 433 350 376 Adjusted Operating Earnings 11.9% 11.4% 13.5% 11.9% 12.1% 11.1% 12.4% Effective Tax Rates on Adjusted Operating Earnings 20
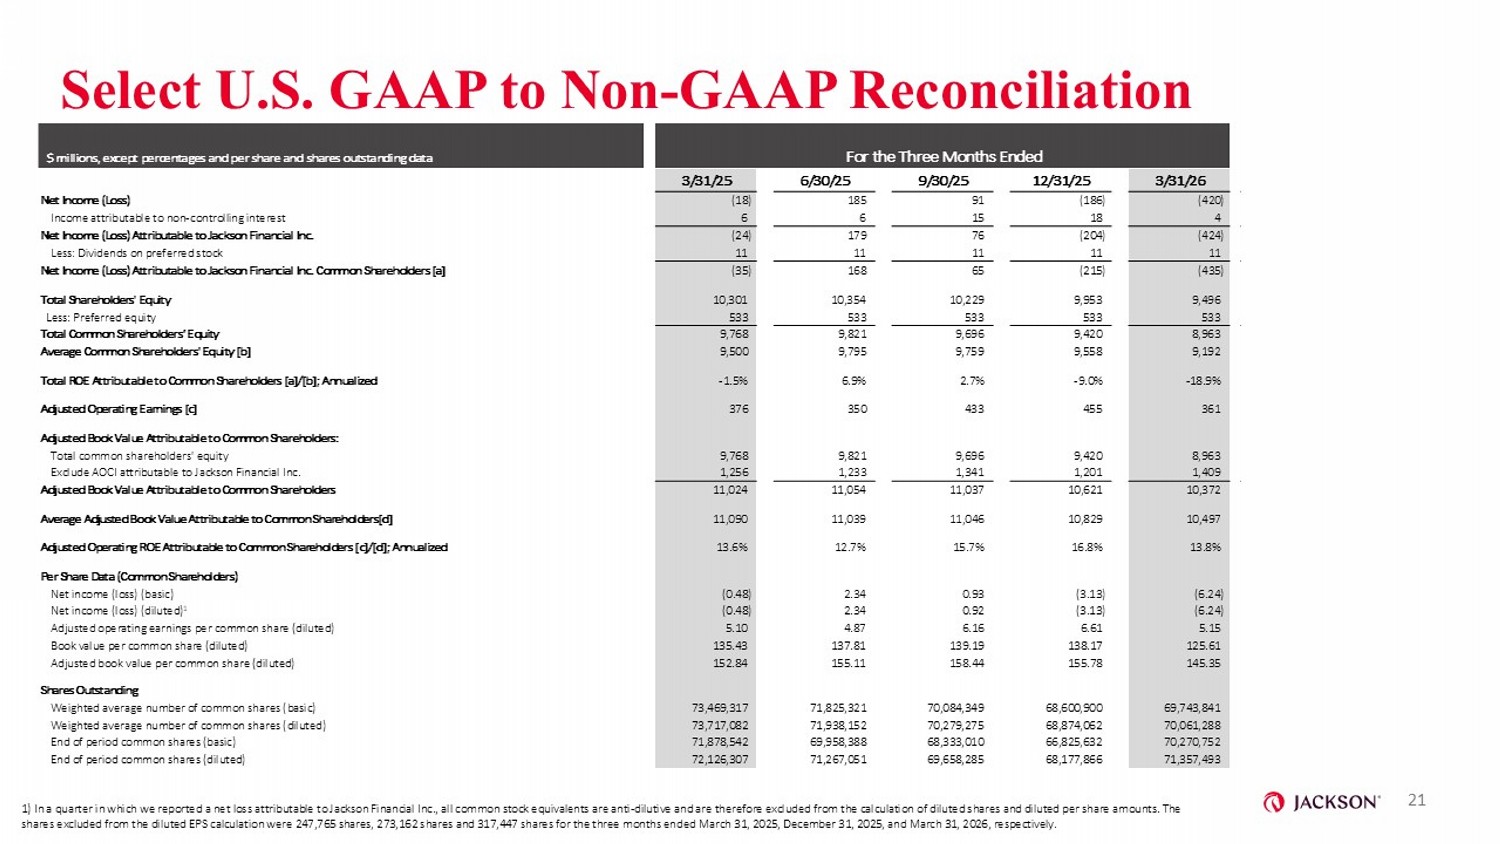
Select U.S. GAAP to Non - GAAP Reconciliation For the Twelve Months Ended For the Three Months Ended $ millions, except percentages and per share and shares outstanding data 12/31/25 12/31/24 3/31/26 12/31/25 9/30/25 6/30/25 3/31/25 72 976 (420) (186) 91 185 (18) Net Income (Loss) 45 30 4 18 15 6 6 Income attributable to non - controlling interest 27 946 (424) (204) 76 179 (24) Net Income (Loss) Attributable to Jackson Financial Inc. 44 44 11 11 11 11 11 Less: Dividends on preferred stock (17) 902 (435) (215) 65 168 (35) Net Income (Loss) Attributable to Jackson Financial Inc. Common Shareholders [a] 9,953 9,764 9,496 9,953 10,229 10,354 10,301 Total Shareholders' Equity 533 533 533 533 533 533 533 Less: Preferred equity 9,420 9,231 8,963 9,420 9,696 9,821 9,768 Total Common Shareholders’ Equity 9,587 9,644 9,192 9,558 9,759 9,795 9,500 Average Common Shareholders' Equity [b] - 0.2% 9.4% - 18.9% - 9.0% 2.7% 6.9% - 1.5% Total ROE Attributable to Common Shareholders [a]/[b]; Annualized 1,614 1,443 361 455 433 350 376 Adjusted Operating Earnings [c] Adjusted Book Value Attributable to Common Shareholders: 9,420 9,231 8,963 9,420 9,696 9,821 9,768 Total common shareholders' equity 1,201 1,925 1,409 1,201 1,341 1,233 1,256 Exclude AOCI attributable to Jackson Financial Inc. 10,621 11,156 10,372 10,621 11,037 11,054 11,024 Adjusted Book Value Attributable to Common Shareholders 10,978 11,213 10,497 10,829 11,046 11,039 11,090 Average Adjusted Book Value Attributable to Common Shareholders[d] 14.7% 12.9% 13.8% 16.8% 15.7% 12.7% 13.6% Adjusted Operating ROE Attributable to Common Shareholders [c]/[d]; Annualized Per Share Data (Common Shareholders) (0.24) 11.86 (6.24) (3.13) 0.93 2.34 (0.48) Net income (loss) (basic) (0.24) 11.74 (6.24) (3.13) 0.92 2.34 (0.48) Net income (loss) (diluted) 1 22.67 18.79 5.15 6.61 6.16 4.87 5.10 Adjusted operating earnings per common share (diluted) 138.17 124.21 125.61 138.17 139.19 137.81 135.43 Book value per common share (diluted) 155.78 150.11 145.35 155.78 158.44 155.11 152.84 Adjusted book value per common share (diluted) Shares Outstanding 70,978,898 76,049,665 69,743,841 68,600,900 70,084,349 71,825,321 73,469,317 Weighted average number of common shares (basic) 71,186,069 76,809,387 70,061,288 68,874,062 70,279,275 71,938,152 73,717,082 Weighted average number of common shares (diluted) 66,825,632 73,380,643 70,270,752 66,825,632 68,333,010 69,958,388 71,878,542 End of period common shares (basic) 68,177,866 74,316,564 71,357,493 68,177,866 69,658,285 71,267,051 72,126,307 End of period common shares (diluted) 21 1) In a quarter in which we reported a net loss attributable to Jackson Financial Inc., all common stock equivalents are anti - di lutive and are therefore excluded from the calculation of diluted shares and diluted per share amounts. The shares excluded from the diluted EPS calculation were 247,765 shares, 273,162 shares and 317,447 shares for the three months end ed March 31, 2025, December 31, 2025, and March 31, 2026, respectively.
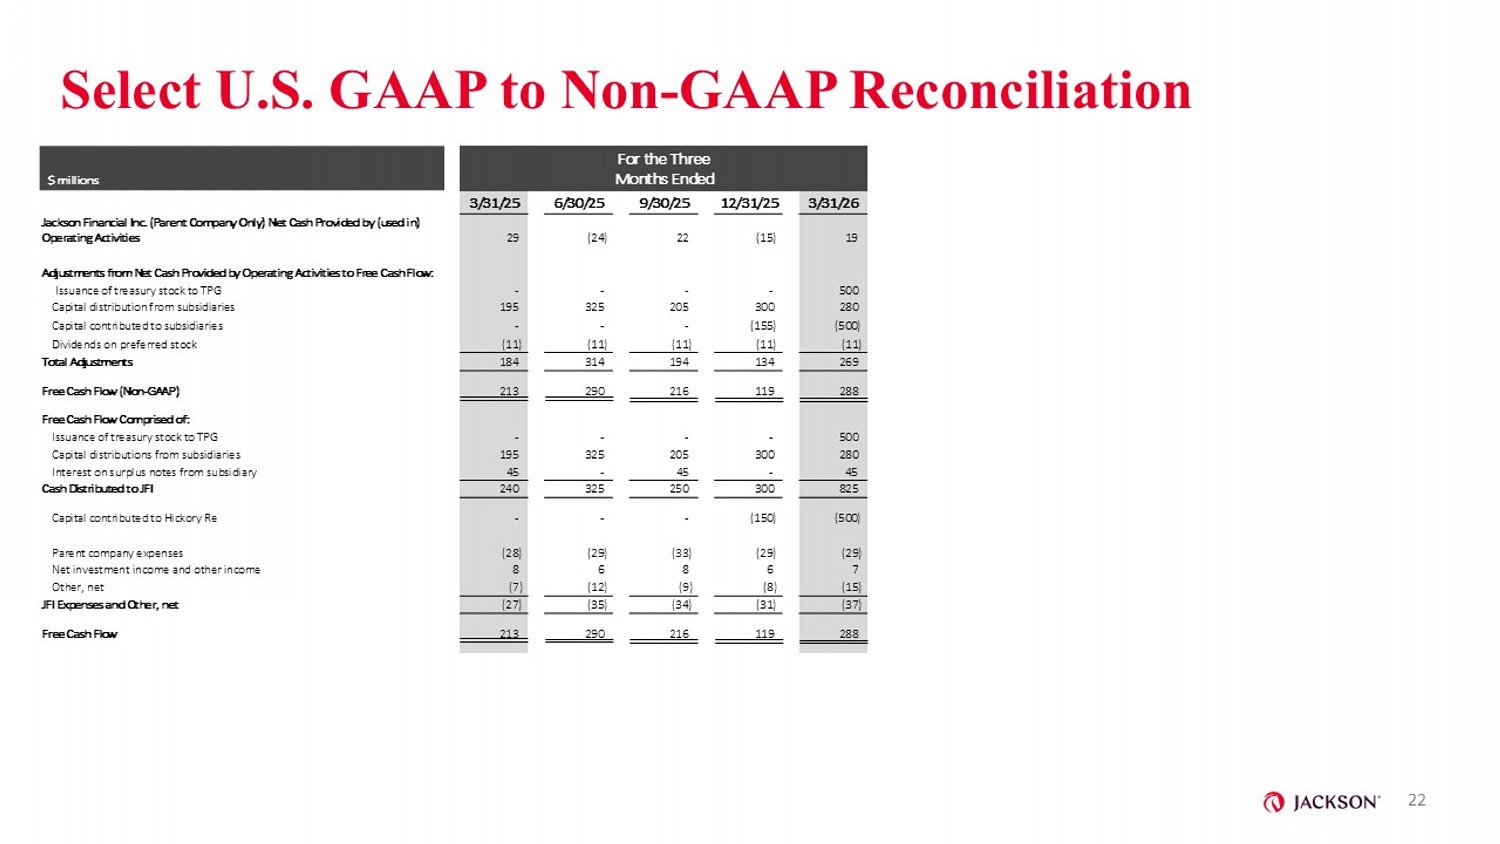
Select U.S. GAAP to Non - GAAP Reconciliation For the Three Months Ended $ millions 3/31/26 12/31/25 9/30/25 6/30/25 3/31/25 19 (15) 22 (24) 29 Jackson Financial Inc. (Parent Company Only) Net Cash Provided by (used in) Operating Activities Adjustments from Net Cash Provided by Operating Activities to Free Cash Flow: 500 - - - - Issuance of treasury stock to TPG 280 300 205 325 195 Capital distribution from subsidiaries (500) (155) - - - Capital contributed to subsidiaries (11) (11) (11) (11) (11) Dividends on preferred stock 269 134 194 314 184 Total Adjustments 288 119 216 290 213 Free Cash Flow (Non - GAAP) Free Cash Flow Comprised of: 500 - - - - Issuance of treasury stock to TPG 280 300 205 325 195 Capital distributions from subsidiaries 45 - 45 - 45 Interest on surplus notes from subsidiary 825 300 250 325 240 Cash Distributed to JFI (500) (150) - - - Capital contributed to Hickory Re (29) (29) (33) (29) (28) Parent company expenses 7 6 8 6 8 Net investment income and other income (15) (8) (9) (12) (7) Other, net (37) (31) (34) (35) (27) JFI Expenses and Other, net 288 119 216 290 213 Free Cash Flow 22 For the Twelve Months Ended 12/31/25 12/31/24 12 51 1,025 785 (155) (25) (44) (44) 826 716 838 767 1,025 785 90 90 1,115 875 (150) - (119) (124) 28 24 (36) (8) (127) (108) 838 767

Glossary Athene Reinsurance Transaction - The funds withheld coinsurance agreement with Athene Life Re Ltd., entered on June 18, 2020, and effective June 1, 2020, to r e insure a 100% quota share of a block of our in - force fixed and fixed index annuity liabilities in exchange for approximately $1.2 billion in ceding commissions. Deferred Acquisition Cost (DAC) - Represent the incremental costs related directly to the successful acquisition of new, and certain renewal, insurance policie s and annuity contracts. The recognition of these costs has been deferred, and the deferred amounts are shown on the balance sheet as an asset, which is subject to amortization over the estimated lives of th ose policies and contracts. Derivative Instruments - Jackson Financial Inc.'s (JFI) business model includes the acceptance, monitoring and mitigation of risk. Specifically, JFI c onsiders, among other factors, exposures to interest rate and equity market movements, foreign exchange rates and other asset or liability prices. JFI uses derivative instruments to mitigate or reduce these risk s i n accordance with established policies and goals. JFI's derivative holdings, while effective in managing defined risks, are not structured to meet accounting requirements to be designated as hedging instruments. As a result, freestanding de rivatives are carried at fair value with changes each period recorded in net gains or losses on derivatives and investments. Earnings per Share (EPS) - Basic earnings per share is calculated by dividing net income (loss) attributable to JFI common shareholders by the weighted - a verage number of common shares outstanding during the period. Diluted earnings per share is calculated by dividing the net income (loss) attributable to JFI common shareholders, by the weighted - average numbe r of shares of common stock outstanding for the period, plus shares representing the dilutive effect of share - based awards. Fixed Annuity (FA) - An annuity that guarantees a set annual rate of return with interest at rates we determine, subject to specified minimums. C r edited interest rates are guaranteed not to change for certain limited periods of time, after which rates may be reset. Fixed Index Annuity (FIA) - An annuity with an ability to share in the upside from certain financial markets such as equity indices and provides downside protection. Guaranteed Minimum Accumulation Benefit (GMAB) - An add - on benefit (enhanced benefits available for an additional cost) that entitles an owner to a minimum payment, typically in lump - sum, after a set period of time, referred to as the accumulation period. The minimum payment is based on the benefit base, which could be greater than the underlying accoun t v alue. Guaranteed Minimum Death Benefit (GMDB) - An add - on benefit (enhanced benefits available for an additional cost) that guarantees an owner's beneficiaries are entitled t o a minimum payment based on the benefit base, which could be greater than the underlying account value, upon the death of the owner. Guaranteed Minimum Income Benefit (GMIB) - An add - on benefit (available for an additional cost) where an owner is entitled to annuitize the policy and receive a minimum payment stream based on the benefit base, which could be greater than the payment stream resulting from current annuitization of the underlying account value. Guaranteed Minimum Withdrawal Benefit (GMWB) - An add - on benefit (available for an additional cost) where an owner is entitled to withdraw a maximum amount of their benefit base each year, for which cumulative payments to the owner could be greater than the underlying account value. Guaranteed Minimum Withdrawal Benefit for Life (GMWB for Life) - An add - on benefit (available for an additional cost) where an owner is entitled to withdraw the guaranteed annual withdrawal a mount each year for the duration of the policyholder's life, regardless of account performance. LDTI - Accounting Standards Update 2018 - 12, “Targeted Improvements to the Accounting for Long - Duration Contracts”, effective January 1, 2023, with a transition date of January 1, 2021. Net Amount at Risk (NAR) - The greater of Death Benefit NAR (DBNAR) and Living Benefit NAR (LBNAR), as applicable, where DBNAR is the GMDB benefit base i n excess of the account value, and the LBNAR is the actuarial present value of guaranteed living benefits in excess of the account value. 23
Glossary Net Flows - The net change in customer account balances during a period, after reflecting gross premiums inflows and surrender, withdrawa l and benefit payment outflows. Net flows do not include investment performance, interest credited to customer accounts, and policy charges. Registered Index - Linked Annuity (RILA) - A registered index - linked annuity, which offers market index - linked investment options, subject to a cap, and a variety of gua rantees designed to modify or limit losses. Return of Premium (ROP) Death Benefit - This death benefit pays the greater of the account value at the time of a claim following the owner's death or the total cont r ibutions to the contract (subject to adjustment for withdrawals). The charge for this benefit is usually included in the Mortality and Expense fee that is deducted daily from the net assets in ea ch variable investment option. We also refer to this death benefit as the Return of Principal death benefit. Risk - Based Capital (RBC) - Statutory minimum level of capital that is required by regulators for an insurer to support its operations. Segment - Retail Annuities JFI's Retail Annuities segment offers a variety of retirement income and savings products through its diverse suite of produc ts, consisting primarily of variable annuities, registered index - linked annuities (RILA), fixed annuities, fixed index annuities, and payout annuities. These products are distributed through various wirehouses, insurance brokers, independent b rok er - dealers, as well as banks and financial institutions. The financial results of the variable annuity business within the Company’s Retail Annuities segment are largely dependent on th e performance of the contract holder account value, which impacts both the level of fees collected and the benefits paid to the contract holder. The financial results of the Company’s fixed annuities, fixed index annuities, RILA an d t he fixed option on variable annuities, are largely dependent on the Company’s ability to earn a spread between earned investment rates on general account assets and the interest credited to contract holders. Segment - Institutional Products JFI's Institutional Products segment consist of traditional guaranteed investment contracts (GICs), and funding agreements. JFI 's GIC products are marketed to defined contribution pension and profit - sharing retirement plans. Funding agreements are marketed to institutional investors, including corporate cash accounts and securities lending funds, as well a s m oney market funds. Funding agreements are also issued in conjunction with JFI’s participation in the U.S. Federal Home Loan Bank (FHLB) program. The financial results of JFI's Institutional Products business are primarily dependent on the Company’s ability to earn a spr ead between earned investment rates on general account assets and the interest credited on GICs and funding agreements. Segment - Closed Life and Annuity Blocks JFI’s Closed Life and Annuity Blocks segment is primarily composed of blocks of business that have been acquired since 2004. Th e segment includes various protection products, primarily whole life, universal life, variable universal life, and term life insurance products as well as fixed, fixed index, and payout annuities. The Company historically offered tradit ion al and interest - sensitive life insurance products but discontinued new sales of life insurance products in 2012, as we believe opportunistically acquiring mature blocks of life insurance policies is a more efficient means of diversifying our in - force business than selling new life insurance products. The profitability of JFI's Closed Life and Annuity Blocks segment is largely driven by its historical ability to appropriatel y p rice its products and purchase appropriately priced blocks of business, as realized through underwriting, expense and net gains (losses) on derivatives and investments, and the ability to earn an assumed rate of return on the assets suppor tin g that business. Variable Annuity (VA) - An annuity that offers tax - deferred investment into a range of asset classes and a variable return, which offers insurance fea tures related to potential future income payments. 24