Shareholder Report
|
12 Months Ended |
|
Feb. 28, 2026
USD ($)
Holding
|
|---|
| Shareholder Report [Line Items] |
|
| Document Type |
N-CSR
|
| Amendment Flag |
false
|
| Registrant Name |
SEI CATHOLIC VALUES TRUST
|
| Entity Central Index Key |
0001627853
|
| Entity Investment Company Type |
N-1A
|
| Document Period End Date |
Feb. 28, 2026
|
| C000152590 |
|
| Shareholder Report [Line Items] |
|
| Fund Name |
Catholic Values Equity Fund
|
| Class Name |
Class F Shares
|
| Trading Symbol |
CAVAX
|
| Annual or Semi-Annual Statement [Text Block] |
Annual Shareholder Report
|
| Shareholder Report Annual or Semi-Annual |
annual shareholder report
|
| Additional Information [Text Block] |
This annual shareholder report contains important information about Catholic Values Equity Fund (the "Fund") Class F Shares for the 12-month period ending February 28, 2026. You can find additional information about the Fund at https://www.seic.com/mutual-fund-documentation/prospectuses-and-reports. You can also request this information by contacting us at 610-676-1000.
|
| Expenses [Text Block] |
What were the Fund costs for the last year?(based on a hypothetical $10,000 investment) Table SummaryFund Name | Costs of a $10,000 investment | Costs paid as a percentage of a $10,000 investment |
|---|
Catholic Values Equity Fund, Class F Shares | $93 | 0.86% |
|---|
|
| Expenses Paid, Amount |
$ 93
|
| Expense Ratio, Percent |
0.86%
|
| Factors Affecting Performance [Text Block] |
How did the Fund perform in the last year?The Fund underperformed its blended benchmark, the Russell 3000 Index (80%) and the MSCI ACWI ex-U.S. Index (20%), for the 12-month period ending February 28, 2026. Fund performance was hampered by the underperformance of the international equity managers as their portfolios were tilted toward quality stocks, which significantly lagged the overall international markets during the reporting period. Within the Fund’s international equity segment, underweight allocations to the financials and energy sectors detracted from relative performance as those sectors performed well within the MSCI ACWI ex-U.S. Index. Among the Fund’s sub-advisers, Lazard Asset Management underperformed as its international equity portfolio was tilted toward quality and was hampered by underweights to banks, energy, and materials stocks. Although Brickwood Asset Management benefited from its international value exposure, stock selection within the industrials sector of its international portfolio detracted from performance. Copeland Capital Management’s small-/mid-cap equity portfolio underperformed due to its lower beta (a measure of the volatility of a stock or other asset relative to a particular benchmark) positioning, higher-quality positioning, and stock selection within the financials sector. Leeward Investments benefited from stock selection within the information technology sector, while selection within the materials sector weighed on performance. Overall, Leeward Investments outperformed the Fund’s blended benchmark as small-cap value stocks generally outperformed for the period. Brandywine Global Investment Management’s U.S. large-cap portfolio outperformed for the reporting period due to favorable stock selection within the consumer discretionary, consumer staples, and utilities sectors. Copeland Capital Management’s large-cap portfolio’s underperformance was attributable to its lower-beta and higher-quality positioning. Acadian Asset Management’s performance outpaced its U.S. equity benchmark due to favorable stock selection within the information technology sector, but lagged relative to the Fund’s blended benchmark because U.S. large cap stocks generally underperformed international markets for the period. |
| Performance Past Does Not Indicate Future [Text] |
Past performance is not indicative of future performance.
|
| Average Annual Return [Table Text Block] |
Average Annual Total Returns as of February 28, 2026Table SummaryFund/Index Name | 1 Year | 5 Years | 10 Years |
|---|
Catholic Values Equity Fund, Class F Shares | 16.37% | 10.02% | 12.66% |
|---|
S&P 500 Index (USD) (TR)Footnote Reference* | 16.99% | 14.19% | 15.50% |
|---|
Russell 3000 Index (USD) (TR)Footnote Reference* | 17.02% | 12.80% | 15.08% |
|---|
80/20 Russell 3000 & MSCI ACWI ex-U.S.Footnote Reference† | 21.36% | 12.27% | 14.21% |
|---|
|
| No Deduction of Taxes [Text Block] |
The table and graph presented above do not reflect the deduction of taxes a shareholder would pay on Fund distributions or the redemption of Fund Shares.
|
| AssetsNet |
$ 428,671,000
|
| Holdings Count | Holding |
983
|
| Advisory Fees Paid, Amount |
$ 1,673
|
| InvestmentCompanyPortfolioTurnover |
21.00%
|
| Additional Fund Statistics [Text Block] |
Key Fund Statistics as of February 28, 2026Table Summary | Total Net Assets (000's) | Number of Holdings | Total Advisory Fees Paid (000's) | Portfolio Turnover Rate |
|---|
| $428,671 | 983 | $1,673 | 21% |
|---|
|
| Holdings [Text Block] |
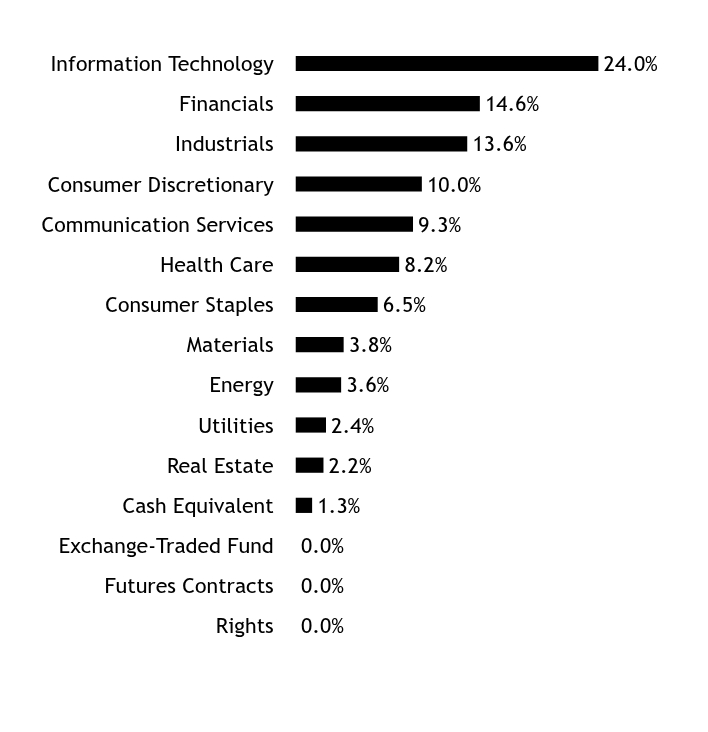
Asset WeightingsFootnote Reference*Table SummaryValue | Value |
|---|
Rights | 0.0% | Futures Contracts | 0.0% | Exchange-Traded Fund | 0.0% | Cash Equivalent | 1.3% | Real Estate | 2.2% | Utilities | 2.4% | Energy | 3.6% | Materials | 3.8% | Consumer Staples | 6.5% | Health Care | 8.2% | Communication Services | 9.3% | Consumer Discretionary | 10.0% | Industrials | 13.6% | Financials | 14.6% | Information Technology | 24.0% | | Footnote | Description | Footnote* | Percentages are calculated based on total net assets. |
|
| Largest Holdings [Text Block] |
Table SummaryHolding Name | | | Percentage of
Total Net AssetsFootnote Reference(A) |
|---|
Apple Inc | | | 3.0% | NVIDIA Corp | | | 2.6% | Microsoft Corp | | | 2.5% | Alphabet Inc, Cl A | | | 2.1% | Broadcom Inc | | | 1.5% | Amazon.com Inc | | | 1.3% | Meta Platforms Inc, Cl A | | | 1.1% | Alphabet Inc, Cl C | | | 1.1% | JPMorgan Chase & Co | | | 1.0% | Taiwan Semiconductor Manufacturing Co Ltd ADR | | | 1.0% | | Footnote | Description | Footnote(A) | Cash Equivalents are not shown in the top ten chart. |
|
| Material Fund Change [Text Block] |
There were no material changes to the Fund during the reporting period. |
| C000152591 |
|
| Shareholder Report [Line Items] |
|
| Fund Name |
Catholic Values Equity Fund
|
| Class Name |
Class Y Shares
|
| Trading Symbol |
CAVYX
|
| Annual or Semi-Annual Statement [Text Block] |
Annual Shareholder Report
|
| Shareholder Report Annual or Semi-Annual |
annual shareholder report
|
| Additional Information [Text Block] |
This annual shareholder report contains important information about Catholic Values Equity Fund (the "Fund") Class Y Shares for the 12-month period ending February 28, 2026. You can find additional information about the Fund at https://www.seic.com/mutual-fund-documentation/prospectuses-and-reports. You can also request this information by contacting us at 610-676-1000.
|
| Expenses [Text Block] |
What were the Fund costs for the last year?(based on a hypothetical $10,000 investment) Table SummaryFund Name | Costs of a $10,000 investment | Costs paid as a percentage of a $10,000 investment |
|---|
Catholic Values Equity Fund, Class Y Shares | $82 | 0.76% |
|---|
|
| Expenses Paid, Amount |
$ 82
|
| Expense Ratio, Percent |
0.76%
|
| Factors Affecting Performance [Text Block] |
How did the Fund perform in the last year?The Fund underperformed its blended benchmark, the Russell 3000 Index (80%) and the MSCI ACWI ex-U.S. Index (20%), for the 12-month period ending February 28, 2026. Fund performance was hampered by the underperformance of the international equity managers as their portfolios were tilted toward quality stocks, which significantly lagged the overall international markets during the reporting period. Within the Fund’s international equity segment, underweight allocations to the financials and energy sectors detracted from relative performance as those sectors performed well within the MSCI ACWI ex-U.S. Index. Among the Fund’s sub-advisers, Lazard Asset Management underperformed as its international equity portfolio was tilted toward quality and was hampered by underweights to banks, energy, and materials stocks. Although Brickwood Asset Management benefited from its international value exposure, stock selection within the industrials sector of its international portfolio detracted from performance. Copeland Capital Management’s small-/mid-cap equity portfolio underperformed due to its lower beta (a measure of the volatility of a stock or other asset relative to a particular benchmark) positioning, higher-quality positioning, and stock selection within the financials sector. Leeward Investments benefited from stock selection within the information technology sector, while selection within the materials sector weighed on performance. Overall, Leeward Investments outperformed the Fund’s blended benchmark as small-cap value stocks generally outperformed for the period. Brandywine Global Investment Management’s U.S. large-cap portfolio outperformed for the reporting period due to favorable stock selection within the consumer discretionary, consumer staples, and utilities sectors. Copeland Capital Management’s large-cap portfolio’s underperformance was attributable to its lower-beta and higher-quality positioning. Acadian Asset Management’s performance outpaced its U.S. equity benchmark due to favorable stock selection within the information technology sector, but lagged relative to the Fund’s blended benchmark because U.S. large cap stocks generally underperformed international markets for the period. |
| Performance Past Does Not Indicate Future [Text] |
Past performance is not indicative of future performance.
|
| Average Annual Return [Table Text Block] |
Average Annual Total Returns as of February 28, 2026Table SummaryFund/Index Name | 1 Year | 5 Years | 10 Years |
|---|
Catholic Values Equity Fund, Class Y Shares | 16.50% | 10.11% | 12.77% |
|---|
S&P 500 Index (USD) (TR)Footnote Reference* | 16.99% | 14.19% | 15.50% |
|---|
Russell 3000 Index (USD) (TR)Footnote Reference* | 17.02% | 12.80% | 15.08% |
|---|
80/20 Russell 3000 & MSCI ACWI ex-U.S.Footnote Reference† | 21.36% | 12.27% | 14.21% |
|---|
|
| No Deduction of Taxes [Text Block] |
The table and graph presented above do not reflect the deduction of taxes a shareholder would pay on Fund distributions or the redemption of Fund Shares.
|
| AssetsNet |
$ 428,671,000
|
| Holdings Count | Holding |
983
|
| Advisory Fees Paid, Amount |
$ 1,673
|
| InvestmentCompanyPortfolioTurnover |
21.00%
|
| Additional Fund Statistics [Text Block] |
Key Fund Statistics as of February 28, 2026Table Summary | Total Net Assets (000's) | Number of Holdings | Total Advisory Fees Paid (000's) | Portfolio Turnover Rate |
|---|
| $428,671 | 983 | $1,673 | 21% |
|---|
|
| Holdings [Text Block] |
Asset WeightingsFootnote Reference*Table SummaryValue | Value |
|---|
Rights | 0.0% | Futures Contracts | 0.0% | Exchange-Traded Fund | 0.0% | Cash Equivalent | 1.3% | Real Estate | 2.2% | Utilities | 2.4% | Energy | 3.6% | Materials | 3.8% | Consumer Staples | 6.5% | Health Care | 8.2% | Communication Services | 9.3% | Consumer Discretionary | 10.0% | Industrials | 13.6% | Financials | 14.6% | Information Technology | 24.0% | | Footnote | Description | Footnote* | Percentages are calculated based on total net assets. |
|
| Largest Holdings [Text Block] |
Table SummaryHolding Name | | | Percentage of
Total Net AssetsFootnote Reference(A) |
|---|
Apple Inc | | | 3.0% | NVIDIA Corp | | | 2.6% | Microsoft Corp | | | 2.5% | Alphabet Inc, Cl A | | | 2.1% | Broadcom Inc | | | 1.5% | Amazon.com Inc | | | 1.3% | Meta Platforms Inc, Cl A | | | 1.1% | Alphabet Inc, Cl C | | | 1.1% | JPMorgan Chase & Co | | | 1.0% | Taiwan Semiconductor Manufacturing Co Ltd ADR | | | 1.0% | | Footnote | Description | Footnote(A) | Cash Equivalents are not shown in the top ten chart. |
|
| Material Fund Change [Text Block] |
There were no material changes to the Fund during the reporting period. |
| C000152592 |
|
| Shareholder Report [Line Items] |
|
| Fund Name |
Catholic Values Fixed Income Fund
|
| Class Name |
Class F Shares
|
| Trading Symbol |
CFVAX
|
| Annual or Semi-Annual Statement [Text Block] |
Annual Shareholder Report
|
| Shareholder Report Annual or Semi-Annual |
annual shareholder report
|
| Additional Information [Text Block] |
This annual shareholder report contains important information about Catholic Values Fixed Income Fund (the "Fund") Class F Shares for the 12-month period ending February 28, 2026. You can find additional information about the Fund at https://www.seic.com/mutual-fund-documentation/prospectuses-and-reports. You can also request this information by contacting us at 610-676-1000.
|
| Expenses [Text Block] |
What were the Fund costs for the last year?(based on a hypothetical $10,000 investment) Table SummaryFund Name | Costs of a $10,000 investment | Costs paid as a percentage of a $10,000 investment |
|---|
Catholic Values Fixed Income Fund, Class F Shares | $73 | 0.71% |
|---|
|
| Expenses Paid, Amount |
$ 73
|
| Expense Ratio, Percent |
0.71%
|
| Factors Affecting Performance [Text Block] |
How did the Fund perform in the last year?The Fund modestly underperformed its benchmark, the Bloomberg U.S. Aggregate Bond Index, for the 12-month period ending February 28, 2026. In the second half of 2025, the Federal Reserve (Fed) implemented three 25-basis-point (0.25%) interest-rate cuts, bringing the target range on the federal funds rate to a range of 3.50%-3.75% before pausing at its January 2026 meeting. Inflation was relatively stable during the reporting period. The core personal-consumption expenditures (PCE) price index, which tracks the prices that consumers pay for goods and services to reveal underlying inflation trends, rose 3.0% in December 2025 (the most recent reporting period), as evolving tariff policy during the year maintained pressure on consumer prices. An overweight to agency mortgage-backed securities (MBS) contributed positively to Fund performance for the reporting period as the sector benefited from favorable technicals (statistical trends gathered from trading activity, such as price movement and volume) and interest-rate volatility, as measured by the Merrill Lynch Option Volatility Estimate (MOVE) index, declined over the reporting period. Security selection within the sector benefited performance as well. A slight underweight to corporates detracted from performance as credit spreads remained tight. Fund performance also was bolstered by an overweight to asset-backed securities (ABS), where the managers preferred prime tranches in auto loans and credit cards, as well as AAA rated collateralized loan obligations (CLOs). Additionally, an overweight to CMBS enhanced Fund performance. Detractors from performance included a slight overweight to taxable municipal bonds and an underweight to non-corporate bonds as emerging-market U.S. dollar-denominated sovereign bonds outperformed. A long duration posture benefited performance as U.S. Treasury yields moved lower across the curve. Among the Fund’s sub-advisers, Metropolitan West Asset Management, LLC benefited from an overweight to agency MBS and a long duration posture, while an underweight to corporate bonds detracted. Income Research + Management was bolstered by positioning within ABS, while an underweight to non-corporate bonds had a negative impact on performance. |
| Performance Past Does Not Indicate Future [Text] |
Past performance is not indicative of future performance.
|
| Average Annual Return [Table Text Block] |
Average Annual Total Returns as of February 28, 2026Table SummaryFund/Index Name | 1 Year | 5 Years | 10 Years |
|---|
Catholic Values Fixed Income Fund, Class F Shares | 5.98% | 0.02% | 2.04% |
|---|
Bloomberg U.S. Aggregate Bond Index (USD) (TR)Footnote Reference* | 6.26% | 0.42% | 1.97% |
|---|
|
| No Deduction of Taxes [Text Block] |
The table and graph presented above do not reflect the deduction of taxes a shareholder would pay on Fund distributions or the redemption of Fund Shares.
|
| AssetsNet |
$ 253,416,000
|
| Holdings Count | Holding |
978
|
| Advisory Fees Paid, Amount |
$ 706
|
| InvestmentCompanyPortfolioTurnover |
321.00%
|
| Additional Fund Statistics [Text Block] |
Key Fund Statistics as of February 28, 2026Table Summary | Total Net Assets (000's) | Number of Holdings | Total Advisory Fees Paid (000's) | Portfolio Turnover Rate |
|---|
| $253,416 | 978 | $706 | 321% |
|---|
|
| Holdings [Text Block] |
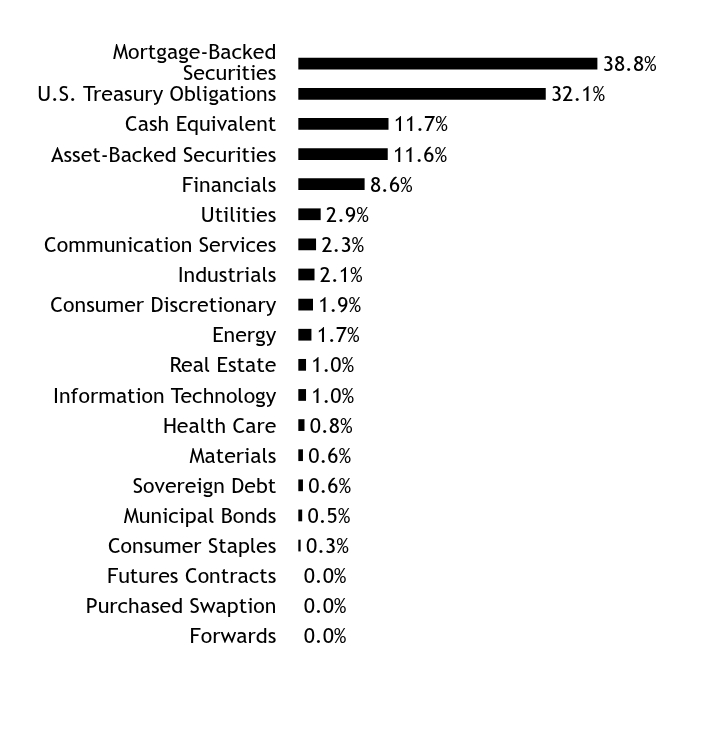
Asset WeightingsFootnote Reference*Table SummaryValue | Value |
|---|
Forwards | 0.0% | Purchased Swaption | 0.0% | Futures Contracts | 0.0% | Consumer Staples | 0.3% | Municipal Bonds | 0.5% | Sovereign Debt | 0.6% | Materials | 0.6% | Health Care | 0.8% | Information Technology | 1.0% | Real Estate | 1.0% | Energy | 1.7% | Consumer Discretionary | 1.9% | Industrials | 2.1% | Communication Services | 2.3% | Utilities | 2.9% | Financials | 8.6% | Asset-Backed Securities | 11.6% | Cash Equivalent | 11.7% | U.S. Treasury Obligations | 32.1% | Mortgage-Backed Securities | 38.8% | | Footnote | Description | Footnote* | Percentages are calculated based on total net assets. |
|
| Largest Holdings [Text Block] |
Table SummaryHolding Name | Coupon Rate | Maturity Date | Percentage of Total
Net AssetsFootnote Reference(A) |
|---|
U.S. Treasury Notes | 3.500%
| 02/28/31
| 5.7% | U.S. Treasury Bonds | 4.750%
| 02/15/56
| 4.0% | U.S. Treasury Notes | 3.375%
| 02/29/28
| 3.8% | U.S. Treasury Notes | 4.125%
| 02/15/36
| 2.1% | U.S. Treasury Bonds | 4.875%
| 08/15/45
| 2.0% | UMBS | 3.500%
| 03/15/56
| 1.9% | U.S. Treasury Notes | 4.000%
| 05/31/30
| 1.2% | U.S. Treasury Notes | 3.750%
| 02/28/33
| 1.2% | UMBS | 4.000%
| 03/15/56
| 1.2% | U.S. Treasury Bonds | 3.625%
| 05/15/53
| 1.1% | | Footnote | Description | Footnote(A) | Cash Equivalents are not shown in the top ten chart. |
|
| Material Fund Change [Text Block] |
There were no material changes to the Fund during the reporting period. |
| C000152593 |
|
| Shareholder Report [Line Items] |
|
| Fund Name |
Catholic Values Fixed Income Fund
|
| Class Name |
Class Y Shares
|
| Trading Symbol |
CFVYX
|
| Annual or Semi-Annual Statement [Text Block] |
Annual Shareholder Report
|
| Shareholder Report Annual or Semi-Annual |
annual shareholder report
|
| Additional Information [Text Block] |
This annual shareholder report contains important information about Catholic Values Fixed Income Fund (the "Fund") Class Y Shares for the 12-month period ending February 28, 2026. You can find additional information about the Fund at https://www.seic.com/mutual-fund-documentation/prospectuses-and-reports. You can also request this information by contacting us at 610-676-1000.
|
| Expenses [Text Block] |
What were the Fund costs for the last year?(based on a hypothetical $10,000 investment) Table SummaryFund Name | Costs of a $10,000 investment | Costs paid as a percentage of a $10,000 investment |
|---|
Catholic Values Fixed Income Fund, Class Y Shares | $63 | 0.61% |
|---|
|
| Expenses Paid, Amount |
$ 63
|
| Expense Ratio, Percent |
0.61%
|
| Factors Affecting Performance [Text Block] |
How did the Fund perform in the last year?The Fund modestly underperformed its benchmark, the Bloomberg U.S. Aggregate Bond Index, for the 12-month period ending February 28, 2026. In the second half of 2025, the Federal Reserve (Fed) implemented three 25-basis-point (0.25%) interest-rate cuts, bringing the target range on the federal funds rate to a range of 3.50%-3.75% before pausing at its January 2026 meeting. Inflation was relatively stable during the reporting period. The core personal-consumption expenditures (PCE) price index, which tracks the prices that consumers pay for goods and services to reveal underlying inflation trends, rose 3.0% in December 2025 (the most recent reporting period), as evolving tariff policy during the year maintained pressure on consumer prices. An overweight to agency mortgage-backed securities (MBS) contributed positively to Fund performance for the reporting period as the sector benefited from favorable technicals (statistical trends gathered from trading activity, such as price movement and volume) and interest-rate volatility, as measured by the Merrill Lynch Option Volatility Estimate (MOVE) index, declined over the reporting period. Security selection within the sector benefited performance as well. A slight underweight to corporates detracted from performance as credit spreads remained tight. Fund performance also was bolstered by an overweight to asset-backed securities (ABS), where the managers preferred prime tranches in auto loans and credit cards, as well as AAA rated collateralized loan obligations (CLOs). Additionally, an overweight to CMBS enhanced Fund performance. Detractors from performance included a slight overweight to taxable municipal bonds and an underweight to non-corporate bonds as emerging-market U.S. dollar-denominated sovereign bonds outperformed. A long duration posture benefited performance as U.S. Treasury yields moved lower across the curve. Among the Fund’s sub-advisers, Metropolitan West Asset Management, LLC benefited from an overweight to agency MBS and a long duration posture, while an underweight to corporate bonds detracted. Income Research + Management was bolstered by positioning within ABS, while an underweight to non-corporate bonds had a negative impact on performance. |
| Performance Past Does Not Indicate Future [Text] |
Past performance is not indicative of future performance.
|
| Average Annual Return [Table Text Block] |
Average Annual Total Returns as of February 28, 2026Table SummaryFund/Index Name | 1 Year | 5 Years | 10 Years |
|---|
Catholic Values Fixed Income Fund, Class Y Shares | 6.08% | 0.08% | 2.13% |
|---|
Bloomberg U.S. Aggregate Bond Index (USD) (TR)Footnote Reference* | 6.26% | 0.42% | 1.97% |
|---|
|
| No Deduction of Taxes [Text Block] |
The table and graph presented above do not reflect the deduction of taxes a shareholder would pay on Fund distributions or the redemption of Fund Shares.
|
| AssetsNet |
$ 253,416,000
|
| Holdings Count | Holding |
978
|
| Advisory Fees Paid, Amount |
$ 706
|
| InvestmentCompanyPortfolioTurnover |
321.00%
|
| Additional Fund Statistics [Text Block] |
Key Fund Statistics as of February 28, 2026Table Summary | Total Net Assets (000's) | Number of Holdings | Total Advisory Fees Paid (000's) | Portfolio Turnover Rate |
|---|
| $253,416 | 978 | $706 | 321% |
|---|
|
| Holdings [Text Block] |
Asset WeightingsFootnote Reference*Table SummaryValue | Value |
|---|
Forwards | 0.0% | Purchased Swaption | 0.0% | Futures Contracts | 0.0% | Consumer Staples | 0.3% | Municipal Bonds | 0.5% | Sovereign Debt | 0.6% | Materials | 0.6% | Health Care | 0.8% | Information Technology | 1.0% | Real Estate | 1.0% | Energy | 1.7% | Consumer Discretionary | 1.9% | Industrials | 2.1% | Communication Services | 2.3% | Utilities | 2.9% | Financials | 8.6% | Asset-Backed Securities | 11.6% | Cash Equivalent | 11.7% | U.S. Treasury Obligations | 32.1% | Mortgage-Backed Securities | 38.8% | | Footnote | Description | Footnote* | Percentages are calculated based on total net assets. |
|
| Largest Holdings [Text Block] |
Table SummaryHolding Name | Coupon Rate | Maturity Date | Percentage of Total
Net AssetsFootnote Reference(A) |
|---|
U.S. Treasury Notes | 3.500%
| 02/28/31
| 5.7% | U.S. Treasury Bonds | 4.750%
| 02/15/56
| 4.0% | U.S. Treasury Notes | 3.375%
| 02/29/28
| 3.8% | U.S. Treasury Notes | 4.125%
| 02/15/36
| 2.1% | U.S. Treasury Bonds | 4.875%
| 08/15/45
| 2.0% | UMBS | 3.500%
| 03/15/56
| 1.9% | U.S. Treasury Notes | 4.000%
| 05/31/30
| 1.2% | U.S. Treasury Notes | 3.750%
| 02/28/33
| 1.2% | UMBS | 4.000%
| 03/15/56
| 1.2% | U.S. Treasury Bonds | 3.625%
| 05/15/53
| 1.1% | | Footnote | Description | Footnote(A) | Cash Equivalents are not shown in the top ten chart. |
|
| Material Fund Change [Text Block] |
There were no material changes to the Fund during the reporting period. |