v3.26.1
Pay vs Performance Disclosure - USD ($)
12 Months Ended
Jan. 31, 2026
Jan. 31, 2025
Pay vs Performance Disclosure    
Pay vs Performance Disclosure, Table

Pay-versus-Performance

As required by Item 402(v) of Regulation S-K under the Securities Act (“Item 402(v)”), the following table sets forth information about the relationship between executive “compensation actually paid” to Mr. Mahdessian, our PEO, and our other NEOs (for purposes of this section, the “Non-PEO NEOs”) and certain indicators of our performance. Item 402(v) requires the amounts included in the “compensation actually paid” columns of the table below to be calculated according to a specific formula that treats the increase or decrease in the fair value of outstanding equity awards as amounts “actually paid” to the NEO, regardless of whether the NEO realized any gain from such fluctuation in equity value. Given that equity awards constitute a significant portion of our NEOs’ total potential compensation, changes in the fair value of vested and unvested equity awards will have a significant effect on the amounts shown in the “compensation actually paid” columns of the table below. For further information concerning our executive compensation philosophy, and how we align executive compensation to performance, please refer to the section titled “Compensation Discussion and Analysis”.


Summary


Average
Summary


Average
Compensation


Value of Initial Fixed $100
Investment Based On:


Fiscal Year(1)


Compensation
Table Total
for
PEO ($)
(2)


Compensation
Actually
Paid
to PEO ($)
(3)


Compensation
Table Total for
Non-PEO
NEOs ($)
(4)


Actually
Paid
to Non-PEO
NEOs ($)
(5)


Total
Shareholder
Return ($)
(6)


Peer Group
Total
Shareholder
Return ($)
(7)


Net Income
(millions)
($)
(8)


Subscription Revenue
(millions) ($)
(9)


2026


1,629,802


(89,860,827

)


4,940,996


(44,679,578

)


$

77.56


120.21


(159.9

)


712.3


2025


133,409,208


278,139,614


70,745,385


151,024,154


$

101.75


95.69


(239.1

)


565.7


(1)
We were not a reporting company pursuant to Section 13(a) or Section 15(d) of the Exchange Act prior to fiscal year 2025 and, as such, we have not included any information in this table for periods prior to fiscal year 2025. For each of fiscal year 2025 and 2026, our PEO was Mr. Mahdessian and our Non-PEO NEOs were Messrs. Kuzoyan and Sherry.
(2)
The amounts shown are the amounts of total compensation listed for our PEO for the corresponding fiscal year in the Total column of the Summary Compensation Table.
(3)
The amounts reported in this column represent the amount of “compensation actually paid” to Mr. Mahdessian for each fiscal year, as computed in accordance with Item 402(v). The amounts do not reflect the actual amount of compensation earned or received by or paid to Mr. Mahdessian during the applicable fiscal year. We did not report a change in pension value for any of the fiscal years reflected in this table; therefore, a deduction from the Summary Compensation Table total related to pension value is not applicable. In accordance with the requirements of Item 402(v), the following adjustments were made to Mr. Mahdessian’s total compensation for each fiscal year to determine the compensation actually paid:


Fiscal Year

Summary Compensation Table Total
($)


Subtract Summary Compensation Table Equity Total
($)


Add Year End Fair Value of Equity Awards Granted During Year that are Outstanding and Unvested ($)


Add Year over Year Change in Fair Value of Outstanding and Unvested Equity Awards ($)


Add Fair Value as of Vesting Date of Equity Awards Granted and Vested in the Year
($)


Add Year over Year Change as of Vesting Date (from Year End) in Fair Value of Equity Awards Granted in Prior Years that Vested in the Year
($)


Subtract Fair Value at prior year-end of any awards that failed to meet vesting conditions
($)


Total Equity Award Adjustment
($)


Compensation Actually Paid
($)


2026


1,629,802


0


0


(91,541,396

)


0


50,767


0


(91,490,629

)


(89,860,827

)

2025


133,409,208


(131,781,064

)


251,032,921


21,836,961


0


3,641,588


0


144,730,406


278,139,614


(4)
The amounts reported in this column represent the average of the amounts reported for the Non-PEO NEOs for each corresponding fiscal year in the “Total” column of the Summary Compensation Table.
(5)
The amounts reported in this column represent the average amount of “compensation actually paid” to the Non-PEO NEOs, as computed in accordance with Item 402(v). The amounts do not reflect the actual average amount of compensation earned or received by or paid to the Non-PEO NEOs as a group during the applicable fiscal year. We did not report a change in pension value for any of the fiscal years reflected in this table; therefore, a deduction from the Summary Compensation Table total related to pension value is not applicable. In accordance with the requirements of Item 402(v), the following adjustments were made to the average total compensation for the Non-PEO NEOs as a group for each fiscal year to determine the compensation actually paid:


Fiscal Year

Average Summary Compensation Table Total
($)


Subtract Average Summary Compensation Table Equity Total
($)


Add Average Year End Fair Value of Equity Awards Granted During Year that are Outstanding and Unvested ($)


Add Average Year over Year Change in Fair Value of Outstanding and Unvested Equity Awards ($)


Add Average Fair Value as of Vesting Date of Equity Awards Granted and Vested in the Year
($)


Add Average Year over Year Change as of Vesting Date (from Year End) in Fair Value of Equity Awards Granted in Prior Years that Vested in the Year
($)


Subtract Average Fair Value at prior year-end of any awards that failed to meet vesting conditions
($)


Total Equity Award Adjustment
($)


Average Compensation Actually Paid
($)


2026


4,940,996


(4,078,764

)


2,250,748


(48,276,325

)


449,153


34,614


0


(49,620,574

)


(44,679,578

)

2025


70,745,385


(69,890,563

)


131,235,046


16,166,339


798,875


1,969,072


0


80,278,769


151,024,154


(6)
Represents the total stockholder return (TSR) of a $100 investment in our stock as of December 12, 2024, the date that our common stock began trading on the Nasdaq Global Select Market, valued again on each of January 31, 2025 and 2026.
(7)
Consistent with the stock performance graph in our Annual Report, this column represents the TSR of the S&P 500 Information Technology Sector Index based on a $100 investment as of December 12, 2024, valued again on each of January 31, 2025 and 2026.
(8)
The amounts reported represent the amount of net income (loss) reflected in our audited financial statements for the applicable fiscal year.
(9)
We have identified subscription revenue as the most important financial performance measure used to link compensation actually paid to our PEO and Non-PEO NEOs to our performance in FY26, as this measure was the highest weighted metric used to determine payouts to our PEO and Non-PEO NEOs under the FY26 Bonus Plan.
 
Company Selected Measure Name Subscription Revenue  
PEO Total Compensation Amount $ 1,629,802 $ 133,409,208
PEO Actually Paid Compensation Amount $ (89,860,827) 278,139,614
Adjustment To PEO Compensation, Footnote
(3)
The amounts reported in this column represent the amount of “compensation actually paid” to Mr. Mahdessian for each fiscal year, as computed in accordance with Item 402(v). The amounts do not reflect the actual amount of compensation earned or received by or paid to Mr. Mahdessian during the applicable fiscal year. We did not report a change in pension value for any of the fiscal years reflected in this table; therefore, a deduction from the Summary Compensation Table total related to pension value is not applicable. In accordance with the requirements of Item 402(v), the following adjustments were made to Mr. Mahdessian’s total compensation for each fiscal year to determine the compensation actually paid:


Fiscal Year

Summary Compensation Table Total
($)


Subtract Summary Compensation Table Equity Total
($)


Add Year End Fair Value of Equity Awards Granted During Year that are Outstanding and Unvested ($)


Add Year over Year Change in Fair Value of Outstanding and Unvested Equity Awards ($)


Add Fair Value as of Vesting Date of Equity Awards Granted and Vested in the Year
($)


Add Year over Year Change as of Vesting Date (from Year End) in Fair Value of Equity Awards Granted in Prior Years that Vested in the Year
($)


Subtract Fair Value at prior year-end of any awards that failed to meet vesting conditions
($)


Total Equity Award Adjustment
($)


Compensation Actually Paid
($)


2026


1,629,802


0


0


(91,541,396

)


0


50,767


0


(91,490,629

)


(89,860,827

)

2025


133,409,208


(131,781,064

)


251,032,921


21,836,961


0


3,641,588


0


144,730,406


278,139,614


Non-PEO NEO Average Total Compensation Amount $ 4,940,996 70,745,385
Non-PEO NEO Average Compensation Actually Paid Amount $ (44,679,578) 151,024,154
Adjustment to Non-PEO NEO Compensation Footnote
(5)
The amounts reported in this column represent the average amount of “compensation actually paid” to the Non-PEO NEOs, as computed in accordance with Item 402(v). The amounts do not reflect the actual average amount of compensation earned or received by or paid to the Non-PEO NEOs as a group during the applicable fiscal year. We did not report a change in pension value for any of the fiscal years reflected in this table; therefore, a deduction from the Summary Compensation Table total related to pension value is not applicable. In accordance with the requirements of Item 402(v), the following adjustments were made to the average total compensation for the Non-PEO NEOs as a group for each fiscal year to determine the compensation actually paid:


Fiscal Year

Average Summary Compensation Table Total
($)


Subtract Average Summary Compensation Table Equity Total
($)


Add Average Year End Fair Value of Equity Awards Granted During Year that are Outstanding and Unvested ($)


Add Average Year over Year Change in Fair Value of Outstanding and Unvested Equity Awards ($)


Add Average Fair Value as of Vesting Date of Equity Awards Granted and Vested in the Year
($)


Add Average Year over Year Change as of Vesting Date (from Year End) in Fair Value of Equity Awards Granted in Prior Years that Vested in the Year
($)


Subtract Average Fair Value at prior year-end of any awards that failed to meet vesting conditions
($)


Total Equity Award Adjustment
($)


Average Compensation Actually Paid
($)


2026


4,940,996


(4,078,764

)


2,250,748


(48,276,325

)


449,153


34,614


0


(49,620,574

)


(44,679,578

)

2025


70,745,385


(69,890,563

)


131,235,046


16,166,339


798,875


1,969,072


0


80,278,769


151,024,154


Compensation Actually Paid vs. Total Shareholder Return

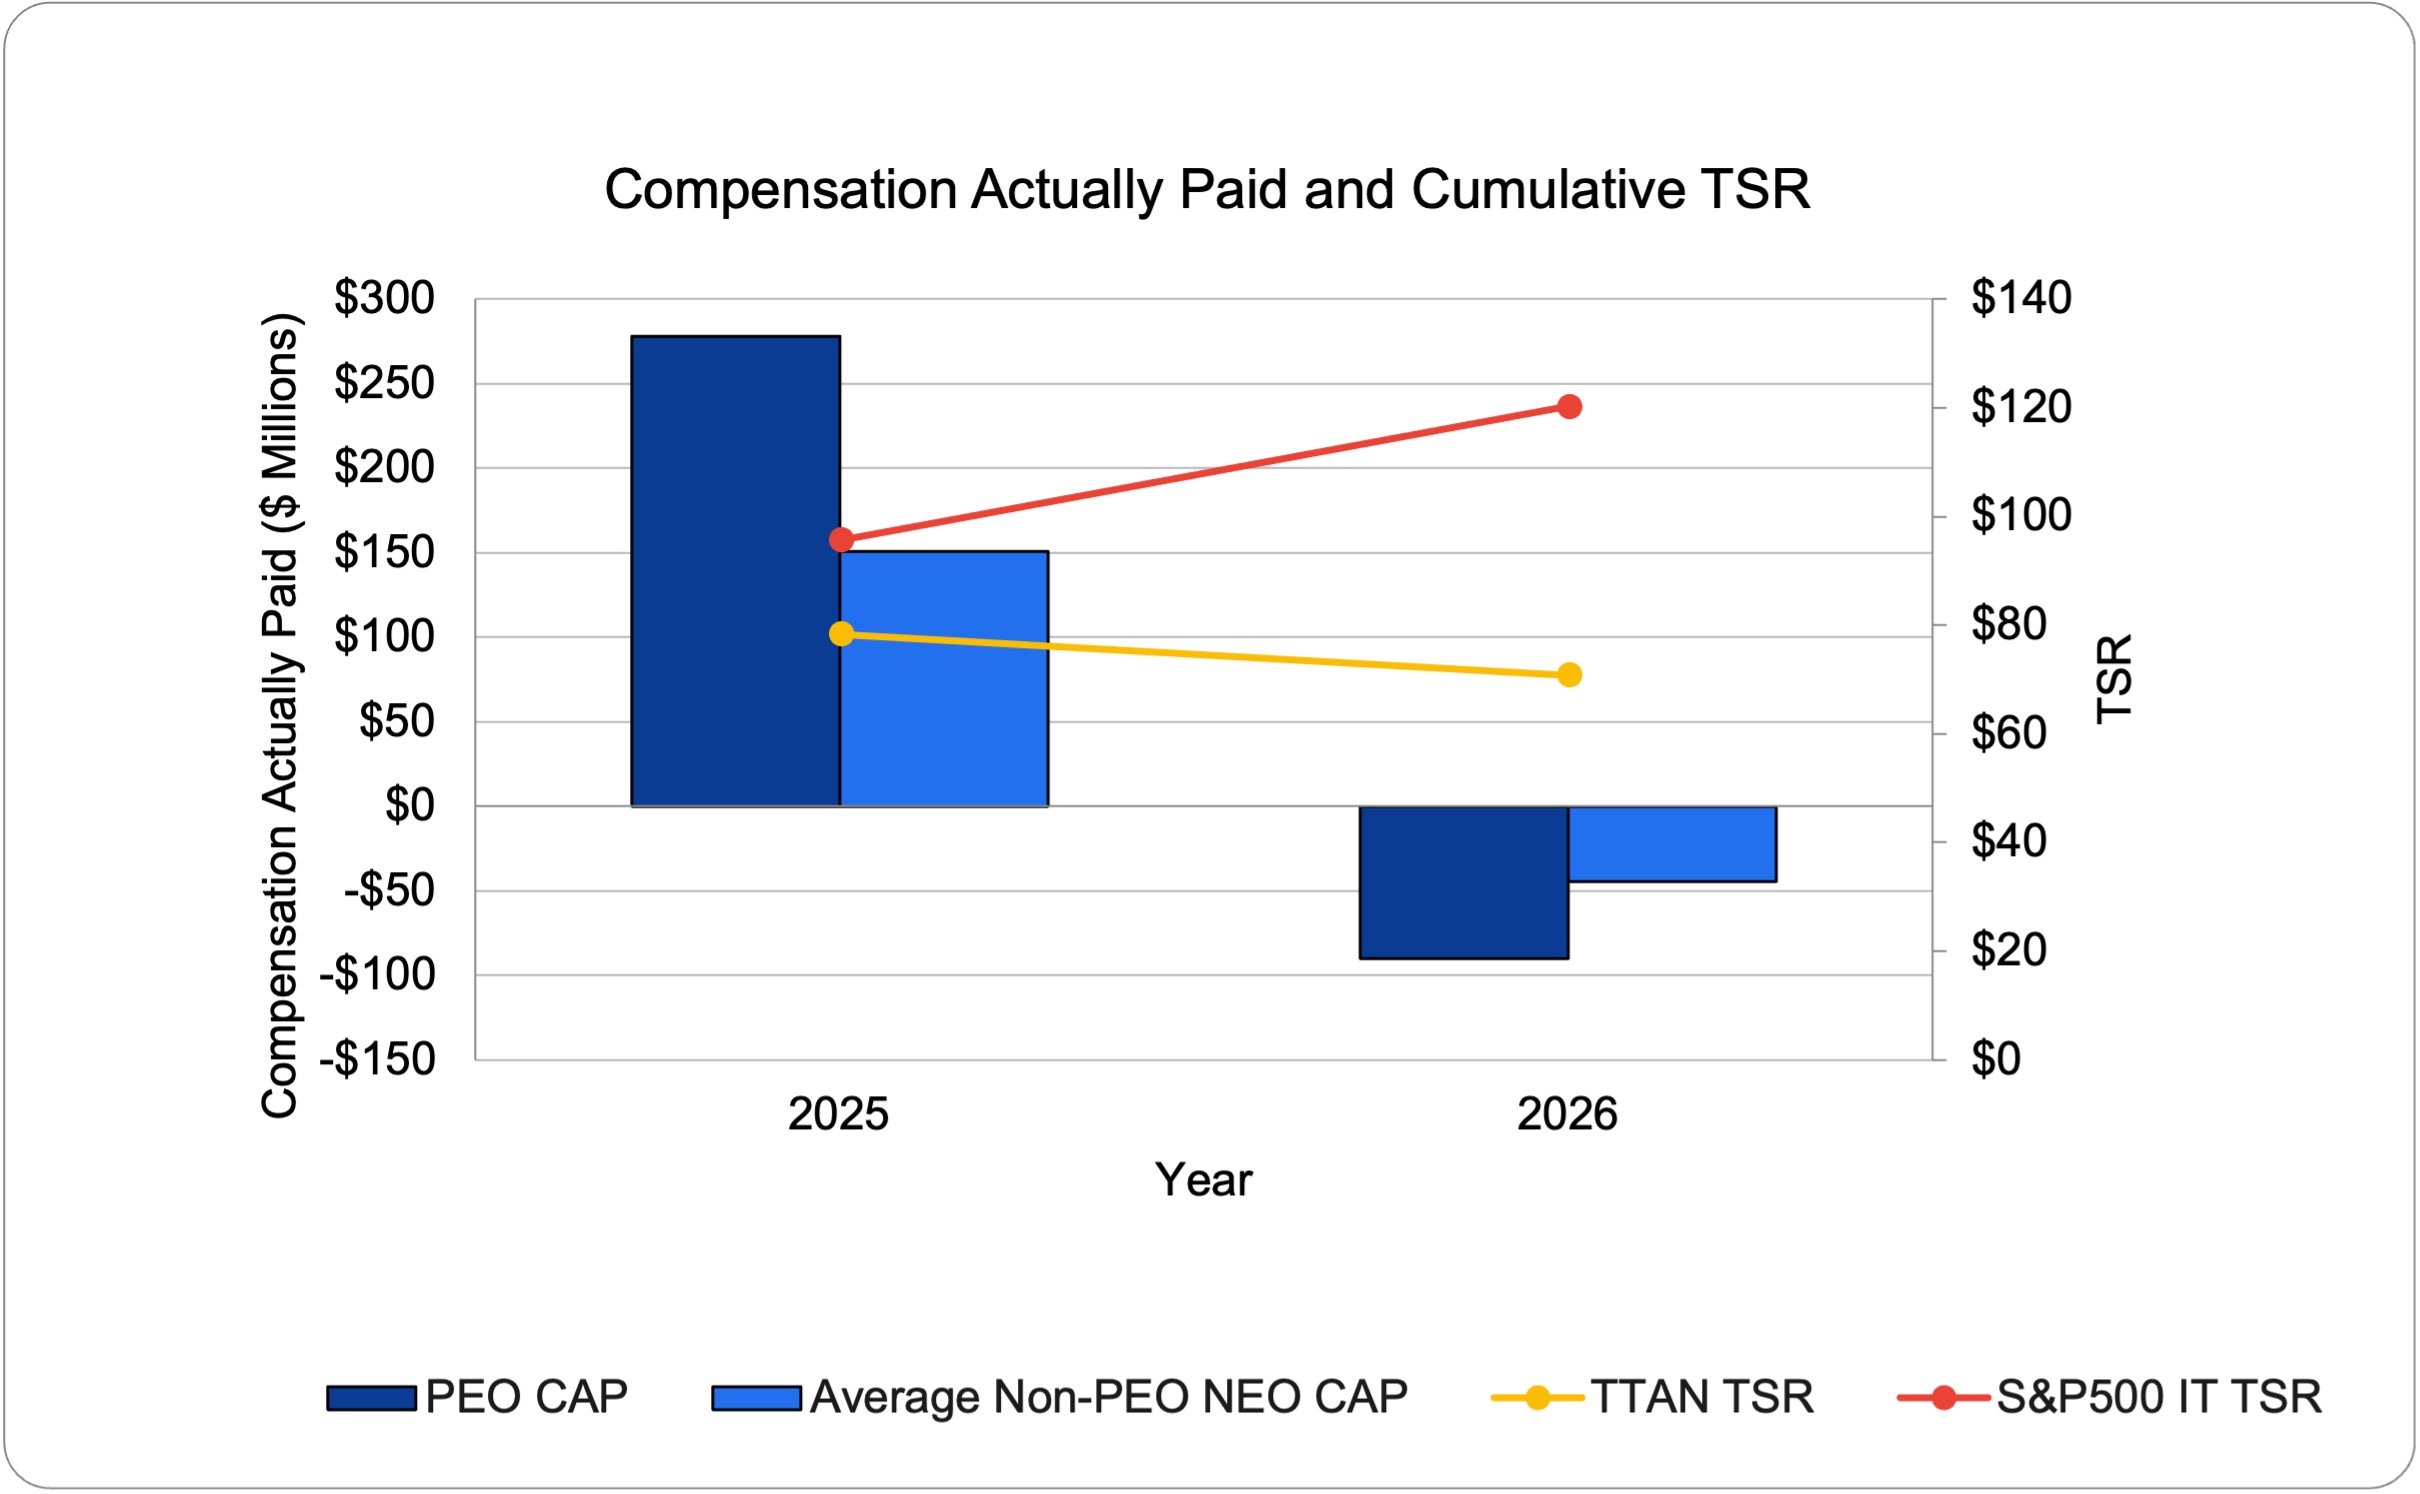
Compensation Actually Paid and Cumulative TSR

The following graph illustrates, for each of the periods presented in the Pay-versus-Performance table, the relationship among (i) compensation actually paid to the PEO and the average of the compensation actually paid to the Non-PEO NEOs, (ii) our cumulative TSR, and (iii) the cumulative TSR of the S&P 500 Information Technology Sector Index peer group.


img78718431_2.jpg

 
Compensation Actually Paid vs. Net Income

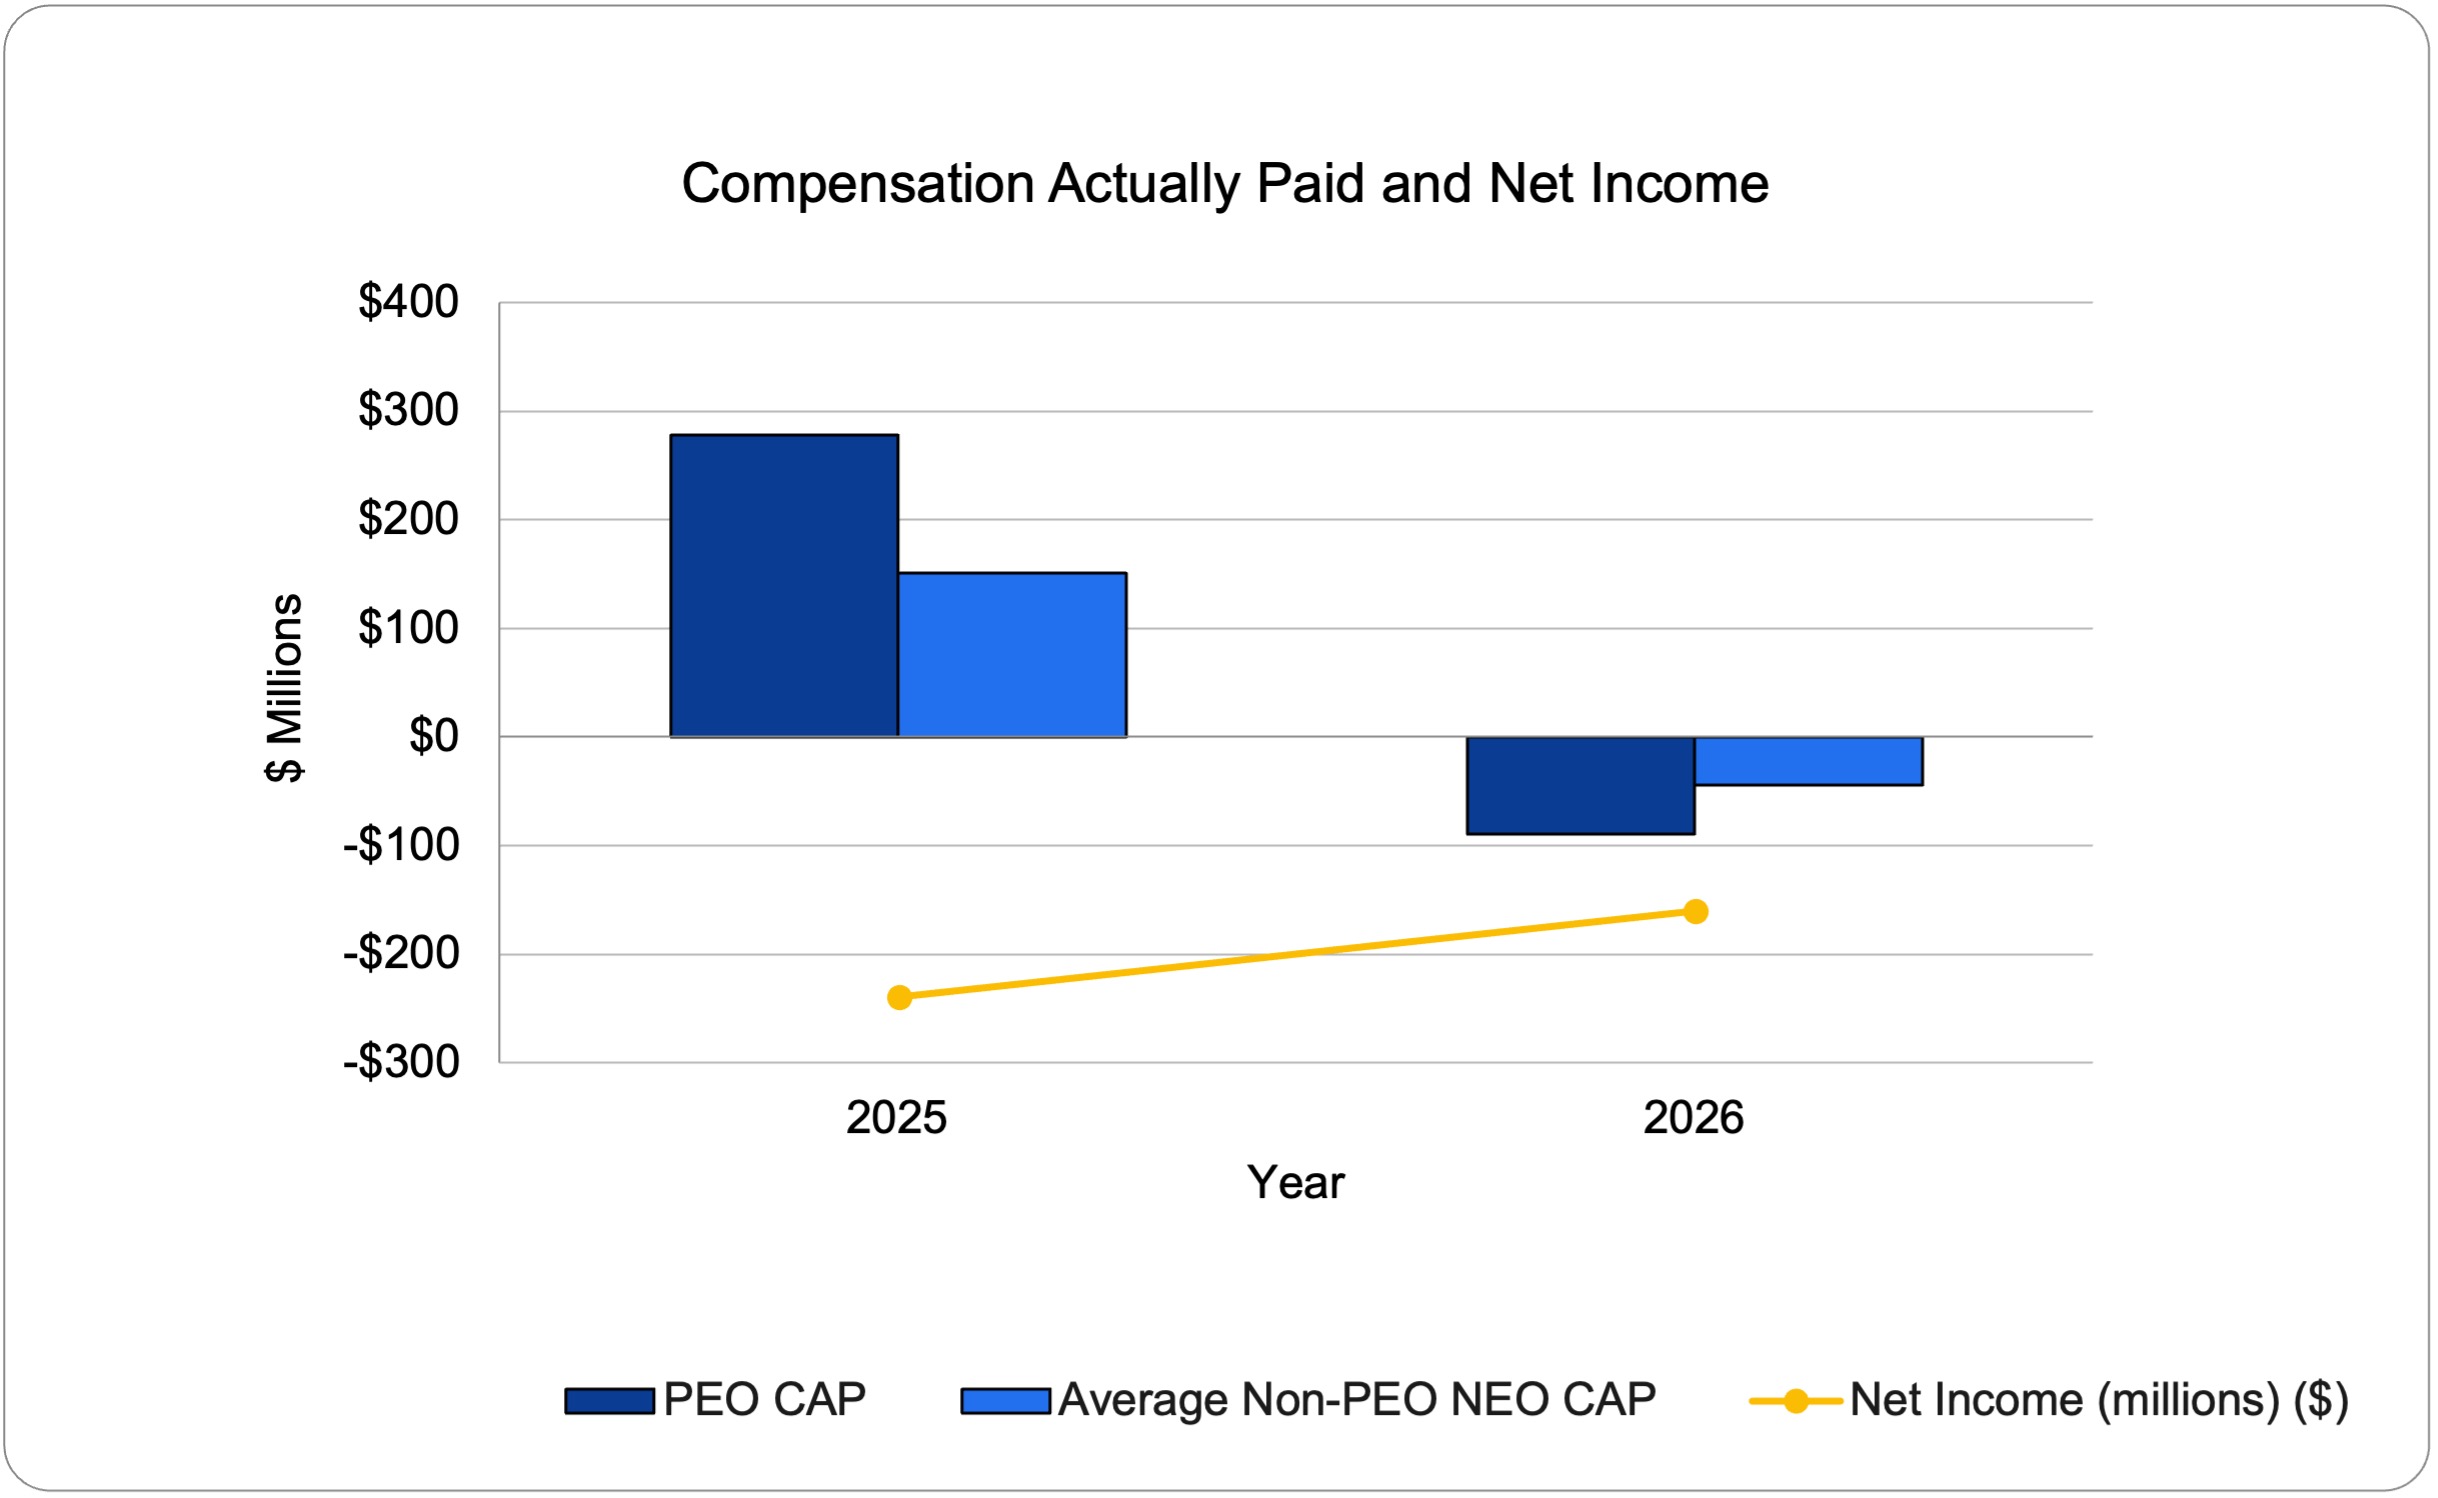
Compensation Actually Paid and Net Income

The following graph illustrates, for each of the periods presented in the Pay-versus-Performance table, the relationship between (i) compensation actually paid to the PEO and the average of the compensation actually paid to the Non-PEO NEOs, and (ii) our net income (loss).


img78718431_3.jpg

 
Compensation Actually Paid vs. Company Selected Measure

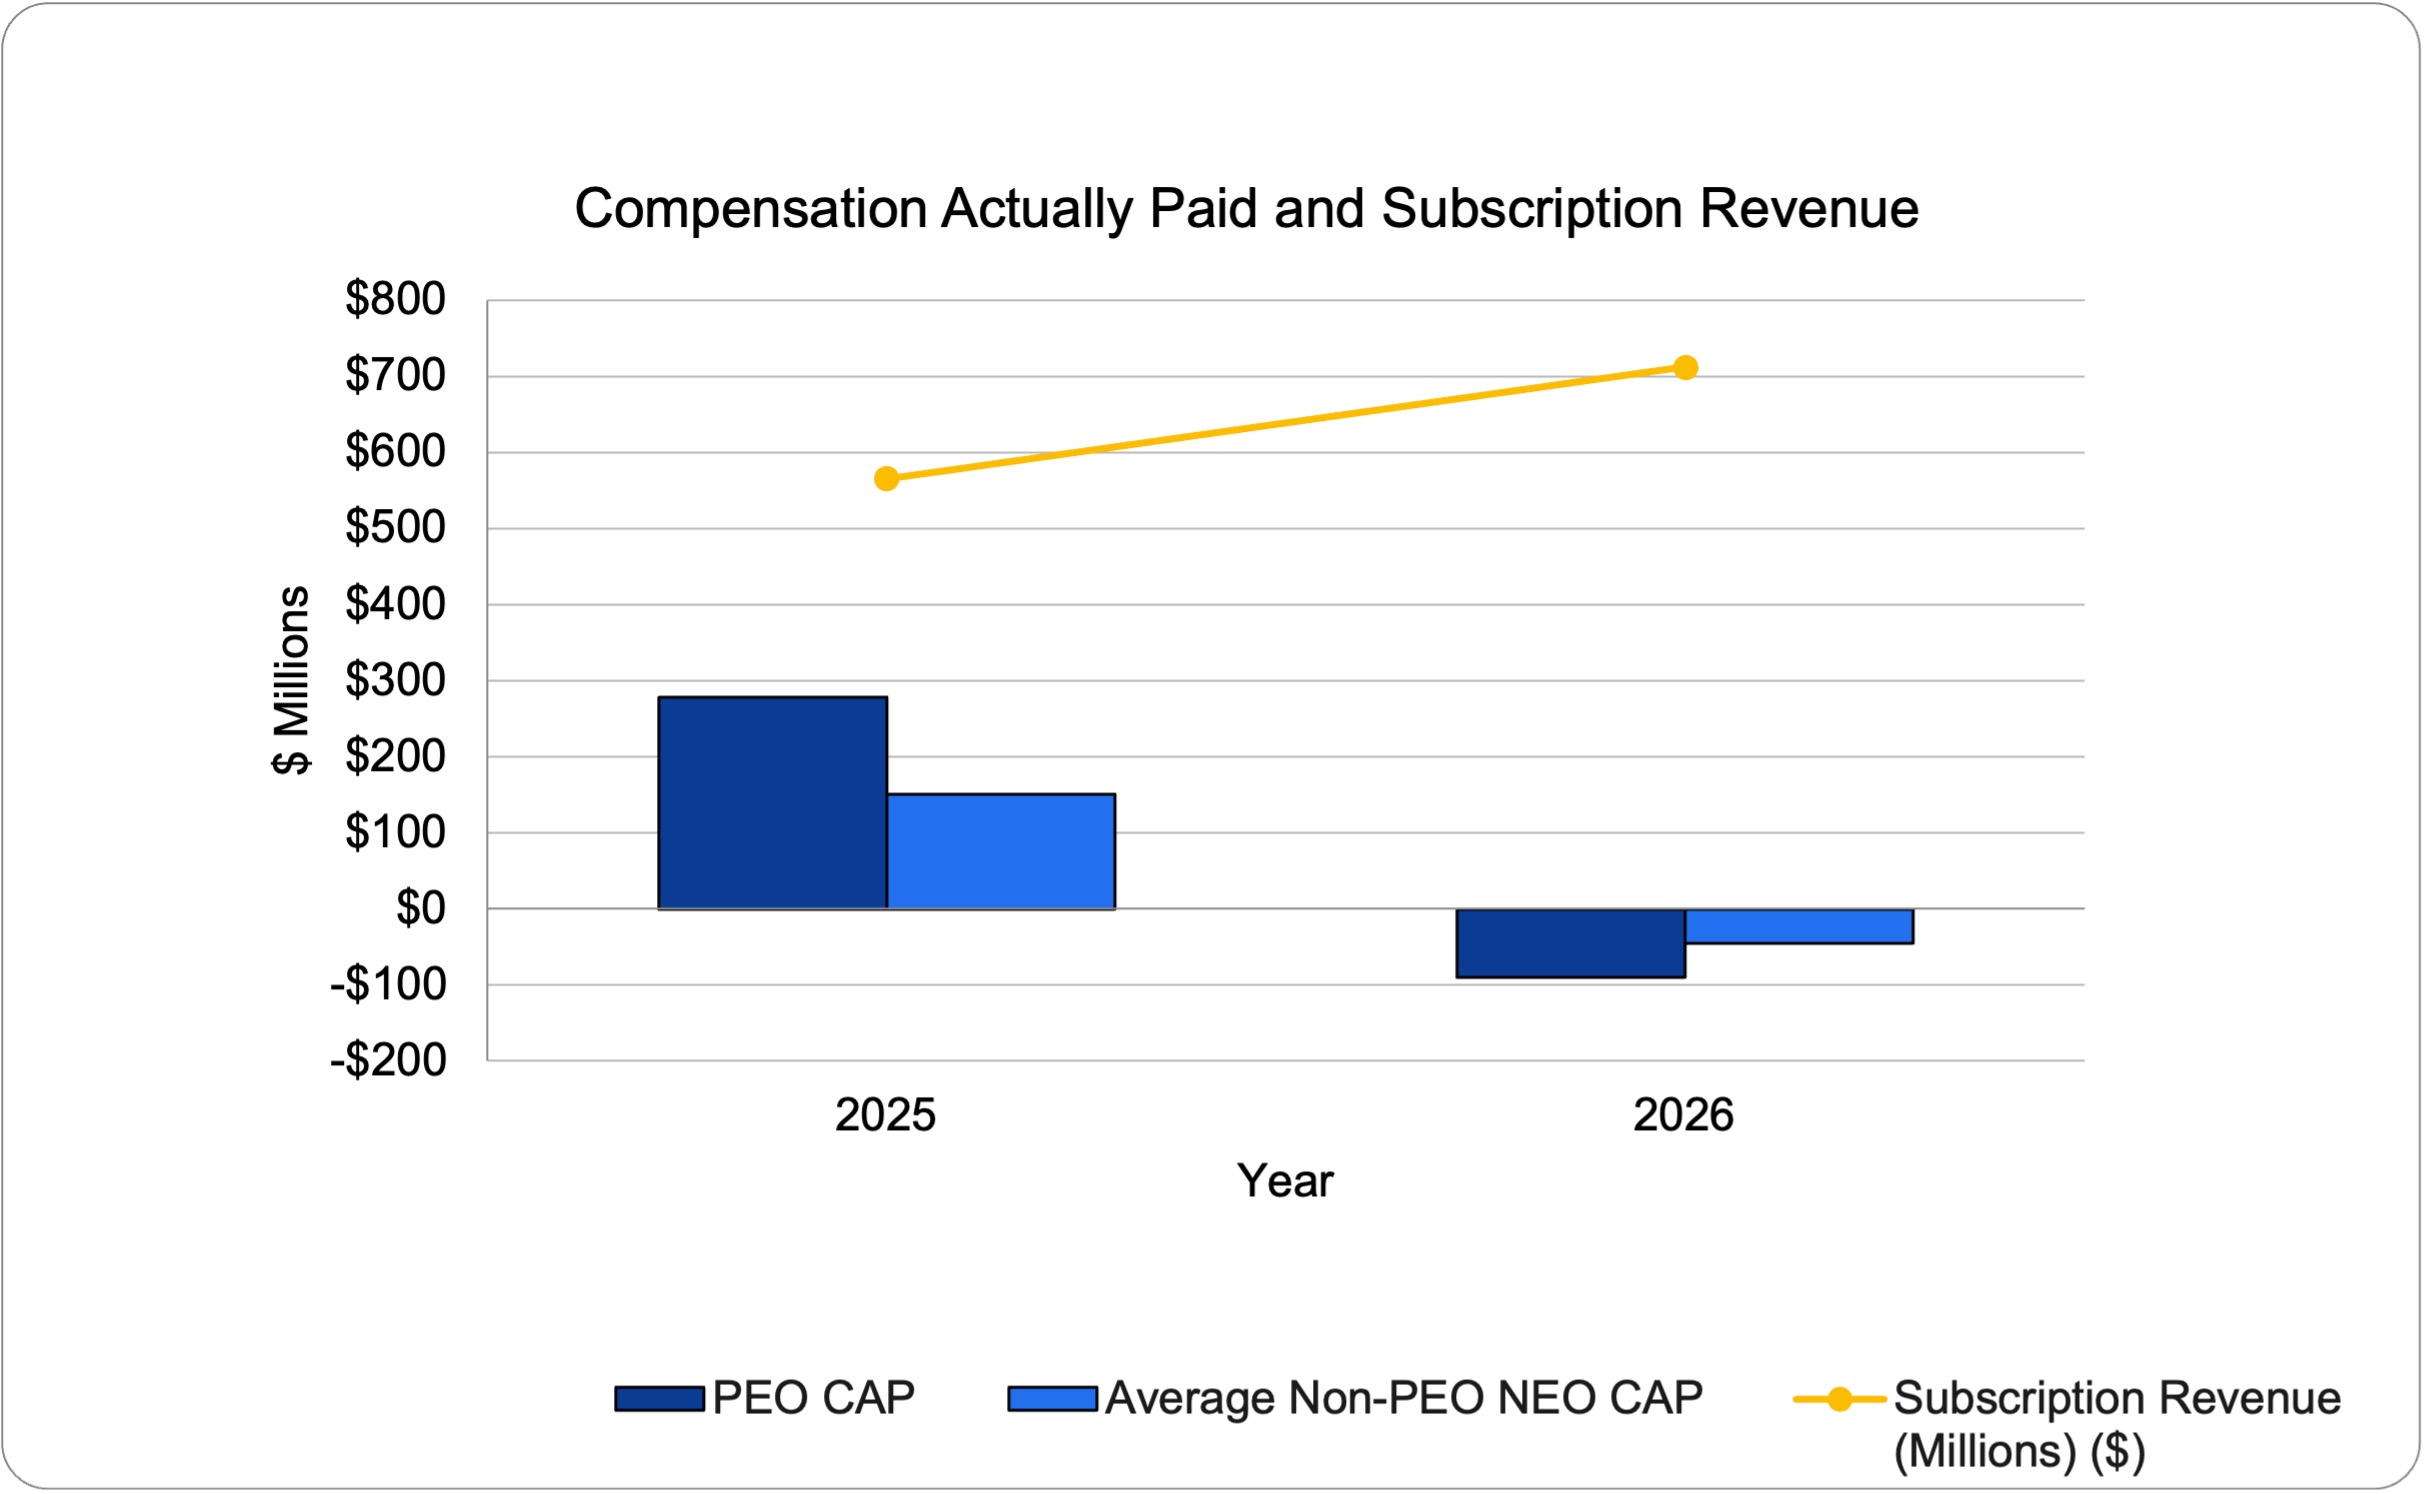
Compensation Actually Paid and Subscription Revenue

The following graph illustrates, for each of the periods presented in the Pay-versus-Performance table, the relationship between (i) compensation actually paid to the PEO and the average of the compensation actually paid to the Non-PEO NEOs, and (ii) our subscription revenue.


img78718431_4.jpg

 
Total Shareholder Return Amount $ 77.56 101.75
Peer Group Total Shareholder Return Amount 120.21 95.69
Net Income (Loss) $ (159,900,000) $ (239,100,000)
Company Selected Measure Amount 712,300,000 565,700,000
Measure:: 1    
Pay vs Performance Disclosure    
Name Non-GAAP operating margin  
Measure:: 2    
Pay vs Performance Disclosure    
Name Platform Revenue  
Measure:: 3    
Pay vs Performance Disclosure    
Name Our stock price, which is the key performance metric underlying the Co-Founder PSUs.  
PEO    
Pay vs Performance Disclosure    
Adjustment to Compensation, Amount $ 0 $ (131,781,064)
PEO | Equity Awards Adjustments    
Pay vs Performance Disclosure    
Adjustment to Compensation, Amount (91,490,629) 144,730,406
PEO | Year-end Fair Value of Equity Awards Granted in Covered Year that are Outstanding and Unvested    
Pay vs Performance Disclosure    
Adjustment to Compensation, Amount 0 251,032,921
PEO | Year-over-Year Change in Fair Value of Equity Awards Granted in Prior Years That are Outstanding and Unvested    
Pay vs Performance Disclosure    
Adjustment to Compensation, Amount (91,541,396) 21,836,961
PEO | Vesting Date Fair Value of Equity Awards Granted and Vested in Covered Year    
Pay vs Performance Disclosure    
Adjustment to Compensation, Amount 0 0
PEO | Change in Fair Value as of Vesting Date of Prior Year Equity Awards Vested in Covered Year    
Pay vs Performance Disclosure    
Adjustment to Compensation, Amount 50,767 3,641,588
PEO | Prior Year End Fair Value of Equity Awards Granted in Any Prior Year that Fail to Meet Applicable Vesting Conditions During Covered Year    
Pay vs Performance Disclosure    
Adjustment to Compensation, Amount 0 0
Non-PEO NEO    
Pay vs Performance Disclosure    
Adjustment to Compensation, Amount (4,078,764) (69,890,563)
Non-PEO NEO | Equity Awards Adjustments    
Pay vs Performance Disclosure    
Adjustment to Compensation, Amount (49,620,574) 80,278,769
Non-PEO NEO | Year-end Fair Value of Equity Awards Granted in Covered Year that are Outstanding and Unvested    
Pay vs Performance Disclosure    
Adjustment to Compensation, Amount 2,250,748 131,235,046
Non-PEO NEO | Year-over-Year Change in Fair Value of Equity Awards Granted in Prior Years That are Outstanding and Unvested    
Pay vs Performance Disclosure    
Adjustment to Compensation, Amount (48,276,325) 16,166,339
Non-PEO NEO | Vesting Date Fair Value of Equity Awards Granted and Vested in Covered Year    
Pay vs Performance Disclosure    
Adjustment to Compensation, Amount 449,153 798,875
Non-PEO NEO | Change in Fair Value as of Vesting Date of Prior Year Equity Awards Vested in Covered Year    
Pay vs Performance Disclosure    
Adjustment to Compensation, Amount 34,614 1,969,072
Non-PEO NEO | Prior Year End Fair Value of Equity Awards Granted in Any Prior Year that Fail to Meet Applicable Vesting Conditions During Covered Year    
Pay vs Performance Disclosure    
Adjustment to Compensation, Amount $ 0 $ 0