Exhibit 99.2
| PennyMac Financial Services, Inc. 1Q26 EARNINGS REPORT May 2026 |

| This presentation contains forward-looking statements within the meaning of Section 21E of the Securities Exchange Act of 1934, as amended, regarding management’s beliefs, estimates, projections and assumptions with respect to, among other things, our financial results, future operations, business plans and investment strategies, as well as industry and market conditions, all of which are subject to change. Words like “believe,” “expect,” “anticipate,” “promise,” “project,” “plan,” and other expressions or words of similar meanings, as well as future or conditional verbs such as “will,” “would,” “should,” “could,” or “may” are generally intended to identify forward-looking statements. Actual results and operations for any future period may vary materially from those projected herein and from past results discussed herein. These forward-looking statements include, but are not limited to, statements regarding future changes in interest rates, prepayment rates and the housing market; future loan origination, servicing and production, including future production, operating and hedge expenses; future loan delinquencies, defaults and forbearances; future earnings, return on equity as well as other business and financial projections and expectations. Factors which could cause actual results to differ materially from historical results or those anticipated include, but are not limited to: interest rate changes; changes in macroeconomic, consumer and real estate market conditions; changes in housing prices, housing sales and real estate values; rising homeownership costs negatively impacting housing affordability; the continually changing federal, state and local laws and regulations applicable to our highly regulated industry; lawsuits or governmental actions resulting from noncompliance with laws and regulations; the mortgage lending and servicing-related regulations promulgated by federal and state regulators and the enforcement of these regulations; licensing and operational requirements of jurisdictions applicable to our business, to which our bank competitors are not subject; changes to government modification programs; difficulties inherent in adjusting the size of our operations to reflect changes in business levels; purchase and sales opportunities for mortgage servicing rights; our substantial amount of indebtedness; increases in loan delinquencies, defaults and forbearances; foreclosure delays and changes in foreclosure practices; our dependence on U.S. government-sponsored entities and changes in their roles; our ability to manage third-party vendors and mortgage investor requirements; our exposure to counterparties that do not fulfill contractual obligations; our reliance on PennyMac Mortgage Investment Trust (NYSE: PMT) as a significant contributor to our mortgage banking business; maintaining sufficient capital and liquidity and compliance with financial covenants; our obligation to indemnify third-party purchasers or repurchase loans if loans that we originate, acquire, service or assist in the fulfillment of, fail to meet certain criteria; our obligation to indemnify PMT if our services fail to meet certain criteria or characteristics or under other circumstances; investment management and incentive fees; the accuracy or changes in the estimates we make about uncertainties, contingencies and asset and liability valuations; conflicts of interest in allocating our services and investment opportunities among us and our advised entity; our ability to mitigate cybersecurity risks, cyber incidents and technology disruptions; the development of artificial intelligence; the effect of public opinion on our reputation; our exposure to risks of loss and disruption in operations from severe weather events, man-made or other natural conditions, including climate change and pandemics; our ability to effectively identify, manage and hedge our credit, interest rate, prepayment, liquidity and climate risks; expansion of new business activities or strategies; our ability to detect misconduct and fraud; our ability to pay dividends to our stockholders; and our organizational structure and certain requirements in our charter documents. You should not place undue reliance on any forward-looking statement and should consider all of the uncertainties and risks described above, as well as those more fully discussed in reports and other documents filed by the Company with the Securities and Exchange Commission from time to time. The Company undertakes no obligation to publicly update or revise any forward-looking statements or any other information contained herein, and the statements made in this presentation are current as of the date of this presentation only. The presentation contains financial information calculated other than in accordance with U.S. generally accepted accounting principles (“GAAP”), such as adjusted net income, adjusted earnings per share, pretax income excluding valuation-related items and adjusted return on equity that provide a meaningful perspective on the Company’s business results since the Company utilizes this information to evaluate and manage the business and investors use this information to calculate financial and cash flow measures. Non-GAAP disclosures have limitations as an analytical tool and should not be viewed as a substitute for financial information determined in accordance with GAAP. 2 FORWARD-LOOKING STATEMENTS |
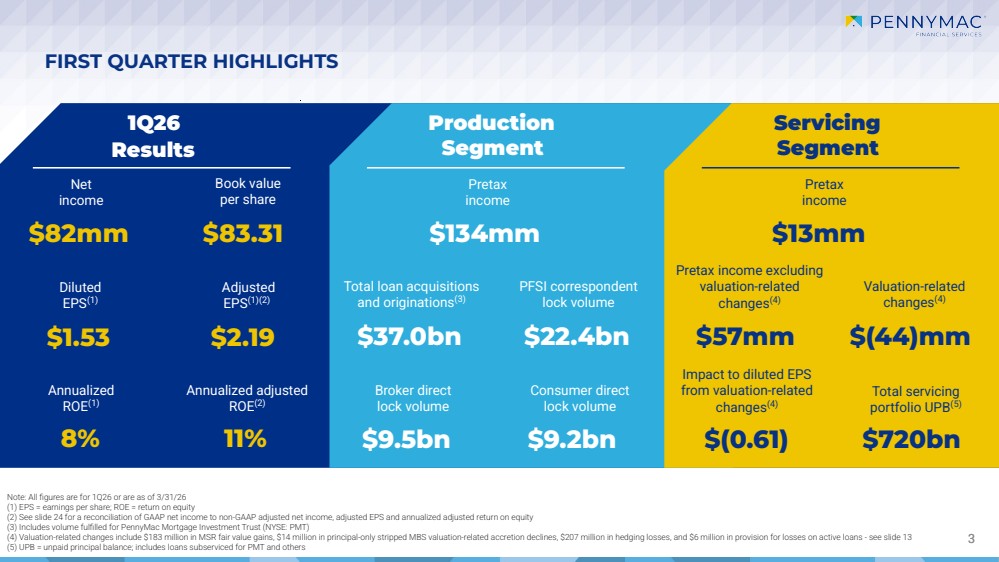
| 3 1Q26 Results Production Segment Servicing Segment FIRST QUARTER HIGHLIGHTS Note: All figures are for 1Q26 or are as of 3/31/26 (1) EPS = earnings per share; ROE = return on equity (2) See slide 24 for a reconciliation of GAAP net income to non-GAAP adjusted net income, adjusted EPS and annualized adjusted return on equity (3) Includes volume fulfilled for PennyMac Mortgage Investment Trust (NYSE: PMT) (4) Valuation-related changes include $183 million in MSR fair value gains, $14 million in principal-only stripped MBS valuation-related accretion declines, $207 million in hedging losses, and $6 million in provision for losses on active loans - see slide 13 (5) UPB = unpaid principal balance; includes loans subserviced for PMT and others Annualized ROE(1) Annualized adjusted ROE(2) Pretax income Total loan acquisitions and originations(3) PFSI correspondent lock volume Broker direct lock volume Consumer direct lock volume Pretax income Pretax income excluding valuation-related changes(4) Impact to diluted EPS from valuation-related changes(4) Valuation-related changes(4) Total servicing portfolio UPB(5) Book value per share Net income Diluted EPS(1) Adjusted EPS(1)(2) $1.53 $2.19 $82mm $83.31 $134mm $13mm $37.0bn $22.4bn $9.5bn $9.2bn $57mm $(44)mm 8% 11% $(0.61) $720bn |
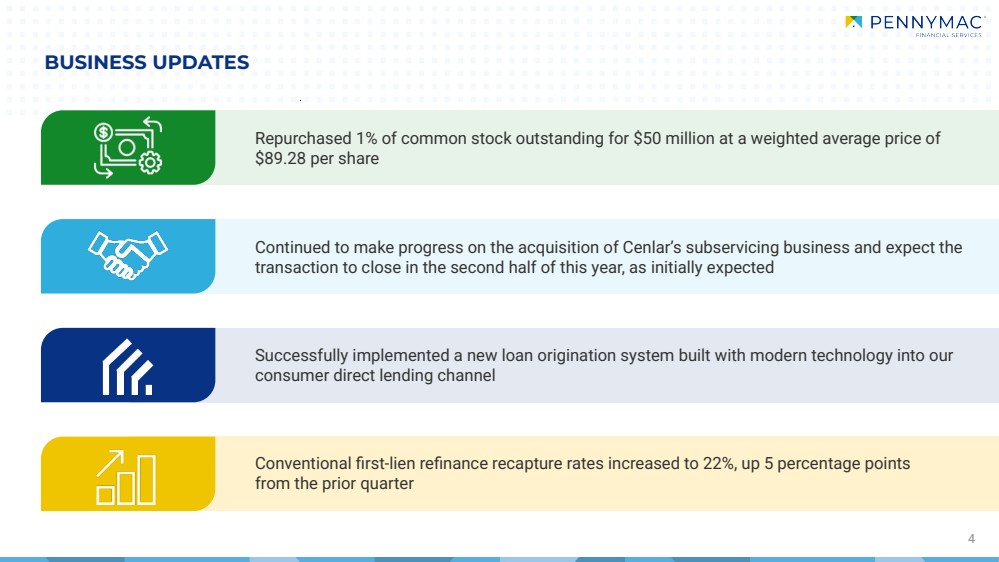
| BUSINESS UPDATES Repurchased 1% of common stock outstanding for $50 million at a weighted average price of $89.28 per share Continued to make progress on the acquisition of Cenlar’s subservicing business and expect the transaction to close in the second half of this year, as initially expected Conventional first-lien refinance recapture rates increased to 22%, up 5 percentage points from the prior quarter Successfully implemented a new loan origination system built with modern technology into our consumer direct lending channel 4 |
| 1Q26 STRATEGIC UPDATE |

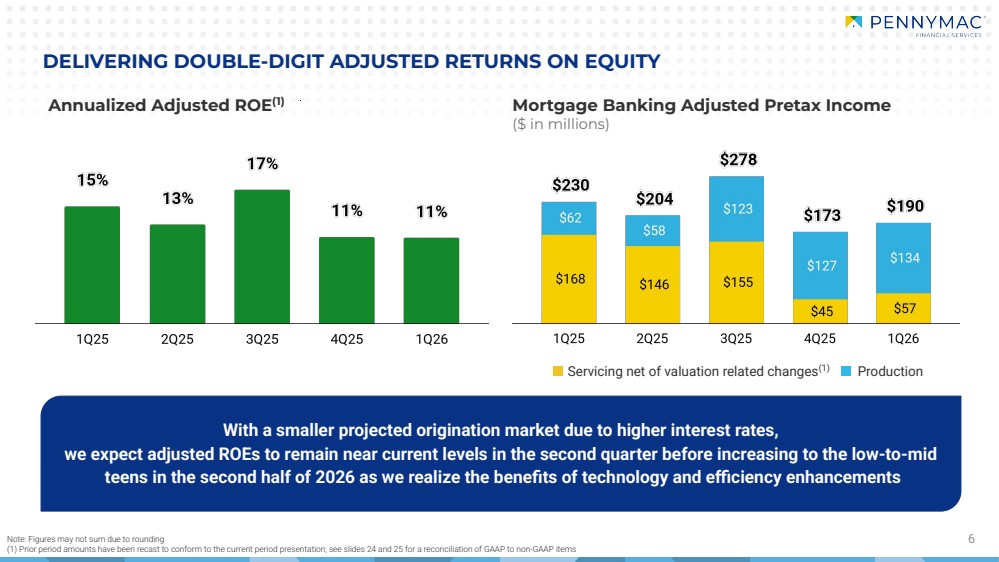
| With a smaller projected origination market due to higher interest rates, we expect adjusted ROEs to remain near current levels in the second quarter before increasing to the low-to-mid teens in the second half of 2026 as we realize the benefits of technology and efficiency enhancements Mortgage Banking Adjusted Pretax Income ($ in millions) Production 6 Annualized Adjusted ROE(1) Note: Figures may not sum due to rounding (1) Prior period amounts have been recast to conform to the current period presentation; see slides 24 and 25 for a reconciliation of GAAP to non-GAAP items Servicing net of valuation related changes(1) DELIVERING DOUBLE-DIGIT ADJUSTED RETURNS ON EQUITY |
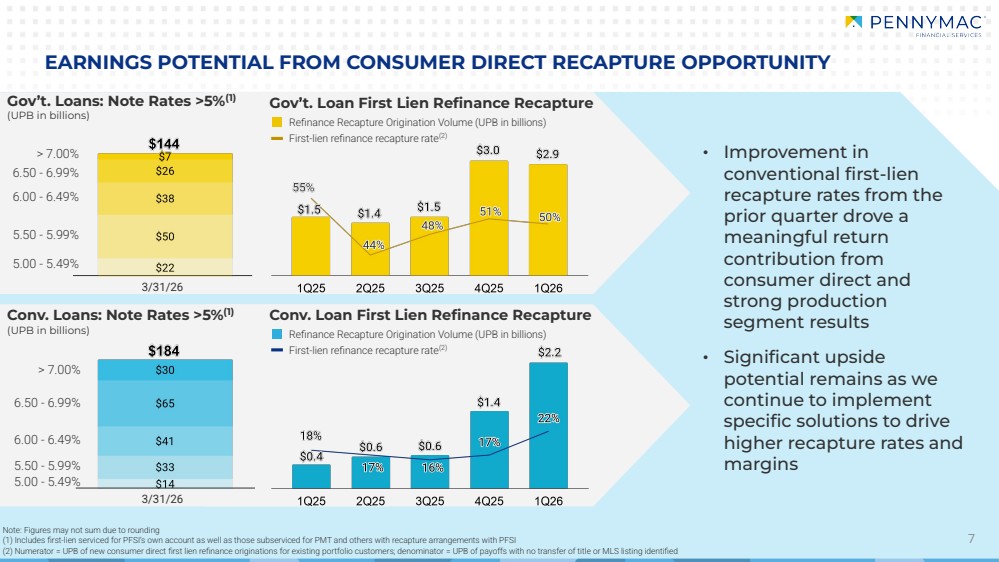
| 7 EARNINGS POTENTIAL FROM CONSUMER DIRECT RECAPTURE OPPORTUNITY Gov’t. Loan First Lien Refinance Recapture Conv. Loan First Lien Refinance Recapture > 7.00% 6.50 - 6.99% 5.50 - 5.99% 6.00 - 6.49% 5.00 - 5.49% Note: Figures may not sum due to rounding (1) Includes first-lien serviced for PFSI’s own account as well as those subserviced for PMT and others with recapture arrangements with PFSI (2) Numerator = UPB of new consumer direct first lien refinance originations for existing portfolio customers; denominator = UPB of payoffs with no transfer of title or MLS listing identified Refinance Recapture Origination Volume (UPB in billions) First-lien refinance recapture rate(2) Gov’t. Loans: Note Rates >5%(1) (UPB in billions) Conv. Loans: Note Rates >5%(1) (UPB in billions) 3/31/26 3/31/26 > 7.00% 6.50 - 6.99% 6.00 - 6.49% 5.50 - 5.99% 5.00 - 5.49% • Improvement in conventional first-lien recapture rates from the prior quarter drove a meaningful return contribution from consumer direct and strong production segment results • Significant upside potential remains as we continue to implement specific solutions to drive higher recapture rates and margins Refinance Recapture Origination Volume (UPB in billions) First-lien refinance recapture rate(2) |
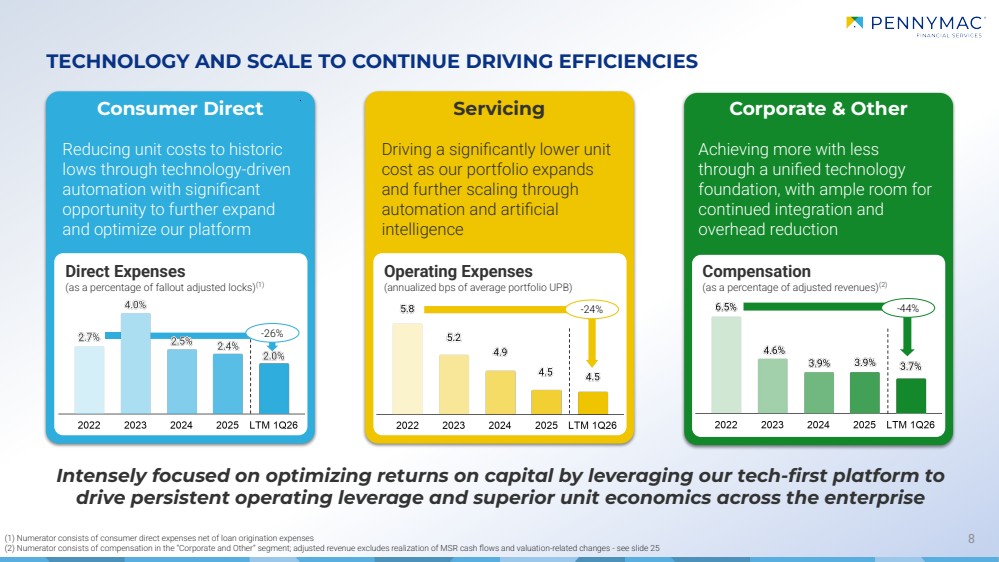
| (1) Numerator consists of consumer direct expenses net of loan origination expenses (2) Numerator consists of compensation in the “Corporate and Other” segment; adjusted revenue excludes realization of MSR cash flows and valuation-related changes - see slide 25 8 TECHNOLOGY AND SCALE TO CONTINUE DRIVING EFFICIENCIES Operating Expenses (annualized bps of average portfolio UPB) Compensation (as a percentage of adjusted revenues)(2) Consumer Direct Servicing Corporate & Other -24% -44% Reducing unit costs to historic lows through technology-driven automation with significant opportunity to further expand and optimize our platform Direct Expenses (as a percentage of fallout adjusted locks)(1) -26% Achieving more with less through a unified technology foundation, with ample room for continued integration and overhead reduction Driving a significantly lower unit cost as our portfolio expands and further scaling through automation and artificial intelligence Intensely focused on optimizing returns on capital by leveraging our tech-first platform to drive persistent operating leverage and superior unit economics across the enterprise |
| KEY OPERATING METRICS & OTHER FINANCIAL SCHEDULES |

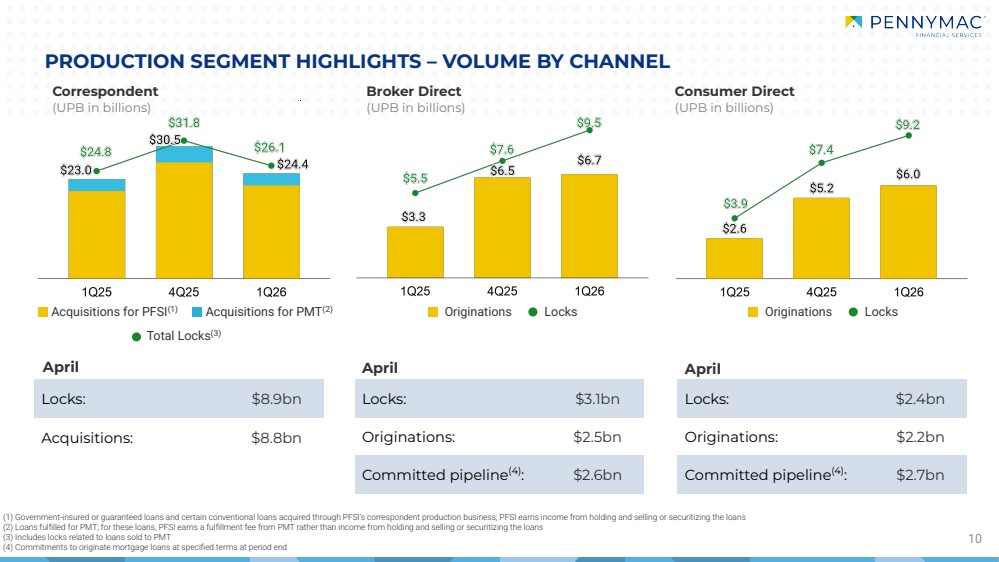
| Acquisitions for PFSI(1) 10 PRODUCTION SEGMENT HIGHLIGHTS – VOLUME BY CHANNEL Broker Direct (UPB in billions) (1) Government-insured or guaranteed loans and certain conventional loans acquired through PFSI’s correspondent production business; PFSI earns income from holding and selling or securitizing the loans (2) Loans fulfilled for PMT; for these loans, PFSI earns a fulfillment fee from PMT rather than income from holding and selling or securitizing the loans (3) Includes locks related to loans sold to PMT (4) Commitments to originate mortgage loans at specified terms at period end Consumer Direct (UPB in billions) Correspondent (UPB in billions) Acquisitions for PMT(2) Originations Locks: $8.9bn Acquisitions: $8.8bn Locks: $3.1bn Originations: $2.5bn Committed pipeline(4): $2.6bn Locks: $2.4bn Originations: $2.2bn Committed pipeline(4): $2.7bn Total Locks(3) April April April Locks Originations Locks |
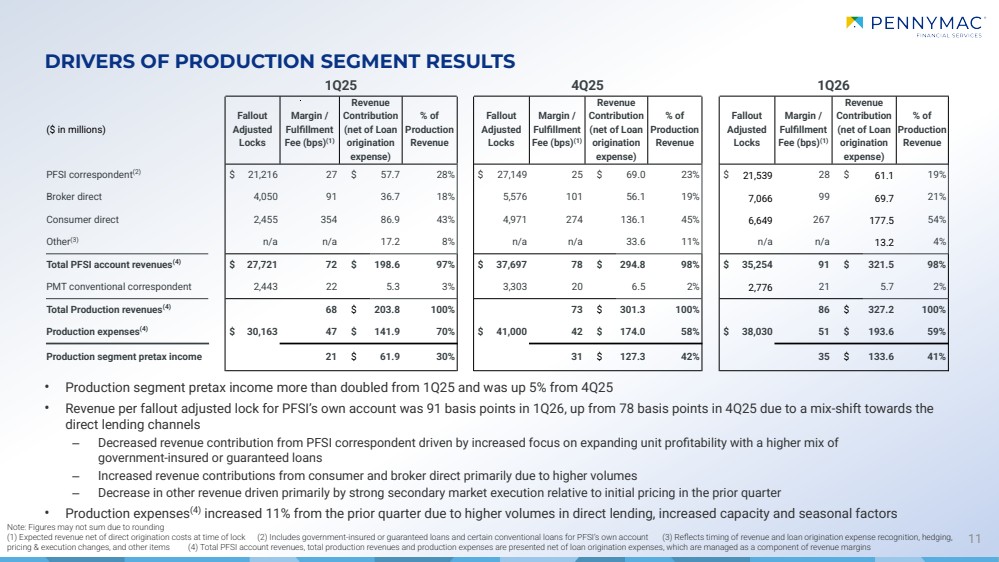
| 11 DRIVERS OF PRODUCTION SEGMENT RESULTS 1Q25 4Q25 1Q26 ($ in millions) Fallout Adjusted Locks Margin / Fulfillment Fee (bps)(1) Revenue Contribution (net of Loan origination expense) % of Production Revenue Fallout Adjusted Locks Margin / Fulfillment Fee (bps)(1) Revenue Contribution (net of Loan origination expense) % of Production Revenue Fallout Adjusted Locks Margin / Fulfillment Fee (bps)(1) Revenue Contribution (net of Loan origination expense) % of Production Revenue PFSI correspondent(2) $ 21,216 27 $ 57.7 28% $ 27,149 25 $ 69.0 23% $ 21,539 28 $ 61.1 19% Broker direct 4,050 91 36.7 18% 5,576 101 56.1 19% 7,066 99 69.7 21% Consumer direct 2,455 354 86.9 43% 4,971 274 136.1 45% 6,649 267 177.5 54% Other(3) n/a n/a 17.2 8% n/a n/a 33.6 11% n/a n/a 13.2 4% Total PFSI account revenues(4) $ 27,721 72 $ 198.6 97% $ 37,697 78 $ 294.8 98% $ 35,254 91 $ 321.5 98% PMT conventional correspondent 2,443 22 5.3 3% 3,303 20 6.5 2% 2,776 21 5.7 2% Total Production revenues(4) 68 $ 203.8 100% 73 $ 301.3 100% 86 $ 327.2 100% Production expenses(4) $ 30,163 47 $ 141.9 70% $ 41,000 42 $ 174.0 58% $ 38,030 51 $ 193.6 59% Production segment pretax income 21 $ 61.9 30% 31 $ 127.3 42% 35 $ 133.6 41% Note: Figures may not sum due to rounding (1) Expected revenue net of direct origination costs at time of lock (2) Includes government-insured or guaranteed loans and certain conventional loans for PFSI’s own account (3) Reflects timing of revenue and loan origination expense recognition, hedging, pricing & execution changes, and other items (4) Total PFSI account revenues, total production revenues and production expenses are presented net of loan origination expenses, which are managed as a component of revenue margins • Production segment pretax income more than doubled from 1Q25 and was up 5% from 4Q25 • Revenue per fallout adjusted lock for PFSI’s own account was 91 basis points in 1Q26, up from 78 basis points in 4Q25 due to a mix-shift towards the direct lending channels ‒ Decreased revenue contribution from PFSI correspondent driven by increased focus on expanding unit profitability with a higher mix of government-insured or guaranteed loans ‒ Increased revenue contributions from consumer and broker direct primarily due to higher volumes ‒ Decrease in other revenue driven primarily by strong secondary market execution relative to initial pricing in the prior quarter • Production expenses(4) increased 11% from the prior quarter due to higher volumes in direct lending, increased capacity and seasonal factors |
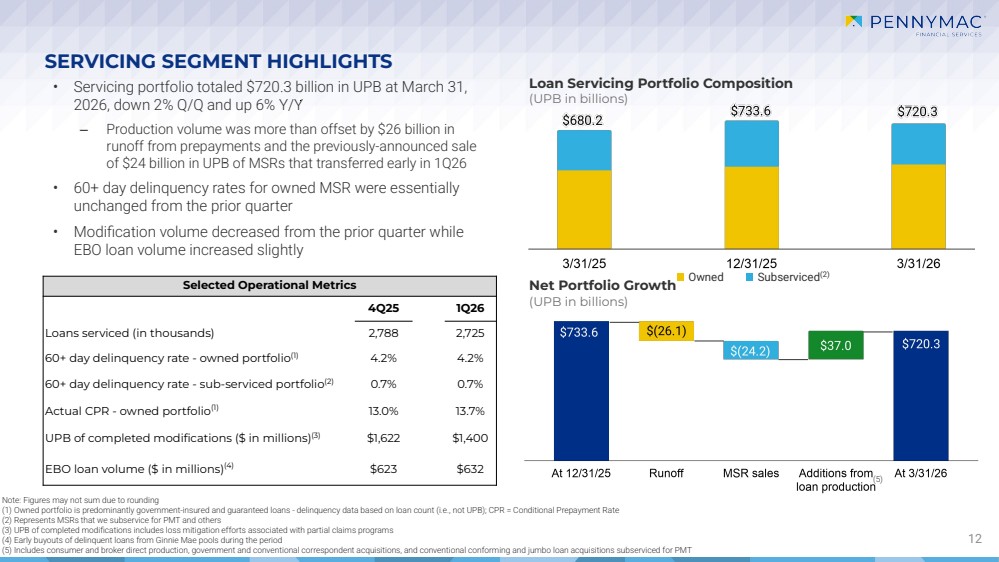
| Net Portfolio Growth (UPB in billions) Selected Operational Metrics 4Q25 1Q26 Loans serviced (in thousands) 2,788 2,725 60+ day delinquency rate - owned portfolio(1) 4.2% 4.2% 60+ day delinquency rate - sub-serviced portfolio(2) 0.7% 0.7% Actual CPR - owned portfolio(1) 13.0% 13.7% UPB of completed modifications ($ in millions)(3) $1,622 $1,400 EBO loan volume ($ in millions)(4) $623 $632 Owned Subserviced(2) Note: Figures may not sum due to rounding (1) Owned portfolio is predominantly government-insured and guaranteed loans - delinquency data based on loan count (i.e., not UPB); CPR = Conditional Prepayment Rate (2) Represents MSRs that we subservice for PMT and others (3) UPB of completed modifications includes loss mitigation efforts associated with partial claims programs (4) Early buyouts of delinquent loans from Ginnie Mae pools during the period (5) Includes consumer and broker direct production, government and conventional correspondent acquisitions, and conventional conforming and jumbo loan acquisitions subserviced for PMT SERVICING SEGMENT HIGHLIGHTS 12 Loan Servicing Portfolio Composition (UPB in billions) (5) • Servicing portfolio totaled $720.3 billion in UPB at March 31, 2026, down 2% Q/Q and up 6% Y/Y ‒ Production volume was more than offset by $26 billion in runoff from prepayments and the previously-announced sale of $24 billion in UPB of MSRs that transferred early in 1Q26 • 60+ day delinquency rates for owned MSR were essentially unchanged from the prior quarter • Modification volume decreased from the prior quarter while EBO loan volume increased slightly |
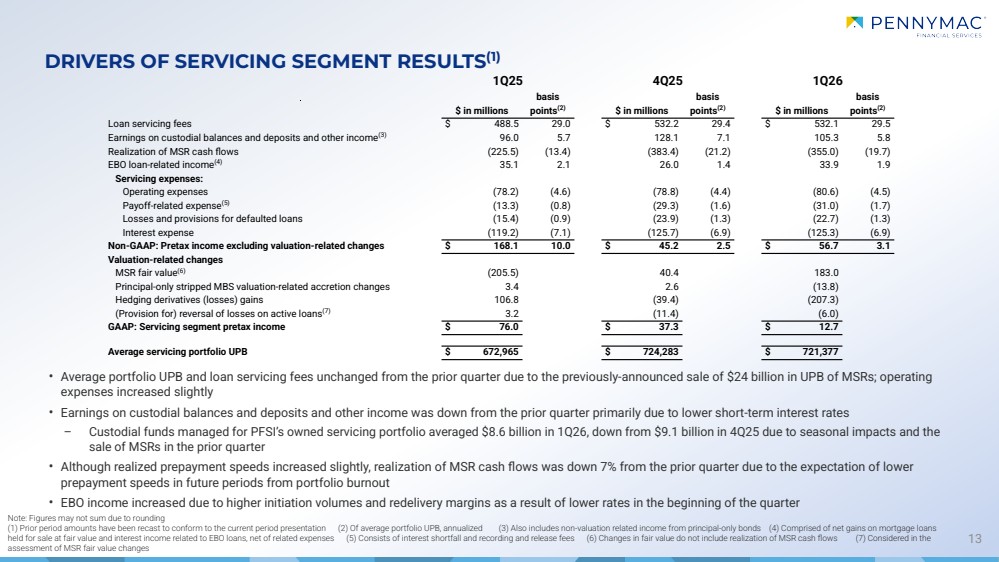
| 13 Note: Figures may not sum due to rounding (1) Prior period amounts have been recast to conform to the current period presentation (2) Of average portfolio UPB, annualized (3) Also includes non-valuation related income from principal-only bonds (4) Comprised of net gains on mortgage loans held for sale at fair value and interest income related to EBO loans, net of related expenses (5) Consists of interest shortfall and recording and release fees (6) Changes in fair value do not include realization of MSR cash flows (7) Considered in the assessment of MSR fair value changes DRIVERS OF SERVICING SEGMENT RESULTS(1) 1Q25 4Q25 1Q26 $ in millions basis points(2) $ in millions basis points(2) $ in millions basis points(2) Loan servicing fees $ 488.5 29.0 $ 532.2 29.4 $ 532.1 29.5 Earnings on custodial balances and deposits and other income(3) 96.0 5.7 128.1 7.1 105.3 5.8 Realization of MSR cash flows (225.5) (13.4) (383.4) (21.2) (355.0) (19.7) EBO loan-related income(4) 35.1 2.1 26.0 1.4 33.9 1.9 Servicing expenses: Operating expenses (78.2) (4.6) (78.8) (4.4) (80.6) (4.5) Payoff-related expense(5) (13.3) (0.8) (29.3) (1.6) (31.0) (1.7) Losses and provisions for defaulted loans (15.4) (0.9) (23.9) (1.3) (22.7) (1.3) Interest expense (119.2) (7.1) (125.7) (6.9) (125.3) (6.9) Non-GAAP: Pretax income excluding valuation-related changes $ 168.1 10.0 $ 45.2 2.5 $ 56.7 3.1 Valuation-related changes MSR fair value(6) (205.5) 40.4 183.0 Principal-only stripped MBS valuation-related accretion changes 3.4 2.6 (13.8) Hedging derivatives (losses) gains 106.8 (39.4) (207.3) (Provision for) reversal of losses on active loans(7) 3.2 (11.4) (6.0) GAAP: Servicing segment pretax income $ 76.0 $ 37.3 $ 12.7 Average servicing portfolio UPB $ 672,965 $ 724,283 $ 721,377 • Average portfolio UPB and loan servicing fees unchanged from the prior quarter due to the previously-announced sale of $24 billion in UPB of MSRs; operating expenses increased slightly • Earnings on custodial balances and deposits and other income was down from the prior quarter primarily due to lower short-term interest rates – Custodial funds managed for PFSI’s owned servicing portfolio averaged $8.6 billion in 1Q26, down from $9.1 billion in 4Q25 due to seasonal impacts and the sale of MSRs in the prior quarter • Although realized prepayment speeds increased slightly, realization of MSR cash flows was down 7% from the prior quarter due to the expectation of lower prepayment speeds in future periods from portfolio burnout • EBO income increased due to higher initiation volumes and redelivery margins as a result of lower rates in the beginning of the quarter |
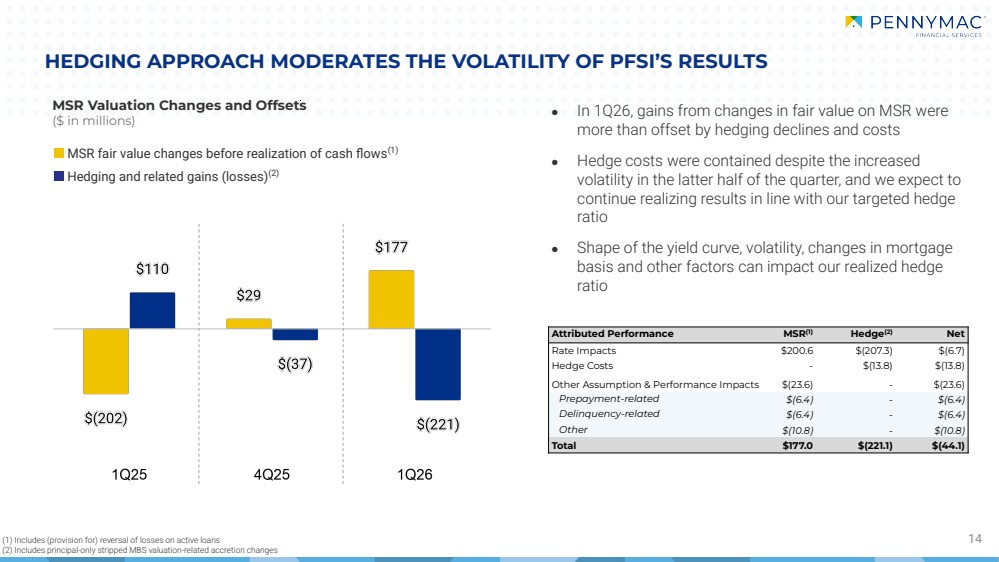
| 14 HEDGING APPROACH MODERATES THE VOLATILITY OF PFSI’S RESULTS MSR Valuation Changes and Offsets ($ in millions) MSR fair value changes before realization of cash flows(1) Hedging and related gains (losses)(2) ● In 1Q26, gains from changes in fair value on MSR were more than offset by hedging declines and costs ● Hedge costs were contained despite the increased volatility in the latter half of the quarter, and we expect to continue realizing results in line with our targeted hedge ratio ● Shape of the yield curve, volatility, changes in mortgage basis and other factors can impact our realized hedge ratio (1) Includes (provision for) reversal of losses on active loans (2) Includes principal-only stripped MBS valuation-related accretion changes Attributed Performance MSR(1) Hedge(2) Net Rate Impacts $200.6 $(207.3) $(6.7) Hedge Costs - $(13.8) $(13.8) Other Assumption & Performance Impacts $(23.6) - $(23.6) Prepayment-related $(6.4) - $(6.4) Delinquency-related $(6.4) - $(6.4) Other $(10.8) - $(10.8) Total $177.0 $(221.1) $(44.1) |
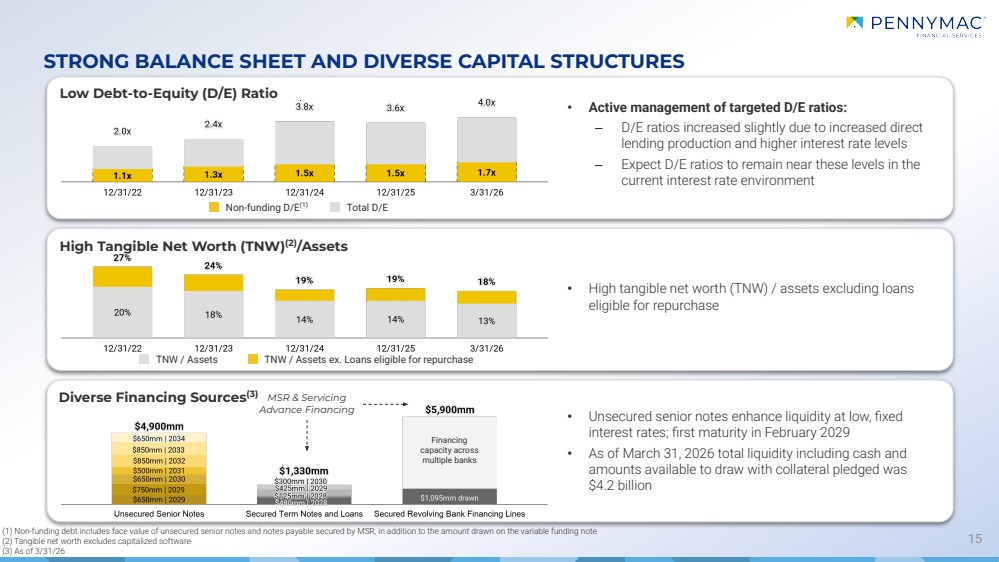
| 15 STRONG BALANCE SHEET AND DIVERSE CAPITAL STRUCTURES (1) Non-funding debt includes face value of unsecured senior notes and notes payable secured by MSR, in addition to the amount drawn on the variable funding note (2) Tangible net worth excludes capitalized software (3) As of 3/31/26 Low Debt-to-Equity (D/E) Ratio MSR & Servicing Advance Financing High Tangible Net Worth (TNW)(2)/Assets Non-funding D/E(1) Total D/E Diverse Financing Sources(3) TNW / Assets TNW / Assets ex. Loans eligible for repurchase • Active management of targeted D/E ratios: ‒ D/E ratios increased slightly due to increased direct lending production and higher interest rate levels ‒ Expect D/E ratios to remain near these levels in the current interest rate environment • High tangible net worth (TNW) / assets excluding loans eligible for repurchase • Unsecured senior notes enhance liquidity at low, fixed interest rates; first maturity in February 2029 • As of March 31, 2026 total liquidity including cash and amounts available to draw with collateral pledged was $4.2 billion Financing capacity across multiple banks |
| APPENDIX |

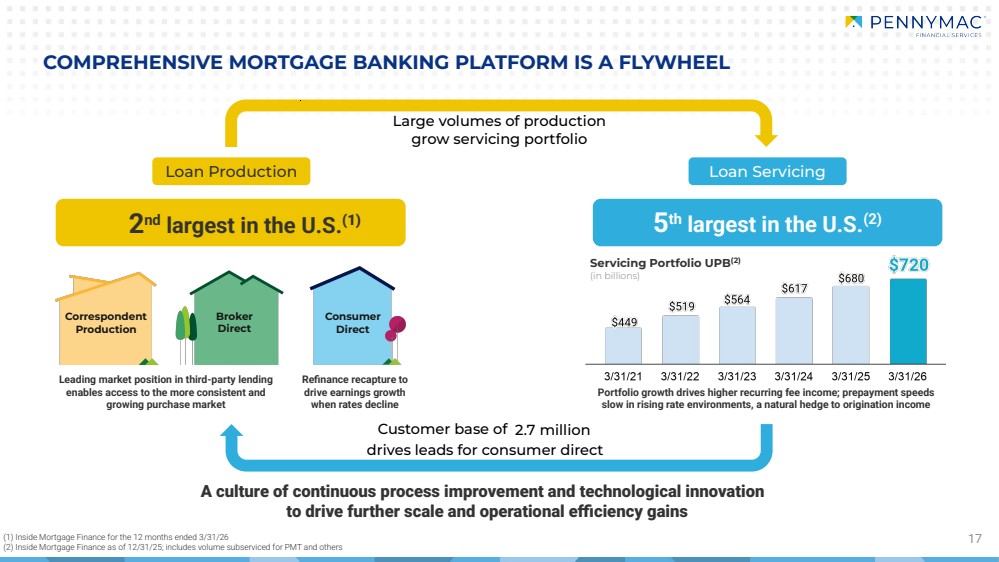
| Portfolio growth drives higher recurring fee income; prepayment speeds slow in rising rate environments, a natural hedge to origination income Refinance recapture to drive earnings growth when rates decline 17 COMPREHENSIVE MORTGAGE BANKING PLATFORM IS A FLYWHEEL Large volumes of production grow servicing portfolio 2 nd largest in the U.S.(1) 5 th largest in the U.S.(2) A culture of continuous process improvement and technological innovation to drive further scale and operational efficiency gains Customer base of 2.7 million drives leads for consumer direct Correspondent Production Broker Direct Consumer Direct Leading market position in third-party lending enables access to the more consistent and growing purchase market Servicing Portfolio UPB(2) (in billions) (1) Inside Mortgage Finance for the 12 months ended 3/31/26 (2) Inside Mortgage Finance as of 12/31/25; includes volume subserviced for PMT and others Loan Production Loan Servicing |
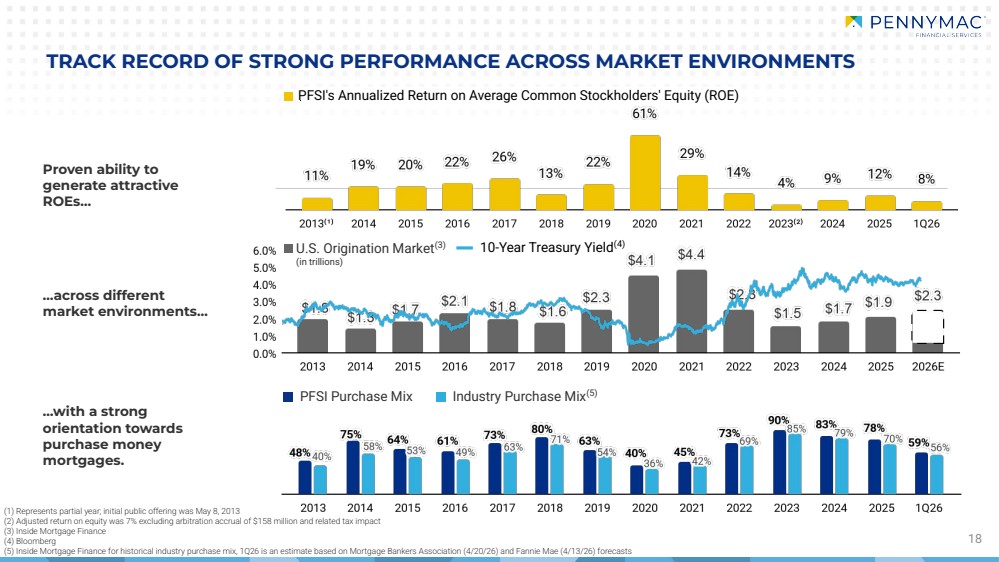
| PFSI Purchase Mix Industry Purchase Mix(5) 18 TRACK RECORD OF STRONG PERFORMANCE ACROSS MARKET ENVIRONMENTS Proven ability to generate attractive ROEs… …across different market environments… …with a strong orientation towards purchase money mortgages. (1) Represents partial year; initial public offering was May 8, 2013 (2) Adjusted return on equity was 7% excluding arbitration accrual of $158 million and related tax impact (3) Inside Mortgage Finance (4) Bloomberg (5) Inside Mortgage Finance for historical industry purchase mix, 1Q26 is an estimate based on Mortgage Bankers Association (4/20/26) and Fannie Mae (4/13/26) forecasts U.S. Origination Market(3) (in trillions) PFSI's Annualized Return on Average Common Stockholders' Equity (ROE) 10-Year Treasury Yield(4) |
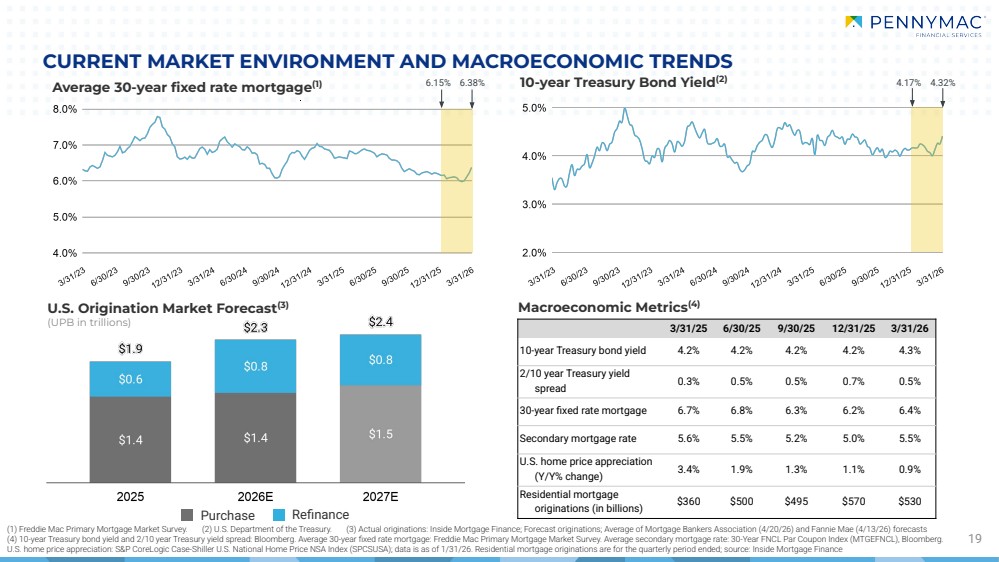
| (1) Freddie Mac Primary Mortgage Market Survey. (2) U.S. Department of the Treasury. (3) Actual originations: Inside Mortgage Finance; Forecast originations; Average of Mortgage Bankers Association (4/20/26) and Fannie Mae (4/13/26) forecasts (4) 10-year Treasury bond yield and 2/10 year Treasury yield spread: Bloomberg. Average 30-year fixed rate mortgage: Freddie Mac Primary Mortgage Market Survey. Average secondary mortgage rate: 30-Year FNCL Par Coupon Index (MTGEFNCL), Bloomberg. U.S. home price appreciation: S&P CoreLogic Case-Shiller U.S. National Home Price NSA Index (SPCSUSA); data is as of 1/31/26. Residential mortgage originations are for the quarterly period ended; source: Inside Mortgage Finance CURRENT MARKET ENVIRONMENT AND MACROECONOMIC TRENDS 19 Average 30-year fixed rate mortgage(1) Macroeconomic Metrics(4) U.S. Origination Market Forecast(3) (UPB in trillions) 10-year Treasury Bond Yield(2) 3/31/25 6/30/25 9/30/25 12/31/25 3/31/26 10-year Treasury bond yield 4.2% 4.2% 4.2% 4.2% 4.3% 2/10 year Treasury yield spread 0.3% 0.5% 0.5% 0.7% 0.5% 30-year fixed rate mortgage 6.7% 6.8% 6.3% 6.2% 6.4% Secondary mortgage rate 5.6% 5.5% 5.2% 5.0% 5.5% U.S. home price appreciation (Y/Y% change) 3.4% 1.9% 1.3% 1.1% 0.9% Residential mortgage originations (in billions) $360 $500 $495 $570 $530 6.15% 6.38% 4.17% 4.32% Purchase Refinance |
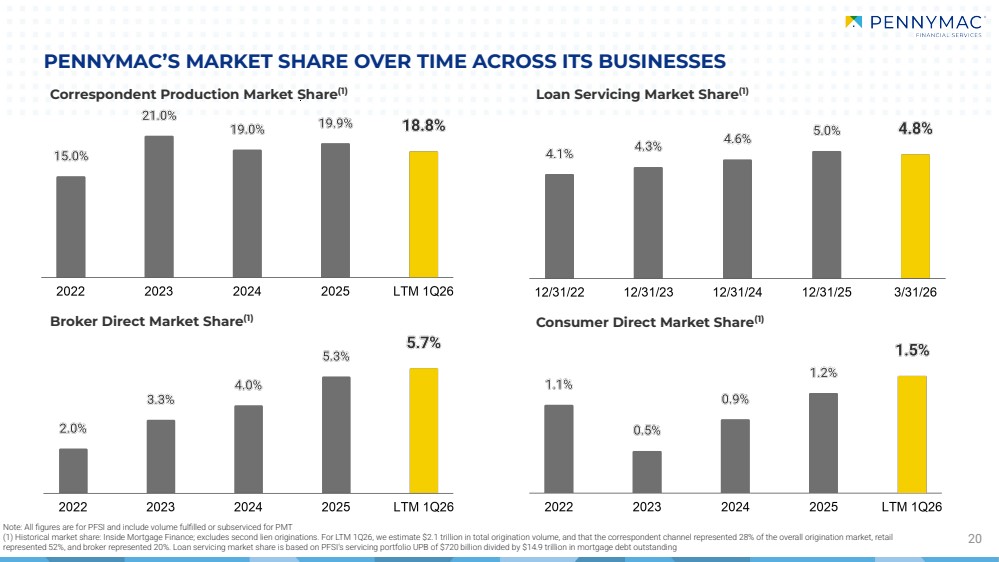
| PENNYMAC’S MARKET SHARE OVER TIME ACROSS ITS BUSINESSES 20 Loan Servicing Market Share Correspondent Production Market Share(1) (1) Broker Direct Market Share(1) Consumer Direct Market Share(1) Note: All figures are for PFSI and include volume fulfilled or subserviced for PMT (1) Historical market share: Inside Mortgage Finance; excludes second lien originations. For LTM 1Q26, we estimate $2.1 trillion in total origination volume, and that the correspondent channel represented 28% of the overall origination market, retail represented 52%, and broker represented 20%. Loan servicing market share is based on PFSI’s servicing portfolio UPB of $720 billion divided by $14.9 trillion in mortgage debt outstanding |
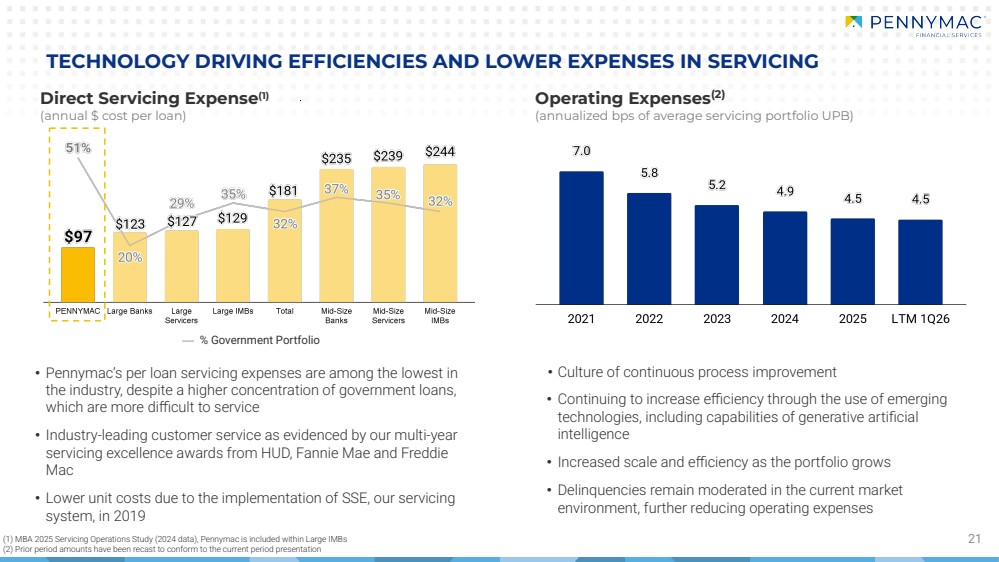
| • Pennymac’s per loan servicing expenses are among the lowest in the industry, despite a higher concentration of government loans, which are more difficult to service • Industry-leading customer service as evidenced by our multi-year servicing excellence awards from HUD, Fannie Mae and Freddie Mac • Lower unit costs due to the implementation of SSE, our servicing system, in 2019 21 Operating Expenses(2) (annualized bps of average servicing portfolio UPB) Direct Servicing Expense(1) (annual $ cost per loan) TECHNOLOGY DRIVING EFFICIENCIES AND LOWER EXPENSES IN SERVICING • Culture of continuous process improvement • Continuing to increase efficiency through the use of emerging technologies, including capabilities of generative artificial intelligence • Increased scale and efficiency as the portfolio grows • Delinquencies remain moderated in the current market environment, further reducing operating expenses % Government Portfolio (1) MBA 2025 Servicing Operations Study (2024 data), Pennymac is included within Large IMBs (2) Prior period amounts have been recast to conform to the current period presentation |
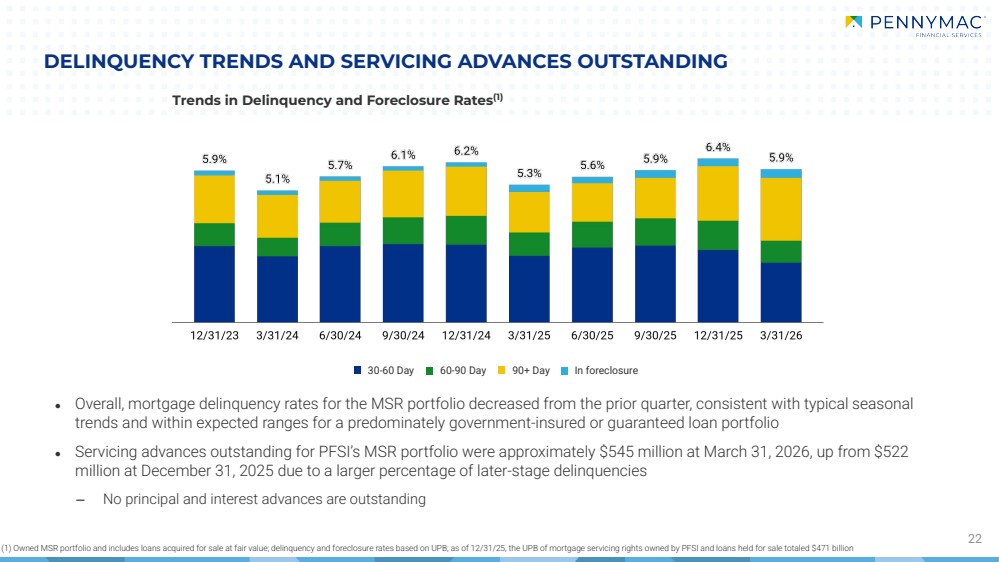
| DELINQUENCY TRENDS AND SERVICING ADVANCES OUTSTANDING 22 Trends in Delinquency and Foreclosure Rates(1) (1) Owned MSR portfolio and includes loans acquired for sale at fair value; delinquency and foreclosure rates based on UPB; as of 12/31/25, the UPB of mortgage servicing rights owned by PFSI and loans held for sale totaled $471 billion ● Overall, mortgage delinquency rates for the MSR portfolio decreased from the prior quarter, consistent with typical seasonal trends and within expected ranges for a predominately government-insured or guaranteed loan portfolio ● Servicing advances outstanding for PFSI’s MSR portfolio were approximately $545 million at March 31, 2026, up from $522 million at December 31, 2025 due to a larger percentage of later-stage delinquencies ‒ No principal and interest advances are outstanding 30-60 Day 60-90 Day 90+ Day In foreclosure |
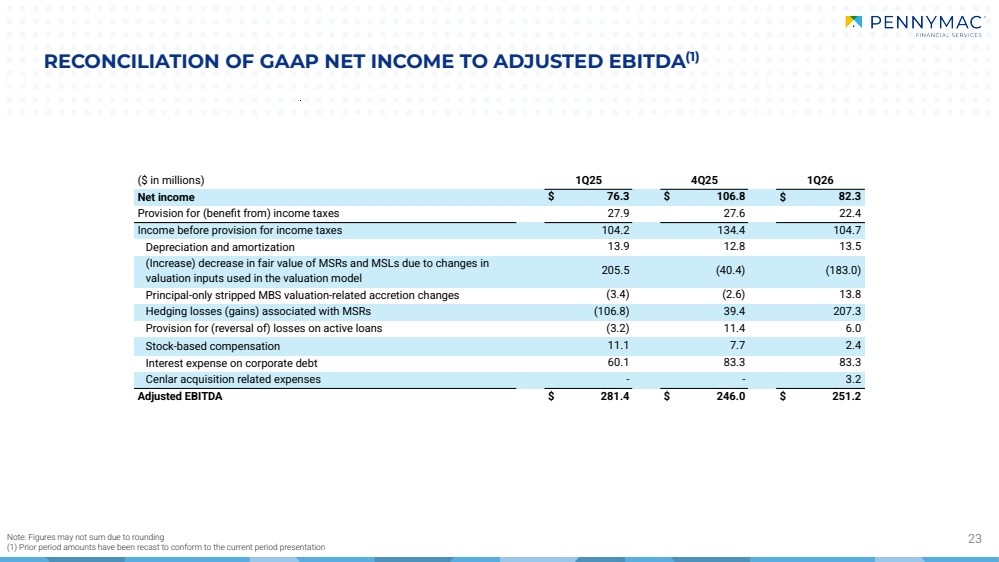
| RECONCILIATION OF GAAP NET INCOME TO ADJUSTED EBITDA(1) Note: Figures may not sum due to rounding 23 (1) Prior period amounts have been recast to conform to the current period presentation ($ in millions) 1Q25 4Q25 1Q26 Net income $ 76.3 $ 106.8 $ 82.3 Provision for (benefit from) income taxes 27.9 27.6 22.4 Income before provision for income taxes 104.2 134.4 104.7 Depreciation and amortization 13.9 12.8 13.5 (Increase) decrease in fair value of MSRs and MSLs due to changes in valuation inputs used in the valuation model 205.5 (40.4) (183.0) Principal-only stripped MBS valuation-related accretion changes (3.4) (2.6) 13.8 Hedging losses (gains) associated with MSRs (106.8) 39.4 207.3 Provision for (reversal of) losses on active loans (3.2) 11.4 6.0 Stock-based compensation 11.1 7.7 2.4 Interest expense on corporate debt 60.1 83.3 83.3 Cenlar acquisition related expenses - - 3.2 Adjusted EBITDA $ 281.4 $ 246.0 $ 251.2 |
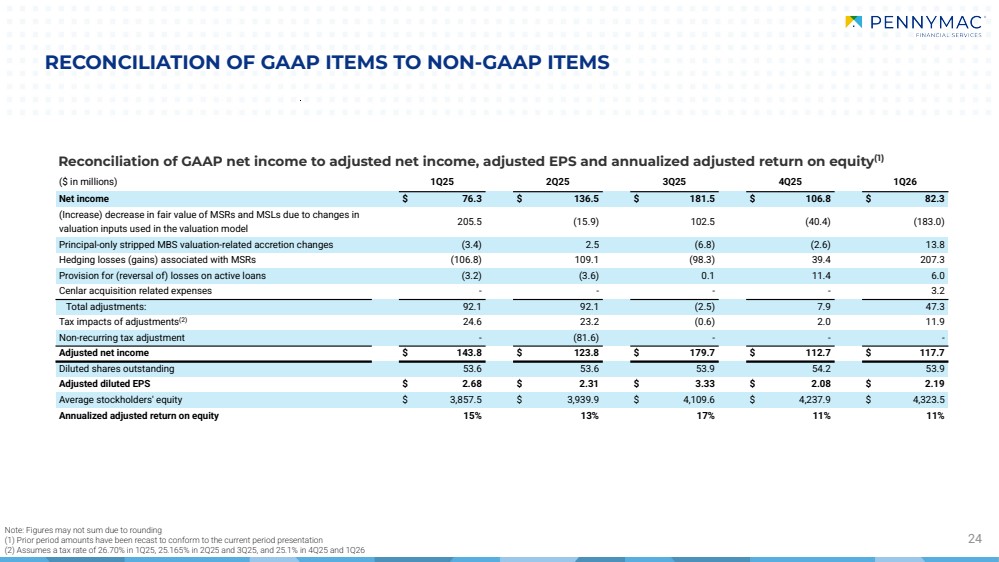
| Reconciliation of GAAP net income to adjusted net income, adjusted EPS and annualized adjusted return on equity(1) RECONCILIATION OF GAAP ITEMS TO NON-GAAP ITEMS 24 Note: Figures may not sum due to rounding (1) Prior period amounts have been recast to conform to the current period presentation (2) Assumes a tax rate of 26.70% in 1Q25, 25.165% in 2Q25 and 3Q25, and 25.1% in 4Q25 and 1Q26 ($ in millions) 1Q25 2Q25 3Q25 4Q25 1Q26 Net income $ 76.3 $ 136.5 $ 181.5 $ 106.8 $ 82.3 (Increase) decrease in fair value of MSRs and MSLs due to changes in valuation inputs used in the valuation model 205.5 (15.9) 102.5 (40.4) (183.0) Principal-only stripped MBS valuation-related accretion changes (3.4) 2.5 (6.8) (2.6) 13.8 Hedging losses (gains) associated with MSRs (106.8) 109.1 (98.3) 39.4 207.3 Provision for (reversal of) losses on active loans (3.2) (3.6) 0.1 11.4 6.0 Cenlar acquisition related expenses - - - - 3.2 Total adjustments: 92.1 92.1 (2.5) 7.9 47.3 Tax impacts of adjustments(2) 24.6 23.2 (0.6) 2.0 11.9 Non-recurring tax adjustment - (81.6) - - - Adjusted net income $ 143.8 $ 123.8 $ 179.7 $ 112.7 $ 117.7 Diluted shares outstanding 53.6 53.6 53.9 54.2 53.9 Adjusted diluted EPS $ 2.68 $ 2.31 $ 3.33 $ 2.08 $ 2.19 Average stockholders' equity $ 3,857.5 $ 3,939.9 $ 4,109.6 $ 4,237.9 $ 4,323.5 Annualized adjusted return on equity 15% 13% 17% 11% 11% |
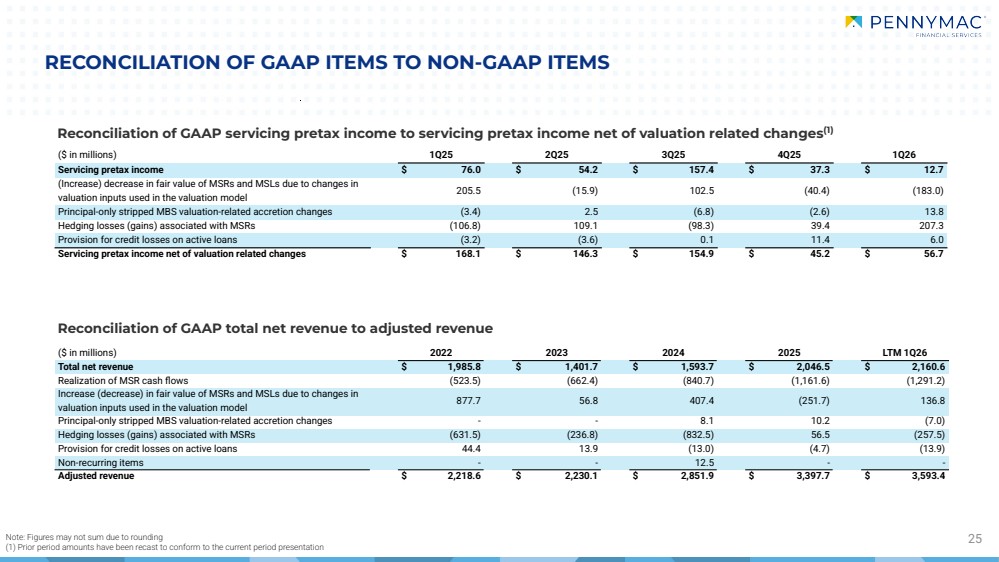
| Note: Figures may not sum due to rounding 25 (1) Prior period amounts have been recast to conform to the current period presentation RECONCILIATION OF GAAP ITEMS TO NON-GAAP ITEMS Reconciliation of GAAP servicing pretax income to servicing pretax income net of valuation related changes(1) ($ in millions) 1Q25 2Q25 3Q25 4Q25 1Q26 Servicing pretax income $ 76.0 $ 54.2 $ 157.4 $ 37.3 $ 12.7 (Increase) decrease in fair value of MSRs and MSLs due to changes in valuation inputs used in the valuation model 205.5 (15.9) 102.5 (40.4) (183.0) Principal-only stripped MBS valuation-related accretion changes (3.4) 2.5 (6.8) (2.6) 13.8 Hedging losses (gains) associated with MSRs (106.8) 109.1 (98.3) 39.4 207.3 Provision for credit losses on active loans (3.2) (3.6) 0.1 11.4 6.0 Servicing pretax income net of valuation related changes $ 168.1 $ 146.3 $ 154.9 $ 45.2 $ 56.7 Reconciliation of GAAP total net revenue to adjusted revenue ($ in millions) 2022 2023 2024 2025 LTM 1Q26 Total net revenue $ 1,985.8 $ 1,401.7 $ 1,593.7 $ 2,046.5 $ 2,160.6 Realization of MSR cash flows (523.5) (662.4) (840.7) (1,161.6) (1,291.2) Increase (decrease) in fair value of MSRs and MSLs due to changes in valuation inputs used in the valuation model 877.7 56.8 407.4 (251.7) 136.8 Principal-only stripped MBS valuation-related accretion changes - - 8.1 10.2 (7.0) Hedging losses (gains) associated with MSRs (631.5) (236.8) (832.5) 56.5 (257.5) Provision for credit losses on active loans 44.4 13.9 (13.0) (4.7) (13.9) Non-recurring items - - 12.5 - - Adjusted revenue $ 2,218.6 $ 2,230.1 $ 2,851.9 $ 3,397.7 $ 3,593.4 |
|