 | CHCT | ||||
| LISTED | |||||
| NYSE | |||||
| CHCT | ||||
| LISTED | |||||
| NYSE | |||||
SUPPLEMENTAL INFORMATION Q1 2026 | ||
| Community Healthcare Trust | 1Q 2026 | Supplemental Information | |||||||
| ||
Portfolio Diversification | |||||
| Community Healthcare Trust | 1Q 2026 | Supplemental Information | |||||||
| ||
| March 31, 2026 | |||||
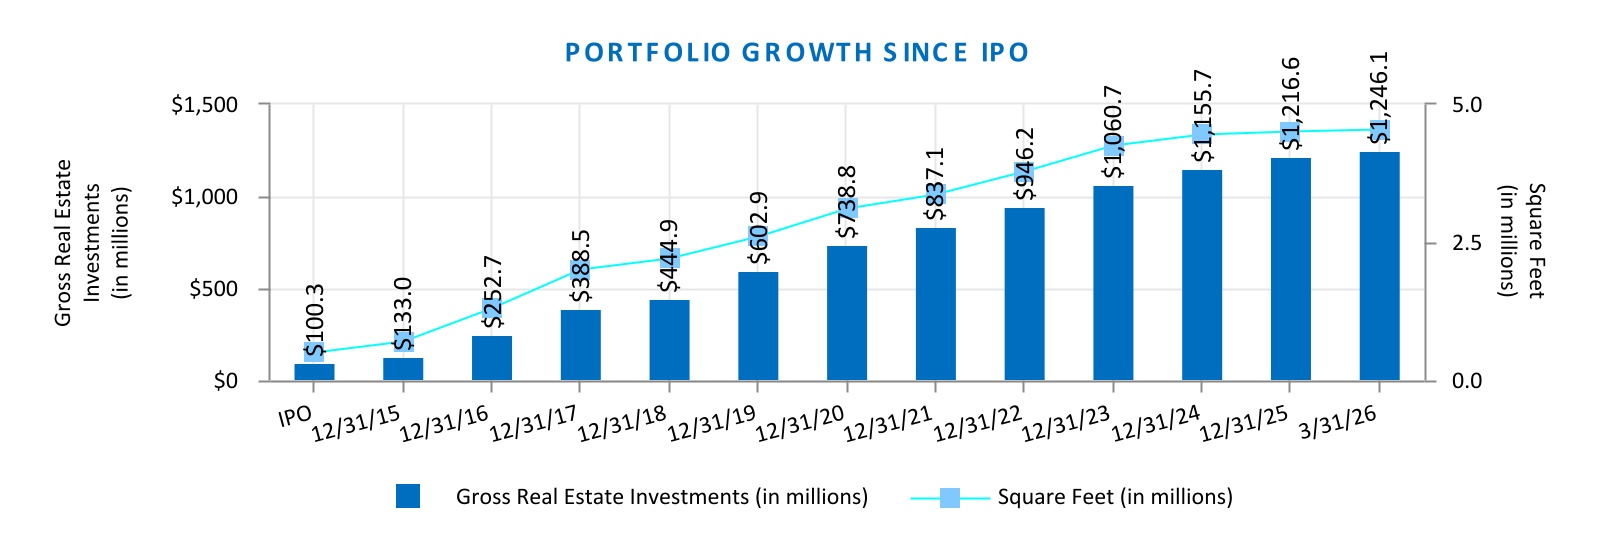
Gross real estate investments (in thousands) (1) | $1,246,149 | ||||
| Total properties | 198 | ||||
| % Leased | 89.8 | % | |||
| Total square feet owned | 4,535,753 | ||||
| Weighted Average remaining lease term (years) | 7.2 | ||||
| Cash and cash equivalents (in thousands) | $2,617 | ||||
| Debt to Total Capitalization | 44.0 | % | |||
| Interest rate per annum on Revolving Line of Credit | 5.3 | % | |||
Weighted average interest rate per annum on Term Loans (2) | 4.7 | % | |||
| Equity market cap (in millions) | $454.0 | ||||
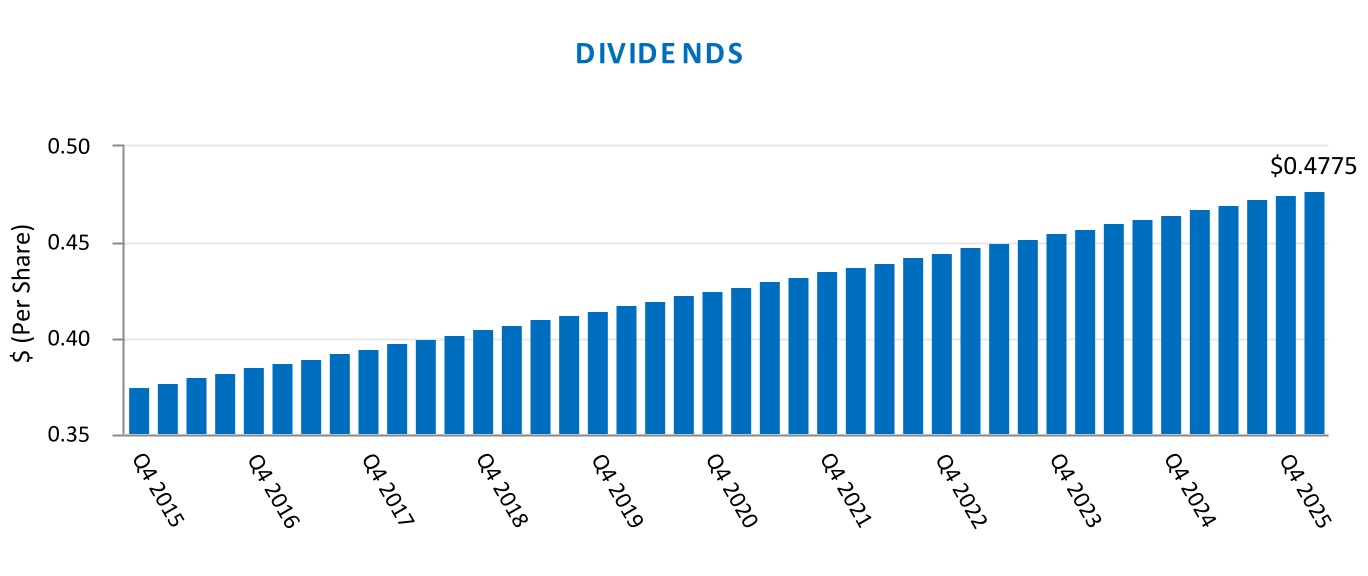
| Quarterly dividend paid in the period (per share) | $0.4775 | ||||
| Quarter end stock price (per share) | $15.89 | ||||
| Dividend yield | 12.0 | % | |||
| Common shares outstanding | 28,571,793 | ||||
| ___________ | |||||
(1) Includes one property with sales-type leases. | |||||
(2) Term Loans are fully hedged; this rate represents the weighted average hedged rates. | |||||
| Community Healthcare Trust | Page | 3 | 1Q 2026 | Supplemental Information | ||||||
| ||
| Community Healthcare Trust Incorporated | |||||||||||||||||
| 3326 Aspen Grove Drive, Suite 150 | |||||||||||||||||
| Franklin, TN 37067 | |||||||||||||||||
| Phone: 615-771-3052 | |||||||||||||||||
| E-mail: Investorrelations@chct.reit | |||||||||||||||||
Website: www.chct.reit | |||||||||||||||||
| BOARD OF DIRECTORS | |||||||||||||||||
| Alan Gardner | Robert Hensley | Claire Gulmi | R. Lawrence Van Horn | Cathrine Cotman | David H. Dupuy | ||||||||||||
| Chairman of the Board | Audit Committee Chair | Compensation Committee Chair | ESG Committee Chair | Board member | Board member | ||||||||||||
| EXECUTIVE MANAGEMENT TEAM | ||||||||
| David H. Dupuy | William G. Monroe IV | Leigh Ann Stach | ||||||
| Chief Executive Officer and President | Executive Vice President Chief Financial Officer | Executive Vice President Chief Accounting Officer | ||||||
| COVERING ANALYSTS | |||||
| A. Goldfarb - Piper Sandler | M. Lewis - Truist Securities | ||||
| J. Kammert - Evercore ISI | B. Oxford - Colliers International Securities | ||||
| PROFESSIONAL SERVICES | |||||
| Independent Registered Public Accounting Firm | Transfer Agent | ||||
| BDO USA, P.C. | Equiniti Trust Company, LLC | ||||
| 501 Commerce Street, Suite 1400 | Operations Center | ||||
| Nashville, TN 37203 | 6201 15th Avenue | ||||
| Brooklyn, NY 11219 | |||||
| 1-800-937-5449 | |||||
| Community Healthcare Trust | Page | 4 | 1Q 2026 | Supplemental Information | ||||||
| ||
| Three Months Ended | ||||||||||||||||||||
| 1Q 2026 | 4Q 2025 | 3Q 2025 | 2Q 2025 | 1Q 2025 | ||||||||||||||||
| (Unaudited and in thousands, except per share data) | ||||||||||||||||||||
STATEMENTS OF OPERATIONS ITEMS (1)(2)(3)(4) | ||||||||||||||||||||
| Revenues | $ | 31,524 | $ | 30,946 | $ | 31,086 | $ | 29,085 | $ | 30,078 | ||||||||||
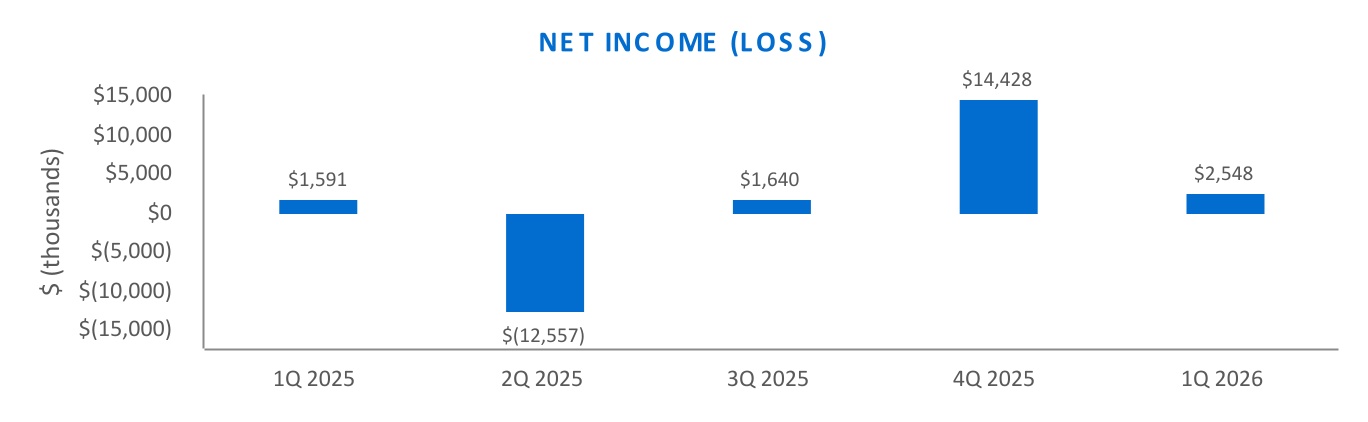
| Net income (loss) | $ | 2,548 | $ | 14,428 | $ | 1,640 | $ | (12,557) | $ | 1,591 | ||||||||||
| NOI | $ | 25,155 | $ | 24,932 | $ | 25,156 | $ | 23,500 | $ | 23,983 | ||||||||||
EBITDAre | $ | 20,050 | $ | 20,173 | $ | 20,505 | $ | 4,274 | $ | 18,886 | ||||||||||
Adjusted EBITDAre | $ | 22,761 | $ | 22,772 | $ | 22,970 | $ | 20,068 | $ | 21,596 | ||||||||||
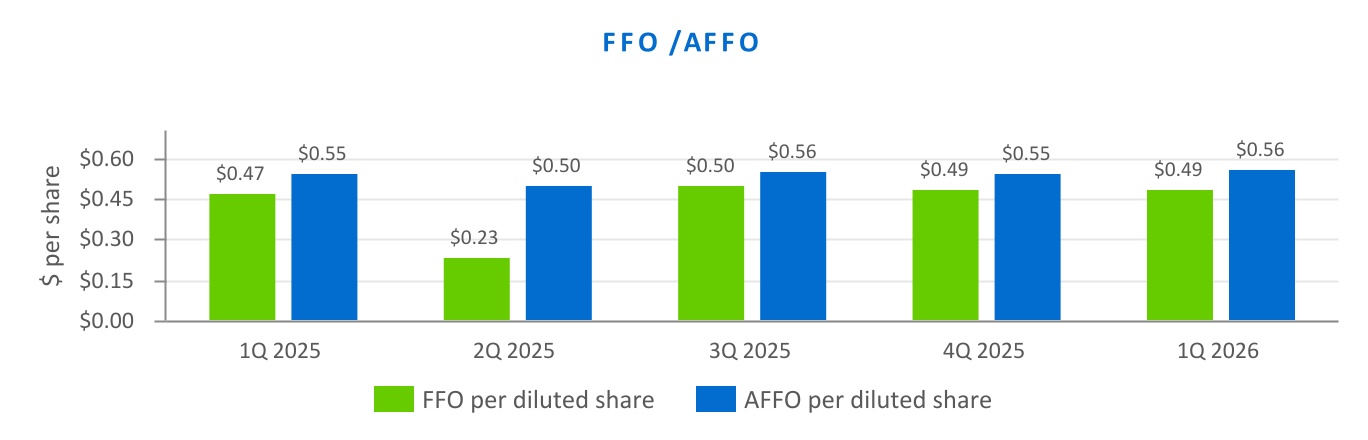
| FFO | $ | 13,399 | $ | 13,329 | $ | 13,547 | $ | 6,336 | $ | 12,668 | ||||||||||
| AFFO | $ | 15,350 | $ | 14,943 | $ | 15,099 | $ | 13,585 | $ | 14,739 | ||||||||||
Per Diluted Share: (1)(2)(3)(4) | ||||||||||||||||||||
Net income (loss) attributable to common shareholders | $ | 0.07 | $ | 0.51 | $ | 0.03 | $ | (0.50) | $ | 0.03 | ||||||||||
| FFO | $ | 0.49 | $ | 0.49 | $ | 0.50 | $ | 0.23 | $ | 0.47 | ||||||||||
| AFFO | $ | 0.56 | $ | 0.55 | $ | 0.56 | $ | 0.50 | $ | 0.55 | ||||||||||
| ___________ | ||||||||||||||||||||
| (1) Net income for the fourth quarter of 2025 included net gains on sale, net of losses, totaling approximately $12.3 million, resulting in an increase of $0.46 per diluted share. | ||||||||||||||||||||
| (2) Net loss, FFO and AFFO for the second quarter of 2025 included interest receivable reserves totaling approximately $1.7 million, resulting in a reduction of $0.06 per diluted share, FFO, and AFFO. | ||||||||||||||||||||
| (3) Net loss for the second quarter of 2025 included an $8.7 million credit loss reserve related to notes receivable with a geriatric behavioral hospital tenant that are incidental to the Company's main business. | ||||||||||||||||||||
| (4) Net loss and FFO for the second quarter of 2025 included severance and transition-related charges totaling approximately $5.9 million, including approximately $4.6 million of non-cash accelerated amortization of stock-based compensation, which reduced FFO per diluted common share by approximately $0.22. | ||||||||||||||||||||
| Community Healthcare Trust | Page | 5 | 1Q 2026 | Supplemental Information | ||||||
| ||
| As of | ||||||||||||||||||||
| 1Q 2026 | 4Q 2025 | 3Q 2025 | 2Q 2025 | 1Q 2025 | ||||||||||||||||
| (Unaudited and dollars in thousands) | ||||||||||||||||||||
| BALANCE SHEET ITEMS | ||||||||||||||||||||
| ASSETS | ||||||||||||||||||||
| Total real estate properties | $ | 1,238,080 | $ | 1,203,229 | $ | 1,190,151 | $ | 1,158,312 | $ | 1,148,772 | ||||||||||
| Total assets | $ | 1,010,093 | $ | 990,757 | $ | 987,261 | $ | 966,292 | $ | 985,114 | ||||||||||
| CAPITALIZATION | ||||||||||||||||||||
| Net debt | $ | 559,260 | $ | 532,199 | $ | 530,138 | $ | 500,077 | $ | 496,016 | ||||||||||
| Total capitalization | $ | 1,271,561 | $ | 1,241,902 | $ | 1,229,442 | $ | 1,200,858 | $ | 1,210,874 | ||||||||||
| Net debt/total capitalization | 44.0 | % | 42.9 | % | 43.1 | % | 41.6 | % | 41.0 | % | ||||||||||
| Market valuation | $ | 454,006 | $ | 467,501 | $ | 435,613 | $ | 471,766 | $ | 514,631 | ||||||||||
| Enterprise value | $ | 1,010,649 | $ | 996,360 | $ | 962,368 | $ | 966,980 | $ | 1,008,376 | ||||||||||
| Community Healthcare Trust | Page | 6 | 1Q 2026 | Supplemental Information | ||||||
| ||
| As of | |||||||||||||||||
| 1Q 2026 | 4Q 2025 | 3Q 2025 | 2Q 2025 | 1Q 2025 | |||||||||||||
ASSETS | (Unaudited; Dollars and shares in thousands, except per share data) | ||||||||||||||||
Real estate properties | |||||||||||||||||
Land and land improvements | $ | 162,587 | $ | 154,673 | $ | 154,272 | $ | 152,887 | $ | 149,506 | |||||||
Buildings, improvements, and lease intangibles | 1,074,680 | 1,047,743 | 1,035,070 | 1,004,616 | 998,933 | ||||||||||||
Personal property | 813 | 813 | 809 | 809 | 333 | ||||||||||||
Total real estate properties | 1,238,080 | 1,203,229 | 1,190,151 | 1,158,312 | 1,148,772 | ||||||||||||
Less accumulated depreciation | (290,958) | (280,316) | (272,481) | (262,961) | (253,537) | ||||||||||||
Total real estate properties, net | 947,122 | 922,913 | 917,670 | 895,351 | 895,235 | ||||||||||||
Cash and cash equivalents | 2,617 | 3,340 | 3,383 | 4,863 | 2,271 | ||||||||||||
| Assets held for sale, net | — | 5,265 | 6,205 | 5,465 | 6,755 | ||||||||||||
Other assets, net | 60,354 | 59,239 | 60,003 | 60,613 | 80,853 | ||||||||||||
Total assets | $ | 1,010,093 | $ | 990,757 | $ | 987,261 | $ | 966,292 | $ | 985,114 | |||||||
LIABILITIES AND STOCKHOLDERS' EQUITY | |||||||||||||||||
Liabilities | |||||||||||||||||
Debt, net | $ | 559,260 | $ | 532,199 | $ | 530,138 | $ | 500,077 | $ | 496,016 | |||||||
Accounts payable and accrued liabilities | 16,431 | 14,925 | 17,205 | 13,944 | 12,058 | ||||||||||||
Other liabilities, net | 13,059 | 14,246 | 13,095 | 14,451 | 15,719 | ||||||||||||
Total liabilities | 588,750 | 561,370 | 560,438 | 528,472 | 523,793 | ||||||||||||
Commitments and contingencies | |||||||||||||||||
Stockholders' Equity | |||||||||||||||||
Preferred stock, $0.01 par value; 50,000 shares authorized | — | — | — | — | — | ||||||||||||
Common stock, $0.01 par value; 450,000 shares authorized | 286 | 285 | 285 | 284 | 283 | ||||||||||||
Additional paid-in capital | 719,819 | 717,450 | 714,890 | 712,498 | 706,776 | ||||||||||||
Cumulative net income | 93,325 | 90,777 | 76,349 | 74,709 | 87,266 | ||||||||||||
Accumulated other comprehensive gain | 7,395 | 6,691 | 7,568 | 9,121 | 12,402 | ||||||||||||
Cumulative dividends | (399,482) | (385,816) | (372,269) | (358,792) | (345,406) | ||||||||||||
Total stockholders’ equity | 421,343 | 429,387 | 426,823 | 437,820 | 461,321 | ||||||||||||
Total liabilities and stockholders' equity | $ | 1,010,093 | $ | 990,757 | $ | 987,261 | $ | 966,292 | $ | 985,114 | |||||||
| Community Healthcare Trust | Page | 7 | 1Q 2026 | Supplemental Information | ||||||
| ||
| Three Months Ended | |||||||||||||||||
| 1Q 2026 | 4Q 2025 | 3Q 2025 | 2Q 2025 | 1Q 2025 | |||||||||||||
(Unaudited; Dollars and shares in thousands, except per share data) | |||||||||||||||||
REVENUES | |||||||||||||||||
Rental income | $ | 31,269 | $ | 30,679 | $ | 30,814 | $ | 30,128 | $ | 29,730 | |||||||
Other operating interest | 255 | 267 | 272 | (1,043) | 348 | ||||||||||||
| 31,524 | 30,946 | 31,086 | 29,085 | 30,078 | |||||||||||||
EXPENSES | |||||||||||||||||
Property operating | 6,369 | 6,014 | 5,930 | 5,585 | 6,095 | ||||||||||||
General and administrative (1)(2) | 5,108 | 4,778 | 4,658 | 10,559 | 5,100 | ||||||||||||
Depreciation and amortization | 10,657 | 10,814 | 10,902 | 10,879 | 10,943 | ||||||||||||
| 22,134 | 21,606 | 21,490 | 27,023 | 22,138 | |||||||||||||
| OTHER (EXPENSE) INCOME | |||||||||||||||||
| (Loss) gain, net of impairment, on the sale of real estate assets | (46) | 12,051 | (888) | 640 | — | ||||||||||||
| Interest expense | (6,799) | (6,959) | (7,075) | (6,592) | (6,352) | ||||||||||||
| Credit loss reserve | — | — | — | (8,672) | — | ||||||||||||
| Deferred income tax expense | — | (23) | — | — | — | ||||||||||||
| Interest and other income, net | 3 | 19 | 7 | 5 | 3 | ||||||||||||
| (6,842) | 5,088 | (7,956) | (14,619) | (6,349) | |||||||||||||
| NET INCOME (LOSS) | $ | 2,548 | $ | 14,428 | $ | 1,640 | $ | (12,557) | $ | 1,591 | |||||||
| NET INCOME (LOSS) PER DILUTED COMMON SHARE | $ | 0.07 | $ | 0.51 | $ | 0.03 | $ | (0.50) | $ | 0.03 | |||||||
WEIGHTED AVERAGE COMMON SHARES OUTSTANDING | 26,991 | 26,953 | 26,934 | 26,803 | 26,733 | ||||||||||||
DIVIDENDS DECLARED, PER COMMON SHARE, IN THE PERIOD | $ | 0.4775 | $ | 0.4750 | $ | 0.4725 | $ | 0.4700 | $ | 0.4675 | |||||||
(1) GENERAL AND ADMINISTRATIVE EXPENSES: | |||||||||||||||||
| Non-cash vs. Cash: | |||||||||||||||||
Non-cash (stock-based compensation) | 53.1 | % | 54.4 | % | 52.9 | % | 54.3 | % | 53.1 | % | |||||||
Cash | 46.9 | % | 45.6 | % | 47.1 | % | 45.7 | % | 46.9 | % | |||||||
| As a % of Revenue: | |||||||||||||||||
Non-cash (stock-based compensation) | 8.6 | % | 8.4 | % | 8.0 | % | 8.7 | % | 9.0 | % | |||||||
Cash | 7.6 | % | 7.0 | % | 7.1 | % | 7.3 | % | 7.9 | % | |||||||
| (2) General and administrative expenses for the three months ended June 30, 2025 includes the accelerated amortization of stock-based compensation totaling $4.6 million and severance and transition related expense totaling $1.3 million, recognized upon a termination. These amounts are not included in the calculations above in footnote (1). | |||||||||||||||||
| Community Healthcare Trust | Page | 8 | 1Q 2026 | Supplemental Information | ||||||
| ||
| Three Months Ended | |||||||||||||||||||||||
| 1Q 2026 | 4Q 2025 | 3Q 2025 | 2Q 2025 | 1Q 2025 | |||||||||||||||||||
(Unaudited; Dollars and shares in thousands, except per share data) | |||||||||||||||||||||||
NET INCOME (LOSS)(1)(2)(3)(4) | $ | 2,548 | $ | 14,428 | $ | 1,640 | $ | (12,557) | $ | 1,591 | |||||||||||||
| Real estate depreciation and amortization | 10,805 | 10,952 | 11,019 | 10,861 | 11,077 | ||||||||||||||||||
| Credit loss reserve | — | — | — | 8,672 | — | ||||||||||||||||||
| Loss (gain), net of impairment, on the sale of real estate assets | 46 | (12,051) | 888 | (640) | — | ||||||||||||||||||
FFO(1)(3) | $ | 13,399 | $ | 13,329 | $ | 13,547 | $ | 6,336 | $ | 12,668 | |||||||||||||
| Straight-line rent | (760) | (985) | (913) | (1,184) | (639) | ||||||||||||||||||
| Stock-based compensation | 2,711 | 2,599 | 2,465 | 2,531 | 2,710 | ||||||||||||||||||
| Accelerated amortization of stock-based compensation | — | — | — | 4,591 | — | ||||||||||||||||||
| Severance and transition related expenses | — | — | — | 1,311 | — | ||||||||||||||||||
AFFO(2)(3) | $ | 15,350 | $ | 14,943 | $ | 15,099 | $ | 13,585 | $ | 14,739 | |||||||||||||
| FFO PER COMMON SHARE | $ | 0.49 | $ | 0.49 | $ | 0.50 | $ | 0.23 | $ | 0.47 | |||||||||||||
| AFFO PER COMMON SHARE | $ | 0.56 | $ | 0.55 | $ | 0.56 | $ | 0.50 | $ | 0.55 | |||||||||||||
| WEIGHTED AVERAGE COMMON SHARES OUTSTANDING | 27,570 | 27,259 | 27,195 | 27,011 | 27,007 | ||||||||||||||||||
| ________________ | |||||||||||||||||||||||
| (1) Net income for the fourth quarter of 2025 included net gains on sale, net of losses, totaling approximately $12.3 million, resulting in an increase of $0.46 per diluted share. | |||||||||||||||||||||||
| (2) Net loss, FFO and AFFO for the second quarter of 2025 included interest receivable reserves totaling approximately $1.7 million, resulting in a reduction of $0.06 per diluted share for net loss, FFO, and AFFO. | |||||||||||||||||||||||
| (3) Net loss for the second quarter of 2025 included an $8.7 million credit loss reserve related to notes receivable with a geriatric behavioral hospital tenant that are incidental to the Company's main business. | |||||||||||||||||||||||
| (4) Net loss and FFO for the second quarter of 2025 included severance and transition-related charges totaling approximately $5.9 million, including approximately $4.6 million of non-cash accelerated amortization of stock-based compensation, which reduced FFO per diluted common share by approximately $0.22. | |||||||||||||||||||||||
AFFO, ADJUSTED FOR ACQUISITIONS (1) | |||||||||||||||||||||||
| AFFO | $ | 15,350 | $ | 14,943 | $ | 15,099 | $ | 13,585 | $ | 14,739 | |||||||||||||
Revenue on Properties Acquired in the period (2) | 422 | 510 | 62 | 122 | — | ||||||||||||||||||
Property operating expense adjustment (2) | (63) | (67) | (8) | — | — | ||||||||||||||||||
Interest expense adjustment (3) | (83) | (114) | (14) | — | (41) | ||||||||||||||||||
| AFFO, ADJUSTED FOR ACQUISITIONS | $ | 15,626 | $ | 15,272 | $ | 15,139 | $ | 13,707 | $ | 14,698 | |||||||||||||
| (1) AFFO is adjusted to reflect acquisitions as if they had occurred on the first day of the applicable period. | |||||||||||||||||||||||
| (2) Revenue and expense adjustments are calculated based on expected returns and leases in place at acquisition. | |||||||||||||||||||||||
| (3) The interest expense adjustment was calculated using the weighted average interest rate on the Company's revolving credit facility. | |||||||||||||||||||||||
| AMORTIZATION OF STOCK-BASED COMPENSATION | |||||||||||||||||||||||
Amortization Required by GAAP (1)(2) | $ | 2,711 | $ | 2,599 | $ | 2,465 | $ | 2,531 | $ | 2,710 | |||||||||||||
Amortization Based on Legal Vesting Periods (2) | 2,155 | 2,173 | 2,122 | 2,035 | 2,208 | ||||||||||||||||||
| Acceleration of Amortization | $ | 556 | $ | 426 | $ | 343 | $ | 496 | $ | 502 | |||||||||||||
| (1) GAAP requires that deferred compensation be amortized over the earlier of the vesting or retirement eligibility date. | |||||||||||||||||||||||
| (2) Amortization amounts for the second quarter of 2025 do not include the accelerated amortization of stock-based compensation totaling $4.6 million recognized upon a termination. | |||||||||||||||||||||||
| Community Healthcare Trust | Page | 9 | 1Q 2026 | Supplemental Information | ||||||
| ||
| Three Months Ended | ||||||||||||||||||||
| 1Q 2026 | 4Q 2025 | 3Q 2025 | 2Q 2025 | 1Q 2025 | ||||||||||||||||
(Unaudited; Dollars and shares in thousands, except per share data) | ||||||||||||||||||||
| NET OPERATING INCOME | ||||||||||||||||||||
Net income (loss)(1)(2) | $ | 2,548 | $ | 14,428 | $ | 1,640 | $ | (12,557) | $ | 1,591 | ||||||||||
General and administrative(3) | 5,108 | 4,778 | 4,658 | 4,657 | 5,100 | |||||||||||||||
| Accelerated amortization of deferred compensation | — | — | — | 4,591 | — | |||||||||||||||
| Severance and transition-related compensation | — | — | — | 1,311 | — | |||||||||||||||
| Depreciation and amortization | 10,657 | 10,814 | 10,902 | 10,879 | 10,943 | |||||||||||||||
| Loss (gain), net of impairment, on the sales of real estate assets | 46 | (12,051) | 888 | (640) | — | |||||||||||||||
| Credit loss reserve | — | — | — | 8,672 | — | |||||||||||||||
| Interest expense | 6,799 | 6,959 | 7,075 | 6,592 | 6,352 | |||||||||||||||
| Deferred Income tax expense | — | 23 | — | — | — | |||||||||||||||
| Interest and other income, net | (3) | (19) | (7) | (5) | (3) | |||||||||||||||
| NOI | $ | 25,155 | $ | 24,932 | $ | 25,156 | $ | 23,500 | $ | 23,983 | ||||||||||
EBITDAre and ADJUSTED EBITDAre | ||||||||||||||||||||
EBITDAre | ||||||||||||||||||||
Net (loss) income (1)(2) | $ | 2,548 | $ | 14,428 | $ | 1,640 | $ | (12,557) | $ | 1,591 | ||||||||||
| Interest expense | 6,799 | 6,959 | 7,075 | 6,592 | 6,352 | |||||||||||||||
| Depreciation and amortization | 10,657 | 10,814 | 10,902 | 10,879 | 10,943 | |||||||||||||||
| Deferred Income tax expense | — | 23 | — | — | — | |||||||||||||||
| Loss (gain), net of impairment, on the sale of real estate assets | 46 | (12,051) | 888 | (640) | — | |||||||||||||||
EBITDAre | $ | 20,050 | $ | 20,173 | $ | 20,505 | $ | 4,274 | $ | 18,886 | ||||||||||
| Non-cash stock-based compensation expense | 2,711 | 2,599 | 2,465 | 2,531 | 2,710 | |||||||||||||||
| Accelerated amortization of stock-based compensation | — | — | — | 4,591 | — | |||||||||||||||
| Credit loss reserve | — | — | — | 8,672 | — | |||||||||||||||
ADJUSTED EBITDAre | $ | 22,761 | $ | 22,772 | $ | 22,970 | $ | 20,068 | $ | 21,596 | ||||||||||
ADJUSTED EBITDAre ANNUALIZED (4) | $ | 91,044 | ||||||||||||||||||
(1) During the second quarter of 2025, the Company reversed interest totaling approximately $1.7 million related to a tenant. | ||
| (2) During the second quarter of 2025 the Company recorded severance and transition-related charges totaling approximately $5.9 million related to the termination of an employee, including approximately $4.6 of million non-cash accelerated amortization of stock-based compensation. | ||
| (3) Severance and transition-related compensation, which is included in general and administrative expenses on the income statement, is shown separately in the reconciliation above for the second quarter of 2025. | ||
(4) Adjusted EBITDAre multiplied by 4. This annualized amount may differ significantly from the actual full year results. | ||
| Community Healthcare Trust | Page | 10 | 1Q 2026 | Supplemental Information | ||||||
| ||
| Three Months Ended | ||||||||||||||||||||
| 1Q 2026 | 4Q 2025 | 3Q 2025 | 2Q 2025 | 1Q 2025 | ||||||||||||||||
(Unaudited; Dollars and shares in thousands, except per share data) | ||||||||||||||||||||
| WEIGHTED AVERAGE COMMON SHARES OUTSTANDING (1) | ||||||||||||||||||||
| Weighted average common shares outstanding | 28,556 | 28,471 | 28,430 | 28,364 | 28,324 | |||||||||||||||
Unvested restricted shares | (1,565) | (1,518) | (1,496) | (1,561) | (1,591) | |||||||||||||||
Weighted average common shares outstanding - EPS | 26,991 | 26,953 | 26,934 | 26,803 | 26,733 | |||||||||||||||
Weighted average common shares outstanding - FFO Basic | 26,991 | 26,953 | 26,934 | 26,803 | 26,733 | |||||||||||||||
| Potential dilutive common shares (from below) | 579 | 306 | 261 | 208 | 274 | |||||||||||||||
| Weighted average common shares outstanding - FFO Diluted | 27,570 | 27,259 | 27,195 | 27,011 | 27,007 | |||||||||||||||
| TREASURY SHARE CALCULATION | ||||||||||||||||||||
| Unrecognized deferred compensation-end of period | $ | 17,257 | $ | 17,665 | $ | 19,968 | $ | 19,919 | $ | 25,420 | ||||||||||
| Unrecognized deferred compensation-beginning of period | $ | 17,665 | $ | 19,968 | $ | 19,919 | $ | 25,420 | $ | 25,668 | ||||||||||
| Average unrecognized deferred compensation | $ | 17,461 | $ | 18,817 | $ | 19,944 | $ | 22,670 | $ | 25,544 | ||||||||||
| Average share price per share | $ | 16.87 | $ | 14.93 | $ | 15.66 | $ | 16.50 | $ | 19.08 | ||||||||||
| Treasury shares | 1,035 | 1,260 | 1,274 | 1,374 | 1,339 | |||||||||||||||
| Unvested restricted shares | (1,565) | (1,518) | (1,496) | (1,561) | (1,591) | |||||||||||||||
| Unvested restricted share units | (49) | (48) | (39) | (21) | (22) | |||||||||||||||
| Treasury shares | 1,035 | 1,260 | 1,274 | 1,374 | 1,339 | |||||||||||||||
| Potential dilutive common shares | 579 | 306 | 261 | 208 | 274 | |||||||||||||||
| (1) Restricted stock awards and time-based RSUs are included in the calculation of weighted average common shares outstanding if dilutive. Performance-based RSUs are included in the calculation of weighted average common shares outstanding to the extent that they in-the-money as of the end of the reporting period and are dilutive. | ||||||||||||||||||||
| Community Healthcare Trust | Page | 11 | 1Q 2026 | Supplemental Information | ||||||
| ||
As of March 31, 2026 | |||||||||||
| Principal Balance | Stated Rate | Hedged Rate | |||||||||
| (in thousands) | |||||||||||
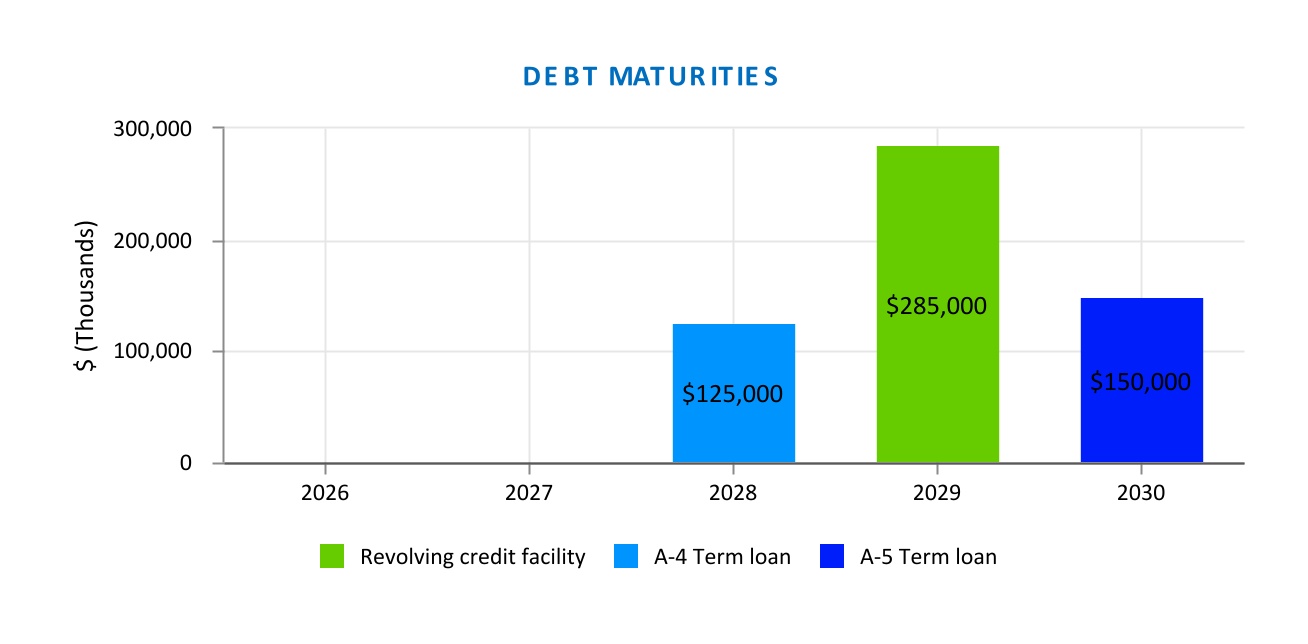
Revolving credit facility (1) | $ | 285,000 | 5.33% | n/a | |||||||
| Term loan A-4 | 125,000 | 3.60% | |||||||||
| Term loan A-5 | 150,000 | 5.61% | |||||||||
| Debt | 560,000 | ||||||||||
| Deferred Financing Costs, net | (740) | ||||||||||
| Debt, net | $ | 559,260 | |||||||||
| Select Covenants | Required | As of March 31, 2026 | ||||||
| Leverage ratio | ≤ 60.0% | 44.7 | % | |||||
| Fixed charge coverage ratio | ≥ 1.50x | 2.9 | ||||||
| Tangible net worth (in thousands) | ≥ $504,476 | $692,210 | ||||||
| Secured indebtedness | ≤ 30.0% | — | % | |||||
| Minimum debt service coverage ratio | ≥ 2.0 | 3.2 | ||||||
| Community Healthcare Trust | Page | 12 | 1Q 2026 | Supplemental Information | ||||||
| ||
| Property | Market | Property Type | Date Acquired | % Leased at Acquisition | Purchase Price (in thousands) | Square Feet | ||||||||||||||
| Nobis Rehabilitation Hospital | Pinellas Park, FL | IRF | 2/19/2026 | 100.0 | % | $ | 28,500 | 37,151 | ||||||||||||
| 100.0 | % | $ | 28,500 | 37,151 | ||||||||||||||||
| Community Healthcare Trust | Page | 13 | 1Q 2026 | Supplemental Information | ||||||
| ||
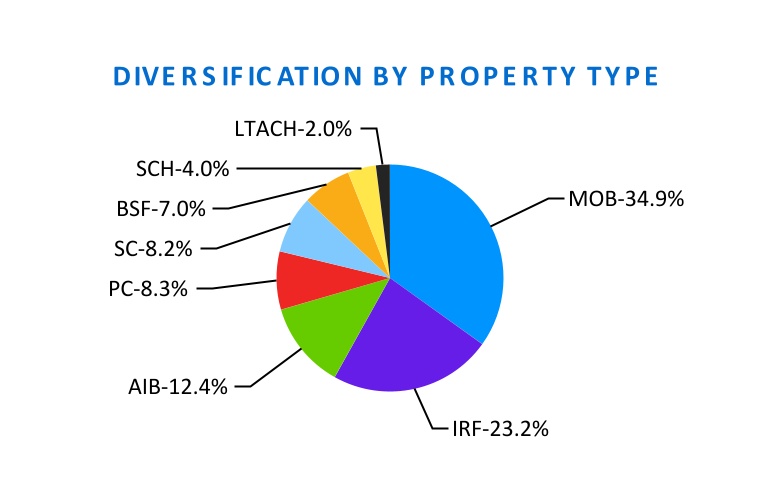
| Property Type | Annualized Rent (%) | ||||
| Medical Office Building (MOB) | 34.9 | % | |||
| Inpatient Rehabilitation Facilities (IRF) | 23.2 | % | |||
| Acute Inpatient Behavioral (AIB) | 12.4 | % | |||
| Physician Clinics (PC) | 8.3 | % | |||
| Specialty Centers (SC) | 8.2 | % | |||
| Behavioral Specialty Facilities (BSF) | 7.0 | % | |||
| Surgical Centers and Hospitals (SCH) | 4.0 | % | |||
| Long-term Acute Care Hospitals (LTACH) | 2.0 | % | |||
| Total | 100.0 | % | |||
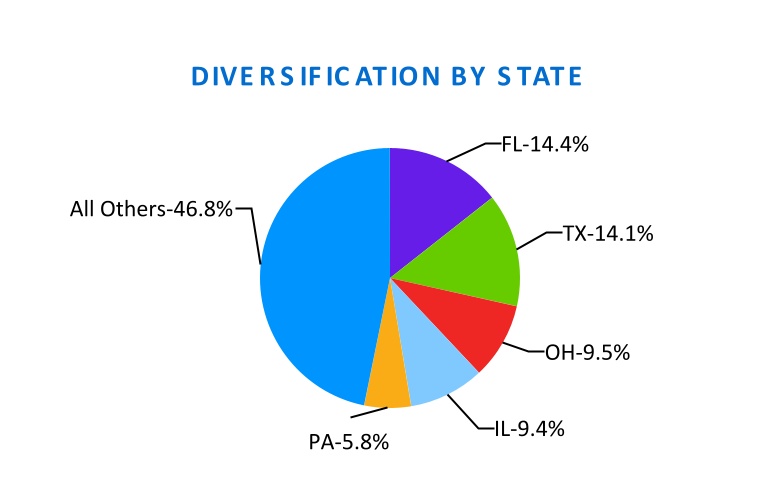
| State | Annualized Rent (%) | ||||
| Florida (FL) | 14.4 | % | |||
| Texas (TX) | 14.1 | % | |||
| Ohio (OH) | 9.5 | % | |||
| Illinois (IL) | 9.4 | % | |||
| Pennsylvania (PA) | 5.8 | % | |||
| All Others | 46.8 | % | |||
| Total | 100.0 | % | |||
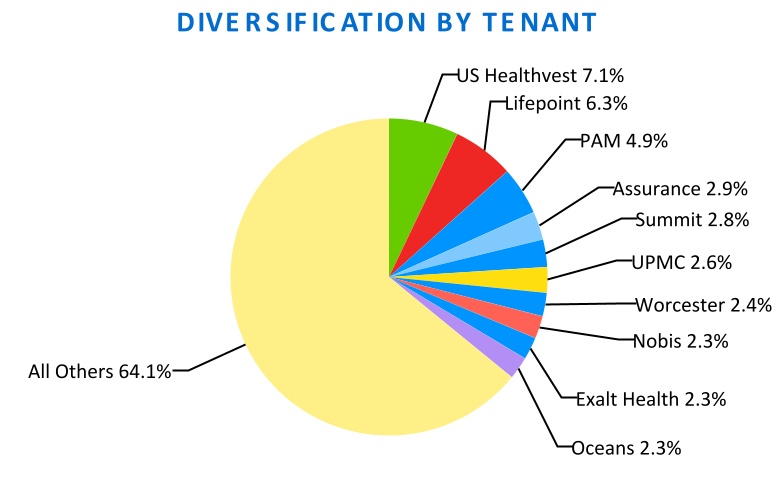
| Tenant | Annualized Rent (%) | ||||
| US Healthvest | 7.1 | % | |||
| Lifepoint Health (Lifepoint) | 6.3 | % | |||
| PAM Health (PAM) | 4.9 | % | |||
| Assurance Health (Assurance) | 2.9 | % | |||
| Summit Behavioral Healthcare (Summit) | 2.8 | % | |||
| UPMC - University of Pittsburgh Medical Center | 2.6 | % | |||
| Worcester Behavioral Innovations Hospital (Worcester) | 2.4 | % | |||
| Nobis Rehabilitation Partners | 2.3 | % | |||
| Exalt Health, LLC | 2.3 | % | |||
| Oceans Behavioral (Oceans) | 2.3 | % | |||
| All Others | 64.1 | % | |||
| Total | 100.0 | % | |||
| Community Healthcare Trust | Page | 14 | 1Q 2026 | Supplemental Information | ||||||
| ||
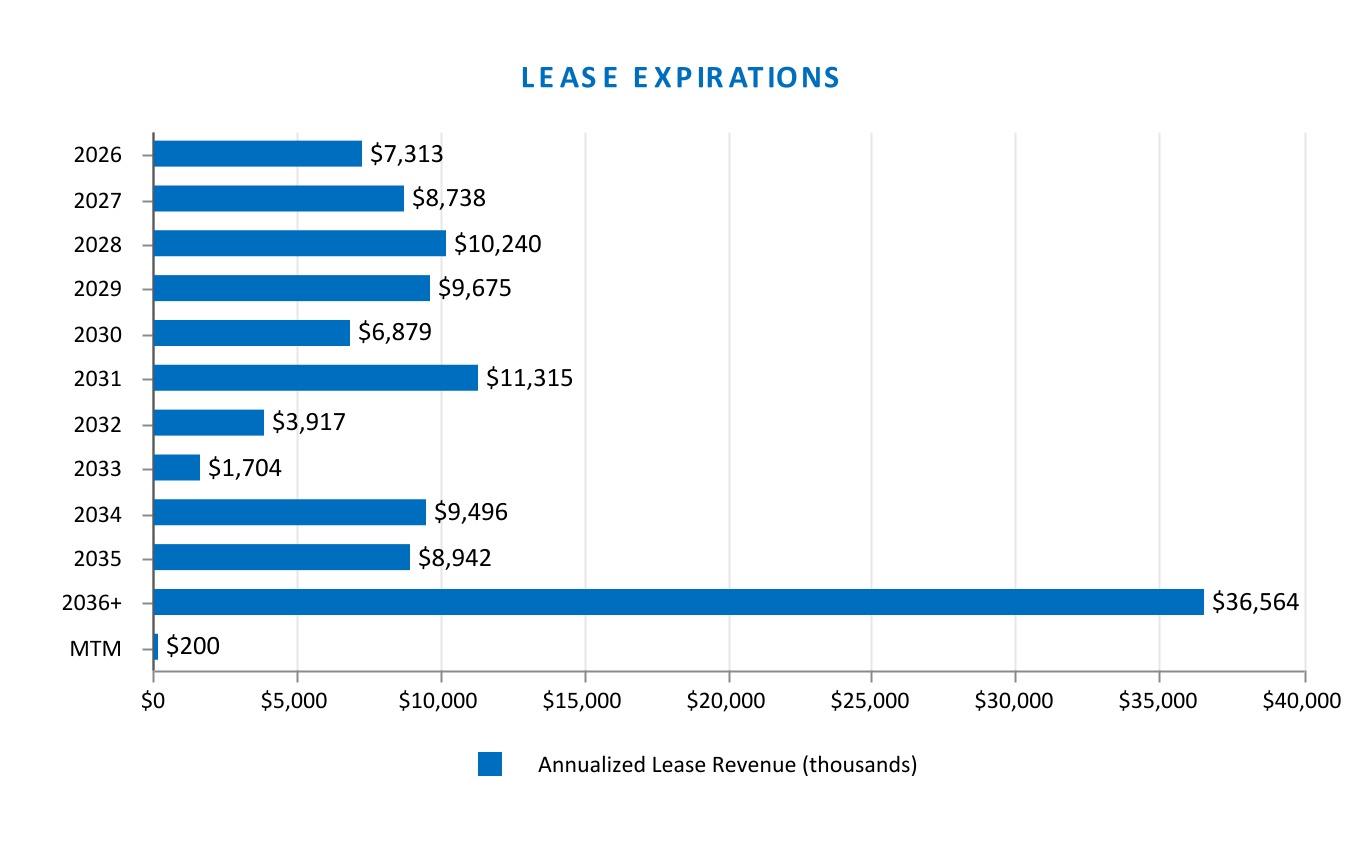
| Total Leased Sq. Ft. | Annualized Rent | |||||||||||||||||||
| Year | Number of Leases Expiring | Amount (thousands) | Percent (%) | Amount ($) (thousands) | Percent (%) | |||||||||||||||
| 2026 | 57 | 329 | 8.1 | % | $ | 7,313 | 6.4 | % | ||||||||||||
| 2027 | 71 | 386 | 9.5 | % | 8,738 | 7.6 | % | |||||||||||||
| 2028 | 72 | 485 | 11.9 | % | 10,240 | 8.9 | % | |||||||||||||
| 2029 | 46 | 375 | 9.2 | % | 9,675 | 8.4 | % | |||||||||||||
| 2030 | 36 | 294 | 7.2 | % | 6,879 | 6.0 | % | |||||||||||||
| 2031 | 33 | 410 | 10.1 | % | 11,315 | 9.8 | % | |||||||||||||
| 2032 | 24 | 201 | 4.9 | % | 3,917 | 3.4 | % | |||||||||||||
| 2033 | 15 | 85 | 2.1 | % | 1,704 | 1.5 | % | |||||||||||||
| 2034 | 20 | 260 | 6.4 | % | 9,496 | 8.3 | % | |||||||||||||
| 2035 | 16 | 233 | 5.7 | % | 8,942 | 7.8 | % | |||||||||||||
| Thereafter | 42 | 1,003 | 24.6 | % | 36,564 | 31.7 | % | |||||||||||||
| Month-to-Month | 5 | 12 | 0.3 | % | 200 | 0.2 | % | |||||||||||||
| Totals | 437 | 4,073 | 100.0 | % | $ | 114,983 | 100.0 | % | ||||||||||||
| Community Healthcare Trust | Page | 15 | 1Q 2026 | Supplemental Information | ||||||
| ||
| Property Name | Property Type | Area | % of Square Feet | Annualized Rent ($000's) | % of Annualized Rent | Population | MSA/MISA | Rank | ||||||||||||||||||
| Lancaster MOB | MOB | 10,098 | 0.22 | % | $ | 313.8 | 0.27 | % | 12,844,441 | Los Angeles-Long Beach-Anaheim, CA | 2 | |||||||||||||||
| Congress Medical Building 350 | MOB | 17,543 | 0.39 | % | $ | 169.7 | 0.15 | % | 9,434,123 | Chicago-Naperville-Elgin, IL-IN | 3 | |||||||||||||||
| Congress Medical Building 390 | MOB | 30,855 | 0.68 | % | $ | 526.0 | 0.46 | % | 9,434,123 | Chicago-Naperville-Elgin, IL-IN | 3 | |||||||||||||||
| Future Diagnostics Group | SC | 8,876 | 0.20 | % | $ | 320.5 | 0.28 | % | 9,434,123 | Chicago-Naperville-Elgin, IL-IN | 3 | |||||||||||||||
| Gurnee Medical Office Building | MOB | 22,968 | 0.51 | % | $ | 174.8 | 0.15 | % | 9,434,123 | Chicago-Naperville-Elgin, IL-IN | 3 | |||||||||||||||
| New Lenox Medical Clinic | PC | 7,905 | 0.17 | % | $ | 347.8 | 0.30 | % | 9,434,123 | Chicago-Naperville-Elgin, IL-IN | 3 | |||||||||||||||
| Morris Medical Center | MOB | 18,470 | 0.41 | % | $ | 388.7 | 0.34 | % | 9,434,123 | Chicago-Naperville-Elgin, IL-IN | 3 | |||||||||||||||
| Oak Lawn Medical Plaza | MOB | 33,356 | 0.74 | % | $ | 466.8 | 0.41 | % | 9,434,123 | Chicago-Naperville-Elgin, IL-IN | 3 | |||||||||||||||
| Lincolnwood Medical Building | PC | 14,863 | 0.33 | % | $ | 323.4 | 0.28 | % | 9,434,123 | Chicago-Naperville-Elgin, IL-IN | 3 | |||||||||||||||
| Joliet Medical Building | SC | 44,888 | 0.99 | % | $ | 462.0 | 0.40 | % | 9,434,123 | Chicago-Naperville-Elgin, IL-IN | 3 | |||||||||||||||
| Endeavor Health | PC | 13,700 | 0.30 | % | $ | 284.3 | 0.25 | % | 9,434,123 | Chicago-Naperville-Elgin, IL-IN | 3 | |||||||||||||||
| Skin MD | PC | 13,565 | 0.30 | % | $ | 539.8 | 0.47 | % | 9,434,123 | Chicago-Naperville-Elgin, IL-IN | 3 | |||||||||||||||
| Chicago Behavioral Hospital | AIB | 85,000 | 1.87 | % | $ | 2,270.7 | 1.97 | % | 9,434,123 | Chicago-Naperville-Elgin, IL-IN | 3 | |||||||||||||||
| US HealthVest - Lake | AIB | 83,658 | 1.84 | % | $ | 3,054.1 | 2.66 | % | 9,434,123 | Chicago-Naperville-Elgin, IL-IN | 3 | |||||||||||||||
| Texas Rehabilitation Hospital of Fort Worth, LLC | IRF | 39,761 | 0.88 | % | $ | 2,109.9 | 1.83 | % | 8,477,157 | Dallas-Fort Worth-Arlington, TX | 4 | |||||||||||||||
| Bayside Medical Center | MOB | 50,593 | 1.12 | % | $ | 1,119.8 | 0.97 | % | 7,904,627 | Houston-Pasadena-The Woodlands, TX | 5 | |||||||||||||||
| Gessner Road MOB | MOB | 14,347 | 0.32 | % | $ | 368.2 | 0.32 | % | 7,904,627 | Houston-Pasadena-The Woodlands, TX | 5 | |||||||||||||||
| Clear Lake Institute for Rehabilitation | IRF | 55,646 | 1.23 | % | $ | 3,137.2 | 2.73 | % | 7,904,627 | Houston-Pasadena-The Woodlands, TX | 5 | |||||||||||||||
| TRT Recovery Cartersville, LLC | BSF | 38,339 | 0.85 | % | $ | 1,048.8 | 0.91 | % | 6,482,182 | Atlanta-Sandy Springs-Roswell, GA | 6 | |||||||||||||||
| Clinton Towers MOB | MOB | 37,371 | 0.82 | % | $ | 916.1 | 0.80 | % | 6,465,724 | Washington-Arlington-Alexandria, DC-VA-MD-WV | 7 | |||||||||||||||
| 2301 Research Boulevard | MOB | 93,109 | 2.05 | % | $ | 2,282.9 | 1.99 | % | 6,465,724 | Washington-Arlington-Alexandria, DC-VA-MD-WV | 7 | |||||||||||||||
| Haddon Hill Professional Center | MOB | 25,118 | 0.55 | % | $ | 303.7 | 0.26 | % | 6,329,118 | Philadelphia-Camden-Wilmington, PA-NJ-DE-MD | 9 | |||||||||||||||
| Hopebridge - Westlake | BSF | 15,057 | 0.33 | % | $ | 239.2 | 0.21 | % | 6,329,118 | Philadelphia-Camden-Wilmington, PA-NJ-DE-MD | 9 | |||||||||||||||
| Continuum Wellness Center | MOB | 8,227 | 0.18 | % | $ | 169.6 | 0.15 | % | 5,228,938 | Phoenix-Mesa-Chandler, AZ | 10 | |||||||||||||||
| Virtuous Health Center | SCH | 11,722 | 0.26 | % | $ | 441.3 | 0.38 | % | 5,228,938 | Phoenix-Mesa-Chandler, AZ | 10 | |||||||||||||||
| Desert Mtn Health Center | BSF | 14,046 | 0.31 | % | $ | 647.2 | 0.56 | % | 5,228,938 | Phoenix-Mesa-Chandler, AZ | 10 | |||||||||||||||
| Associated Surgical Center of Dearborn | SCH | 12,400 | 0.27 | % | $ | 377.8 | 0.33 | % | 4,390,913 | Detroit-Warren-Dearborn, MI | 14 | |||||||||||||||
| Community Healthcare Trust | Page | 16 | 1Q 2026 | Supplemental Information | ||||||
| ||
| Property Name | Property Type | Area | % of Square Feet | Annualized Rent ($000's) | % of Annualized Rent | Population | MSA/MISA | Rank | ||||||||||||||||||
| Berry Surgical Center | SCH | 27,217 | 0.60 | % | $ | 653.0 | 0.57 | % | 4,390,913 | Detroit-Warren-Dearborn, MI | 14 | |||||||||||||||
| Smokey Point Behavioral Hospital | AIB | 70,100 | 1.55 | % | $ | 2,856.6 | 2.48 | % | 4,161,883 | Seattle-Tacoma-Bellevue, WA | 15 | |||||||||||||||
| Sanford Health Bemidji 1611 | MOB | 45,800 | 1.01 | % | $ | 1,616.3 | 1.41 | % | 3,790,295 | Minneapolis-St. Paul-Bloomington, MN-WI | 16 | |||||||||||||||
| Sanford Health Bemidji 1705 | MOB | 28,900 | 0.64 | % | $ | 649.5 | 0.56 | % | 3,790,295 | Minneapolis-St. Paul-Bloomington, MN-WI | 16 | |||||||||||||||
| Bay Area Physicians Center | MOB | 17,943 | 0.40 | % | $ | 421.5 | 0.37 | % | 3,418,895 | Tampa-St. Petersburg-Clearwater, FL | 17 | |||||||||||||||
| Nobis Rehabilitation Hospital | IRF | 37,151 | 0.82 | % | $ | 2,654.5 | 2.31 | % | 3,418,895 | Tampa-St. Petersburg-Clearwater, FL | 17 | |||||||||||||||
| Liberty Dialysis | SC | 8,450 | 0.19 | % | $ | 262.9 | 0.23 | % | 3,092,037 | Denver-Aurora-Centennial, CO | 19 | |||||||||||||||
| Bassin Center For Plastic-Surgery-Villages | PC | 2,894 | 0.06 | % | $ | 178.5 | 0.16 | % | 2,957,672 | Orlando-Kissimmee-Sanford, FL | 20 | |||||||||||||||
| Kissimmee Medical Plaza | PC | 4,902 | 0.11 | % | $ | — | — | % | 2,957,672 | Orlando-Kissimmee-Sanford, FL | 20 | |||||||||||||||
| PAM Health Rehabilitation Hospital of Ocoee | IRF | 37,151 | 0.82 | % | $ | 2,500.0 | 2.17 | % | 2,957,672 | Orlando-Kissimmee-Sanford, FL | 20 | |||||||||||||||
| Orthopaedic Associates of Osceola | PC | 15,167 | 0.33 | % | $ | 378.7 | 0.33 | % | 2,957,672 | Orlando-Kissimmee-Sanford, FL | 20 | |||||||||||||||
| Medical Village at Wintergarden | MOB | 21,532 | 0.47 | % | $ | 642.8 | 0.56 | % | 2,957,672 | Orlando-Kissimmee-Sanford, FL | 20 | |||||||||||||||
| Waters Edge Medical | MOB | 23,388 | 0.52 | % | $ | 412.8 | 0.36 | % | 2,857,781 | Baltimore-Columbia-Towson, MD | 22 | |||||||||||||||
| Northbay Professional Pavilion | MOB | 19,656 | 0.43 | % | $ | 488.3 | 0.42 | % | 2,857,781 | Baltimore-Columbia-Towson, MD | 22 | |||||||||||||||
| Righttime Medical Care | SC | 6,236 | 0.14 | % | $ | 359.5 | 0.31 | % | 2,857,781 | Baltimore-Columbia-Towson, MD | 22 | |||||||||||||||
| Belleville Medical Office | PC | 6,487 | 0.14 | % | $ | — | — | % | 2,814,421 | St. Louis, MO-IL | 23 | |||||||||||||||
| Eyecare Partners - 1310 | PC | 5,560 | 0.12 | % | $ | 55.5 | 0.05 | % | 2,814,421 | St. Louis, MO-IL | 23 | |||||||||||||||
| Eyecare Partners - 3990 | SCH | 16,608 | 0.37 | % | $ | 310.6 | 0.27 | % | 2,814,421 | St. Louis, MO-IL | 23 | |||||||||||||||
| Eyecare Partners - 204 | PC | 6,311 | 0.14 | % | $ | 52.0 | 0.05 | % | 2,814,421 | St. Louis, MO-IL | 23 | |||||||||||||||
| Heartland Women's Healthcare of Advantia Shiloh | PC | 16,212 | 0.36 | % | $ | 366.6 | 0.32 | % | 2,814,421 | St. Louis, MO-IL | 23 | |||||||||||||||
| Heartland Women's Healthcare of Advantia Wentzville | PC | 7,900 | 0.17 | % | $ | 140.4 | 0.12 | % | 2,814,421 | St. Louis, MO-IL | 23 | |||||||||||||||
| Baptist Health | PC | 13,500 | 0.30 | % | $ | 387.5 | 0.34 | % | 2,813,140 | San Antonio-New Braunfels, TX | 24 | |||||||||||||||
| San Antonio Head & Neck Surgical Associates | PC | 6,500 | 0.14 | % | $ | 195.5 | 0.17 | % | 2,813,140 | San Antonio-New Braunfels, TX | 24 | |||||||||||||||
| Rehabilitation Institute of South San Antonio | IRF | 38,000 | 0.84 | % | $ | 2,170.6 | 1.89 | % | 2,813,140 | San Antonio-New Braunfels, TX | 24 | |||||||||||||||
| JDH Professional Building | MOB | 12,376 | 0.27 | % | $ | 264.5 | 0.23 | % | 2,813,140 | San Antonio-New Braunfels, TX | 24 | |||||||||||||||
| Community Healthcare Trust | Page | 17 | 1Q 2026 | Supplemental Information | ||||||
| ||
| Property Name | Property Type | Area | % of Square Feet | Annualized Rent ($000's) | % of Annualized Rent | Population | MSA/MISA | Rank | ||||||||||||||||||
| The Heart & Vascular Center | PC | 15,878 | 0.35 | % | $ | 323.4 | 0.28 | % | 2,421,992 | Pittsburgh, PA | 28 | |||||||||||||||
| Butler Medical Center | MOB | 10,116 | 0.22 | % | $ | 172.5 | 0.15 | % | 2,421,992 | Pittsburgh, PA | 28 | |||||||||||||||
| Forefront Dermatology Building | PC | 15,650 | 0.35 | % | $ | 357.9 | 0.31 | % | 2,421,992 | Pittsburgh, PA | 28 | |||||||||||||||
| Greentree Primary Care | MOB | 33,715 | 0.74 | % | $ | 1,052.3 | 0.92 | % | 2,421,992 | Pittsburgh, PA | 28 | |||||||||||||||
| Vascular Access Centers of Southern Nevada | SC | 4,800 | 0.11 | % | $ | 127.5 | 0.11 | % | 2,407,226 | Las Vegas-Henderson-North Las Vegas, NV | 29 | |||||||||||||||
| Assurance Health System - 11690 | BSF | 14,381 | 0.32 | % | $ | 588.7 | 0.51 | % | 2,312,858 | Cincinnati, OH-KY-IN | 30 | |||||||||||||||
| Cavalier Medical & Dialysis Center | MOB | 17,614 | 0.39 | % | $ | 224.9 | 0.20 | % | 2,312,858 | Cincinnati, OH-KY-IN | 30 | |||||||||||||||
| 51 Cavalier Blvd | MOB | 17,935 | 0.40 | % | $ | 226.4 | 0.20 | % | 2,312,858 | Cincinnati, OH-KY-IN | 30 | |||||||||||||||
| Anderson Ferry Plaza | MOB | 43,791 | 0.97 | % | $ | 654.1 | 0.57 | % | 2,312,858 | Cincinnati, OH-KY-IN | 30 | |||||||||||||||
| Liberty Rehabilitation Hospital | IRF | 37,720 | 0.83 | % | $ | 2,518.8 | 2.19 | % | 2,312,858 | Cincinnati, OH-KY-IN | 30 | |||||||||||||||
| Florence Medical Building | MOB | 17,845 | 0.39 | % | $ | 262.2 | 0.23 | % | 2,312,858 | Cincinnati, OH-KY-IN | 30 | |||||||||||||||
| Prairie Star Medical Facility I | MOB | 24,724 | 0.55 | % | $ | 648.1 | 0.56 | % | 2,270,682 | Kansas City, MO-KS | 31 | |||||||||||||||
| Prairie Star Medical Facility II | MOB | 24,840 | 0.55 | % | $ | 291.5 | 0.25 | % | 2,270,682 | Kansas City, MO-KS | 31 | |||||||||||||||
| Ravines Edge | MOB | 16,751 | 0.37 | % | $ | 95.1 | 0.08 | % | 2,242,028 | Columbus, OH | 32 | |||||||||||||||
| Hope Valley Recovery - Circleville | BSF | 7,787 | 0.17 | % | $ | 88.5 | 0.08 | % | 2,242,028 | Columbus, OH | 32 | |||||||||||||||
| Hopebridge - Columbus | BSF | 13,969 | 0.31 | % | $ | 177.4 | 0.15 | % | 2,242,028 | Columbus, OH | 32 | |||||||||||||||
| Sedalia Medical Center | MOB | 19,426 | 0.43 | % | $ | 347.9 | 0.30 | % | 2,242,028 | Columbus, OH | 32 | |||||||||||||||
| Assurance Health, LLC | BSF | 10,200 | 0.22 | % | $ | 395.3 | 0.34 | % | 2,205,695 | Indianapolis-Carmel-Greenwood, IN | 33 | |||||||||||||||
| Assurance Health System - 900 | BSF | 13,722 | 0.30 | % | $ | 538.0 | 0.47 | % | 2,205,695 | Indianapolis-Carmel-Greenwood, IN | 33 | |||||||||||||||
| Kindred Hospital Indianapolis North | LTACH | 37,270 | 0.82 | % | $ | 1,652.4 | 1.44 | % | 2,205,695 | Indianapolis-Carmel-Greenwood, IN | 33 | |||||||||||||||
| Brook Park Medical Building | MOB | 18,444 | 0.41 | % | $ | 39.1 | 0.03 | % | 2,165,775 | Cleveland, OH | 35 | |||||||||||||||
| Smith Road | MOB | 16,802 | 0.37 | % | $ | 334.7 | 0.29 | % | 2,165,775 | Cleveland, OH | 35 | |||||||||||||||
| Assurance - Hudson | BSF | 13,290 | 0.29 | % | $ | 601.7 | 0.52 | % | 2,165,775 | Cleveland, OH | 35 | |||||||||||||||
| Rockside Medical Center | MOB | 55,316 | 1.22 | % | $ | 624.3 | 0.54 | % | 2,165,775 | Cleveland, OH | 35 | |||||||||||||||
| Virginia Orthopaedic & Spine Specialists | PC | 8,445 | 0.19 | % | $ | 159.3 | 0.14 | % | 1,797,213 | Virginia Beach-Chesapeake-Norfolk, VA-NC | 37 | |||||||||||||||
| LTAC Hospital of SE Massachusetts | LTACH | 70,657 | 1.56 | % | $ | 659.4 | 0.57 | % | 1,708,161 | Providence-Warwick, RI-MA | 39 | |||||||||||||||
| Warwick Oncology Center | SC | 10,236 | 0.23 | % | $ | 325.3 | 0.28 | % | 1,708,161 | Providence-Warwick, RI-MA | 39 | |||||||||||||||
| Community Healthcare Trust | Page | 18 | 1Q 2026 | Supplemental Information | ||||||
| ||
| Property Name | Property Type | Area | % of Square Feet | Annualized Rent ($000's) | % of Annualized Rent | Population | MSA/MISA | Rank | ||||||||||||||||||
| South County Hospital | PC | 13,268 | 0.29 | % | $ | 330.4 | 0.29 | % | 1,708,161 | Providence-Warwick, RI-MA | 39 | |||||||||||||||
| Mercy Rehabilitation Hospital | IRF | 39,637 | 0.87 | % | $ | 2,109.9 | 1.83 | % | 1,512,813 | Oklahoma City, OK | 42 | |||||||||||||||
| Memphis Center | MOB | 11,669 | 0.26 | % | $ | 241.7 | 0.21 | % | 1,341,412 | Memphis, TN-MS-AR | 45 | |||||||||||||||
| Sanderling Dialysis Center - 7710 | SC | 10,133 | 0.22 | % | $ | 584.8 | 0.51 | % | 1,341,412 | Memphis, TN-MS-AR | 45 | |||||||||||||||
| Gardendale MOB | MOB | 12,956 | 0.29 | % | $ | 333.0 | 0.29 | % | 1,197,766 | Birmingham, AL | 48 | |||||||||||||||
| Sanford West Behavioral Facility | BSF | 96,886 | 2.14 | % | $ | 1,421.3 | 1.24 | % | 1,183,645 | Grand Rapids-Wyoming-Kentwood, MI | 49 | |||||||||||||||
| Glastonbury | MOB | 48,375 | 1.07 | % | $ | 955.3 | 0.83 | % | 1,171,426 | Hartford-West Hartford-East Hartford, CT | 50 | |||||||||||||||
| Sterling Medical Center | MOB | 28,478 | 0.63 | % | $ | 525.4 | 0.46 | % | 1,155,653 | Buffalo-Cheektowaga, NY | 51 | |||||||||||||||
| Los Alamos Professional Plaza | MOB | 43,395 | 0.96 | % | $ | 427.4 | 0.37 | % | 921,549 | McAllen-Edinburg-Mission, TX | 64 | |||||||||||||||
| UMass Memorial Health Cancer Center | SC | 20,046 | 0.44 | % | $ | 855.3 | 0.74 | % | 888,502 | Worcester, MA | 68 | |||||||||||||||
| Worcester Behavioral | AIB | 81,972 | 1.81 | % | $ | 2,772.2 | 2.41 | % | 888,502 | Worcester, MA | 68 | |||||||||||||||
| El Paso Rehabilitation Hospital | IRF | 38,000 | 0.84 | % | $ | 2,203.1 | 1.92 | % | 881,291 | El Paso, TX | 70 | |||||||||||||||
| Columbia Gastroenterology Surgery Center | PC | 17,016 | 0.38 | % | $ | 349.8 | 0.30 | % | 879,918 | Columbia, SC | 71 | |||||||||||||||
| Genesis Care - Bonita Springs | SC | 4,445 | 0.10 | % | $ | 304.6 | 0.26 | % | 875,607 | Cape Coral-Fort Myers, FL | 72 | |||||||||||||||
| Cape Coral Suite 3 | SC | 12,130 | 0.27 | % | $ | 477.8 | 0.42 | % | 875,607 | Cape Coral-Fort Myers, FL | 72 | |||||||||||||||
| Cape Coral Suite 3A | MOB | 2,023 | 0.04 | % | $ | 41.4 | 0.04 | % | 875,607 | Cape Coral-Fort Myers, FL | 72 | |||||||||||||||
| Cape Coral Suite 5 & 6 | MOB | 6,379 | 0.14 | % | $ | 104.3 | 0.09 | % | 875,607 | Cape Coral-Fort Myers, FL | 72 | |||||||||||||||
| Corporate Office 3660 | MOB | 22,104 | 0.49 | % | $ | 658.3 | 0.57 | % | 875,607 | Cape Coral-Fort Myers, FL | 72 | |||||||||||||||
| Corporate Annex Building | MOB | 16,000 | 0.35 | % | $ | 329.0 | 0.29 | % | 875,607 | Cape Coral-Fort Myers, FL | 72 | |||||||||||||||
| Wildwood Hammock RPET Facility | SC | 10,832 | 0.24 | % | $ | 455.2 | 0.40 | % | 875,607 | Cape Coral-Fort Myers, FL | 72 | |||||||||||||||
| Wildwood Hammock - Diagnostic Imaging | SC | 9,376 | 0.21 | % | $ | 430.4 | 0.37 | % | 875,607 | Cape Coral-Fort Myers, FL | 72 | |||||||||||||||
| Wildwood Hammock - Northland | MOB | 1,201 | 0.03 | % | $ | 14.4 | 0.01 | % | 875,607 | Cape Coral-Fort Myers, FL | 72 | |||||||||||||||
| Eye Health of America 4101 | MOB | 43,322 | 0.96 | % | $ | 1,026.2 | 0.89 | % | 875,607 | Cape Coral-Fort Myers, FL | 72 | |||||||||||||||
| Eye Health of America 2665 | MOB | 3,200 | 0.07 | % | $ | 56.5 | 0.05 | % | 875,607 | Cape Coral-Fort Myers, FL | 72 | |||||||||||||||
| Eye Health of America 1320 | MOB | 6,757 | 0.15 | % | $ | 82.0 | 0.07 | % | 875,607 | Cape Coral-Fort Myers, FL | 72 | |||||||||||||||
| Everest Physical Rehabilitation Hospital | IRF | 37,151 | 0.82 | % | $ | 2,654.5 | 2.31 | % | 874,790 | Lakeland-Winter Haven, FL | 73 | |||||||||||||||
| Community Healthcare Trust | Page | 19 | 1Q 2026 | Supplemental Information | ||||||
| ||
| Property Name | Property Type | Area | % of Square Feet | Annualized Rent ($000's) | % of Annualized Rent | Population | MSA/MISA | Rank | ||||||||||||||||||
| Parkway Professional Plaza | MOB | 41,909 | 0.92 | % | $ | 1,014.4 | 0.88 | % | 874,790 | Lakeland-Winter Haven, FL | 73 | |||||||||||||||
| Davita Turner Road | SC | 18,125 | 0.40 | % | $ | 372.7 | 0.32 | % | 826,554 | Dayton-Kettering-Beavercreek, OH | 76 | |||||||||||||||
| Davita Springboro Pike | SC | 10,510 | 0.23 | % | $ | 192.4 | 0.17 | % | 826,554 | Dayton-Kettering-Beavercreek, OH | 76 | |||||||||||||||
| Davita Business Center Court | SC | 12,988 | 0.29 | % | $ | 242.4 | 0.21 | % | 826,554 | Dayton-Kettering-Beavercreek, OH | 76 | |||||||||||||||
| Mercy One Physicians Clinic | PC | 17,318 | 0.38 | % | $ | 406.2 | 0.35 | % | 758,539 | Des Moines-West Des Moines, IA | 82 | |||||||||||||||
| Daytona Medical Office | MOB | 20,193 | 0.45 | % | $ | 382.3 | 0.33 | % | 746,933 | Deltona-Daytona Beach-Ormond Beach, FL | 83 | |||||||||||||||
| Debary Professional Plaza | MOB | 21,361 | 0.47 | % | $ | 325.4 | 0.28 | % | 746,933 | Deltona-Daytona Beach-Ormond Beach, FL | 83 | |||||||||||||||
| UW Health Clinic- Portage | PC | 14,000 | 0.31 | % | $ | 342.3 | 0.30 | % | 709,685 | Madison, WI | 86 | |||||||||||||||
| Novus Clinic | SCH | 14,315 | 0.32 | % | $ | 309.8 | 0.27 | % | 701,780 | Akron, Oh | 87 | |||||||||||||||
| Aurora Health Center | PC | 15,650 | 0.35 | % | $ | 344.3 | 0.30 | % | 701,780 | Akron, Oh | 87 | |||||||||||||||
| Bassin Center For Plastic Surgery-Melbourne | PC | 5,228 | 0.12 | % | $ | 322.5 | 0.28 | % | 663,982 | Palm Bay-Melbourne-Titusville, FL | 89 | |||||||||||||||
| Cypress Medical Center | MOB | 37,428 | 0.83 | % | $ | 465.7 | 0.40 | % | 663,809 | Wichita, KS | 90 | |||||||||||||||
| Family Medicine East | PC | 16,581 | 0.37 | % | $ | — | — | % | 663,809 | Wichita, KS | 90 | |||||||||||||||
| Wichita Medical Clinic | PC | 18,681 | 0.41 | % | $ | — | — | % | 663,809 | Wichita, KS | 90 | |||||||||||||||
| Mercy Rehabilitation Hospital - Northwest Arkansas | IRF | 38,817 | 0.86 | % | $ | 2,296.1 | 2.00 | % | 622,177 | Fayetteville-Springdale-Rogers, AR | 94 | |||||||||||||||
| Pennsylvania Gastroenterology | PC | 20,400 | 0.45 | % | $ | 605.0 | 0.53 | % | 617,427 | Harrisburg-Carlisle, PA | 95 | |||||||||||||||
| Penn State Health - Camp Hill | SC | 8,400 | 0.19 | % | $ | — | — | % | 617,427 | Harrisburg-Carlisle, PA | 95 | |||||||||||||||
| Penn State Health - Harrisburg | SC | 10,000 | 0.22 | % | $ | 200.9 | 0.17 | % | 617,427 | Harrisburg-Carlisle, PA | 95 | |||||||||||||||
| Perrysburg Medical Arts Building | MOB | 26,585 | 0.59 | % | $ | 507.4 | 0.44 | % | 599,376 | Toledo, OH | 98 | |||||||||||||||
| Sunforest Ct Medical Center | MOB | 23,368 | 0.52 | % | $ | 339.3 | 0.30 | % | 599,376 | Toledo, OH | 98 | |||||||||||||||
| Assurance - Toledo | BSF | 13,290 | 0.29 | % | $ | 565.4 | 0.49 | % | 599,376 | Toledo, OH | 98 | |||||||||||||||
| Granite Circle | MOB | 17,164 | 0.38 | % | $ | 244.2 | 0.21 | % | 599,376 | Toledo, OH | 98 | |||||||||||||||
| Cardiology Associates of Greater Waterbury | PC | 16,793 | 0.37 | % | $ | 348.5 | 0.30 | % | 578,741 | New Haven, CT | 100 | |||||||||||||||
| Riverview Medical Center | MOB | 26,427 | 0.58 | % | $ | 798.4 | 0.69 | % | 574,418 | Scranton--Wilkes-Barre, PA | 103 | |||||||||||||||
| NEI - 200 | MOB | 22,743 | 0.50 | % | $ | 409.4 | 0.36 | % | 574,418 | Scranton--Wilkes-Barre, PA | 103 | |||||||||||||||
| NEI - 204 | MOB | 15,768 | 0.35 | % | $ | 236.4 | 0.21 | % | 574,418 | Scranton--Wilkes-Barre, PA | 103 | |||||||||||||||
| Treasure Coast Medical Pavilion | MOB | 55,844 | 1.23 | % | $ | 927.6 | 0.81 | % | 568,721 | Port St. Lucie, FL | 104 | |||||||||||||||
| Grandview Plaza | MOB | 20,042 | 0.44 | % | $ | 319.8 | 0.28 | % | 563,159 | Lancaster, PA | 105 | |||||||||||||||
| Pinnacle Health | PC | 10,753 | 0.24 | % | $ | 250.0 | 0.22 | % | 563,159 | Lancaster, PA | 105 | |||||||||||||||
| Community Healthcare Trust | Page | 20 | 1Q 2026 | Supplemental Information | ||||||
| ||
| Property Name | Property Type | Area | % of Square Feet | Annualized Rent ($000's) | % of Annualized Rent | Population | MSA/MISA | Rank | ||||||||||||||||||
| Manteca Medical Group Building | MOB | 10,519 | 0.23 | % | $ | 328.9 | 0.29 | % | 557,719 | Modesto, CA | 106 | |||||||||||||||
| Gulf Coast Cancer Centers-Brewton | SC | 3,971 | 0.09 | % | $ | — | — | % | 556,444 | Huntsville, AL | 107 | |||||||||||||||
| Martin Foot & Ankle Clinic | PC | 27,100 | 0.60 | % | $ | 440.4 | 0.38 | % | 473,197 | York-Hanover, PA | 116 | |||||||||||||||
| Lafayette Behavioral | BSF | 31,650 | 0.70 | % | $ | 1,684.9 | 1.47 | % | 423,758 | Lafayette, LA | 132 | |||||||||||||||
| UPMC Specialty Care | MOB | 25,982 | 0.57 | % | $ | 453.4 | 0.39 | % | 423,678 | Youngstown-Warren, OH | 133 | |||||||||||||||
| Biltmore Medical Office | SC | 11,099 | 0.24 | % | $ | 222.4 | 0.19 | % | 422,345 | Asheville, NC | 134 | |||||||||||||||
| Genesis Care - Weaverville | SC | 10,696 | 0.24 | % | $ | 480.0 | 0.42 | % | 422,345 | Asheville, NC | 134 | |||||||||||||||
| Belden Medical Arts Building | MOB | 47,366 | 1.04 | % | $ | 506.7 | 0.44 | % | 400,246 | Canton-Massillon, OH | 140 | |||||||||||||||
| Hills & Dales Professional Center | MOB | 27,920 | 0.62 | % | $ | 351.6 | 0.31 | % | 400,246 | Canton-Massillon, OH | 140 | |||||||||||||||
| Prattville Town Center Medical Office Bldg | MOB | 13,319 | 0.29 | % | $ | 275.5 | 0.24 | % | 388,747 | Montgomery, AL | 145 | |||||||||||||||
| Bluewater Orthopedics Center | MOB | 10,255 | 0.23 | % | $ | 223.8 | 0.19 | % | 315,098 | Crestview-Fort Walton Beach-Destin, FL | 168 | |||||||||||||||
| Wellmont Bristol Urgent Care | SC | 4,548 | 0.10 | % | $ | 78.5 | 0.07 | % | 314,834 | Kingsport-Bristol, TN-VA | 169 | |||||||||||||||
| Steeles Road Medical Building | PC | 10,804 | 0.24 | % | $ | 164.8 | 0.14 | % | 314,834 | Kingsport-Bristol, TN-VA | 169 | |||||||||||||||
| Londonderry Centre | MOB | 21,203 | 0.47 | % | $ | 382.5 | 0.33 | % | 308,807 | Waco, TX | 171 | |||||||||||||||
| Westlake Medical Office | MOB | 14,100 | 0.31 | % | $ | 243.1 | 0.21 | % | 308,807 | Waco, TX | 171 | |||||||||||||||
| Longview Rehabilitation Hospital | IRF | 38,817 | 0.86 | % | $ | 2,349.2 | 2.04 | % | 297,315 | Longview, TX | 173 | |||||||||||||||
| Gulf Coast Cancer Centers-Foley | SC | 6,146 | 0.14 | % | $ | 178.2 | 0.16 | % | 267,761 | Daphne-Fairhope-Foley, AL | 189 | |||||||||||||||
| Gulf Shores Building | SC | 6,398 | 0.14 | % | $ | 51.3 | 0.04 | % | 267,761 | Daphne-Fairhope-Foley, AL | 189 | |||||||||||||||
| Monroe Surgical Hospital | SCH | 58,121 | 1.28 | % | $ | 2,535.5 | 2.21 | % | 222,390 | Monroe, LA | 217 | |||||||||||||||
| Ft. Valley Dialysis Center | SC | 4,920 | 0.11 | % | $ | 87.0 | 0.08 | % | 208,091 | Warner Robins, GA | 228 | |||||||||||||||
| Meridian Behavioral Health Systems | AIB | 132,430 | 2.92 | % | $ | 3,263.5 | 2.84 | % | 200,170 | Charleston, WV | 233 | |||||||||||||||
| Tuscola Professional Building | MOB | 25,500 | 0.56 | % | $ | 622.4 | 0.54 | % | 187,688 | Saginaw, MI | 241 | |||||||||||||||
| Kedplasma | SC | 12,870 | 0.28 | % | $ | 272.1 | 0.24 | % | 186,177 | Burlington, NC | 243 | |||||||||||||||
| Redding Oncology Center | SC | 12,206 | 0.27 | % | $ | 585.9 | 0.51 | % | 181,648 | Redding, CA | 249 | |||||||||||||||
| Decatur Morgan Hospital Medical Office Building | MOB | 35,933 | 0.79 | % | $ | 582.4 | 0.51 | % | 160,326 | Decatur, AL | 272 | |||||||||||||||
| Bourbonnais Medical Center | MOB | 54,894 | 1.21 | % | $ | 617.1 | 0.54 | % | 105,525 | Kankakee, IL | 351 | |||||||||||||||
| Community Healthcare Trust | Page | 21 | 1Q 2026 | Supplemental Information | ||||||
| ||
| Property Name | Property Type | Area | % of Square Feet | Annualized Rent ($000's) | % of Annualized Rent | Population | MSA/MISA | Rank | ||||||||||||||||||
| Parkside Family & Davita Clinics | MOB | 15,637 | 0.34 | % | $ | 222.2 | 0.19 | % | 99,864 | Victoria, TX | 363 | |||||||||||||||
| Cub Lake Square | MOB | 48,756 | 1.07 | % | $ | 1,043.8 | 0.91 | % | 109,946 | Show Low, AZ | n/a | |||||||||||||||
| Emory Healthcare - 303 | MOB | 61,301 | 1.35 | % | $ | 952.6 | 0.83 | % | 107,097 | LaGrange, GA-AL | n/a | |||||||||||||||
| Emory Southern Orthopedics - 1805 | MOB | 31,473 | 0.69 | % | $ | 733.5 | 0.64 | % | 107,097 | LaGrange, GA-AL | n/a | |||||||||||||||
| Emory Southern Orthopedics - 1801 | MOB | 2,972 | 0.07 | % | $ | 62.7 | 0.05 | % | 107,097 | LaGrange, GA-AL | n/a | |||||||||||||||
| Emory Healthcare - 1610 | MOB | 5,600 | 0.12 | % | $ | 87.0 | 0.08 | % | 107,097 | LaGrange, GA-AL | n/a | |||||||||||||||
| Nesbitt Place | MOB | 56,003 | 1.23 | % | $ | 1,074.8 | 0.93 | % | 83,911 | Lawrence County, PA | n/a | |||||||||||||||
| Davita Etowah Dialysis Center | SC | 4,720 | 0.10 | % | $ | 71.6 | 0.06 | % | 71,590 | Athens, TN | n/a | |||||||||||||||
| Marion Medical Plaza | MOB | 27,246 | 0.60 | % | $ | 390.3 | 0.34 | % | 65,115 | Marion, OH | n/a | |||||||||||||||
| Pahrump Medical Plaza | MOB | 12,545 | 0.28 | % | $ | 479.5 | 0.42 | % | 57,336 | Pahrump, NV | n/a | |||||||||||||||
| Corsicana Medical Plaza | MOB | 17,746 | 0.39 | % | $ | 373.2 | 0.32 | % | 57,181 | Corsicana, TX | n/a | |||||||||||||||
| Arkansas Valley Surgery Center | MOB | 10,717 | 0.24 | % | $ | 235.3 | 0.20 | % | 50,039 | Cañon City, CO | n/a | |||||||||||||||
| Baylor Scott & White Clinic | PC | 37,354 | 0.82 | % | $ | 505.8 | 0.44 | % | 38,288 | Brenham, TX | n/a | |||||||||||||||
| Fremont Medical Office Building & Surgery Ctr | MOB | 13,050 | 0.29 | % | $ | 345.8 | 0.30 | % | 38,057 | Fremont, NE | n/a | |||||||||||||||
| Eyecare Partners - 408 | PC | 8,421 | 0.19 | % | $ | 134.3 | 0.12 | % | 36,382 | Centralia, IL | n/a | |||||||||||||||
| Ottumwa Medical Clinic - 1005 | MOB | 68,895 | 1.52 | % | $ | 747.2 | 0.65 | % | 35,210 | Ottumwa, IA | n/a | |||||||||||||||
| Ottumwa Medical Clinic - 1007 | MOB | 6,850 | 0.15 | % | $ | 96.2 | 0.08 | % | 35,210 | Ottumwa, IA | n/a | |||||||||||||||
| Fresenius Gallipolis Dialysis Center | SC | 15,110 | 0.33 | % | $ | 160.2 | 0.14 | % | 29,072 | Gallipolis, OH | n/a | |||||||||||||||
| Princeton Cancer Center | SC | 7,236 | 0.16 | % | $ | 204.4 | 0.18 | % | County: 57,454 | Rural - No CBSA | n/a | |||||||||||||||
| Sanderling Dialysis Center - 102 | SC | 5,217 | 0.12 | % | $ | 295.6 | 0.26 | % | County: 57,454 | Rural - No CBSA | n/a | |||||||||||||||
| Andalusia Medical Plaza | SC | 10,373 | 0.23 | % | $ | 297.7 | 0.26 | % | County: 37,750 | Rural - No CBSA | n/a | |||||||||||||||
| Sanderling Dialysis Center - 780 | SC | 4,186 | 0.09 | % | $ | 320.4 | 0.28 | % | County: 37,750 | Rural - No CBSA | n/a | |||||||||||||||
| North Mississippi Health Services - 1107 | MOB | 17,629 | 0.39 | % | $ | 99.8 | 0.09 | % | County: 33,928 | Rural - No CBSA | n/a | |||||||||||||||
| North Mississippi Health Services - 1111 | MOB | 27,743 | 0.61 | % | $ | 157.1 | 0.14 | % | County: 33,928 | Rural - No CBSA | n/a | |||||||||||||||
| North Mississippi Health Services - 1127 | MOB | 18,074 | 0.40 | % | $ | 102.3 | 0.09 | % | County: 33,928 | Rural - No CBSA | n/a | |||||||||||||||
| North Mississippi Health Services - 404 | MOB | 9,890 | 0.22 | % | $ | 56.0 | 0.05 | % | County: 33,928 | Rural - No CBSA | n/a | |||||||||||||||
| Community Healthcare Trust | Page | 22 | 1Q 2026 | Supplemental Information | ||||||
| ||
| Property Name | Property Type | Area | % of Square Feet | Annualized Rent ($000's) | % of Annualized Rent | Population | MSA/MISA | Rank | ||||||||||||||||||
| North Mississippi Health Services - 305 | MOB | 3,378 | 0.07 | % | $ | 19.1 | 0.02 | % | County: 33,928 | Rural - No CBSA | n/a | |||||||||||||||
| Sanderling Dialysis Center - 2102 | SC | 11,300 | 0.25 | % | $ | 450.1 | 0.39 | % | County: 33,928 | Rural - No CBSA | n/a | |||||||||||||||
| Batesville Regional Medical Center | MOB | 9,263 | 0.20 | % | $ | 52.5 | 0.05 | % | County: 32,965 | Rural - No CBSA | n/a | |||||||||||||||
| Tri Lakes Behavioral | BSF | 58,400 | 1.29 | % | $ | — | — | % | County: 32,965 | Rural - No CBSA | n/a | |||||||||||||||
| Dahlonega Medical Mall | MOB | 22,805 | 0.50 | % | $ | 399.3 | 0.35 | % | County: 33,362 | Rural - No CBSA | n/a | |||||||||||||||
| Russellville Medical Plaza | MOB | 29,129 | 0.64 | % | $ | 173.1 | 0.15 | % | County: 31,870 | Rural - No CBSA | n/a | |||||||||||||||
| Norton Medical Plaza | MOB | 32,757 | 0.72 | % | $ | 276.5 | 0.24 | % | County: 25,635 | Rural - No CBSA | n/a | |||||||||||||||
| Wellmont Lebanon Urgent Care | SC | 8,369 | 0.18 | % | $ | 108.8 | 0.09 | % | County: 22,951 | Rural - No CBSA | n/a | |||||||||||||||
| Lexington Carilion Clinic | PC | 15,820 | 0.35 | % | $ | 392.0 | 0.34 | % | County: 22,573 | Rural - No CBSA | n/a | |||||||||||||||
| Norton Medical Clinic | SC | 4,843 | 0.11 | % | $ | 60.3 | 0.05 | % | County: 13,464 | Rural - No CBSA | n/a | |||||||||||||||
| Community Healthcare Trust | Page | 23 | 1Q 2026 | Supplemental Information | ||||||
| ||
| Community Healthcare Trust | Page | 24 | 1Q 2026 | Supplemental Information | ||||||
| ||
| Community Healthcare Trust | Page | 25 | 1Q 2026 | Supplemental Information | ||||||
| ||
| Community Healthcare Trust | Page | 26 | 1Q 2026 | Supplemental Information | ||||||
| ||
| Community Healthcare Trust | Page | 27 | 1Q 2026 | Supplemental Information | ||||||