Exhibit 99.1

Investor Presentation First Quarter 2026 Highlights Stock Symbol: FRAF (Nasdaq) Franklin Financial Services Corporation F&M TRUST
Certain statements appearing herein which are not historical in nature are forward-looking statements within the meaning of the Private Securities Litigation Reform Act of 1995. Such forward-looking statements refer to a future period or periods, reflecting management’s current views as to likely future developments, and use words “may,” “will,” “expect,” “believe,” “estimate,” “anticipate,” or similar terms. Because forward-looking statements involve certain risks, uncertainties and other factors over which Franklin Financial Services Corporation has no direct control, actual results could differ materially from those contemplated in such statements. These factors include (but are not limited to) the following: general economic conditions, changes in interest rates, changes in the Corporation’s cost of funds, changes in government monetary policy, changes in government regulation and taxation of financial institutions, changes in the rate of inflation, changes in technology, the intensification of competition within the Corporation’s market area, and other similar factors. We caution readers not to place undue reliance on these forward-looking statements. They only reflect management’s analysis as of this date. The Corporation does not revise or update these forward-looking statements to reflect events or changed circumstances. Please carefully review the risk factors described in other documents the Corporation files from time to time with the SEC, including the Annual Reports on Form 10-K, Quarterly Reports on Form 10-Q, and any Current Reports on Form 8-K. GAAP versus non-GAAP Presentations – The Corporation supplements its traditional GAAP measurements with certain non-GAAP measurements to evaluate its performance and to eliminate the effect of intangible assets. By eliminating intangible assets, the Corporation believes it presents a measurement that is comparable to companies that have no intangible assets or to companies that have eliminated intangible assets in similar calculations. However, not all companies may use the same calculation method for each measurement. The Efficiency Ratio measures the cost to generate one dollar of revenue. The non-GAAP measurements are not intended to be used as a substitute for the related GAAP measurements and should not be read in isolation or relied upon as a substitute for GAAP measures. The following table shows the calculation of the non-GAAP measurements. Forward Looking Statements Franklin Financial Services Corporation F&M TRUST 2
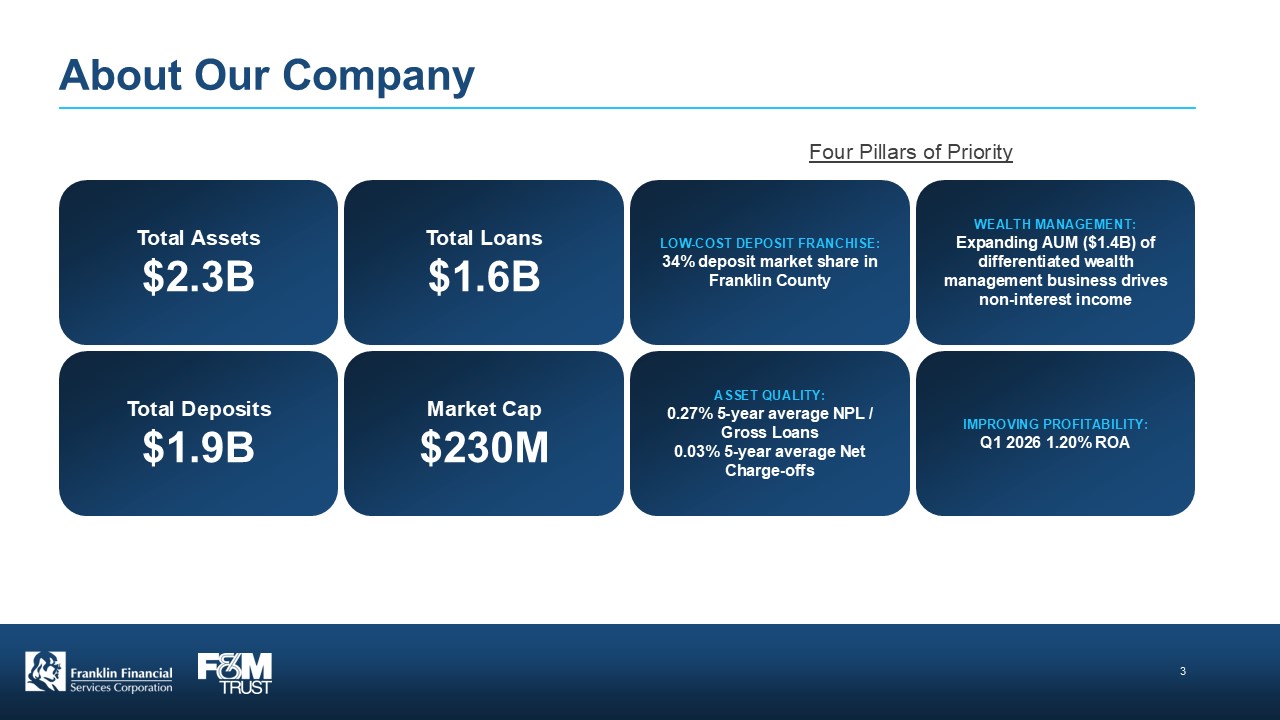
About Our Company Four Pillars of Priority Total Assets $2.3B Total Loans $1.6B LOW-COST DEPOSITS FRANCHISE: 34% deposit market share in Franklin County WEALTH AMANGEMENT: Expanding AUM ($1.4B) of differentiated wealth management business drives non-interest income Total Deposits $1.9B Market Cap $230M ASSET QUALITY: 0.27% 5-year average NPL/Gross Loans 0.03% 5-year average Net Charge-offs IMPROVING PROFITABILITY: Q1 2026 1.20% ROA Franklin Financial Services Corporation F&M TRUST 3
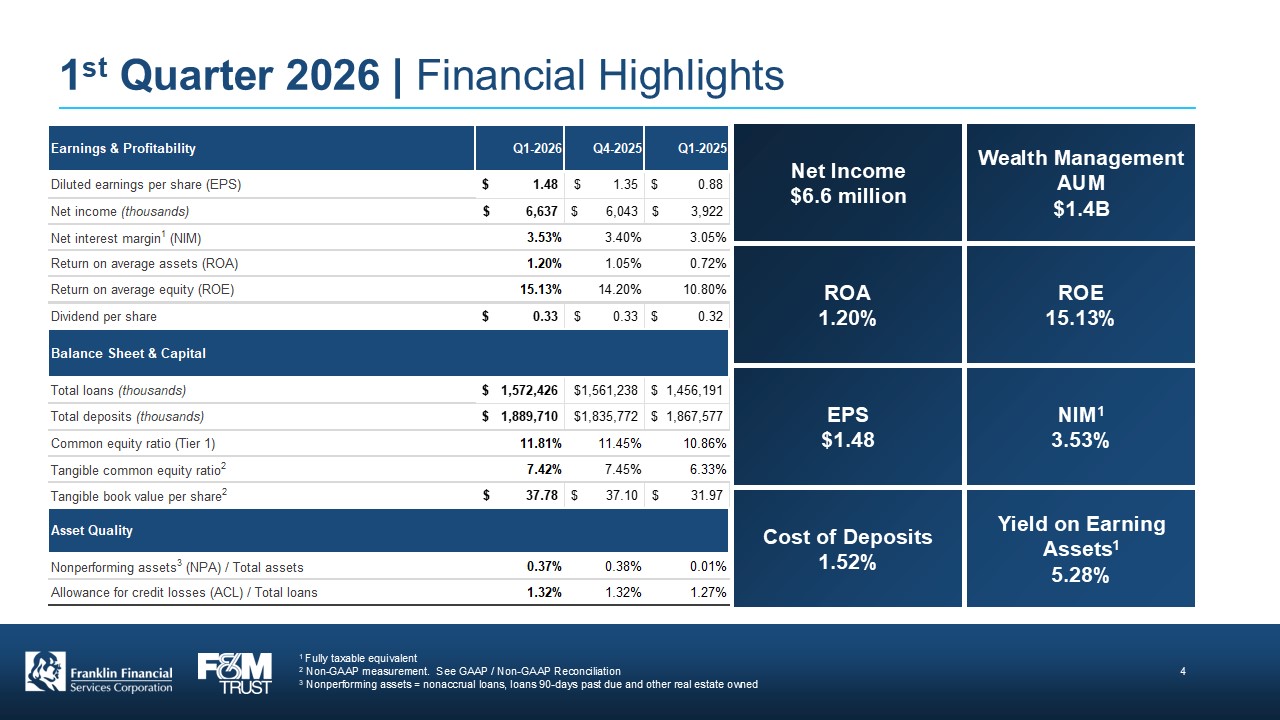
1st Quarter 2026 | Financial Highlights Earnings & Profitability Q1-2026 Q4-2025 Q1-2025 Diluted earnings per share (EPS) $ 1.48 $ 1.35 $ 0.88 Net income (thousands) $ 6,637 $ 6,043 $ 3,922 Net interest margin1 (NIM) 3.53% 3.40% 3.05% Return on average assets (ROA) 1.20% 1.05% 0.72% Return on average equity (ROE) 15.13% 14.20% 10.80% Dividend per share $ 0.33 $ 0.33 $ 0.32 Balance Sheet & Capital Total loans (thousands) $ 1,572,426 $1,561,238 $ 1,456,191 Total deposits (thousands) $ 1,889,710 $1,835,772 $ 1,867,577 Common equity ratio (Tier 1) 11.81% 11.45% 10.86% Tangible common equity ratio2 7.42% 7.45% 6.33% Tangible book value per share2 $ 37.78 $ 37.10 $ 31.97 Asset Quality Nonperforming assets3 (NPA) / Total assets 0.37% 0.38% 0.01% Allowance for credit losses (ACL) / Total loans 1.32% 1.32% 1.27% Net Income $6.6 million Wealth Management AUM $1.4B ROA 1.20% ROE 15.13% EPS $1.48 NIM1 3.53% Cost of Deposits 1.52% Yield on Earning Assets1 5.28% 1 Fully taxable equivalent 2 Non-GAAP measurement. See GAAP / Non-GAAP Reconciliation 3 Nonperforming assets = nonaccrual loans, loans 90-days past due and other real estate owned 4 Franklin Financial Services Corporation F&M TRUST
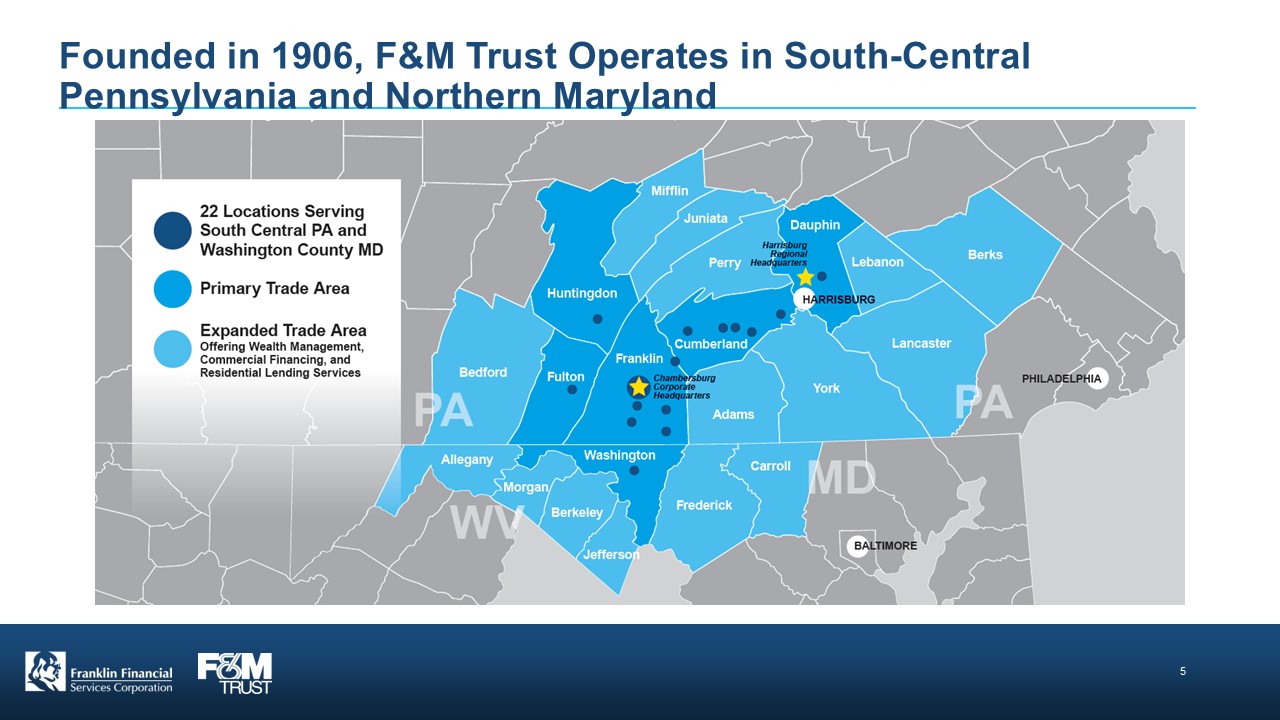
Founded in 1906, F&M Trust Operates in South-Central Pennsylvania and Northern Maryland 22 Locations Serving South Central PA and Washington County MD Primary Trade Area Expanded Trade Area Offering Wealth Management, Commercial Financing, and Residential Lending Services 5 Franklin Financial Services Corporation F&M TRUST
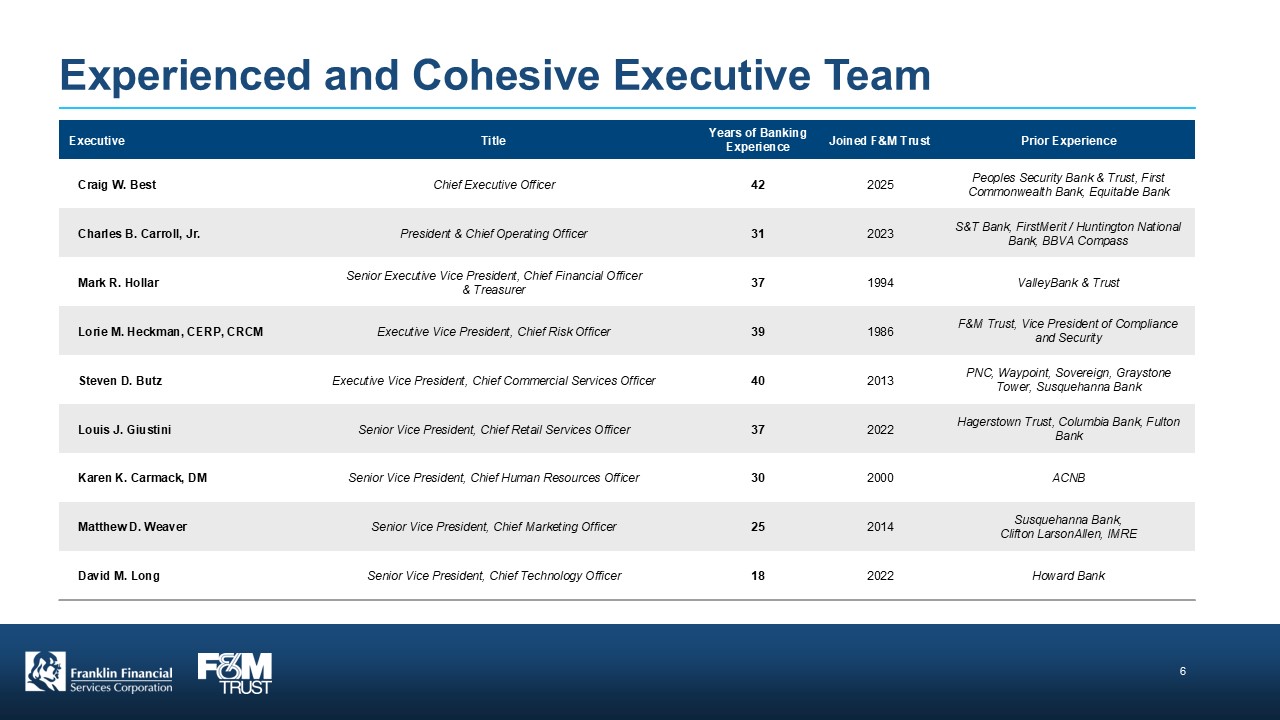
Experienced and Cohesive Executive Team Executive Title Years of Banking Experience Joined F&M Trust Prior Experience Craig W. Best Chief Executive Officer 42 2025 Peoples Security Bank & Trust, First Commonwealth Bank, Equitable Bank Charles B. Carroll, Jr. President & Chief Operating Officer 31 2023 S&T Bank, FirstMerit / Huntington National Bank, BBVA Compass Mark R. Hollar Senior Executive Vice President, Chief Financial Officer & Treasurer 37 1994 ValleyBank & Trust Lorie M. Heckman, CERP, CRCM Executive Vice President, Chief Risk Officer 39 1986 F&M Trust, Vice President of Compliance and Security Steven D. Butz Executive Vice President, Chief Commercial Services Officer 40 2013 PNC, Waypoint, Sovereign, Graystone Tower, Susquehanna Bank Louis J. Giustini Senior Vice President, Chief Retail Services Officer 37 2022 Hagerstown Trust, Columbia Bank, Fulton Bank Karen K. Carmack, DM Senior Vice President, Chief Human Resources Officer 30 2000 ACNB Matthew D. Weaver Senior Vice President, Chief Marketing Officer 25 2014 Susquehanna Bank, Clifton LarsonAllen, IMRE David M. Long Senior Vice President, Chief Technology Officer 18 2022 Howard Bank 6 Franklin Financial Services Corporation F&M TRUST
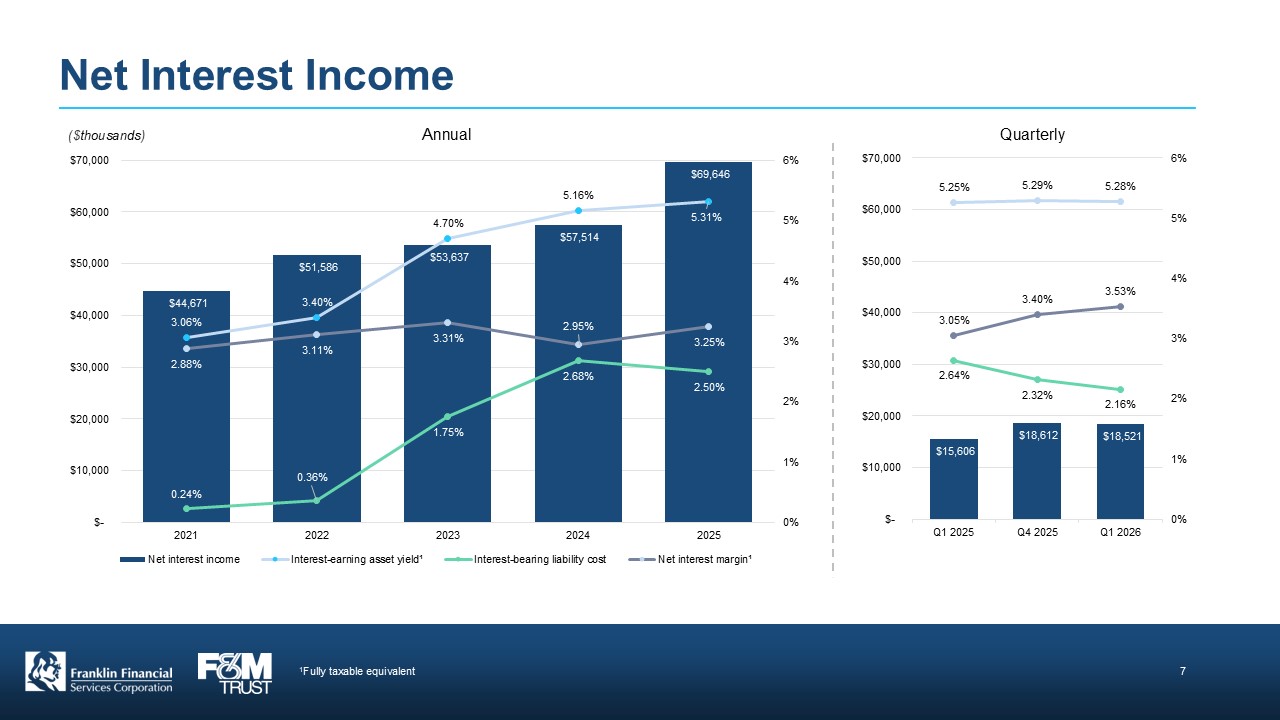
Net Interest Income ($thousands) Annual $44,671 $51,588 $53,637 $57,514 $69,648 3.08% 3.40% 4.70% 5.16% 5.31% 2.88% 3.11% 3.31% 2.95% 3.25% 0.24% 0.36% 1.75% 2.68% 2.50% 2021 2022 2023 2024 2025 Net interest income Interest-earning asset yield Interest-bearing liability cost Net interst margin Quarterly 5.25% 5.29% 5.28% 3.05% 3.40% 3.53% 2.64% 2.32% 2.16% $15,606 $18,612 $18,521 Q1 2025 Q4 2025 Q1 2026 1Fully taxable equivalent 7 Franklin Financial Services Corporation F&M TRUST
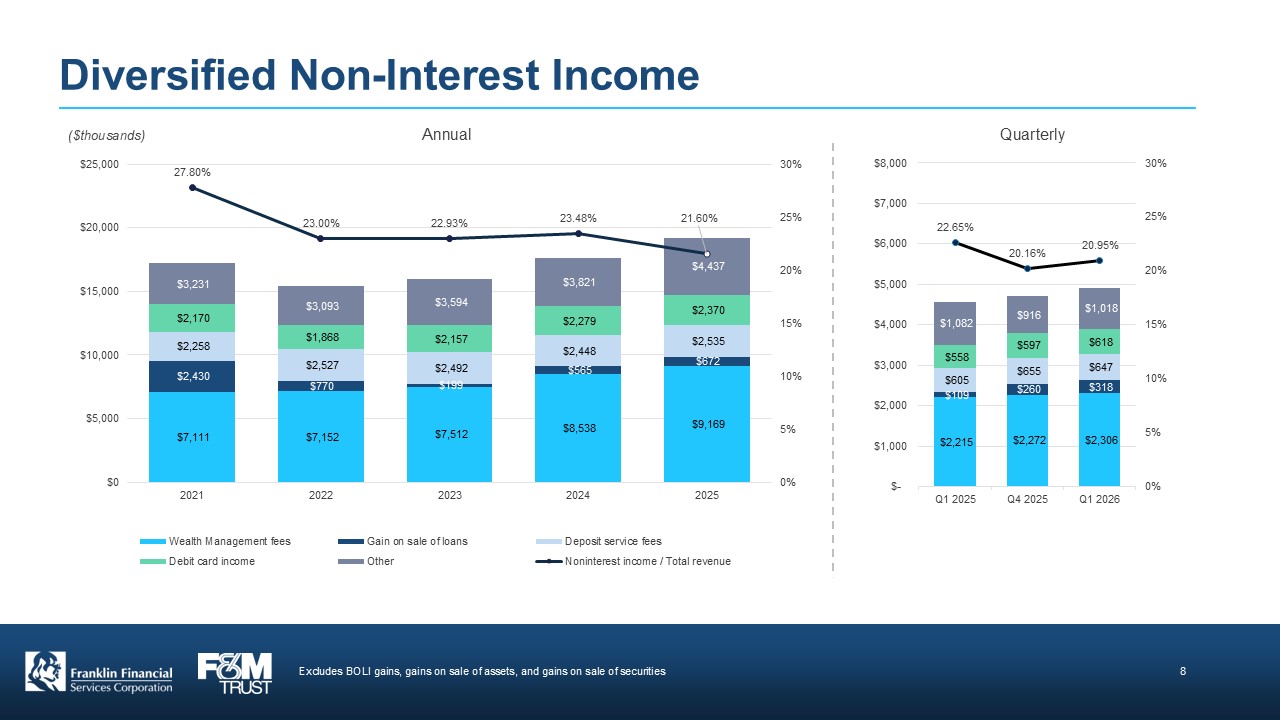
Diversified Non-Interest Income ($thousands) Annual 27.80% 23.00% 22.93% 23.48% 21.60% $3,231 $3,093 $3,594 $3,821 $4,437 $2,170 $1,888 $2,157 $2,279 $2,370 $2,258 $2,527 $2,492 $2,448 $2,535 $2,430 $770 $199 $565 $672 $7,111 $7,152 $7,512 $8,538 $9,169 2021 2022 2023 2024 2025 Quarterly 22.65% 20.16% 20.95% $1,082 $916 $1,018 $558 $597 $618 $605 $655 $647 $109 $260 $318 $2,215 $2,272 $2,308 Q1 2025 Q4 2025 Q1 2026 Excludes BOLI gains, gains on sale of assets, and gains on sale of securities Franklin Financial Services Corporation F&M TRUST 8
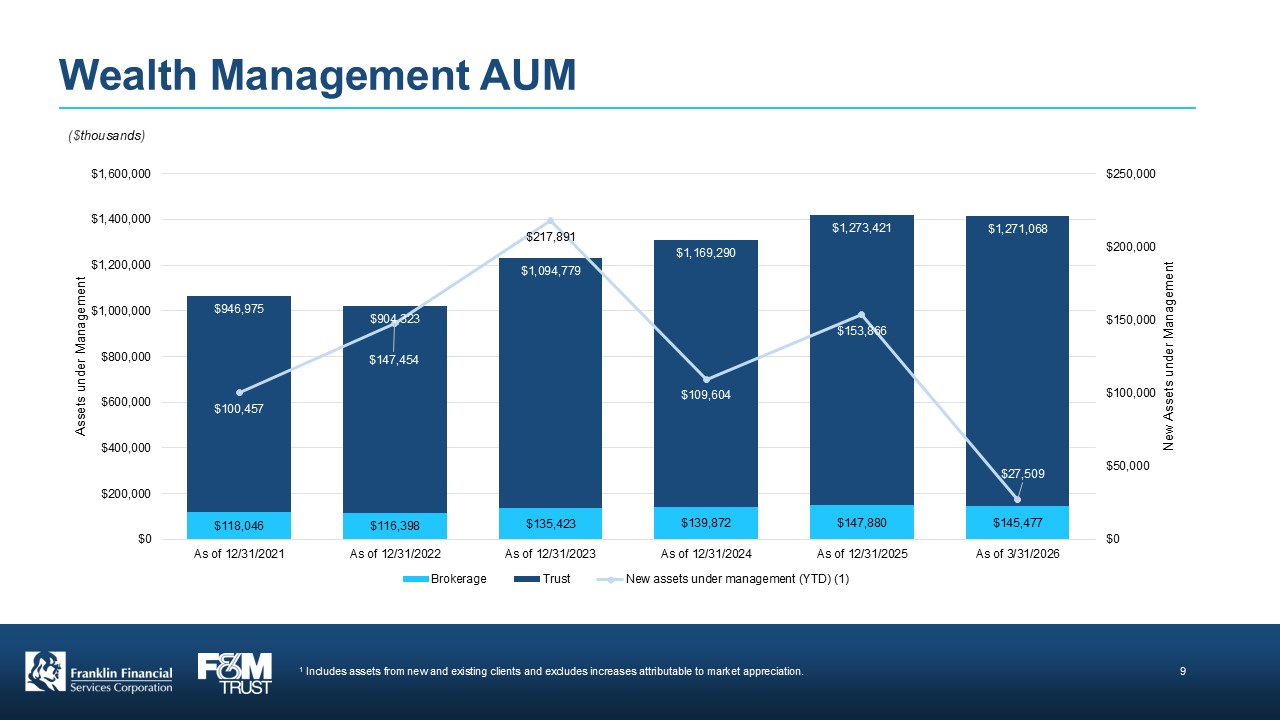
Wealth Management AUM ($thousands) $946,975 $904,523 $1,094,779 $169,290 $1,273,421 $1,271,068 $100,457 $147,454 $217,891 $109,604 $153,886 $27,509 $118,046 $116,398 $135,423 $139,872 $147,880 $145,477 As of 12/31/2021 As of 12/31/2022 As of 12/31/2023 As of 12/31/2024 As of 12/31/2025 As of 3/31/2026 Brokerage Trust New assets under management (YTD) 1 Includes assets from new and existing clients and excludes increases attributable to market appreciation. Franklin Financial Services Corporation F&M TRUST 9
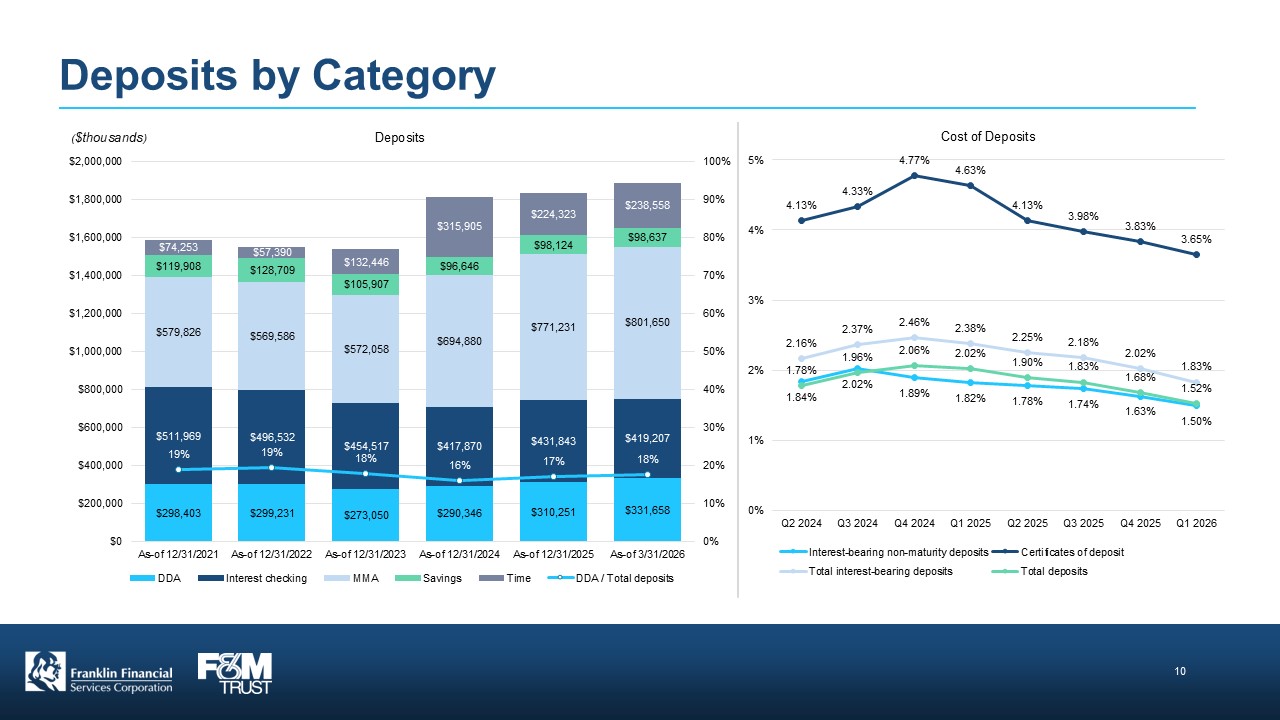
Deposits by Category Deposits $74,253 $57,390 $132,446 $315,905 $224,323 $238,558 $119,908 $128,709 $105,907 $96,646 $98,124 $98,637 $579,826 $569,586 $572,058 $694,880 $771,231 $801,650 $511,969 $496,532 $454,517 $417,870 $431,843 $419,207 19% 19% 18% 16% 17% 18% $298,403 $299,231 $273,050 $290,346 $310,251 $331,658 As of 12/31/2021 As of 12/31/2022 As of 12/31/2023 As of 12/31/2024 As of 12/31/2025 As of 3/31/2026 DDA Interest checking MMA Savings Time DDA/Total deposits Cost of Deposits 4.13% 4.33% 4.77% 4.63% 4.13% 3.98% 3.83% 3.65% 2.16% 2.37% 2.46% 2.38% 2.25% 2.18% 2.02% 18.30% 1.78% 1.96% 2.06% 2.02% 1.90% 1.83% 1.68% 1.52% 1.84% 2.02% 1.89% 1.82% 1.78% 1.74% 1.63% 1.50% Q2 2024 Q3 2024 Q4 2024 Q1 2025 Q2 2025 Q3 2025 Q4 2025 Q1 2026 Interest-bearing non-maturity deposits Certificates of deposit Total interest-bearing deposits Total Deposits Franklin Financial Services Corporation F&M TRUST 10
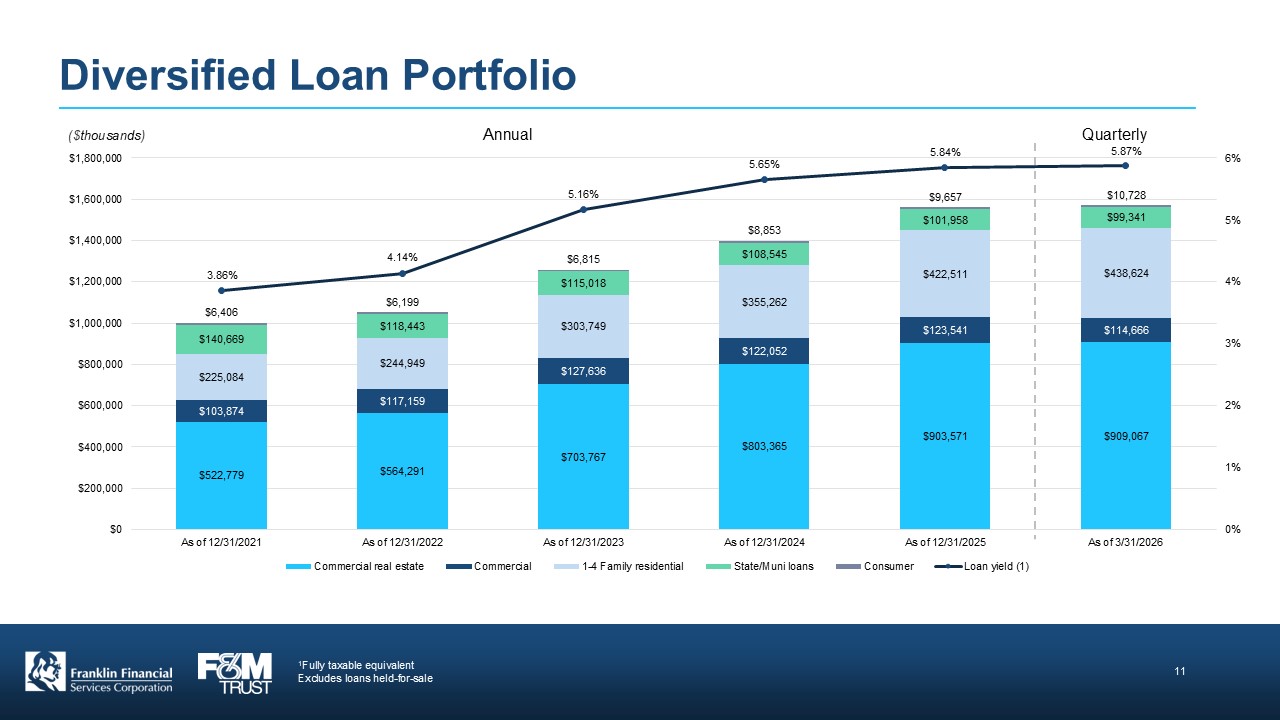
Diversified Loan Portfolio Annual Quarterly ($thousands) 3.86% 4.14% 5.16% 5.65% 5.84% 5.87% $6,406 $6,199 $6,815 $8,853 $9,657 $10,728 $140,669 $118,443 $115,018 $108,545 $101,958 $99,341 $225,084 $244,949 $303,749 $355,262 $422,511 $438,624 $103,874 $117,159 $127,638 $122,052 $123,541 $114,666 $522,779 $564,291 $703,767 $803,365 $903,571 $909,067 As of 12/31/2021 As of 12/31/2022 As of 12/31/2023 As of 12/31/2024 As of 12/31/2025 As of 3/31/2026 Commercial real estate Commercial 1-4 Family residential State/Mun I loans Consumer Loan yield 1Fully taxable equivalent Excludes loans held-for-sale Franklin Financial Services Corporation F&M TRUST 11
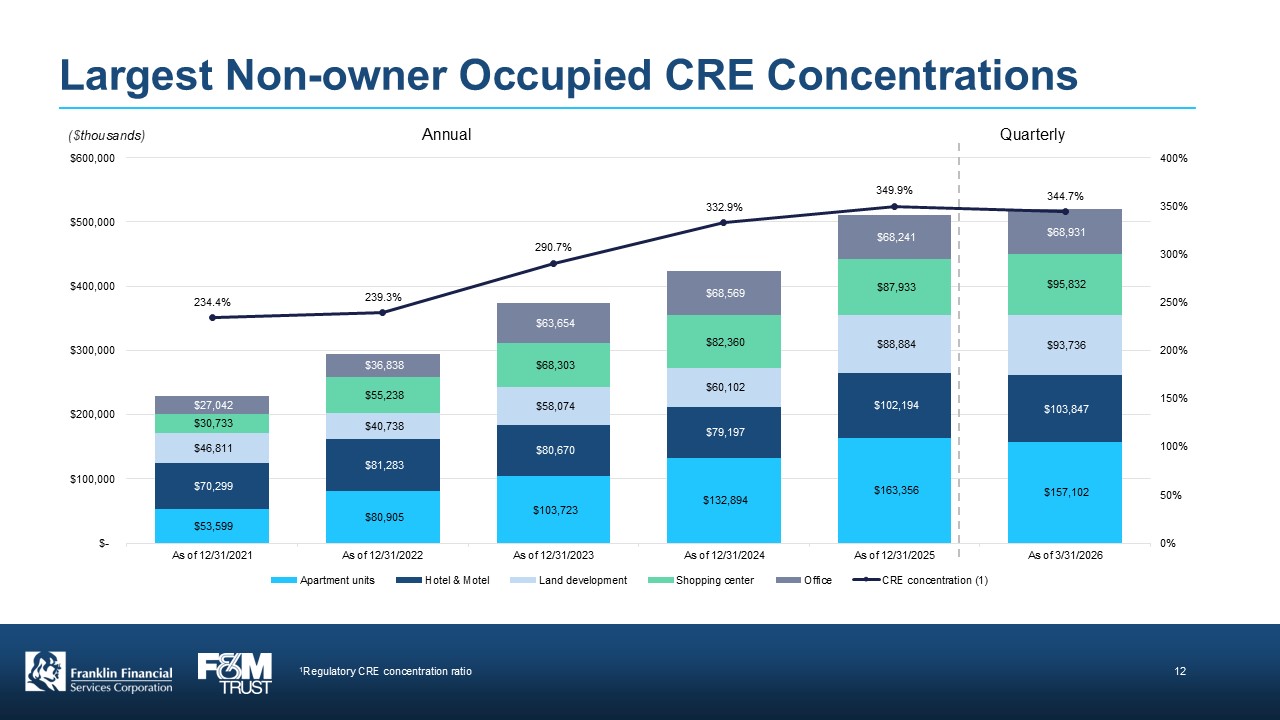
Largest Non-owner Occupied CRE Concentrations ($thousands) Annual Quarterly 234.4% 239.3% 290.7% 332.9% 349.9% 344.7% $27,042 $36,838 $63,654 $68,569 $68,241 $68,931 $30,733 $55,238 $68,303 $82,360 $87,933 $95,832 $46,811 $40,738 $58,074 $60,102 $88,884 $93,736 $70,299 $81,283 $80,670 $79,197 $102,194 $103,847 $53,599 $80,905 $103,723 $132,894 $163,356 $157,102 As of 12/31/2021 As of 12/31/2022 As of 12/31/2023 As of 12/31/2024 As of 12/31/2025 As of 3/31/2026 1Regulatory CRE concentration ratio Franklin Financial Services Corporation F&M TRUST 12
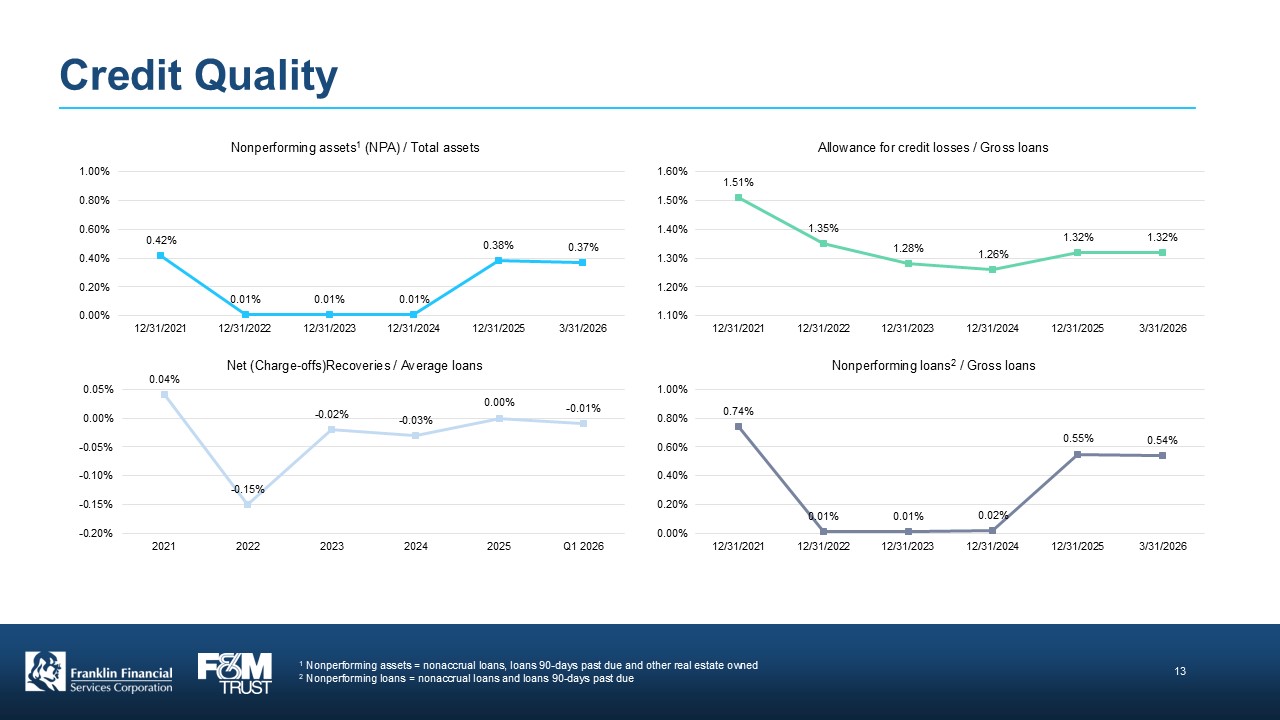
Credit Quality Nonperforming assets1 (NPA) / Total assets 0.42% 0.01% 0.01% 0.01% 0.38% 0.37% 12/31/2021 12/31/2022 12/31/2023 12/31/2024 12/31/2025 3/31/2026 Allowance for credit losses / Gross loans 1.51% 1.35% 1.28% 1.26% 1.32% 1.32% 12/31/2021 12/31/2022 12/31/2023 12/31/2024 12/31/2025 3/31/2026 Net (Charge-offs)Recoveries / Average loans 0.04% -0.15% -0.02% -0.03% 0.00% -0.01% 12/31/2021 12/31/2022 12/31/2023 12/31/2024 12/31/2025 3/31/2026 Nonperforming loans2 / Gross loans 0.74% 0.01% 0.01% 0.02% 0.55% 0.54% 12/31/2021 12/31/2022 12/31/2023 12/31/2024 12/31/2025 3/31/2026 1 Nonperforming assets = nonaccrual loans, loans 90-days past due and other real estate owned 2 Nonperforming loans = nonaccrual loans and loans 90-days past due Franklin Financial Services Corporation F&M TRUST 13
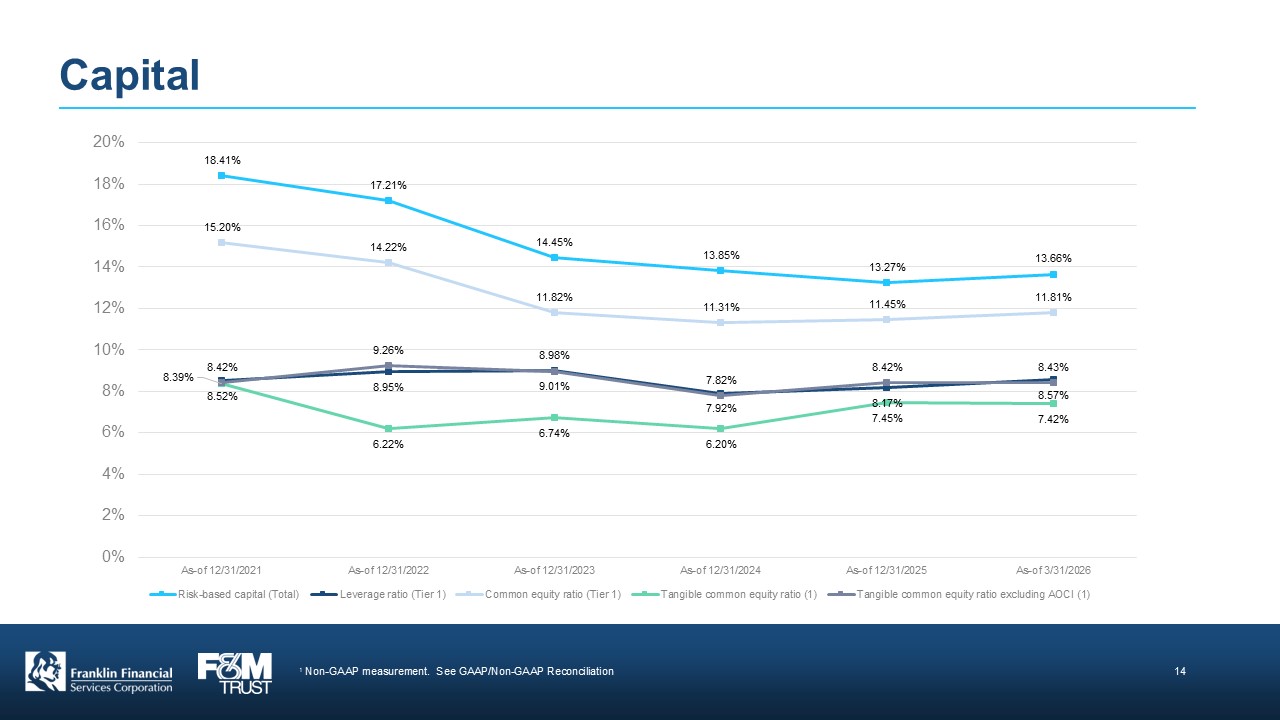
Capital 18.41% 17.21% 14.45% 13.85% 13.27% 13.66% 15.20% 14.22% 11.82% 11.31% 11.45% 11.81% 8.42% 9.26% 8.98% 7.82% 8.42% 8.43% 8.39% 8.95% 9.01% 7.92% 8.17% 8.57% 8.52% 6.22% 6.74% 6.20% 7.45% 7.42% As of 12/31/2021 As of 12/31/2022 As of 12/31/2023 As of 12/31/2024 As of 12/31/2025 As of 3/31/2026 Risk-based capital (Total) Leverage ratio (Tier 1) Common equity ratio (Tier 1) Tangible common equity ratio (1) Tangible common equity ratio excluding AOCI(1) 1 Non-GAAP measurement. See GAAP/Non-GAAP Reconciliation Franklin Financial Services Corporation F&M TRUST 14

Stock Symbol: FRAF (Nasdaq) www.franklinfin.com www.fmtrust.bank Investor Relations Officer Amanda Ducey 717-261-3553 amanda.ducey@f-mtrust.com Franklin Financial Services Corporation F&M TRUST

Appendix Franklin Financial Services Corporation F&M TRUST
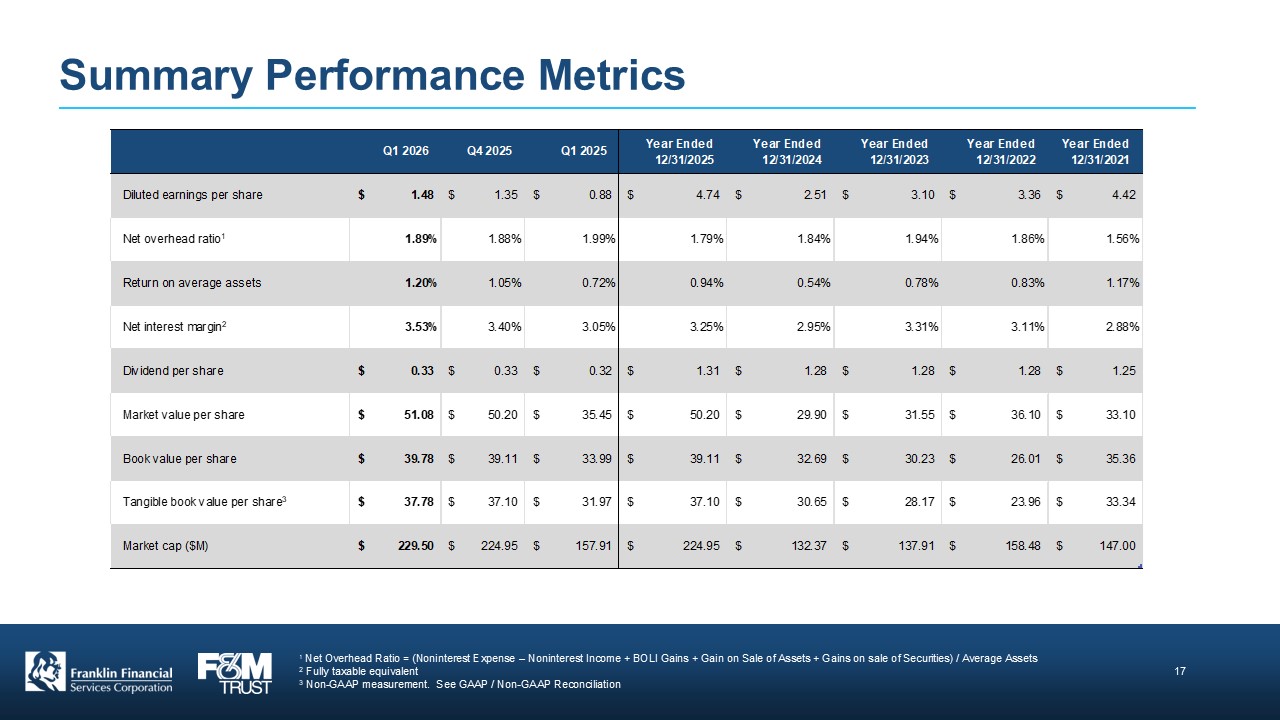
Summary Performance Metrics Q1 2026 Q4 2025 Q1 2025 Year Ended 12/31/2025 Year Ended 12/31/2024 Year Ended 12/31/2023 Year Ended 12/31/2022 Year Ended 12/31/2021 Diluted earnings per share $ 1.48 $ 1.35 $ 0.88 $ 4.74 $ 2.51 $ 3.10 $ 3.36 $ 4.42 Net overhead ratio1 1.89% 1.88% 1.99% 1.79% 1.84% 1.94% 1.86% 1.56% Return on average assets 1.20% 1.05% 0.72% 0.94% 0.54% 0.78% 0.83% 1.17% Net interest margin2 3.53% 3.40% 3.05% 3.25% 2.95% 3.31% 3.11% 2.88% Dividend per share $ 0.33 $ 0.33 $ 0.32 $ 1.31 $ 1.28 $ 1.28 $ 1.28 $ 1.25 Market value per share $ 51.08 $ 50.20 $ 35.45 $ 50.20 $ 29.90 $ 31.55 $ 36.10 $ 33.10 Book value per share $ 39.78 $ 39.11 $ 33.99 $ 39.11 $ 32.69 $ 30.23 $ 26.01 $ 35.36 Tangible book value per share3 $ 37.78 $ 37.10 $ 31.97 $ 37.10 $ 30.65 $ 28.17 $ 23.96 $ 33.34 Market cap ($M) $ 229.50 $ 224.95 $ 157.91 $ 224.95 $ 132.37 $ 137.91 $ 158.48 $ 147.00 1 Net Overhead Ratio = (Noninterest Expense – Noninterest Income + BOLI Gains + Gain on Sale of Assets + Gains on sale of Securities) / Average Assets 2 Fully taxable equivalent 3 Non-GAAP measurement. See GAAP / Non-GAAP Reconciliation Franklin Financial Services Corporation F&M TRUST 17
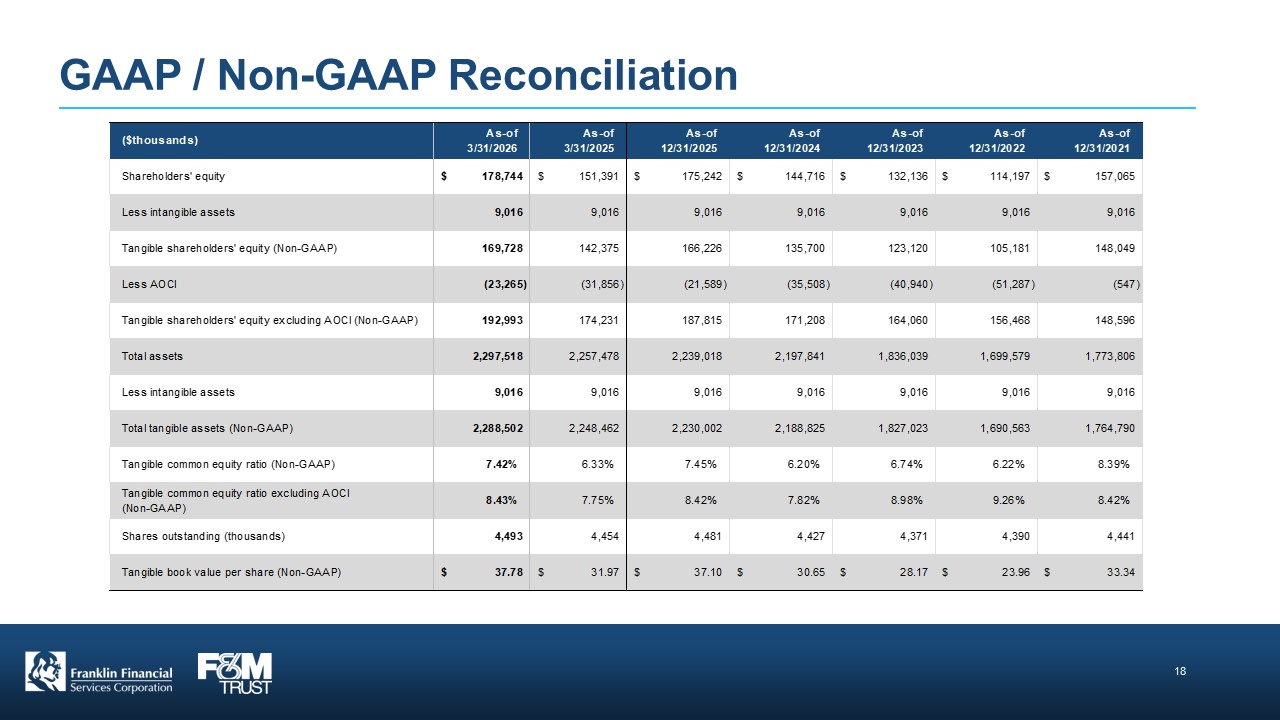
GAAP / Non-GAAP Reconciliation ($thousands) As-of 3/31/2026 As-of 3/31/2025 As-of 12/31/2025 As-of 12/31/2024 As-of 12/31/2023 As-of 12/31/2022 As-of 12/31/2021 Shareholders' equity $ 178,744 $ 151,391 $ 175,242 $ 144,716 $ 132,136 $ 114,197 $ 157,065 Less intangible assets 9,016 9,016 9,016 9,016 9,016 9,016 9,016 Tangible shareholders' equity (Non-GAAP) 169,728 142,375 166,226 135,700 123,120 105,181 148,049 Less AOCI (23,265) (31,856) (21,589) (35,508) (40,940) (51,287) (547) Tangible shareholders' equity excluding AOCI (Non-GAAP) 192,993 174,231 187,815 171,208 164,060 156,468 148,596 Total assets 2,297,518 2,257,478 2,239,018 2,197,841 1,836,039 1,699,579 1,773,806 Less intangible assets 9,016 9,016 9,016 9,016 9,016 9,016 9,016 Total tangible assets (Non-GAAP) 2,288,502 2,248,462 2,230,002 2,188,825 1,827,023 1,690,563 1,764,790 Tangible common equity ratio (Non-GAAP) 7.42% 6.33% 7.45% 6.20% 6.74% 6.22% 8.39% Tangible common equity ratio excluding AOCI (Non-GAAP) 8.43% 7.75% 8.42% 7.82% •eye 8.98% ----------- 9.26% 8.42% Shares outstanding (thousands) 4,493 4,454 4,481 4,427 4,371 4,390 4,441 Tangible book value per share (Non-GAAP) $ 37.78 $ 31.97 $ 37.10 $ 30.65 $ 28.17 $ 23.96 $ 33.34 Franklin Financial Services Corporation F&M TRUST 18