Pay vs Performance Disclosure - USD ($)
Dec. 31, 2025
Dec. 31, 2024
Dec. 31, 2023
Pay vs. Performance
The amounts set forth below under the headings “Compensation Actually Paid to PEO” and “Average Compensation Actually Paid to
Non-PEO
NEOs” have been calculated in a manner consistent with Item 402(v) of Regulation S-K.
Use of the term “compensation actually paid” (“CAP”) is required by the SEC’s rules and, as a result of the calculation methodology required by the SEC, such amounts differ from compensation actually received by the individuals and the compensation decisions described in the “Executive Compensation” section of this proxy filing. The information provided below was not considered by the Compensation Committee in structuring or determining compensation for our NEOs. Year |
Summary Compensation Table Total for PEO (1) |
Compensation Actually Paid to PEO (2) |
Average Summary Compensation Table Total for Non-PEO NEOs (3) |
Average Compensation Actually Paid to Non-PEO NEOs (4) |
Total Shareholder Return |
Net Income |
||||||||||||||||||
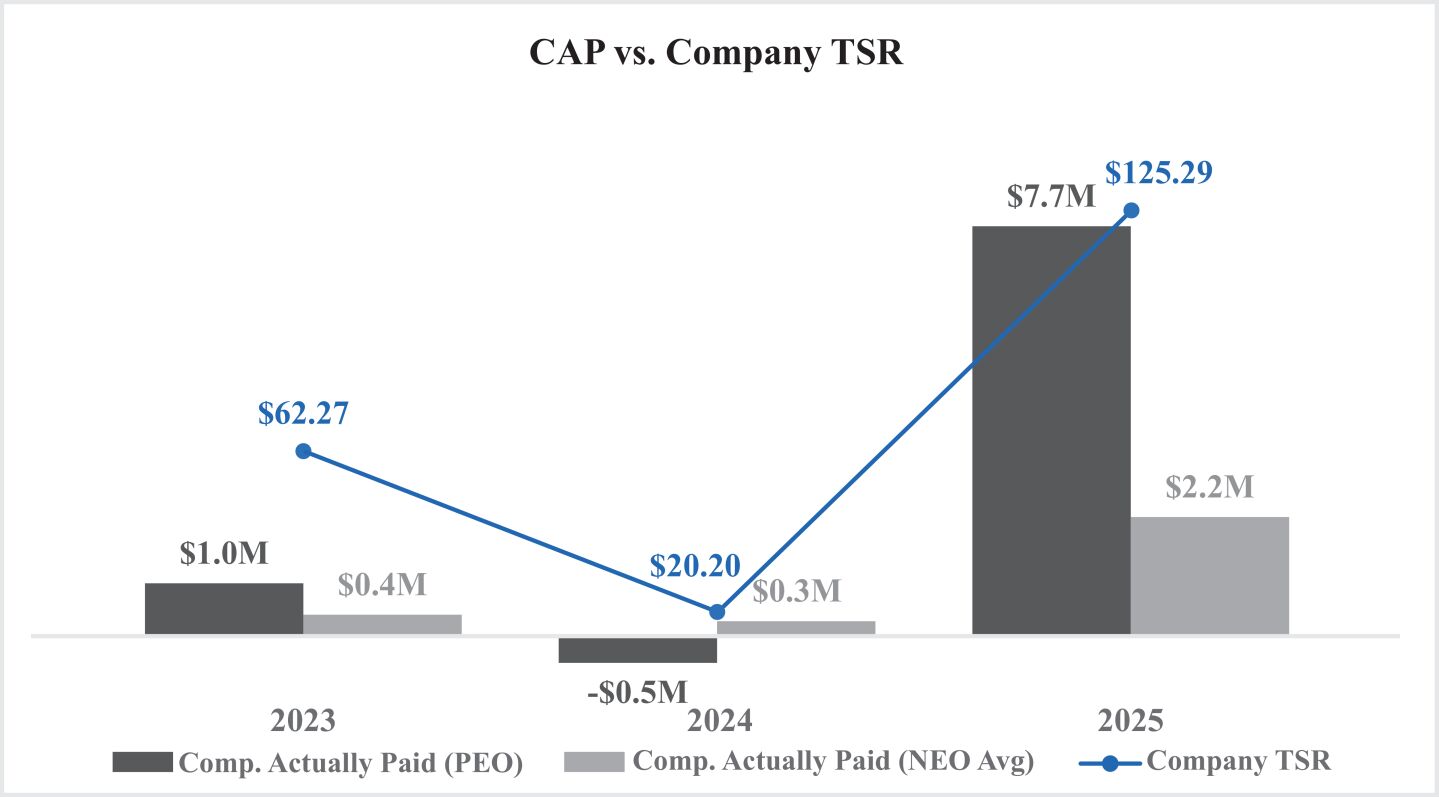
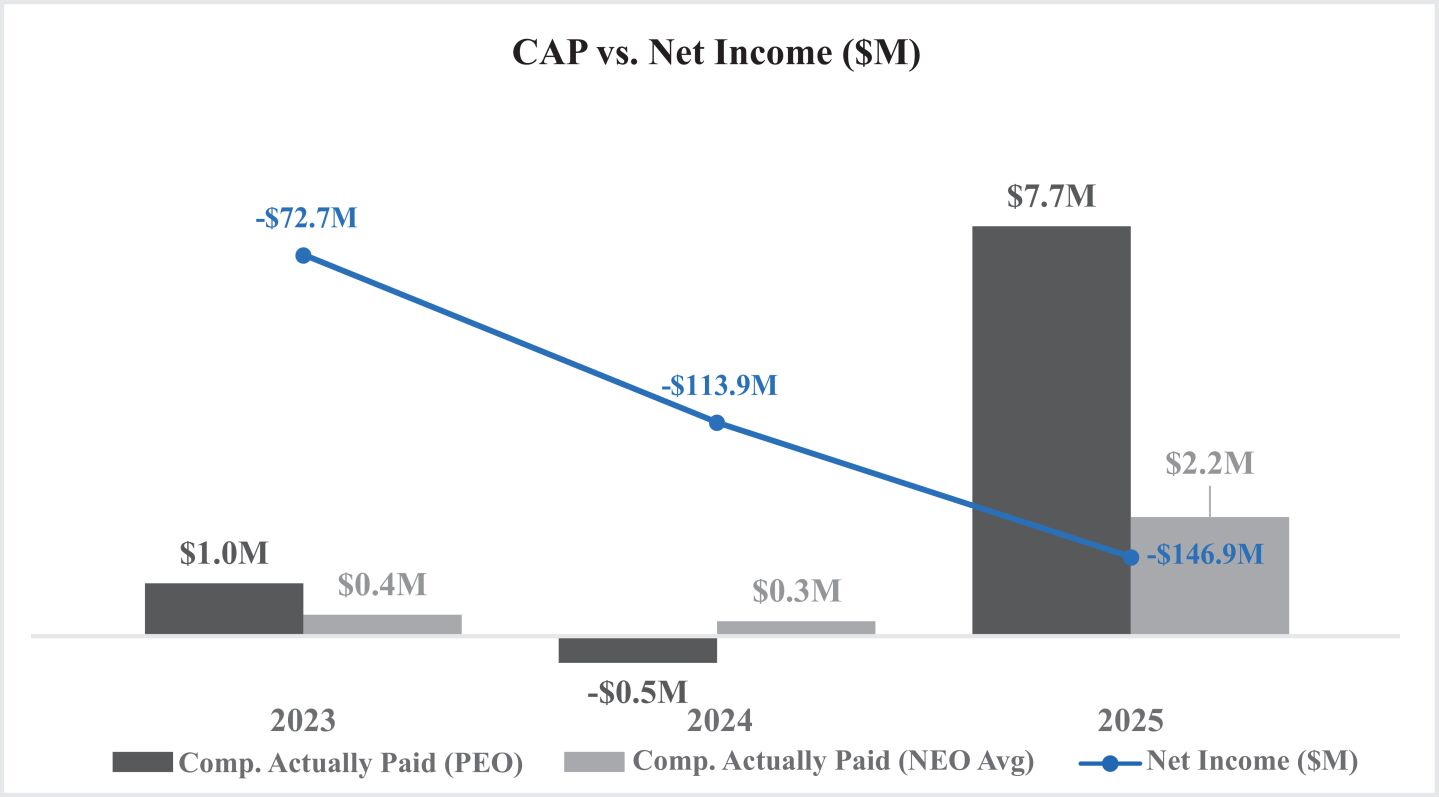
2025 |
$ | 3,357,947 | $ | 7,656,432 | $ | 1,355,279 | $ | 2,218,042 | $ | 125.29 | ($ | 146,946,905 | ) | |||||||||||
2024 |
$ | 1,622,146 | ($ | 506,084 | ) | $ | 639,606 | $ | 271,330 | $ | 20.20 | ($ | 113,918,000 | ) | ||||||||||
2023 (5) |
$ | 2,440,486 | $ | 978,122 | $ | 631,145 | $ | 391,144 | $ | 62.27 | ($ | 72,710,000 | ) | |||||||||||
| (1) | The dollar amounts reported in this column are the amounts of total compensation reported for Daniel Tasse (our Chief Executive Officer) for each corresponding year in the “Total” column of the Summary Compensation Table. Refer to “Executive Compensation—Summary Compensation Table.” |
| (2) | The dollar amounts reported in this column represent the amount of CAP to Daniel Tasse, as computed in accordance with Item 402(v) of Regulation S-K. The dollar amounts do not reflect the actual amount of compensation earned by or paid to Daniel Tasse during the applicable year. In accordance with the requirements of Item 402(v) of Regulation S-K, the adjustments summarized in the table below were made to Daniel Tasse’s total compensation for each year to determine the compensation actually paid: |
Year |
Fair Value at Fiscal Year End of Outstanding and Unvested Equity Awards Granted in the Fiscal Year |
Change in Fair Value of Outstanding and Unvested Equity Awards Granted in Prior Fiscal Years |
Fair Value at Vesting of Equity Awards Granted and Vested in the Fiscal Year |
Change in Fair Value as of the Vesting Date of Equity Awards Granted in Prior Fiscal Years that Vested in the Fiscal Year |
Fair Value as of the Prior Fiscal Year End of Equity Awards Granted in Prior Fiscal Years That Failed to Meet Vesting Conditions in the Year |
Value of Dividends or Other Earnings Paid on Equity Awards Not Otherwise Reflected in Total Compensation |
Total Equity Award Adjustments |
|||||||||||||||||||||
2025 |
$ | 2,518,980 | $ | 2,915,906 | $ | 0 | $ | 778,975 | $ | 0 | $ | 0 | $ | 6,213,861 | ||||||||||||||
2024 |
$ | 412,578 | ($ | 1,458,802 | ) | $ | 0 | ($ | 593,879 | ) | $ | 0 | $ | 0 | ($ | 1,640,104 | ) | |||||||||||
2023 |
$ | 1,289,764 | ($ | 1,363,237 | ) | $ | 0 | ($ | 304,108 | ) | $ | 0 | $ | 0 | ($ | 377,581 | ) | |||||||||||
| (3) | The dollar amounts reported in column (c) represent the average of the amounts reported for the NEOs as a group (excluding our PEO) in the “Total” column of the Summary Compensation Table in each applicable year. The NEOs (excluding our PEO) included for purposes of calculating the average amounts in 2023, 2024 and 2025 are Virginie Boucinha and Pharis Mohideen. |
| (4) | “The dollar amounts reported in column (d) represent the average amount of CAP to the NEOs as a group (excluding our PEO), as computed in accordance with Item 402(v) of Regulation S-K. The dollar amounts do not reflect the actual average amount of compensation earned by or paid to the NEOs as a group (excluding our PEO) during the applicable year. In accordance with the requirements of Item 402(v) of Regulation S-K, the following adjustments were made to average total compensation for the NEOs as a group (excluding our PEO) for each year to determine the CAP: |
Year |
Fair Value at Fiscal Year End of Outstanding and Unvested Equity Awards Granted in the Fiscal Year |
Change in Fair Value of Outstanding and Unvested Equity Awards Granted in Prior Fiscal Years |
Fair Value at Vesting of Equity Awards Granted and Vested in the Fiscal Year |
Change in Fair Value as of the Vesting Date of Equity Awards Granted in Prior Fiscal Years that Vested in the Fiscal Year |
Fair Value as of the Prior Fiscal Year End of Equity Awards Granted in Prior Fiscal Years that Failed to Meet Vesting Conditions in the Year |
Value of Dividends or Other Earnings Paid on Equity Awards Not Otherwise Reflected in Total Compensation |
Total Equity Award Adjustments |
|||||||||||||||||||||
2025 |
$ | 535,691 | $ | 691,419 | $ | 0 | $ | 180,358 | $ | 0 | $ | 0 | $ | 1,407,467 | ||||||||||||||
2024 |
$ | 100,353 | ($ | 281,374 | ) | $ | 0 | ($ | 109,158 | ) | $ | 0 | $ | 0 | ($ | 290,179 | ) | |||||||||||
2023 |
$ | 210,150 | ($ | 118,195 | ) | $ | 0 | ($ | 29,431 | ) | ($ | 112,455 | ) | $ | 0 | ($ | 49,930 | ) | ||||||||||
| (5) | As noted above in the Summary Compensation Table, the value of the 2023 Option Awards paid to our Chief Financial Officer, Virginie Boucinha, was updated from $151,395 to $151,398 due to administrative error in the amount reported in year 2023. The 2023 values reflected here have been updated accordingly. |
| (3) | The dollar amounts reported in column (c) represent the average of the amounts reported for the NEOs as a group (excluding our PEO) in the “Total” column of the Summary Compensation Table in each applicable year. The NEOs (excluding our PEO) included for purposes of calculating the average amounts in 2023, 2024 and 2025 are Virginie Boucinha and Pharis Mohideen. |
| (2) | The dollar amounts reported in this column represent the amount of CAP to Daniel Tasse, as computed in accordance with Item 402(v) of Regulation S-K. The dollar amounts do not reflect the actual amount of compensation earned by or paid to Daniel Tasse during the applicable year. In accordance with the requirements of Item 402(v) of Regulation S-K, the adjustments summarized in the table below were made to Daniel Tasse’s total compensation for each year to determine the compensation actually paid: |
Year |
Fair Value at Fiscal Year End of Outstanding and Unvested Equity Awards Granted in the Fiscal Year |
Change in Fair Value of Outstanding and Unvested Equity Awards Granted in Prior Fiscal Years |
Fair Value at Vesting of Equity Awards Granted and Vested in the Fiscal Year |
Change in Fair Value as of the Vesting Date of Equity Awards Granted in Prior Fiscal Years that Vested in the Fiscal Year |
Fair Value as of the Prior Fiscal Year End of Equity Awards Granted in Prior Fiscal Years That Failed to Meet Vesting Conditions in the Year |
Value of Dividends or Other Earnings Paid on Equity Awards Not Otherwise Reflected in Total Compensation |
Total Equity Award Adjustments |
|||||||||||||||||||||
2025 |
$ | 2,518,980 | $ | 2,915,906 | $ | 0 | $ | 778,975 | $ | 0 | $ | 0 | $ | 6,213,861 | ||||||||||||||
2024 |
$ | 412,578 | ($ | 1,458,802 | ) | $ | 0 | ($ | 593,879 | ) | $ | 0 | $ | 0 | ($ | 1,640,104 | ) | |||||||||||
2023 |
$ | 1,289,764 | ($ | 1,363,237 | ) | $ | 0 | ($ | 304,108 | ) | $ | 0 | $ | 0 | ($ | 377,581 | ) | |||||||||||
| (4) | “The dollar amounts reported in column (d) represent the average amount of CAP to the NEOs as a group (excluding our PEO), as computed in accordance with Item 402(v) of Regulation S-K. The dollar amounts do not reflect the actual average amount of compensation earned by or paid to the NEOs as a group (excluding our PEO) during the applicable year. In accordance with the requirements of Item 402(v) of Regulation S-K, the following adjustments were made to average total compensation for the NEOs as a group (excluding our PEO) for each year to determine the CAP: |
Year |
Fair Value at Fiscal Year End of Outstanding and Unvested Equity Awards Granted in the Fiscal Year |
Change in Fair Value of Outstanding and Unvested Equity Awards Granted in Prior Fiscal Years |
Fair Value at Vesting of Equity Awards Granted and Vested in the Fiscal Year |
Change in Fair Value as of the Vesting Date of Equity Awards Granted in Prior Fiscal Years that Vested in the Fiscal Year |
Fair Value as of the Prior Fiscal Year End of Equity Awards Granted in Prior Fiscal Years that Failed to Meet Vesting Conditions in the Year |
Value of Dividends or Other Earnings Paid on Equity Awards Not Otherwise Reflected in Total Compensation |
Total Equity Award Adjustments |
|||||||||||||||||||||
2025 |
$ | 535,691 | $ | 691,419 | $ | 0 | $ | 180,358 | $ | 0 | $ | 0 | $ | 1,407,467 | ||||||||||||||
2024 |
$ | 100,353 | ($ | 281,374 | ) | $ | 0 | ($ | 109,158 | ) | $ | 0 | $ | 0 | ($ | 290,179 | ) | |||||||||||
2023 |
$ | 210,150 | ($ | 118,195 | ) | $ | 0 | ($ | 29,431 | ) | ($ | 112,455 | ) | $ | 0 | ($ | 49,930 | ) | ||||||||||