N-4
Dec. 31, 2025
USD ($)
Years
|
Important Information You Should Consider About the Contract
|
|||
|
Fees, Expenses, and Adjustments
|
|||
|
Are there Charges or Adjustments for Early Withdrawals?
|
Yes.
Surrender Charges: If you withdraw money from the Contract within 6 years following your last Purchase Payment, you may be assessed a surrender charge. The maximum surrender charge is 8.0% of the Purchase Payment, and a surrender charge may be assessed up to 6 years after the last Purchase Payment. If you make an early withdrawal, you could pay a surrender charge of up to $8,000 on a $100,000 withdrawal. Losses from surrender charges will be greater if there are also negative Interim Value adjustments, taxes, or tax penalties. Interim Value Adjustments: If all or a portion of Account Value is removed from an Index Strategy before the end of the Index Strategy Term, we will apply an Interim Value adjustment, which may be negative. In extreme circumstances, you could lose up to 100% of your investment in an Index Strategy due to a negative Interim Value adjustment. For example, if you allocate $100,000 to an Index Strategy with a 3-year Strategy Term and later make a withdrawal before the 3 years have ended, you could lose your $100,000 investment. Losses from negative Interim Value adjustments will be greater if you also have to pay a surrender charge, taxes, or tax penalties. An Interim Value adjustment will apply upon any withdrawal, death benefit payment, transfer, Annuitization, or surrender that occurs during an Index Strategy Term other than on the Index Strategy Start Date or Index Strategy End Date. For more information on surrender charges and Interim Value adjustments, please refer to the “Fee Table” and “Charges and Adjustments” sections of this prospectus. |
||
|
Are there Transaction Charges?
|
Yes.
In addition to surrender charges and Interim Value adjustments, you may be charged for additional copies of reports. For more information, please refer to the “Fee Table” and “Charges and Adjustments” sections of this prospectus. |
||
|
Important Information You Should Consider About the Contract
|
|||
|
Fees, Expenses, and Adjustments
|
|||
|
Are there Ongoing Fees and Expenses?
|
Yes.
The table below describes the fees and expenses that you may pay each year, depending on the investment options you choose. Please refer to your Contract specifications page for information about the specific fees you will pay each year based on the options you have elected. There is an implicit ongoing fee on the Index Strategies to the extent that an Index Strategy’s Cap Rate, Spread, Participation Rate, or Step Rate, as applicable, limit the positive Index Return used in calculating the Index Credit that may be applied to an Index Strategy at the end of an Index Strategy Term. This means that your returns may be lower than the Index Return. In return for accepting this limit on Index gains, you will receive some protection from Index losses. This implicit ongoing fee is not reflected in the tables below. |
||
|
Annual Fee
|
Minimum
|
Maximum
|
|
|
Base Contract Fees
|
1.20%(1)
|
1.30%(1)
|
|
|
Portfolio Company fees and expenses
|
0.57%
|
1.25%
|
|
|
Optional benefits available for an additional charge
(for a single optional benefit, if elected) |
None.
|
None.
|
|
|
(1) Insurance Charge: a percentage of the net assets of the Variable Option. For Purchase Payments equal to or greater than $1,000,000 the charge will be 1.20%.
|
|||
|
Because your Contract is customizable, the choices you make affect how much you will pay. To help you understand the cost of owning your Contract, the following table shows the lowest and highest cost you could pay each year, based on current charges. This estimate assumes that you do not take withdrawals from the Contract, which could add surrender charges and negative Interim Value adjustments that substantially increase costs.
|
|||
|
Lowest Annual Cost
$1,912 |
Highest Annual Cost
$2,601 |
|
|
|
Assumes:
|
Assumes:
|
|
|
|
For more information on ongoing fees and expenses, please refer to the “Fee Table” and “Charges and Adjustments” sections of this prospectus.
|
|||
Are there Charges or Adjustments for Early Withdrawals?
Yes.
Surrender Charges: If you withdraw money from the Contract within 6 years following your last Purchase Payment, you may be assessed a surrender charge. The maximum surrender charge is 8.0% of the Purchase Payment, and a surrender charge may be assessed up to 6 years after the last Purchase Payment. If you make an early withdrawal, you could pay a surrender charge of up to $8,000 on a $100,000 withdrawal. Losses from surrender charges will be greater if there are also negative Interim Value adjustments, taxes, or tax penalties.
Interim Value Adjustments: If all or a portion of Account Value is removed from an Index Strategy before the end of the Index Strategy Term, we will apply an Interim Value adjustment, which may be negative. In extreme circumstances, you could lose up to 100% of your investment in an Index Strategy due to a negative Interim Value adjustment. For example, if you allocate $100,000 to an Index Strategy with a 3-year Strategy Term and later make a withdrawal before the 3 years have ended, you could lose your $100,000 investment. Losses from negative Interim Value adjustments will be greater if you also have to pay a surrender charge, taxes, or tax penalties. An Interim Value adjustment will apply upon any withdrawal, death benefit payment, transfer, Annuitization, or surrender that occurs during an Index Strategy Term other than on the Index Strategy Start Date or Index Strategy End Date.
For more information on surrender charges and Interim Value adjustments, please refer to the “Fee Table” and “Charges and Adjustments” sections of this prospectus.
Are there Transaction Charges?
Yes.
In addition to surrender charges and Interim Value adjustments, you may be charged for additional copies of reports. For more information, please refer to the “Fee Table” and “Charges and Adjustments” sections of this prospectus.
In addition to surrender charges and Interim Value adjustments, you may be charged for additional copies of reports. For more information, please refer to the “Fee Table” and “Charges and Adjustments” sections of this prospectus.
Are there Ongoing Fees and Expenses?
Yes.
The table below describes the fees and expenses that you may pay each year, depending on the investment options you choose. Please refer to your Contract specifications page for information about the specific fees you will pay each year based on the options you have elected.
There is an implicit ongoing fee on the Index Strategies to the extent that an Index Strategy’s Cap Rate, Spread, Participation Rate, or Step Rate, as applicable, limit the positive Index Return used in calculating the Index Credit that may be applied to an Index Strategy at the end of an Index Strategy Term. This means that your returns may be lower than the Index Return. In return for accepting this limit on Index gains, you will receive some protection from Index losses. This implicit ongoing fee is not reflected in the tables below.
Annual Fee
Minimum
Maximum
Base Contract Fees
1.20%(1)
1.30%(1)
Portfolio Company fees and expenses
0.57%
1.25%
Optional benefits available for an additional charge
(for a single optional benefit, if elected)
(for a single optional benefit, if elected)
None.
None.
(1) Insurance Charge: a percentage of the net assets of the Variable Option. For Purchase Payments equal to or greater than $1,000,000 the charge will be 1.20%.
Because your Contract is customizable, the choices you make affect how much you will pay. To help you understand the cost of owning your Contract, the following table shows the lowest and highest cost you could pay each year, based on current charges. This estimate assumes that you do not take withdrawals from the Contract, which could add surrender charges and negative Interim Value adjustments that substantially increase costs.
Lowest Annual Cost
$1,912
$1,912
Highest Annual Cost
$2,601
$2,601
Assumes:
-
Investment of $100,000
-
5% annual appreciation
-
Least expensive Portfolio fees and
expenses
-
No optional benefits
-
No sales charges
-
No subsequent Purchase Payments, transfers or withdrawals
Assumes:
-
Investment of $100,000
-
5% annual appreciation
-
Most expensive combination of optional benefits and Portfolio fees and expenses
-
No sales charges
-
No subsequent Purchase Payments, transfers or withdrawals
For more information on ongoing fees and expenses, please refer to the “Fee Table” and “Charges and Adjustments” sections of this prospectus.
Risks
Is there a Risk of Loss from Poor Performance?
Yes.
You can lose money by investing in the Contract. Under an Index Strategy, the maximum amount of loss that you could experience from negative Index performance at the end of an Index Strategy Term, after taking into account the current limits on Index loss provided under the Contract, is: 95% loss for a 5% Buffer; 90% loss for a 10% Buffer; 85% loss for a 15% Buffer; 80% loss for a 20% Buffer; 70% loss for a 30% Buffer; or 0% loss for a 100% Buffer.
The Company does not guarantee that the Contract will always offer Index Strategies that limit Index losses, which would mean a risk of loss of the entire amount invested.
For more information on the risk of loss, please refer to the “Principal Risks of Investing in the Contract” section of this prospectus.
Is this a Short-Term Investment?
No.
The Contract is not a short-term investment and is not appropriate for an investor who needs ready access to cash. The Contract is designed to provide benefits on a long-term basis. Because of the long-term nature of the Contract, you should consider whether the Contract is consistent with your financial situation and objectives.
Amounts withdrawn from the Contract may result in surrender charges, taxes and tax penalties. In addition, removing amounts from an Index Strategy prior to the Index Strategy End Date may result in a negative Interim Value adjustment and loss of positive Index performance.
Removing a portion of amounts in an Index Strategy prior to the Index Strategy End Date will also result in an immediate reduction to your Index Strategy Base. The Index Strategy Base will be proportionately reduced, and the proportionate reduction could be greater than the amount removed. Reductions to your Index Strategy Base will result in lower Interim Values for the remainder of the Index Strategy Term and less positive Index Credit (if any) on the Index Strategy End Date.
At the end of an Index Strategy Term, amounts in the matured Index Strategy will be reallocated, withdrawn or otherwise processed according to your instructions. You must provide instructions for reallocation by the Index Anniversary Date corresponding to the Index Strategy End Date. In the absence of instructions, if the same Index Strategy is available, amounts in the matured Index Strategy will be automatically re-invested in the same Index Strategy for a new Index Strategy Term. During the Savings Stage, if the same Index Strategy is no longer available, amounts in the matured Index Strategy will be automatically transferred to the Holding Account, and the amount may be transferred into another Index Strategy on the next Index Anniversary Date.
For more information on the short-term investment risks, please refer to the “Principal Risks of Investing in the Contract”,“Charges and Adjustments” and “General Description of Contracts - Transfer and Reallocation Guidelines” sections of this prospectus.
What are the Risks Associated with the Investment Options?
An investment in the Contract is subject to the risk of poor investment performance and can vary depending on the performance of the investment options available under the Contract, including the Index Strategies, and the Variable Options. Each investment option has its own unique risks. You should review the investment options before making an investment decision.
For the Index Strategies:
For the Index Strategies:
-
The Cap Rate, Spread, Participation Rate or Step Rate, as applicable, may limit positive Index Credits (i.e., limited upside). This may result in you earning less than the Index Return. For example:
-
Point-to-Point with Cap Index Strategy. Assuming a Cap Rate of 5% and an Index Return of 10% (which is greater than the Cap Rate), we will apply a 5% Index Credit at the end of the Index Strategy Term.
-
Enhanced Cap Rate Index Strategy. Assuming a Spread of 2%, Cap Rate of 15% and Index Return of 18% (which is greater than the Cap Rate plus the Spread), we will apply a 15% Index Credit at the end of the Index Strategy Term. If the Index Return is instead 10% (which is less than the Cap Rate plus the Spread), we will deduct the Spread from the Index Return and apply an 8% Index Credit at the end of the Index Strategy Term. If the Index Return is instead 1% (which is greater than zero but less than the Spread), the Index Credit would be 0%.
-
Step Rate Plus Index Strategy. Assume the Step Rate is 4% and the Participation Rate is 60%. If the Index Return is 5%, we will apply the Step Rate to calculate the Index Credit because the Step Rate (4%) is greater than the Index Return multiplied by the Participation Rate (5% x 60% = 3%). The Index Credit at the end of the Index Strategy Term will be 4%. If the Index Return is instead 10%, we will apply the Participation Rate rather than the Step Rate because the Index Return multiplied by the Participation Rate (10% x 60% = 6%) will be greater than the Step Rate (4%). The Index Credit at the end of the Index Strategy Term will be 6%.
-
Dual Directional Index Strategy. Assuming a Cap Rate of 4% and an Index Return of 8% (which is greater than the Cap Rate), we will apply a 4% Index Credit at the end of the Index Strategy Term.
-
The Buffer may limit negative Index Credits (i.e., limited protection in the case of market decline). For example, if the Index Return is -25% and the Buffer is 10%, we will apply a -15% Index Credit (the amount of negative Index Return that exceeds the Buffer) at the end of the Index Strategy Term.
-
There may be losses due to surrender charges, negative Interim Value adjustments, and taxes and tax penalties.
Index performance is on a “price return” basis, not a “total return” basis, and therefore does not reflect dividends paid on the securities composing the Index. In addition, if the Index is an exchange-traded fund (ETF), the ETF deducts fees and costs that reduce Index performance. These factors will reduce the Index Return and may cause the Index to underperform a direct investment in the securities composing the Index.
For more information on the risks associated with investment options, please refer to the “Principal Risks of Investing in the Contract” and “Appendix A” sections of this prospectus.
What are the Risks Related to the Insurance Company?
An investment in the Contract is subject to the risks related to the Company. Any obligations (including under the Index Strategies), guarantees, or benefits are subject to the claims-paying ability of the Company. More information about the Company, including its financial strength ratings, is available upon request. Such requests can be made toll-free at 1-888-PRU-2888.
For more information on the insurance company risks, please refer to the “Principal Risks of Investing in the Contract” section of this prospectus.
For more information on the insurance company risks, please refer to the “Principal Risks of Investing in the Contract” section of this prospectus.
Yes.
There are restrictions that may limit the investment options that you may choose, and there are limitations on the transfer of Account Value among investment options.
There are restrictions that may limit the investment options that you may choose, and there are limitations on the transfer of Account Value among investment options.
-
Account Value may be transferred to an Index Strategy, or among Index Strategies, only on an Index Strategy End Date.
-
Account Value in the Variable Option may be transferred to an Index Strategy only on an Index Anniversary Date.
-
During the Savings Stage, Account Value transferred from an Index Strategy to the Variable Option prior to the Index Strategy End Date will result in an Interim Value adjustment, which may be negative.
-
During the Income Stage, no Index Strategies are available other than the 1-year Point-to-Point with Cap, 1-year Dual Directional, 1-year Step Rate Plus, and 1-year Enhanced Cap Rate* Index Strategies. The Variable Options are not available during the Income Stage. We reserve the right to:
-
Remove or substitute Portfolios and close the Variable Option;
-
Add or remove Index Strategies (there is no guarantee that any Index Strategy will be available in the future);
-
Change the features of an Index Strategy from one Index Strategy Term to the next, including the Index, Cap Rate, Spread, Participation Rate, Step Rate, and Buffer, as applicable, subject to any minimum guarantees; and
-
Substitute the Index of an Index Strategy during its Index Strategy Term.
We may impose limitations on an investment professional’s or investment advisor’s ability to request financial transactions on your behalf.
*Enhanced Cap Rate Index Strategies are only available on annuities with an Application Sign Date on or after July 1, 2024.
Certain Investment Options may not be available through certain financial intermediaries. See Appendix F, “Financial Intermediary Variations’” and the Cover Page of this prospectus for additional information.
For more information on investment and transfer restrictions, please refer to the “Principal Risks of Investing in the Contract”, “Investment Options”, “General Description of Contracts – Transfer and Reallocation Guidelines”, “What are the Separate Accounts”, “Financial Professional Permission to Forward Transaction Instructions”, and “Appendix A” sections of this prospectus.
Certain Contract Benefits may not be available through certain financial intermediaries. See, Appendix F, “Financial Intermediary Variations” and the Cover Page of this prospectus for additional information.
You should consult with a tax professional to determine the tax implications of an investment in and payments received under the Contract. There is no additional tax benefit if you purchase the Contract through a tax-qualified plan or individual retirement account (IRA). Withdrawals will be subject to ordinary income tax, and may be subject to a 10% additional tax for distributions taken prior to age 59½.
For more information on tax implications, please refer to the “Taxes” section of this prospectus.
For more information on tax implications, please refer to the “Taxes” section of this prospectus.
Investment professionals may receive compensation for selling the Contract to investors and may have a financial incentive to offer or recommend the Contract over another investment. This compensation is paid in the form of commissions, based on the amount of your investment in the Contract.
For more information on investment professional compensation, please refer to the Statement of Additional Information.
For more information on investment professional compensation, please refer to the Statement of Additional Information.
Some investment professionals may have a financial incentive to offer you a Contract in place of the one you already own. You should only exchange your contract if you determine after comparing the features, fees, and risks of both contracts, and any fees or penalties to terminate the existing contract, that it is preferable to purchase the new contract, rather than continue to own your existing contract.
For more information on exchanges, please refer to the Statement of Additional Information.
For more information on exchanges, please refer to the Statement of Additional Information.
FEE TABLE
The following tables describe the fees, expenses, and adjustments that you will pay when buying, owning, and surrendering or making withdrawals from an Investment Option or from the Contract. Please refer to your Annuity specifications page for information about the specific fees you will pay each year based on the options you have elected.
The first table describes the fees and expenses that you will pay at the time that you buy the Annuity, surrender or make withdrawals from an Investment Option or from the Annuity, or transfer Account Value between Investment Options, where applicable. State premium taxes may also be deducted. These fees and charges are described in more detail within this prospectus in the "Charges and Adjustments" section.
|
Transaction Expenses
|
Maximum
|
|
Sales Charge Imposed on Purchases
|
None
|
|
Deferred Sales Charge (as a percentage of each Purchase Payment)1
|
7.00%
|
|
Transfer Fee
|
None
|
|
Additional Copies of Reports
|
$50
|
|
|
Age of Purchase Payment Being Withdrawn*
|
Percentage Applied Against Purchase Payment being Withdrawn
|
|
|
|
Less than 1 year old
|
7.0%
|
|
|
|
1 year old or older but not yet 2 years old
|
7.0%
|
|
|
|
2 years old or older but not yet 3 years old
|
6.0%
|
|
|
|
3 years old or older but not yet 4 years old
|
5.0%
|
|
|
|
4 years old or older but not yet 5 years old
|
4.0%
|
|
|
|
5 years old or older but not yet 6 years old
|
3.0%
|
|
|
|
6 years old or older
|
0.0%
|
|
|
Transaction Expenses
|
Maximum
|
|
Sales Charge Imposed on Purchases
|
None
|
|
Deferred Sales Charge (as a percentage applied against Purchase Payment being withdrawn)1
|
8.00%
|
|
Transfer Fee
|
None
|
|
Additional Copies of Reports
|
$50
|
|
|
Age of Purchase Payment Being Withdrawn*
|
Percentage Applied Against Purchase Payment being Withdrawn
|
|
|
|
Less than 1 year old
|
8.0%
|
|
|
|
1 year old or older but not yet 2 years old
|
8.0%
|
|
|
|
2 years old or older but not yet 3 years old
|
7.0%
|
|
|
|
3 years old or older but not yet 4 years old
|
6.0%
|
|
|
|
4 years old or older but not yet 5 years old
|
5.0%
|
|
|
|
5 years old or older but not yet 6 years old
|
4.0%
|
|
|
|
6 years old or older
|
0.0%
|
|
The next table describes the adjustments, in addition to any transaction expenses, that apply if all or a portion of the Account Value is removed from an Index Strategy before the expiration of an Index Strategy Term.
|
Adjustments
|
Maximum
|
|
Interim Value Adjustment Maximum Potential Loss (as a percentage of your investment in an Index Strategy)1
|
100%
|
The next table describes the maximum fees and expenses that you will pay each year during the time that you own the Contract (not including Portfolio fees and expenses). Your current fees and expenses may be less than the maximum.
|
Annual Contract Expenses
|
Current
|
Maximum
|
|
Base Contract1,2
|
1.30%3
|
1.30%
|
|
In addition to the fees described above, we limit the amount you can earn on the Index Strategies. This means your Index Credit may be lower than the Index Return. In return for accepting this limit on Index gains, you will receive some protection from Index losses.
|
The next item shows the minimum and maximum total operating expenses charged by the Portfolios that you may pay periodically during the time that you own the Annuity. Expenses may change over time and may be higher or lower in the future. More information about the Portfolios, including their annual expenses, may be found in "Appendix A" of this prospectus.
|
Annual Portfolio Expenses
|
||
|
(expenses that are deducted from Portfolio assets, including management fees, distribution and/or service (12b-1) fees, and other expenses)
|
Minimum
|
Maximum
|
|
0.57%
|
1.25%
|
|
|
Adjustments
|
Maximum
|
|
Interim Value Adjustment Maximum Potential Loss (as a percentage of your investment in an Index Strategy)1
|
100%
|
|
Annual Contract Expenses
|
Current
|
Maximum
|
|
Base Contract1,2
|
1.30%3
|
1.30%
|
|
Annual Portfolio Expenses
|
||
|
(expenses that are deducted from Portfolio assets, including management fees, distribution and/or service (12b-1) fees, and other expenses)
|
Minimum
|
Maximum
|
|
0.57%
|
1.25%
|
|
PRINCIPAL RISKS OF INVESTING IN THE CONTRACT
The risks identified below are the principal risks of investing in the Annuity. The Annuity may be subject to additional risks other than those identified and described in this prospectus.
Risk of Loss: You could lose money by investing in the Annuity, including your principal investment. An investment in the Annuity is not a deposit with a bank and is not insured or guaranteed by the Federal Deposit Insurance Corporation or any other government agency.
Buffer Risk: You take the investment risk for amounts allocated to one or more Index Strategies since the Index Credit is based upon the performance of the associated Index. You could lose a significant amount of money if the Index declines in value. We limit the negative Index Return used in calculating Index Credit applied to an Index Strategy at the end of its Index Strategy Term through a Buffer. The Buffer is the amount of protected negative Index Return. Any negative Index Return in excess of the Buffer reduces the Account Value allocated to the Index Strategy (i.e., the protection from negative Index performance is limited). You bear the risk of the negative Index Return in excess of the Buffer you choose. In the case of a multi-year Index Strategy Term, losses are measured over the entire Index Strategy Term from the Index Strategy Start Date to the Index Strategy End Date and may exceed the Buffer levels associated with the Index Strategy. Sustained negative Index Returns may result in zero or negative Index Credits over multiple Index Strategy Terms.
Under an Index Strategy, the maximum amount of loss that you could experience from negative Index performance at the end of an Index Strategy Term, after taking into account the current limits on Index loss provided under the Annuity, is: 95% loss for a 5% Buffer; 90% loss for a 10% Buffer; 85% loss for a 15% Buffer; 80% loss for a 20% Buffer; 70% loss for a 30% Buffer or 0% loss for a 100% Buffer. The Company does not guarantee that the Annuity will always offer Index Strategies that limit Index losses, which would mean risk of loss of the entire amount invested.
Cap Rate Risk: If you elect a Point-to-Point with Cap Rate or Enhanced Cap Rate Index Strategy, a positive Index Credit may be limited by the applicable Cap Rate, which means that your Index Credit could be lower than the Index Return. The Cap Rate exists for the full term of the Index Strategy. Cap Rates, upon renewal, may be higher or lower than the initial Cap Rate but will never be less than the Guaranteed Minimum Cap Rate. Renewal Cap Rates may differ from the Cap Rates used for new Annuity contracts or for other Annuity contracts issued at different times. No Index Strategy guarantees a positive Index Credit.
If you elect a Dual Directional Index Strategy, a positive Index Return may be limited by the applicable Cap Rate. However, if the Index Return is negative and is within or equal to the Buffer, then the Index Credit would not be limited by the applicable Cap Rate. Cap Rates for the Dual Directional Index Strategy will be equal to or lower than the Cap Rate in the Point to Point with Cap Rate Index Strategy. Cap Rates will never be less than the Guaranteed Minimum Cap Rates. The Guaranteed Minimum Cap Rate equals 1.00% for a one-year Index Strategy Term, 5.00% for a three-year Index Strategy Term and 10.00% for a six-year Index Strategy Term. Cap Rates for new Index Strategy Terms are declared at our discretion, subject to applicable guarantees. You bear the risk that we will not declare a Cap Rate above the Guaranteed Minimum Cap Rate.
Step Rate Plus Risk: If you elect a Step Rate Plus Index Strategy, a positive Index Credit may be limited by the applicable Step Rate or Participation Rate, which means that your Index Credit could be lower than the Index Return. The Step Rate and Participation Rate exist for the full term of the Index Strategy. Step Rates and Participation Rates, upon renewal, may be higher or lower than the initial Step Rate or Participation Rate but will never be less than the Guaranteed Minimum Step Rate and Guaranteed Minimum Participation Rate, respectively. Renewal Step Rates or Participation Rates may differ from the Step Rates or Participation Rates used for new Annuity contracts or for other Annuity contracts issued at different times. No Index Strategy guarantees a positive Index Credit.
For Step Rate Plus Index Strategies, the Guaranteed Minimum Step Rate equals 1% and the Guaranteed Minimum Participation Rate equals 60%. Step Rates and Participation Rates for new Index Strategy Terms are declared at our discretion, subject to applicable guarantees. You bear the risk that we will not declare a Step Rate or Participation Rate above the guaranteed minimum
Tiered Participation Rate Risk: If you elect a Tiered Participation Rate Index Strategy, a positive Index Credit will be calculated using the applicable 1st Tier Participation Rate, 2nd Tier Participation Rate, and Tier Level. If the Index Return does not exceed the Tier Level, the 2nd Tier Participation Rate will not apply to any portion of the Index Return. The 1st Tier Participation Rate, 2nd Tier Participation Rate, and Tier Level exist for the full term of the Index Strategy. Participation Rates and Tier Levels, upon renewal, may be higher or lower than the initial Participation Rates or Tier Level but will never be less than the Guaranteed Minimum Participation Rate or Guaranteed Maximum Tier Level, respectively. Renewal Participation Rates and Tier Levels may differ from the Participation Rates and Tier Levels used for new Annuity contracts or for other Annuity contracts issued at different times. No Index Strategy guarantees a positive Index Credit.
For Tiered Participation Rate Index Strategies, the Guaranteed Minimum Participation Rate equals 100% and the Guaranteed Maximum Tier Level equals 35%. Participation Rates for new Index Strategy Terms are declared at our discretion, subject to applicable guarantees. You bear the risk that we will not declare a Participation Rate above the guaranteed minimum, or a Tier Level below the guaranteed maximum.
Risks Associated with the Indices: Because the S&P 500® Index, MSCI EAFE Index, Invesco QQQ ETF, iShares Russell 2000 ETF, AB 500 Plus Index and Dimensional International Equity Focus Index are each comprised of a collection of equity securities, in each case the value of the component securities is subject to market risk, or the risk that market fluctuations may cause the value of the component securities to go up or down, sometimes rapidly and unpredictably. Market fluctuations can result from disasters and other events, such as storms, earthquakes, fires, outbreaks of infectious diseases (such as COVID -19), utility failures, terrorist acts, political and social developments, and military and governmental actions. In addition, the
value of equity securities may increase or decline for reasons directly related to the issuers of the securities. Equity markets are subject to the risk that the value of the securities may fall due to general market and economic conditions. Market volatility may exist with these Indices, which means that the value of the Indices can change dramatically over a short period of time in either direction. When you allocate to an Index Strategy that is linked to the performance of one of the Indices, you are not investing in the Index or in the securities composing the Index.
Each Index is subject to additional risks, including the following:
|
●
|
The S&P 500® Index is subject to risks associated with large-capitalization U.S. companies. In general, large-capitalization companies may be unable to respond quickly to new competitive challenges and may not be able to attain the high growth rate of successful smaller companies.
|
|
●
|
The MSCI EAFE Index is subject to risks associated with foreign securities, including emerging markets. International investing involves special risks not found in domestic investing, including political and social differences and currency fluctuations due to economic decisions. Foreign markets can be more volatile than U.S. markets, and emerging markets can be riskier than investing in well-established foreign markets. The risks associated with investing on a worldwide basis include differences in the regulation of financial data and reporting, currency exchange differences, as well as economic and political systems differences. The Index is also subject to risks associated with large-capitalization companies (as described above) and mid-capitalization companies. Generally, the securities of mid-capitalization companies can be more volatile and riskier than the securities of large-capitalization companies.
|
|
●
|
The Invesco QQQ ETF is subject to risks associated with large-capitalization companies and foreign securities (each as described above). In addition, to the extent that the Index is comprised of securities issued by companies in a particular sector, those securities may not perform as well as the securities of companies in other sectors or the market as a whole.
|
|
●
|
The AB 500 Index is subject to risks associated with large-capitalization U.S. companies and foreign securities, including emerging markets (each as described above).
|
|
●
|
The Dimensional International Equity Focus Index is subject to risks associated with foreign securities, including emerging markets (as described above).
|
|
●
|
The iShares Russell 2000 ETF is subject to risks associated with small-capitalization companies. Generally, the securities of small-capitalization companies are more volatile and riskier than the securities of large-capitalization companies.
|
When you allocate to an Index Strategy that is linked to the performance of an ETF you are not investing in the ETF. Index-based ETFs seek to track the investment results of a specific market index. Due to a variety of factors, including the fees and expenses associated with an ETF, an ETF’s performance may not fully replicate or may, in certain circumstances, diverge significantly from the performance of the underlying index. This potential divergence between the ETF and the specific market index is known as tracking error. Although we believe that we will be viewed as the owner of the Index Strategy for tax purposes, there is no legal guidance to indicate how the IRS might view access to an ETF linked Index Strategy coupled with frequent transfers among investment options.
Index performance is on a “price return” basis, not a “total return” basis, and therefore does not reflect dividends paid on the securities composing the Index. Also, if the Index is an ETF, the ETF deducts fees and costs that reduce Index performance. These factors will reduce the Index Return and may cause the Index to underperform a direct investment in the securities composing the Index.
When you allocate to an Index Strategy that is linked to the performance of one of the Indices, you will not have voting rights or rights to receive dividends or other distributions that direct holders of the securities comprising the Indices have.
Early Withdrawal Risk: The Annuity is not a short-term investment vehicle and is not an appropriate investment for an investor who needs ready access to cash. The Annuity is designed to provide benefits on a long-term basis Because of the long-term nature of the Annuity, you should consider whether the Annuity is consistent with your financial situation and objectives. In extreme circumstances, the maximum potential loss resulting from a negative Interim Value adjustment is 100% of the amount invested in an Index Strategy.
Withdrawals under the Annuity, including partial withdrawals and a full surrender, may be subject to significant risk. Withdrawals during the first six Annuity Years may result in surrender charges. Surrender charges do not apply to withdrawals of the Free Withdrawal Amount or RMD withdrawals. However, even when surrender charges do not apply, withdrawals may be subject to negative Interim Value adjustments and negative tax consequences.
An Interim Value adjustment will apply to any withdrawal that occurs during an Index Strategy Term other than on the Index Strategy Start Date or Index Strategy End Date. Similarly, an Interim Value adjustment will apply to a death benefit payment, transfer, or Annuitization during an Index Strategy Term other than on the Index Strategy Start Date or Index Strategy End Date. A negative Interim Value adjustment will result in loss, which could be significant. See “Interim Value Risk” below. In extreme circumstances, you could lose up to 100% of your investment in an Index Strategy due to a negative Interim Value adjustment.
If a portion of Account Value allocated to an Index Strategy is withdrawn or otherwise removed prior to the Index Strategy End Date, there will be an immediate reduction to your Index Strategy Base. The reduction will be in a proportion equal to the reduction in your Interim Value. The proportional reduction could be larger than the dollar amount withdrawn or otherwise removed from the Index Strategy. Reductions to your Index Strategy Base will negatively impact your Interim Values for the remainder of the Index Strategy Term and will result in a lower positive Index Credit (if any) on the Index Strategy End Date.
Withdrawals may significantly reduce the Death Benefit, perhaps by more than the amount withdrawn. If you set up scheduled withdrawals, your exposure to these risks will repeat as long as the scheduled withdrawals continue.
Cyber Security and Business Continuity Risk: With the increasing use of technology and computer systems in general and, in particular, the Internet to conduct necessary business functions, the Company is susceptible to operational, information security and related risks. These risks, which are often collectively referred to as “cyber security” risks, may include deliberate or malicious attacks, as well as unintentional events and occurrences. These risks are heightened by our offering of increasingly complex products, such as those that feature automatic asset transfer or reallocation strategies, and by our employment
of complex investment, trading and hedging programs. Cyber security is generally defined as the technology, operations and related protocol surrounding and protecting a user’s computer hardware, network, systems and applications and the data transmitted and stored therewith. These measures ensure the reliability of a user’s systems, as well as the security, availability, integrity, and confidentiality of data assets.
of complex investment, trading and hedging programs. Cyber security is generally defined as the technology, operations and related protocol surrounding and protecting a user’s computer hardware, network, systems and applications and the data transmitted and stored therewith. These measures ensure the reliability of a user’s systems, as well as the security, availability, integrity, and confidentiality of data assets.
Deliberate cyber attacks can include, but are not limited to, gaining unauthorized access (including physical break-ins) to computer systems in order to misappropriate and/or disclose sensitive or confidential information; deleting, corrupting or modifying data; and causing operational disruptions. Cyber attacks may also be carried out in a manner that does not require gaining unauthorized access, such as causing
denial-of-service attacks on websites (in order to prevent access to computer networks). In addition to deliberate breaches engineered by external actors, cyber security risks can also result from the conduct of malicious, exploited or careless insiders, whose actions may result in the destruction, release or disclosure of confidential or proprietary information stored on an organization’s systems.
denial-of-service attacks on websites (in order to prevent access to computer networks). In addition to deliberate breaches engineered by external actors, cyber security risks can also result from the conduct of malicious, exploited or careless insiders, whose actions may result in the destruction, release or disclosure of confidential or proprietary information stored on an organization’s systems.
The Company is also subject to risks related to disasters and other events, such as storms, earthquakes, fires, outbreaks of infectious diseases (such as COVID-19), utility failures, terrorist acts, political and social developments, and military and governmental actions. These risks are often collectively referred to as “business continuity” risks. These events could adversely affect the Company and our ability to conduct business and process transactions. Although the Company has business continuity plans, it is possible that the plans may not operate as intended or required and that the Company may not be able to provide required services, process transactions, deliver documents or calculate values. It is also possible that service levels may decline as a result of such events.
Cyber security events, disasters and similar events, whether deliberate or unintentional, that could impact the Company and Contract owners could arise not only in connection with our own administration of the Annuity, but also with entities operating the Annuity’s Portfolios and with third-party service providers. Cyber security and other events affecting any of the entities involved with the offering and administration of the Annuity may cause significant disruptions in the business operations related to the Annuity. Potential impacts may include, but are not limited to, potential financial losses under the Annuity, your inability to conduct transactions under the Annuity and/or with respect to a Portfolio, an inability to calculate unit values with respect to the Annuity and/or the net asset value (“NAV”) with respect to a Portfolio, and disclosures of your personal or confidential account information.
In addition to direct impacts to you, cyber security and other events described above may result in adverse impacts to the Company, including regulatory inquiries, regulatory proceedings, regulatory and/or legal and litigation costs, and reputational damage. Costs incurred by the Company may include reimbursement and other expenses, including the costs of litigation and litigation settlements and additional compliance costs. Considerable expenses also may be incurred by the Company in enhancing and upgrading computer systems and systems security following a cyber security failure or responding to a disaster or similar event. The rapid proliferation of technologies, as well as the increased sophistication and activities of organized crime, hackers, terrorists, and others continue to pose new and significant cyber security threats. In addition, the global spread of COVID-19 has caused the Company and its service providers to implement business continuity plans, including
widespread use of work-from-home arrangements. Although the Company, our service providers, and the Portfolios offered under the Annuity may have established business continuity plans and risk management systems to mitigate risks, there can be no guarantee or assurance that such plans or systems will be effective, or that all risks that exist, or may develop in the future, have been completely anticipated and identified or can be protected against. Furthermore, the Company cannot control or assure the efficacy of the cyber security and business continuity plans and systems implemented by third-party service providers, the Portfolios, and the issuers in which the Portfolios invest.
widespread use of work-from-home arrangements. Although the Company, our service providers, and the Portfolios offered under the Annuity may have established business continuity plans and risk management systems to mitigate risks, there can be no guarantee or assurance that such plans or systems will be effective, or that all risks that exist, or may develop in the future, have been completely anticipated and identified or can be protected against. Furthermore, the Company cannot control or assure the efficacy of the cyber security and business continuity plans and systems implemented by third-party service providers, the Portfolios, and the issuers in which the Portfolios invest.
The military invasion of Ukraine initiated by Russia in February 2022 and the resulting response by the United States and other countries have led to economic disruptions, as well as increased volatility and uncertainty in the financial markets. It is not possible to predict the ultimate duration and scope of the conflict, or the future impact on U.S. and global economies and financial markets. The performance of the Index(es) may be adversely affected.
Artificial Intelligence Risk: In addition to the cyber security risks described above, the development, adoption and use of AI, including generative artificial intelligence (“Generative AI”), by us and by third parties on whom we rely may increase existing operational risks or create new operational risks that we are not currently anticipating. AI technologies offer potential benefits in areas such as customer service personalization and process automation, and we expect to use AI and Generative AI to help deliver products and services and support critical functions. We also expect third parties on whom we rely to do the same. There are significant risks involved in developing and deploying AI, and there can be no assurance that its use will enhance our products or services or be beneficial to our business, including our efficiency or profitability. The risk that AI and Generative AI may be misused is increased by the relative newness of the technology, the speed at which it is being adopted, and the lack of laws, regulations or standards governing its use. Such misuse could expose the Company to legal or regulatory risk, damage customer relationships or cause reputational harm. Further, our ability to continue to develop and efficiently deploy AI technologies depends on access to specific third-party equipment and other physical infrastructure, such as processing hardware and network capacity, the availability and pricing of which is difficult to control, especially in a highly competitive environment. Our competitors may also adopt AI or Generative AI more quickly or more effectively than we do, which could cause competitive harm. Because the Generative AI technology is so new, some of the potential risks of Generative AI are currently unknowable.
Interim Value Risk: To determine the Interim Value, we apply a formula which does not reflect the actual performance of the applicable Index, but rather a determination of the value of hypothetical underlying investments at the time of the Interim Value calculation. This amount could be more or less than if you had held the Index Strategy for the full Index Strategy Term. It also means that you could have a negative performance, even if the value of the Index
has increased at the time of the calculation. All withdrawals from an Index Strategy, including death benefit payments, transfers, annuitization, and surrenders paid before the Index Strategy End Date will be based on the Interim Value. Withdrawals and partial transfers before an Index Strategy End Date could have adverse impacts even if the value of the Index has increased at the time of the calculation because an early withdrawal will not allow you to participate in the Index Return for the Index Strategy Term with your entire Index Strategy Base. If you withdraw or transfer a portion out of an Index Strategy, the withdrawal or transfer will cause an immediate reduction to your Index Strategy Base in a proportion equal to the reduction in your Interim Value. A proportional reduction may be larger than the dollar amount of your withdrawal or transfer even if the value of the Index has increased. See “Withdrawal Risk” above for additional information.
Risks Associated with a Performance Lock: If a Performance Lock is executed:
|
●
|
You will no longer participate in Index Strategy performance, positive or negative, for the remainder of the existing Index Strategy Term for the “locked” Index Strategy.
|
|
●
|
You will not receive Index Credit on any “locked” Index Strategy on the Index Strategy End Date. As a result, you may receive less than the full Index Credit, or less than the full protection of the Buffer, than you would have received if you waited for us to apply the Index Credit on the Index Strategy End Date.
|
|
●
|
We use the Performance Lock Value calculated at the end of the current Valuation Day on the Performance Lock Date to execute your Performance Lock. This means you will not be able to determine in advance your Performance Lock Value, and it may be higher or lower than it was at the point in time you requested a manual Performance Lock, or that your Index Strategy reached its target for an automatic Performance Lock.
|
|
●
|
If a Performance Lock is executed when your Performance Lock Value has declined, you will lock in any loss. It is possible that you would have realized less of a loss or no loss if the Performance Lock occurred at a later time, or if the Index Strategy was not “locked.”
|
|
●
|
We will not provide advice or notify you regarding whether you should exercise a Performance Lock or the optimal time for doing so. We will not warn you if you exercise a Performance Lock at a sub-optimal time. We are not responsible for any losses related to your decision whether or not to exercise a Performance Lock.
|
Transfer Risk: The Annuity imposes significant limitations on the transfer of Account Value among investment options. Account Value may be transferred to an Index Strategy, or among Index Strategies, only on an Index Strategy End Date. Account Value in the Variable Option may be transferred to an Index Strategy only on an Index Anniversary Date. These limitations restrict your ability to reallocate Account Value in reaction to changes in market conditions.
Account Value in the Variable Option may be transferred to an Index Strategy only on an Index Anniversary Date. You may have to wait up to one year before you have an opportunity to transfer Account Value from the Variable Option to the Index Strategies. If you fail to request a transfer from the Variable Options on an Index Anniversary Date, the next transfer opportunity will be in one year on the next Index Anniversary Date.
During the Savings Stage, the Annuity permits transfers of Account Value from an Index Strategy to the Variable Options prior to the Index Strategy End Date. Any such transfer will be based on the Interim Value of the Index Strategy (an “Interim Value Transfer”) and will therefore be subject to an Interim Value adjustment. If you perform an Interim Value Transfer, and the Interim Value adjustment is negative, you will experience a loss, which could be significant. The Index Strategy’s Buffer, Cap Rate, Spread, Participation Rate(s), or Step Rate, as applicable, will not apply. There will be no Index Credit applied to amounts removed from an Index Strategy prior to the Index Strategy End Date. At the time you request an Interim Value Transfer, you will not know the applicable Interim Value because Interim Value is calculated at the end of a Valuation Day. The Interim Value applicable to the Interim Value Transfer could be lower than you anticipated. During the Income Stage, Interim Value Transfers are not permitted. Account Value in an Index Strategy may be transferred to the Variable Options only on an Index Strategy End Date.
Availability of Index Strategies will vary over time
Before allocating to an Index Strategy, you should determine the Index Strategies, Buffers, Cap Rates, Spreads, Participation Rates and Step Rates available to you. We reserve the right to change the Indices, Buffers, and limits on Index Gains at any time for new Strategy Terms, subject to applicable guarantees. We reserve the right to add or remove Index Strategies. There is no guarantee that an Index Strategy will be available in the future. You should make sure the Index Strategies you select are appropriate for your investment goals. During the Income Stage, we will limit the Index Strategy allocation options available.
Reallocation of Index Strategies
At the end of an Index Strategy Term for an Index Strategy, the amount allocated to that Index Strategy will be reallocated based upon your instructions we received in Good Order, or if none has been received in Good Order, automatically renew into the same Index Strategy unless the Index Strategy End Date would be after the Maximum Annuity Date. During the Saving Stage, if the same Index Strategy is no longer available, the amount will be transferred into the Holding Account, and the amount may be transferred into another Index Strategy on the next Index Anniversary Date. During the Income Stage, if the current Index Strategy is no longer available and we have no additional instructions, we will automatically transfer these amounts into the Index Strategy with, in order of priority, the shortest Strategy Term, the highest Buffer, and the lowest Cap Rate. You must provide instructions for reallocation by the Index Anniversary Date.
Substitution of an Index
We have the right to substitute a comparable index prior to the Index Strategy End Date if any Index is discontinued or if the calculation of an Index is substantially changed (such as a material change in the formula or method of calculating the Index). We would attempt to choose a substitute index that has a similar investment objective and risk profile to the replaced index and would notify you of any such substitutions. Upon substitution of an Index, we will calculate your Index Return on the replaced Index up until the date of substitution and the substitute Index from the date of substitution to the Index Strategy End Date. An Index substitution will not change your Index Strategy. The performance of the new Index may not be as good as the one that it substituted and as a result your Index Return may have been better if there had been no substitution. When we notify you of any substitution of an Index, we will also inform you of the potential impacts to your Index Credit. *Enhanced Cap Rate Index Strategies are only available on annuities with an Application Sign Date on or after July 1, 2024.
Risks of Investing in Variable Options: You take all the investment risk for amounts allocated to the Variable Options, which invest in the Portfolios. If the Variable Options increase in value, then your Account Value goes up; if it decreases in value, your Account Value goes down. How much your Account Value goes up or down depends on the performance of the Portfolios. We do not guarantee the investment results of any Portfolio. An investment in the Annuity is subject to the risk of poor investment performance, and the value of your investment can vary depending on the performance of the Portfolios, which has its own unique risks. We reserve the right to remove or substitute the Portfolios and close the Variable Options to new investment. The Variable Options are not available during the Income Stage.
Insurance Company Risk: No company other than us has any legal responsibility to pay amounts that we owe under the Annuity. You should look to our financial strength for our claims-paying ability. Amounts allocated to the Index Strategies are held in a non-registered, non-insulated Index Strategies Separate Account. These assets are subject to the claims of our creditors and the benefits provided under the Index Strategies are subject to our claims paying ability. The Company is also subject to risks related to disasters and other events, such as storms, earthquakes, fires, outbreaks of infectious diseases (such as COVID-19), utility failures, terrorist acts, political and social developments, and military and governmental actions. These risks are often collectively referred to as “business continuity” risks. These events could adversely affect the Company and our ability to conduct business and process transactions. Although the Company has business continuity plans, it is possible that the plans may not operate as intended or required and that the Company may not be able to provide required services, process transactions, deliver documents or calculate values. It is also possible that service levels may decline
as a result of such events.
as a result of such events.
Possible Adverse Tax Consequences: The tax considerations associated with the Annuity vary and can be complicated. The tax considerations discussed in this prospectus are general in nature and describe only federal income tax law (not state, local, foreign or other federal tax laws). Before making a Purchase Payment or taking other action related to your Annuity, you should consult with a qualified tax advisor for complete information and advice. For example, distributions from your Annuity are generally subject to ordinary income taxation on the amount of any investment gain unless the distribution qualifies as a non-taxable exchange or transfer. In addition, if you take a distribution prior to the taxpayer’s age 59½, you may be subject to a 10% additional tax in addition to ordinary income taxes on any gain.
Index Strategies Separate Account
Assets supporting the Index Strategies are held in a non-insulated, non-registered, and non-unitized Index Strategies Separate Account established under Arizona law. These assets are subject to the claims of our creditors and the benefits provided under the Index Strategies are subject to our claims paying ability.
An Owner does not have any interest in or claim on the assets in the Index Strategies Separate Account. In addition, neither an Owner nor amounts allocated to the Index Strategies participate in the performance of the assets held in the Index Strategies Separate Account.
We are not obligated to invest according to specific guidelines or strategies except as may be required by Arizona and other state insurance laws. The Index Strategies Separate Account is not registered with the SEC under the Investment Company Act.
The General Account: Our general obligations and any guaranteed benefits under the Annuity are supported by our General Account and are subject to our claims paying ability. Assets supporting annuity payments are held in the General Account. Assets in the General Account are not segregated for the exclusive benefit of any particular contract or obligation. General Account assets are also available to our general creditors and for conducting routine business activities, such as the payment of salaries, rent and other ordinary business expenses. The General Account is subject to regulation and supervision by the Arizona Department of Insurance and to the insurance laws and regulations of all jurisdictions where we are authorized to do business.
INVESTMENT OPTIONS
Index-Linked Options
The Contract currently offers multiple Index Strategies. For each Index Strategy, we will credit positive or negative interest (i.e., Index Credit) at the end of the Index Strategy Term to amounts allocated to the Index Strategy based, in part, on the performance of the Index. An investment in an Index Strategy is not an investment in the Index or in any Index fund. You could lose a significant amount of money if the Index declines in value. You could also lose a significant amount of money due to an Interim Value adjustment, if amounts are removed from an Index Strategy prior to the end of the Index Strategy Term.
The Index Credit is the amount you receive on an Index Strategy End Date based on the Index Return and the type of Index Strategy. The Index Credit may be positive or negative, which means you can lose principal and prior earnings. We do not guarantee the Index Credits for the Index Strategies. There is a risk of loss of your investment because the Index Strategy will be credited the negative Index Return in excess of the level of protection you selected through the Buffers.
We currently offer the following Index Strategies: Point-to-Point with Cap, Enhanced Cap Rate, Tiered Participation Rate, Step Rate Plus and Dual Directional. These Index Strategies are explained below. Information regarding the features of each currently offered Index Strategy, including (i) its name, (ii) a brief statement describing the assets that the Index seeks to track, (iii) its Index Strategy Term, (iv) its crediting methodology, (v) its current limit on Index loss, and (vi) its minimum limit on Index gain, is available in “Appendix A".
We can add or remove Index Strategies and change the features of an Index Strategy from one Strategy Term to the next, including the Index and the current limits on Index gains and losses (subject to any applicable guarantees). Not all Index Strategies will be available with all Indices, Buffers, and in all available Index Strategy Terms. As a result of economic market conditions, or utilization of the Index Strategies, we reserve the right to add and remove Index Strategies at any time, subject to regulatory requirements and approvals. Additions or removals would be effective with any newly issued contracts or upon reallocation for any existing contract holders. Removals would not impact existing contract holders currently allocated to an Index Strategy prior to the Index Strategy End Date. You will receive a Reallocation Notice 30 days prior to your Index Anniversary Date. You must provide instructions for reallocation (by any method allowable) by the Index Anniversary Date. The reallocation will be processed on the Index Anniversary Date. You will be able to make reallocation selections via mail, phone, or through online access. For currently available Options please see our website at www.prudential.com/flexguard-rates.
The minimum amount required to allocate to any Index Strategy, upon the Index Effective Date or at the time of renewal into a new Index Strategy is $2,000. In the event that the Account Value allocated to an Index Strategy falls below $2,000 and is not combined with reallocations from other Index Strategies on an Index Anniversary Date to meet the $2,000 minimum, these funds will automatically be renewed into the same Index Strategy. There is no maximum amount that can be allocated to an Index Strategy. If the same Index Strategy is no longer available, the funds associated with the closed Index Strategy will be transferred to the Holding Account, where they may be allocated among the Variable Options or into another Index Strategy on the next Index Anniversary Date.
Index Strategy Term
The Index Strategy Term is the time period allocated to each Index Strategy. The term begins on the Index Strategy Start Date and ends on the Index Strategy End Date. Index Strategy Terms of 1, 3, and 6 years are available and may vary based on the Index Strategy and whether you are in the Savings Stage or the Income Stage of the Benefit. The Index Strategy Start Date begins on the day you allocate funds to any Index Strategy, known as the Index Effective Date. The annual anniversary of this date is the Index Anniversary Date and will not change for the life of your Contract. You may only allocate to an Index Strategy on an Index Anniversary Date.
Before selecting an Index Strategy for investment, you should consider in consultation with your Financial Professional which Strategy Term lengths may be appropriate for you based on your liquidity needs, investment time horizon, and financial goals. Investing in Index Strategies with shorter Strategy Terms will provide more opportunities for Index Credits, transferring Account Value, and withdrawing or otherwise removing amounts without an Interim Value adjustment. However, assuming the same Index and Buffer, Index Strategies with shorter Strategy Terms generally tend to have less potential for Index gains. Conversely, investing in Index Strategies with longer Strategy Terms will provide fewer opportunities for Index Credits, transferring Account Value, and withdrawing or otherwise removing amounts without an Interim Value adjustment; however, assuming the same Index and Buffer, Index Strategies with longer Strategy Terms generally tend to have more potential for Index gains.
Amounts must remain in an Index Strategy until the end of its Index Strategy Term to be credited with Index Credit and to avoid a possible Interim Value adjustment, in addition to potential surrender charges and tax consequences. An Interim Value adjustment will apply upon any withdrawal, death benefit payment, transfer, Annuitization, Benefit charge or surrender that occurs during an Index Strategy Term other than on the Index Strategy Start Date or Index Strategy End Date. An Interim Value adjustment may be positive, negative or equal to zero. A negative Interim Value adjustment will result in loss. See the “Charges and Adjustments” section of this prospectus for additional information.
Index Return
We calculate the Index Return for every Index Strategy on a point-to-point basis. The Index Return will be the percentage change in the Index Value from the Index Strategy Start Date to the Index Strategy End Date. The Index Return is then used to determine the Index Credit for an Index Strategy. The Index Return is calculated by taking the Index Value on the Index Strategy End Date, minus the Index Value on the Index Strategy Start Date, and then dividing the result by the Index Value on the Index Strategy Start Date.
Examples:
| (1) | Negative Index Return Index Value at Index Strategy Start Date: 1569 Index Value on Index Strategy End Date: 1333 Index Return: -15% ((1333-1569)/1569) |
| (2) | Positive Index Return Index Value at Index Strategy Start Date: 1569 Index Value on Index Strategy End Date: 1726 Index Return: 10% ((1726-1569)/1569) |
Because we calculate the Index Return by comparing the value of the Index between two specific points in time, the Index Return may be negative or flat for the Index Strategy Term as a whole (including a multi-year Strategy Term) even if the Index performed positively for certain periods of time during the Index Strategy Term.
Each Index Strategy references an Index that determines the Index Return used to compute the Index Credit. When you allocate to an Index Strategy that is linked to the performance of one of the Indices, you are not investing in the Index. We currently offer Index Strategies based on the following securities indices:
|
S&P 500® Index, Price Return (SPX): The S&P 500® Index is comprised of 500 stocks considered representative of the overall market and is exclusive of dividends. An index is unmanaged and not available for direct investment.
|
|
MSCI EAFE Index, Price Return (MXEA): The MSCI EAFE Index measures the equity market performance of 22 developed market country indices located in Europe, Australasia and the Far East and is exclusive of dividends. An index is unmanaged and not available for direct investment.
|
|
Invesco QQQ ETF, Price Return (QQQ): The Invesco QQQ ETF is an exchange-traded fund that seeks to track the investment results of the NASDAQ-100 Index®. The Index includes the 100 largest non-financial companies listed on the Nasdaq® based on market cap.
|
|
iShares® Russell 2000 ETF, Price Return (IWM): The iShares® Russell 2000 ETF seeks to track the investment results of the Russell® 2000 Index, an index composed of small-capitalization U.S. equities. The Russell® 2000 Index measures the performance of the small capitalization sector of the U.S. equity market, as defined by FTSE Russell.
|
|
AB 500 Plus IndexSM, Price Return (ABUSPLS): The AB 500 Plus IndexSM is a rules based, allocation index that utilizes the SPDR® S&P 500® ETF Trust as its default allocation. The Index will tactically reallocate to additional US listed equity index ETFs: Invesco QQQ TrustSM, SERIES 1 ETF, iShares® Russell 2000 ETF, Shares® MSCI EAFE ETF, and iShares® MSCI Emerging Markets ETF when our proprietary positioning signals indicate that those other equity index ETFs have a higher expected return potential than the default allocation. At all times, the Index is fully allocated to equity index ETFs, with a significant allocation to equity index ETFs that track US listed companies. By following proprietary positioning signals, the Index aims to maintain significant exposure to the SPDR® S&P 500® ETF Trust, while providing differentiated returns through a tactical reallocation process.
|
|
The rules for calculating the AB 500 Plus IndexSM include an annual 0.75% reduction, which accrues daily, meaning that a small portion of that reduction is included in the published Index Value each day. The reduction is included to aid in setting the cap and participation rates and/or buffer levels of the Index Strategy with which the Index is used.
|
When you allocate to an Index Strategy that is linked to the performance of an ETF you are not investing in the ETF. Index-based ETFs seek to track the investment results of a specific market index. Due to a variety of factors, including the fees and expenses associated with an ETF, an ETF’s performance may not fully replicate or may, in certain circumstances, diverge significantly from the performance of the underlying index. This potential divergence between the ETF and the specific market index is known as tracking error. Although we believe that we will be viewed as the owner of the Index Strategy for tax purposes, there is no legal guidance to indicate how the IRS might view access to an ETF linked Index Strategy coupled with frequent transfers among investment options.
Index Returns for Index Strategies linked to an ETF are based on the closing share price of each respective Index. Because Index performance is reflective of an ETF’s closing price, Index performance is on a “price return” basis, not a “total return” basis, and therefore does not reflect dividends paid on the securities in which the ETF invests. In addition, an ETF deducts fees and costs that reduce Index performance. These factors will reduce the Index Return and may cause the ETF to underperform a direct investment in the ETF or the securities in which the ETF invests.
Index Returns for Index Strategies linked to a market index are based on the Index Value published at the close of a Valuation Day. Each such Index is a “price return index,” not a “total return index,” and therefore does not reflect dividends paid on the securities composing the Index. This will reduce the Index return and may cause the Index to underperform a direct investment in the securities composing the Index.
If an Index is discontinued or substantially changes, we reserve the right to select an alternative Index and we will notify you of any such changes. For these purposes, an Index would be substantially changed if an index sponsor announces that it will make a material change in the formula for the Index or the method of calculating the Index or in any other way materially modifies the Index. We would attempt to choose a substitute Index that has a similar investment objective and risk profile to the replaced Index. Upon substitution of an Index, we will calculate your Index Return on the replaced Index up until the date of substitution and the substitute Index from the date of substitution to the Index Strategy End Date. An Index substitution will not change
your Index Strategy. The performance of the new Index may not be as good as the one that it substituted and as a result your Index Return may have been better if there had been no substitution. When we notify you of any substitution of an Index, we will also inform you of the potential impacts to your Index Credit.
Historical Index Performance
The bar charts shown below provide each Index’s annual returns for the last 10 calendar years (or for the life of the Index if less than 10 years), as well as the Index returns after applying a hypothetical 5% cap and a hypothetical -10% buffer. The charts illustrate the variability of the returns from year to year and show how hypothetical limits on Index gains and losses may affect these returns. Past performance is not necessarily an indication of future performance.
The performance below is NOT the performance of any Index Strategy. Your performance under the Annuity will differ, perhaps significantly. The performance below may reflect a different return calculation, time period, and limit on Index gains and losses than the Index Strategies, and does not reflect Annuity fees and charges, including surrender charges or negative Interim Value adjustments, which reduce performance.
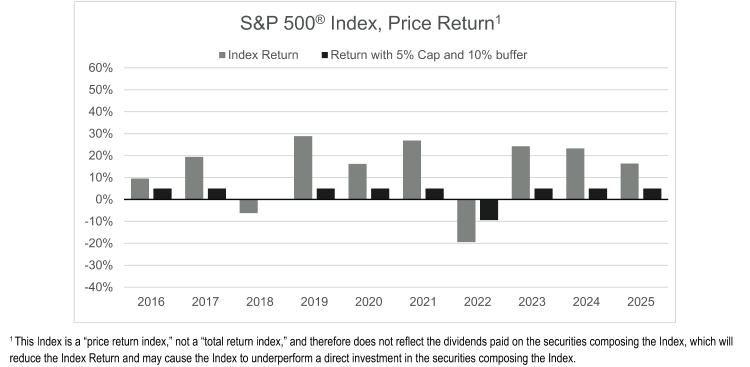
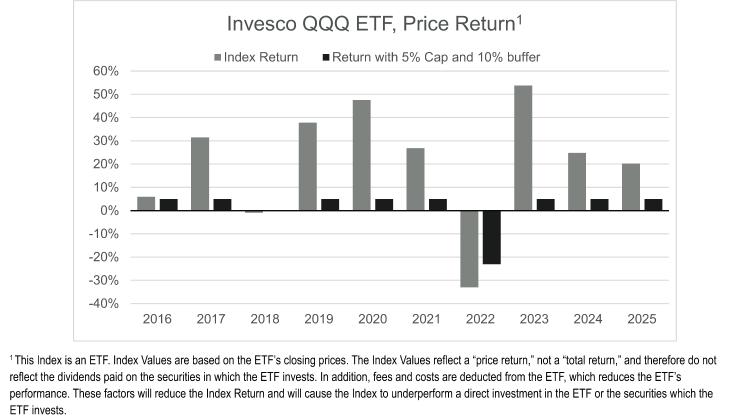
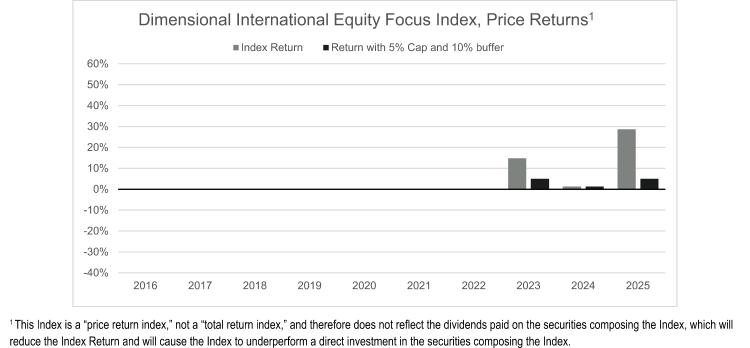
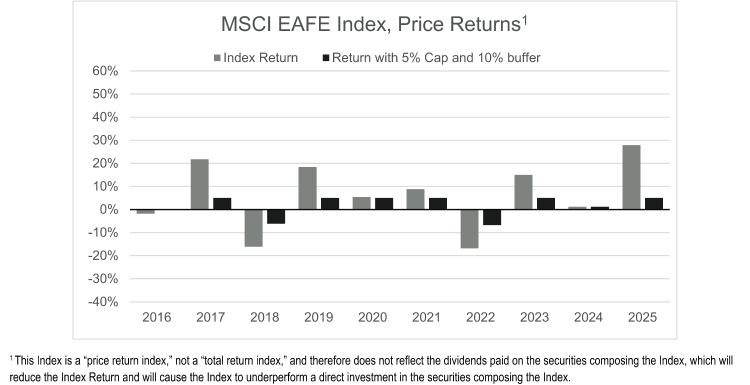
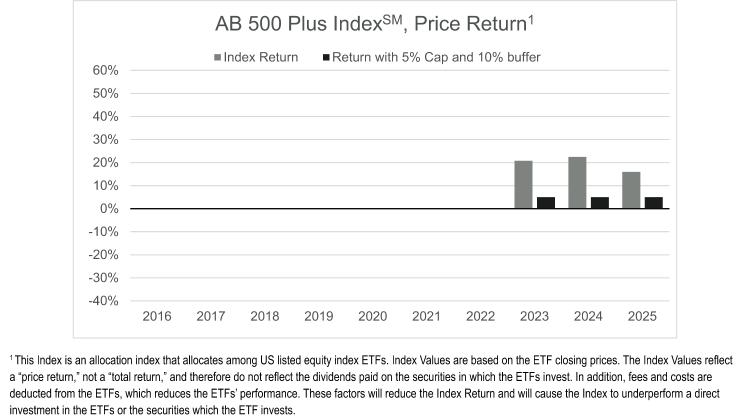
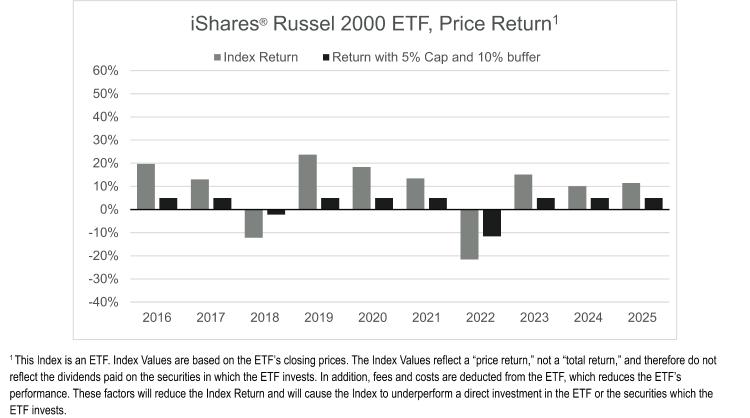
Notes Regarding Examples
The Examples set forth below, as well as other Examples found throughout this prospectus, are intended to illustrate how various features of the Annuity work. These Examples should not be considered a representation of past or future performance of any Index Strategies. Actual performance may be greater or less than those shown in the Examples. Similarly, the Index Returns in the Examples are not an estimate or guarantee of future Index performance. The Caps, Spreads, Participation Rates, Step Rates, and Buffers for the Index Strategies shown in the following Examples are for illustrative purposes only and may not reflect actual declared rates. In addition, values may be rounded for display purposes only.
Limits on Index Losses: Buffers
The Buffer limits the amount of negative Index Return used in calculating the Index Credit that may be applied to an Index Strategy at the end of an Index Strategy Term. If the Index Return is negative, but less than or equal to the Buffer, the Index Credit is zero. Otherwise, the Index Credit is equal to the negative Index Return in excess of the Buffer. Negative Index Returns in excess of the Buffer will result in loss, which may be significant.
The Buffer is the amount of the protected negative return. Any negative Index Credits in excess of the Buffer reduces the Account Value allocated to the Index Strategy.
For example, if the Index Return is -25% and the Buffer is 10%, we will apply a -15% Index Credit (the amount of negative Index Return that exceeds the Buffer) at the end of the Index Strategy Term, meaning you will experience a 15% loss. If the Index Return is -5%, we will apply a 0% Index Credit, meaning you would experience no loss due to negative Index performance. Please see below for more detailed examples.
A 100% Buffer will provide complete protection from Index losses. For example, if the Index Change is -25% and the Buffer is 100%, we will apply a 0% Index Credit (i.e., no loss) at the end of the Index Strategy Term. However, like any Index Strategy, there may be losses due to surrender charges, negative Interim Value adjustments, and/or taxes and tax penalties.
We will declare Buffers that will be available on the Index Strategy Start Date for each Index Strategy. We set the Buffers at our sole discretion. We consider various factors in declaring Buffers, including our hedging costs and techniques, administrative expenses, regulatory and tax requirements, market conditions, and competitive factors.
The Annuity offers Index Strategies with 5%, 10%, 15%, 20%, 30% and 100% Buffers. The Buffer for an Index Strategy will not change during an Index Strategy Term.
The Company does not guarantee that the Annuity will always offer Index Strategies that limit Index losses, which would mean risk of loss of the entire amount invested.
Before selecting an Index Strategy for investment, you should consider in consultation with your Financial Professional which Buffer may be appropriate for you. You and your Financial Professional may want to discuss and consider your risk tolerance, investment time horizon, and financial goals. In general, assuming the same Index and Index Strategy Term length, an Index Strategy that provides more protection from Index losses will generally tend to have less potential for Index gains. Conversely, assuming the same Index and Index Strategy Term length, an Index Strategy that provides less protection from Index losses will generally tend have more potential for Index gains.
Examples
The following examples illustrate how we calculate and credit Index Credit, assuming hypothetical negative Index Returns and a hypothetical Buffer. The examples assume no withdrawals.
Index Strategy = 1-Year Point-to-Point with Cap and a 10% Buffer
Index Strategy Base at Index Strategy Start Date = $102,000
Index Strategy Base at Index Strategy End Date before Index Credit = $100,000*
*Assumes a reduction in the Index Strategy Base of $2,000 since the Index Strategy Start Date due to the impact of Interim Value adjustments. Reductions to your Index Strategy Base could be higher or lower than assumed in this example and will depend on factors such as your Index Strategy Base and the corresponding Interim Value adjustments.
| (1) | Negative Index Return in excess of the Buffer Index Return = -15% Index Credit = -5% Index Strategy Base upon Index Strategy End Date after Index Credit = $95,000 ($100,000 - $5,000) |
| Because the Buffer protects the first 10% of the loss, the Index Strategy only experiences a 5% loss (-15% Index Return + 10% Buffer = -5% Loss) or $100,000*-5.00% = -$5,000. The Account Value in the Index Strategy after the Index Credit would be $95,000. |
| (2) | Negative Index Return within the Buffer Index Return = -5% Index Credit = 0% Index Strategy Base upon Index Strategy End Date after Index Credit = $100,000 ($100,000 - $0) |
| Because the Buffer protects against the first 10% of the loss, the Index Strategy experiences no loss of Account Value due to negative Index performance because the negative Index Return was less than the 10% Buffer. The Account Value in the Index Strategy after the Index Credit would be $100,000. |
Limits on Index Gains
An Index Strategy may limit the positive Index Return used in calculating Index Credit that may be applied to an Index Strategy at the end of an Index Strategy Term. The calculation of Index Credit for positive Index Returns differs for Point-to-Point with Cap Index Strategies, Enhanced Cap Rate Index Strategies, Step Rate Plus Index Strategies, Tiered Participation Rate Strategies and Dual Directional Index Strategies, as described further below.
For the Index Strategies that are available for investment, the Cap Rates, Spreads, Step Rates, Participation Rates, and Tier Levels, as applicable, that we are currently offering for new Strategy Terms are available at the following website address: www.prudential.com/flexguard-rates. The Cap Rates, Spreads, Step Rates, Participation Rates, and Tier Levels posted on that website address are incorporated by reference into this prospectus.
Before selecting an Index Strategy for investment, you should consider in consultation with your Financial Professional whether an Index Strategy’s limit on Index gains may be appropriate for you. You and your Financial Professional may want to discuss and consider your risk tolerance, investment time horizon, and financial goals. In general, assuming the same Index and Index Strategy Term length, an Index Strategy that provides less potential for Index gains will tend to have more protection from Index losses. Conversely, assuming the same Index and Index Strategy Term length, an Index Strategy that provides more potential for Index gains will generally tend to have less protection from Index losses.
Point-To-Point With Cap Index Strategy
For a Point-to-Point with Cap Index Strategy, the Cap Rate may limit the positive Index Return used in calculating the Index Credit that may be applied at the end of an Index Strategy Term. The Cap Rate is the maximum rate that may be credited to an Index Strategy for any given Index Strategy Term. If the Index Return is positive and equal to or greater than the Cap Rate, then the Index Credit is equal to the Cap Rate. If the Index Return is positive, but less than the Cap Rate, the Index Credit is equal to the Index Return.
For example, assume a Cap Rate of 8%. If the Index Return is 10% (which is greater than the Cap Rate), we will apply an 8% Index Credit at the end of the Index Strategy Term, meaning you will experience an 8% gain. If the Index Return is 5% (which is less than the Cap Rate), we will apply a 5% Index Credit at the end of the Index Strategy Term, meaning you will experience a 5% gain. Please see below for more detailed examples.
If the Index Return is negative, but less than or equal to the Buffer, the Index Credit is zero. Otherwise, the Index Credit is equal to the negative Index Return in excess of the Buffer.
If the Index Return is negative, but less than or equal to the Buffer, the Index Credit is zero. Otherwise, the Index Credit is equal to the negative Index Return in excess of the Buffer.
The Point-to-Point with Cap Index Strategy is available in 1, 3, and 6-year Terms.
The Point-to-Point Index Strategy with a 100% Buffer is not available in the State of Oregon. See "Appendix C".
A different Cap Rate may be declared for different Indices, Buffers and Index Strategy Terms. We set the Cap Rates at our sole discretion, subject to the Guaranteed Minimum Cap Rate. We consider various factors in declaring Caps, including our hedging costs and techniques, administrative expenses, regulatory and tax requirements, market conditions, and competitive factors.
For Index Strategies with Cap Rate, the Guaranteed Minimum Cap Rate equals 1% for a one-year Index Strategy Term, 5% for a three-year Index Strategy Term and 10% for a six-year Index Strategy Term.
The initial Cap Rate applies to the initial Index Strategy Term. We will declare a Cap Rate for each subsequent Index Strategy Term. In some cases, we may declare a Cap Rate for an Index Strategy as “uncapped” in which case the maximum Index Credit you may receive is equal to the Index Return, subject to the Buffer.
Subsequent Cap Rates may be higher or lower than the initial Cap Rate but will never be less than the Guaranteed Minimum Cap Rate. Subsequent Cap Rates may differ from the Cap Rates used for new contracts or for other contracts issued at different times. We will determine new Cap Rates on a basis that does not discriminate unfairly within any class of contracts. The Cap Rate will not change during an Index Strategy Term.
Examples
The following examples illustrate how we calculate and credit Index Credit, assuming hypothetical Index Returns and a hypothetical Cap and Buffer. The examples assume no withdrawals.
Index Strategy = 1-Year Point-to-Point with Cap and a 10% Buffer
Cap = 12%
Index Strategy Base at Index Strategy Start Date = $102,000
Index Strategy Base at Index Strategy End Date before Index Credit = $100,000*
*Assumes a reduction in the Index Strategy Base of $2,000 since the Index Strategy Start Date due to the impact of Interim Value adjustments. Reductions to your Index Strategy Base could be higher or lower than assumed in this example and will depend on factors such as your Index Strategy Base and the corresponding Interim Value adjustments.
|
●
|
Upside potential equals 100% of the Index Return up to a Cap of 12%
|
|
○
|
Example 1: if the Index increased by 4%, an amount that is less than the Cap, the Index Credit would be 4%. The Account Value in the Index Strategy after the Index Credit would be $104,000.
|
|
○
|
Example 2: if the Index increased by 20%, which is greater than the Cap, the Index Credit would be 12%, which is equal to the Cap Rate. The Account Value in the Index Strategy after the Index Credit would be $112,000.
|
|
●
|
Partial downside protection is provided through the Buffer where Index losses within the Buffer are protected. Index losses that exceed the Buffer will result in a loss of Account Value.
|
|
○
|
Example 1: if the Index decreased by 4%, an amount within the Buffer, the Index Credit would be 0%, with no loss of Account Value. The Account Value in the Index Strategy after the Index Credit would be $100,000.
|
|
○
|
Example 2: if the Index decreased by 12%, which is greater than the 10% Buffer, there would be a loss of Account Value because the Index Credit would be -2%. The Account Value in the Index Strategy after the Index Credit would be $98,000.
|
Enhanced Cap Rate Index Strategy (Available for Annuities with an Application Sign Date on or after July 1, 2024)
For an Enhanced Cap Rate Index Strategy, the Cap Rate and Spread may limit any positive Index Return used in calculating the Index Credit that may be applied at the end of an Index Strategy Term. Deducting a Spread allows for higher Cap Rates than the Point-to-Point with Cap Index Strategy. A higher Cap Rate does not guarantee you will receive a higher Index Credit, because interest crediting for the Enhanced Cap Rate Index Strategy depends on the applicable Cap Rate, Spread and Index Return. There is no guarantee that the Enhanced Cap Rate Index Strategy will outperform any other available Index Strategy and may under perform available Index Strategies due to the application of the Spread.
If the Index Return is positive and greater than or equal to the Cap Rate plus the Spread, the Index Credit is equal to the Cap Rate. If the Index Return is positive and greater than the Spread, but less than the Cap Rate plus the Spread, the Index Credit is equal to the Index Return minus the Spread. If the Index Return is greater than or equal to zero, and less than or equal to the Spread, the Index Credit is zero.
For example, assume the Spread is 2% and the Cap Rate is 15%. If the Index Return is 18% (which is greater than the Cap Rate plus the Spread), we will apply a 15% Index Credit at the end of the Index Strategy Term, meaning you will experience a 15% gain. If the Index Return is instead 10% (which is less than the Cap Rate plus the Spread), we will deduct the Spread from the Index Return. We will apply an 8% Index Credit at the end of the Index Strategy Term, meaning you will experience an 8% gain. If the Index Return is instead 1% (which is greater than zero but less than the Spread), the Index Credit would be 0%, meaning that you would not experience a gain or a loss.
The Spread does not apply when Index Return is zero or negative. If the Index Return is negative, but less than or equal to the Buffer, the Index Credit is zero. Otherwise, the Index Credit is equal to the negative Index Return in excess of the Buffer.
The Enhanced Cap Rate Index Strategy is available in the 1-year Term.
A different Cap Rate and Spread may be declared for different Indices, Buffers, and Index Strategy Terms. Multiple Spread options with different Cap Rates may be offered with the same level of Buffer. For example, both the 2% (Spread A) and 3% (Spread B) options are available with a 10% Buffer. We set the Cap Rates and Spreads at our sole discretion, subject to the Guaranteed Minimum Cap Rate and Guaranteed Maximum Spread. We consider various factors in declaring Cap Rates and Spreads, including our hedging costs and techniques, administrative expenses, regulatory and tax requirements, market conditions, and competitive factors.
For Enhanced Cap Rate Index Strategies, the Guaranteed Minimum Cap Rate equals 1% and the Guaranteed Maximum Spread equals 3% for a one-year Index Strategy Term.
The initial Cap Rate and Spread applies to the initial Index Strategy Term. We will declare a Cap Rate and Spread for each subsequent Index Strategy Term. In some cases, we may declare a Cap Rate for an Index Strategy as “uncapped” in which case the maximum Index Credit you may receive is equal to the Index Return minus the Spread.
Subsequent Cap Rates and/or Spreads may be higher or lower than the initial Cap Rate and/or Spread but will never be less than the Guaranteed Minimum Cap Rate or greater than the Guaranteed Maximum Spread. Subsequent Cap Rates and/or Spreads may differ from the Cap Rates and/or Spreads used for new contracts or for other contracts issued at different times. We will determine new Cap Rates and Spreads on a basis that does not discriminate unfairly within any class of contracts. The Guaranteed Minimum Cap Rate may vary by Index Strategy Term.
We will not offer the Enhanced Cap Rate Strategy where the Spread exceeds the Cap Rate.
Examples
The following examples illustrate how we calculate and credit Index Credit, assuming hypothetical Index Returns and a hypothetical Cap, Spread and Buffer. The examples assume no withdrawals.
Index Strategy = 1-year Enhanced Cap Rate Index Strategy and a 10% Buffer
Cap = 17%
Spread 2%
Index Strategy Base at Index Strategy Start Date = $102,000
Index Strategy Base at Index Strategy End Date before Index Credit = $100,000*
*Assumes a reduction in the Index Strategy Base of $2,000 since the Index Strategy Start Date due to the impact of Interim Value adjustments. Reductions to your Index Strategy Base could be higher or lower than assumed in this example and will depend on factors such as your Index Strategy Base and the corresponding Interim Value adjustments.
|
●
|
Upside potential equals 100% of the Index Return minus 2% Spread up to a Cap of 17%
|
|
○
|
Example 1: if the Index increased by 20%, which is greater than the Cap plus Spread, the Index Credit would be 17%, which is equal to the Cap Rate. The Account Value in the Index Strategy after the Index Credit would be $117,000.
|
|
○
|
Example 2: if the Index increased by 10%, an amount that is less than the Cap plus Spread, the Index Credit would be the Index Return minus the 2% Spread which is 8%. The Account Value in the Index Strategy after the Index Credit would be $108,000.
|
|
○
|
Example 3: If the Index increased by 1%, an amount that is greater than zero but less than the Spread, the Index Credit would be 0%. The Account Value in the Index Strategy after the Index Credit would be $100,000.
|
|
●
|
Partial downside protection is provided through the Buffer where Index losses within the Buffer are protected. Index losses that exceed the Buffer will result in a loss of Account Value.
|
|
○
|
Example 1: if the Index decreased by 4%, an amount within the Buffer, the Index Credit would be 0%, with no loss of Account Value. The Account Value in the Index Strategy after the Index Credit would be $100,000.
|
|
○
|
Example 2: if the Index decreased by 12%, which is greater than the 10% Buffer, there would be a loss of Account Value because the Index Credit would be -2%. The Account Value in the Index Strategy after the Index Credit would be $98,000.
|
Step Rate Plus Index Strategy
For a Step Rate Plus Index Strategy, the Step Rate and Participation Rate may limit the positive Index Return used in calculating the Index Credit that may be applied at the end of an Index Strategy Term. If the Index Return is between zero (including zero) and the declared Step Rate, then the Index Credit is equal to the Step Rate. If the Index Return is greater than the Step Rate, the Index Credit is equal to the greater of the Index Return multiplied by the Participation Rate or the Step Rate.
For example, assume the Step Rate is 4% and the Participation Rate is 60%. If the Index Return is 5%, we will apply the Step Rate to calculate the Index Credit because the Step Rate (4%) is greater than the Index Return multiplied by the Participation Rate (5% x 60% = 3%). The Index Credit at the end of the Index Strategy Term will be 4%, meaning you will experience a 4% gain. Alternatively, assume the Index Return is 10%. In that case, we will apply the Participation Rate rather than the Step Rate because the Index Return multiplied by the Participation Rate (10% x 60% = 6%) will be greater than the Step Rate (4%). The Index Credit at the end of the Index Strategy Term will be 6%, meaning you will experience a 6% gain. Please see below for more detailed examples.
The Step Rate is the declared rate that will be credited to an Index Strategy for any given Index Strategy Term if the Index Return is between zero (including zero) and the declared Step Rate. When the Index Return is zero or positive, the Step Rate is the minimum amount of Index Credit that would be applied. The Participation Rate used in the Step Rate Plus Index Strategy is the percentage of an Index Return that may be credited if the Index Return exceeds the Step Rate. A Participation Rate only applies when the Index Return is positive and greater than the Step Rate. There is no maximum amount of Index Credit with the Step Rate Plus Index Strategy, but your Index gains may be limited by either the Step Rate or the Participation Rate.
If the Index Return is negative, but less than or equal to the Buffer, the Index Credit is zero. Otherwise, the Index Credit is equal to the negative Index Return in excess of the Buffer. See “Limits on Index Losses: Buffer” above.
Step Rate Plus Index Strategies with 5% Buffers are not available in the State of Pennsylvania. See Appendix C.
A different Step Rate and Participation Rate may be declared for different Indices, Buffers, and Index Strategy Terms. We set the Step Rates and Participation Rates at our sole discretion, subject to the Guaranteed Minimum Step Rate and Guaranteed Minimum Participation Rate. We consider various factors in declaring Step Rates and Participation Rates, including our hedging costs and techniques, administrative expenses, regulatory and tax requirements, market conditions, and competitive factors.
For Step Rate Plus Index Strategies, the Guaranteed Minimum Step Rate equals 1% and the Guaranteed Minimum Participation Rate equals 60%.
The initial Step Rate and Participation Rate applies to the initial Index Strategy Term. We will declare new Step Rate and Participation Rate for each subsequent Index Strategy Term. Subsequent Step Rates and Participation Rates may be higher or lower than the initial Step Rate and Participation Rate but will never be less than the Guaranteed Minimum Step Rate and Guaranteed Minimum Participation Rate. Subsequent Step Rates and Participation Rates may differ from the Step Rates and Participation Rates used for new contracts or for other contracts issued at different times. We will determine new Step Rates and Participation Rates on a basis that does not discriminate unfairly within any class of contracts. The Step Rate and Participation Rate will not change during an Index Strategy Term.
Examples
The following examples illustrate how we calculate and credit Index Credit, assuming hypothetical Index Returns and a hypothetical Step Rate, Participation Rate, and Buffer. The examples assume no withdrawals.
Index Strategy = 1-Year Step Rate Plus with a 5% Buffer
Step Rate = 6%
Participation Rate = 90%
Index Strategy Base at Index Strategy Start Date = $102,000
Index Strategy Base at Index Strategy End Date before Index Credit = $100,000*
*Assumes a reduction in the Index Strategy Base of $2,000 since the Index Strategy Start Date due to the impact of Interim Value adjustments. Reductions to your Index Strategy Base could be higher or lower than assumed in this example and will depend on factors such as your Index Strategy Base and the corresponding Interim Value adjustments.
|
●
|
Upside potential equals the Step Rate if the Index Return is between zero (including zero) and the declared Step Rate. If the Index Return is greater than the Step Rate, the Index Credit is equal to the greater of the Index Return multiplied by the Participation Rate or the Step Rate.
|
|
○
|
Example 1: if the Index increased by 4%, an amount that is less than the Step Rate, the Index Credit would be 6% (the Step Rate). The Account Value in the Index Strategy after the Index Credit would be $106,000.
|
|
○
|
Example 2: if the Index increased by 20%, which is greater than the Step Rate, the Index Credit would be the greater of 90% (the Participation Rate) of 20%, which is 18% or the Step Rate. In this Example, the Index Credit would be 18% as it is the greater value. The Account Value in the Index Strategy after the Index Credit would be $118,000.
|
|
○
|
Example 3: if the Index increased by 6.50%, which is greater than the Step Rate, the Index Credit would be the greater of 90% (the Participation Rate) of 6.50%, which is 5.85% or the Step Rate. In this Example, the Index Credit would be the Step Rate of 6% as it is the greater value. The Account Value in the Index Strategy after the Index Credit would be $106,000.
|
|
●
|
Partial downside is provided through the Buffer where Index losses within the Buffer are protected. Index losses that exceed the Buffer will result in a loss of Account Value.
|
|
○
|
Example 1: if the Index decreased by 4%, an amount within the Buffer, the Index Credit would be 0%, with no loss of Account Value. The Account Value in the Index Strategy after the Index Credit would be $100,000.
|
|
○
|
Example 2: if the Index decreased by 12%, which is greater than the 5% Buffer, there would be a loss of Account Value because the Index Credit would be -7%. The Account Value in the Index Strategy after the Index Credit would be $93,000.
|
Tiered Participation Rate Index Strategy
For a Tiered Participation Rate Index Strategy, the Participation Rates may limit the positive Index Return used in calculating the Index Credit that may be applied at the end of an Index Strategy Term. The Participation Rate is the percentage of an Index Return that may be credited to an Index Strategy for any given Index Strategy Term. We will declare a 1st Tier Participation Rate, 2nd Tier Participation Rate, and a Tier Level at the start of each Index Strategy Term. The 1st Tier Participation Rate is used to calculate the Index Credit associated with any Index Return less than or equal to the declared Tier Level. The 2nd Tier Participation Rate is used to calculate the Index Credit associated with any Index Return greater than the declared Tier Level.
For example, assume the 1st Tier Participation Rate is 100%, the 2nd Tier Participation Rate is 120%, and the Tier Level is 10%. If the Index Return is 10%, we will apply the 1st Tier Participation Rate to the entire Index Return. The 2nd Tier Participation Rate will not apply to any portion of the Index Return because the Index Return is lower than the Tier Level. The Index Credit at the end of the Index Strategy Term will be 10% (10% x 100%), meaning you will experience a 10% gain. Alternatively, assume the Index Return is 15%. In that case, we will apply the 1st Tier Participation Rate to the first 10% of Index Return and the 2nd Tier Participation Rate to the remaining 5% of Index Return. The Index Credit at the end of the Index Strategy Term will be 16% ((10% x 100%) + (5% x 120%)), meaning you will experience a 16% gain. Please see below for more detailed examples.
If the Index Return is between zero and the declared Tier Level, then the Index Credit is equal to the Index Return multiplied by the Participation Rate for the 1st tier. If the Index Return is greater than or equal to the declared Tier Level, the Index Credit is the sum of the Tier Level Index Return multiplied by the Participation Rate for the 1st tier and the remaining Index Return multiplied by the Participation Rate for the 2nd tier. Participation Rates only apply when the Index Return is positive. There is no maximum amount of Index Credit with a Tiered Participation Rate Index Strategy.
If the Index Return is negative, but less than or equal to the Buffer, the Index Credit is zero. Otherwise, the Index Credit is equal to the negative Index Return in excess of the Buffer. See “Limits on Index Losses: Buffer” above.
If the Index Return is negative, but less than or equal to the Buffer, the Index Credit is zero. Otherwise, the Index Credit is equal to the negative Index Return in excess of the Buffer. See “Limits on Index Losses: Buffer” above.
The Tiered Participation Rate Index Strategies with 5% Buffers are not available in the State of Pennsylvania. See Appendix C.
A different Participation Rate and Tier Level may be declared for different Indices, Buffers, and Index Strategy Terms. We set the Participation Rates and Tier Levels at our sole discretion, subject to the Guaranteed Minimum Participation Rate and Guaranteed Maximum Tier Level. We consider various factors in declaring Participation Rates and Tier Levels, including our hedging costs and techniques, administrative expenses, regulatory and tax requirements, market conditions, and competitive factors.
For Tiered Participation Rate Index Strategies, the Guaranteed Minimum Participation Rate equals 100% and the Guaranteed Maximum Tier Level equals 35%.
The initial Participation Rates and Tier Levels apply to the initial Index Strategy Term. We will declare new Participation Rates and Tier Levels for each subsequent Index Strategy Term. Subsequent Participation Rates may be higher or lower than the initial Participation Rates but will never be less than the Guaranteed Minimum Participation Rate. Subsequent Tier Levels may be higher or lower than the initial Tier Level but will never exceed the Guaranteed Maximum Tier Level. Subsequent Participation Rates and Tier Levels may differ from the Participation Rates and Tier Levels used for new contracts or for other contracts issued at different times. We will determine new Participation Rates and Tier Levels on a basis that does not discriminate unfairly within any class of contracts. The Participation Rate and Tier Level will not change during an Index Strategy Term.
Examples
The following examples illustrate how we calculate and credit Index Credit, assuming hypothetical Index Returns and hypothetical Participation Rates, Tier Level, and Buffer. The examples assume no withdrawals.
Index Strategy = 6-Year Point-to-Point with Tiered Participation Rate and a 10% Buffer
1st Tier Participation Rate = 100%
2nd Tier Participation Rate = 140%
Tier Level = 30%
Index Strategy Base at Index Strategy Start Date = $102,000
Index Strategy Base at Index Strategy End Date before Index Credit = $100,000*
*Assumes a reduction in the Index Strategy Base of $2,000 since the Index Strategy Start Date due to the impact of Interim Value adjustments. Reductions to your Index Strategy Base could be higher or lower than assumed in this example and will depend on factors such as your Index Strategy Base and the corresponding Interim Value adjustments.
|
●
|
Upside potential equals the Index Return multiplied by the Participation Rate(s) based on the Tier Level of 30%.
|
|
○
|
Example 1: if the Index increased by 28%, which is less than the Tier Level, the Index Credit would be 100% of the 28% increase, which would be 28%. The Account Value in the Index Strategy after the Index Credit would be $128,000.
|
|
○
|
Example 2: if the Index increased by 68%, which is above the Tier Level, the Index Credit would be 100% of the first 30% increase plus 140% of the remaining 38% increase, which equals 83.2%. The Account Value in the Index Strategy after the Index Credit would be $183,200.
|
|
●
|
Partial downside protection is provided through the Buffer where index losses within the Buffer are protected. Index losses that exceed the Buffer will result in a loss of Account Value.
|
|
○
|
Example 1: if the Index decreased by 4%, an amount within the Buffer, the Index Credit would be 0%, with no loss of Account Value. The Account Value in the Index Strategy after the Index Credit would be $100,000.
|
|
○
|
Example 2: if the Index decreased by 12%, which is greater than the 10% Buffer, there would be a loss of Account Value because the Index Credit would be -2%. The Account Value in the Index Strategy after the Index Credit would be $98,000.
|
Dual Directional Index Strategy
For a Dual Directional Index Strategy, the Cap Rate may limit the positive Index Return used in calculating the Index Credit that may be applied at the end of an Index Strategy Term. The Cap Rate is the maximum rate that may be credited to an Index Strategy for any given Index Strategy Term if the Index Return is positive. The Dual Directional Index Strategy provides an Index Credit equal to the Index Return up to a Cap Rate when the Index Return is positive and an Index Credit equal to the absolute value of the Index Return, not limited by a Cap Rate, when the Index Return is negative and equal to or within the Buffer. The absolute value of the Index Return is the value without regard to the mathematical sign (positive or negative) of the Index Return. Otherwise, if the Index Return is negative and exceeds the Buffer, then the Index Credit will be negative and equal to the Index Return in excess of the Buffer.
If the Index Return is positive and equal to or greater than the Cap Rate, then the Index Credit is equal to the Cap Rate. If the Index Return is zero or positive, but less than the Cap Rate, the Index Credit is equal to the Index Return. For example, assuming a Cap Rate of 4% and an Index Return of 8% (which is greater than the Cap Rate), we will apply a 4% Index Credit at the end of the Index Strategy Term, meaning you will experience a 4% gain. If the Index Return is negative and equal to or within the Buffer, the Index Credit will be positive and equal to the absolute value of the Index Return. For example, assuming a 10% Buffer and an Index Return of negative 8% (which is within the 10% Buffer), we will apply a positive 8% Index Credit at the end of the Index Strategy Term, meaning you will experience an 8% gain. If the Index Return is instead a negative 12% (which exceeds the 10% Buffer), we will apply a negative 2% Index Credit at the end of the Index Strategy Term, meaning you will experience a 2% loss.
The Dual Directional Index Strategy is available in 1 and 6-year Terms.
The Cap Rate may vary by Index, Index Strategy Term and Buffer. We set the Cap Rates at our sole discretion, subject to the Guaranteed Minimum Cap Rate. We consider various factors in declaring Caps, including our hedging costs and techniques, administrative expenses, regulatory and tax requirements, market conditions, and competitive factors.
For Dual Directional Index Strategies, the Guaranteed Minimum Cap Rate equals 1% for a one-year Index Strategy Term and 10% for a six-year Index Strategy Term.
For Dual Directional Index Strategies, the Guaranteed Minimum Cap Rate equals 1% for a one-year Index Strategy Term and 10% for a six-year Index Strategy Term.
The initial Cap Rate applies to the initial Index Strategy Term. We will declare a Cap Rate for each subsequent Index Strategy Term. In some cases, we may declare a Cap Rate for an Index Strategy as “uncapped” in which case the maximum Index Credit you may receive is equal to the Index Return, subject to the Buffer.
Subsequent Cap Rates may be higher or lower than the initial Cap Rate but will never be less than the Guaranteed Minimum Cap Rate. Subsequent Cap Rates may differ from the Cap Rates used for new contracts or for other contracts issued at different times. We will determine new Cap Rates on a basis that does not discriminate unfairly within any class of contracts. The Cap Rate will not change during an Index Strategy Term.
Examples
The following examples illustrate how we calculate and credit Index Credit, assuming hypothetical Index Returns and a hypothetical Cap and Buffer. The examples assume no withdrawals.
Index Strategy = 1-Year Dual Directional with a 10% Buffer
Cap = 7%
Index Strategy Base at Index Strategy Start Date = $102,000
Index Strategy Base at Index Strategy End Date before Index Credit = $100,000*
*Assumes a reduction in the Index Strategy Base of $2,000 since the Index Strategy Start Date due the impact of Interim Value adjustments. Reductions to your Index Strategy Base could be higher or lower than assumed in this example and will depend on factors such as your Index Strategy Base and the corresponding Interim Value adjustments.
|
●
|
Upside Potential: If the Index Return is positive: the Index Credit is equal to the Index Return up to the Cap Rate.
|
|
○
|
Example 1: If the Index increased by 6%, which is less than the Cap Rate, the Index Credit would be 6%. The Account Value in the Index Strategy after the Index Credit would be $106,000.
|
|
○
|
Example 2: If the Index increased by 9%, which is greater than the Cap Rate, the Index Credit would be 7%, which is equal to the Cap Rate. The Account Value in the Index Strategy after the Index Credit would be $107,000.
|
|
●
|
Growth Potential with Negative Index Return: If the Index Return is negative and within or equal to the Buffer: the absolute value of the Index Return will be used for the Index Credit.
|
|
○
|
Example 1: If the Index decreased by 4%, an amount within the Buffer, the Index Credit would be 4%. The Account Value in the Index Strategy after the Index Credit would be $104,000.
|
|
○
|
Example 2: If the Index decreased by 10%, an amount equal to the Buffer, the Index Credit would be 10%. The Account Value in the Index Strategy after the Index Credit would be $110,000.
|
|
●
|
Partial Downside Protection: If the Index Return is negative and exceeds the Buffer: Index losses that exceed the Buffer will result in a loss of Account Value.
|
|
○
|
Example: If the Index decreased by 12%, which is greater than the 10% Buffer, the Index Credit would be -2%. The Account Value in the Index Strategy after the Index Credit would be $98,000.
|
Maturity
On each Index Anniversary Date, you may reallocate Account Value allocated to the Variable Option and any Index Strategy(ies) that has reached an Index Strategy End Date into any available Index Strategy. Additionally, for Index Strategy(ies) where a Performance Lock has occurred, transfers to new Index Strategy(ies) may also occur on any Index Anniversary Date. We will notify you in advance of any Index Anniversary Date. Upon receipt of your instructions in Good Order for reallocation of the Account Value to or from an Index Strategy, we will process the reallocation on the Index Anniversary Date. You will be able to make reallocation selections via mail, phone, through online access or any other media that we make available. The minimum required amount allocated to any Index Strategy is $2,000. The minimum required amount allocated to the Variable Option is $20.
Please see “Transfer and Reallocation Guidelines” for more information on how you may provide instructions on reallocating Account Value at the end of an Index Strategy Term, as well as the default reallocation in the absence of such instructions.
Variable Options
Account Value allocated to the Variable Options will vary based on the investment experience of the Portfolios in which the Variable Options invest. There is a risk of loss of the entire amount invested.
Please refer to “Appendix A” for certain information regarding each Portfolio, including (i) its name, (ii) its type (e.g., money market fund, bond fund, balanced fund, etc.), (iii) its investment advisor and any subadvisor, (iv) current expenses, and (v) performance. There is no guarantee that any underlying Portfolio will meet its investment objective. Each Portfolio has issued a prospectus that contains more detailed information about the Portfolio. The prospectuses for the Portfolios can be found online at www.prudential.com/regdocs/PLAZ-FLEXGUARD-B-USP. You can also request this information at no cost by calling 1-888-PRU-2888.
Each underlying Portfolio is registered as an open-end management investment company, or series thereof, under the Investment Company Act. Shares of the underlying Portfolios are sold to separate accounts of life insurance companies offering variable annuity and variable life insurance products. The shares may also be sold directly to qualified pension and retirement plans.
Voting Rights
We are the legal owner of the shares of the underlying Portfolios in which the Variable Options invest. However, under current SEC rules, you have voting rights in relation to Account Value allocated to the Variable Options. If an underlying Portfolio requests a vote of shareholders, we will vote our shares based on instructions received from Owners with Account Value allocated to that Variable Option. Owners have the right to vote an amount equal to the number of shares attributable to their Annuity. If we do not receive voting instructions in relation to certain shares, we will vote those shares in the same manner and proportion as the shares for which we have received instructions. This voting procedure is sometimes referred to as “mirror voting” because, as indicated in the immediately preceding sentence, we mirror the votes that are actually cast, rather than decide on our own how to vote. We will also “mirror vote” shares that are owned directly by us or an affiliate (excluding shares held in the separate account of an affiliated insurer). In addition, because all the shares of a given Portfolio held within the Registered Separate Account are legally owned by us, we intend to vote all of such shares when that underlying Portfolio seeks a vote of its shareholders. As such, all such shares will be counted towards whether there is a quorum at the underlying Portfolio’s shareholder meeting and toward the ultimate outcome of the vote. Thus, under “mirror voting”, it is possible that the votes of a small percentage of Owners who actually vote will determine the ultimate outcome.
We may, if required by state insurance regulations, disregard voting instructions if they would require shares to be voted so as to cause a change in the sub-classification or investment objectives of one or more of the available Variable Options or to approve or disapprove an investment advisory contract for a Portfolio. In addition, we may disregard voting instructions that would require changes in the investment policy or investment advisor of one or more of the Portfolios associated with the available Variable Options, provided that we reasonably disapprove such changes in accordance with applicable federal or state regulations. If we disregard Owner voting instructions, we will advise Owners of our action and the reasons for such action in the next available annual or semi-annual report.
We will furnish those Owners who have Account Value allocated to a Variable Option whose underlying Portfolio has requested a “proxy” vote with proxy materials and the necessary forms to provide us with their voting instructions. Generally, you will be asked to provide instructions for us to vote on matters such as changes in a fundamental investment strategy, adoption of a new investment advisory agreement, or matters relating to the structure of the underlying Portfolio that require a vote of shareholders. We reserve the right to change the voting procedures described above if applicable SEC rules change.
Similar Funds
The Portfolios are not publicly traded mutual funds. They are only available as investment options in variable annuity contracts and variable life insurance policies issued by insurance companies, or in some cases, to participants in certain qualified retirement plans. However, some of the Portfolios available as Variable Options under variable annuity contracts and variable life insurance policies are managed by the same advisor or subadvisor as a retail mutual fund of the same or similar name that the Portfolio may have been modeled after at its inception. Certain retail mutual funds may also have been modeled after a Portfolio. While the investment objective and policies of the retail mutual funds and the Portfolios may be substantially similar, the actual investments will differ to varying degrees. Differences in the performance of the funds can be expected, and in some cases could be substantial. You should not compare the performance of a publicly traded mutual fund with the performance of any similarly named Portfolio offered as a Variable Option.
Material Conflicts
In the future, it may become disadvantageous for separate accounts of variable life insurance and variable annuity contracts to invest in the same underlying Portfolios. Neither the companies that invest in the Portfolios nor the Portfolios currently foresee any such disadvantage. The Board of Directors for each Portfolio intends to monitor events in order to identify any material conflict between variable life insurance policy owners and variable annuity contract owners and to determine what action, if any, should be taken. Material conflicts could result from such things as:
| (1) | changes in state insurance law; |
| (2) | changes in federal income tax law; |
| (3) | changes in the investment management of any Variable Option; or |
| (4) | differences between voting instructions given by variable life insurance policy owners and variable annuity contract owners. |
Fees and Payments Received by Us
As detailed below, we and our affiliates may receive substantial payments from the underlying Portfolios and/or related entities, such as the Portfolios’ advisors and subadvisors. Because these fees and payments would be made to us and our affiliates, allocations you make to the underlying Portfolios would benefit us financially. In selecting Portfolios available under the Annuity, we consider the payments that will be made to us.
We may receive Rule 12b-1 fees which compensate us and our affiliate, Prudential Annuities Distributors, Inc., for distribution and administrative services. These fees are paid by the underlying Portfolio out of each Portfolio’s assets and are therefore borne by Owners.
We may also receive administrative services payments from the Portfolios or the advisors of the underlying Portfolios or their affiliates, which are referred to as “revenue sharing” payments. The maximum combined 12b-1 fees and revenue sharing payments we receive with respect to a Portfolio are generally equal to an annual rate of 0.55% of the average assets allocated to the Portfolio under the Annuity (in certain cases, however, this amount may be equal to annual rate of 0.60% of the average assets allocated to the Portfolio). We expect to make a profit on these fees and payments and consider them when selecting the Portfolios available under the Annuity.
In addition, an advisor or subadvisor of a Portfolio or a distributor of the Annuity (not the Portfolios) may also compensate us by providing reimbursement, defraying the costs of, or paying directly for, among other things, marketing and/or administrative services and/or other services they provide in connection with the Annuity. These services may include, but are not limited to: sponsoring or co-sponsoring various promotional, educational or marketing meetings and seminars attended by distributors, wholesalers, and/or broker dealer firms’ registered representatives, and creating marketing material discussing the Annuity, available options, and underlying Portfolios. The amounts paid depend on the nature of the meetings, the number of meetings attended by the advisor, subadvisor, or distributor, the number of participants and attendees at the meetings, the costs expected to be incurred, and the level of the advisor’s, subadvisor’s or distributor’s participation. These payments or reimbursements may not be offered by all advisors, subadvisors, or distributors and the amounts of such payments may vary between and among each advisor, subadvisor, and distributor depending on their respective participation. We may also consider these payments and reimbursements when selecting the Portfolios available under the Annuity. For the annual period ended December 31, 2025, with regard to the total annual amounts that were paid (or as to which a payment amount was accrued) under the kinds of arrangements described in this paragraph, the amounts for any particular advisor, subadvisor or distributor ranged from $125.19 to $275,000. These amounts relate to all individual variable annuity contracts issued by Pruco Life or its affiliates, not only the Annuity covered by this prospectus.
In addition to the payments that we receive from underlying Portfolios and/or their affiliates, those same Portfolios and/or their affiliates may make payments to us and/or other insurers within the Prudential Financial group related to the offering of investment options within variable annuities or life insurance offered by different Prudential business units.
CHARGES AND ADJUSTMENTS
The charges under the Annuity are designed to cover, in aggregate, our direct and indirect costs of selling, administering and providing benefits under the Annuity. They are also designed, in aggregate, to compensate us for the risks of loss we assume. If, as we expect, the charges that we collect from the Annuity exceed our total costs in connection with the Annuity, we will earn a profit. Otherwise we will incur a loss. For example, we may make a profit on the Insurance Charge (as described in the “Insurance Charge” subsection of this section) if, over time, the actual costs of providing the guaranteed insurance obligations and other expenses under the Annuity are less than the amount we deduct for the Insurance Charge. To the extent we make a profit on the Insurance Charge, such profit may be used for any other corporate purpose.
The rates of certain of our charges have been set with reference to estimates of the amount of specific types of expenses or risks that we will incur. In general, a given charge under the Annuity compensates us for our costs and risks related to that charge and may provide for a profit. However, it is possible that with respect to a particular obligation we have under the Annuity, we may be compensated not only by the charge specifically tied to that obligation, but also from one or more other charges we impose.
With regard to charges that are assessed as a percentage of the value of the Variable Options, please note that such charges are assessed through a reduction to the Unit Value of your investment in each Variable Option, and in that way reduce your Account Value. A “Unit” refers to a share of participation in a Variable Option used to calculate your Account Value prior to the Annuity Date. There are no explicit charges for the Index Strategies.
BENEFITS AVAILABLE UNDER THE CONTRACT
The following table summarizes information about the benefit available under the Annuity.
Certain Contract Benefits may not be available through certain financial intermediaries. See Appendix F, “Financial Intermediary Variations” and the Cover Page of this prospectus for additional information.
|
Name of Benefit
|
Purpose
|
Standard or Optional
|
Maximum Fee
|
Restrictions/Limitations
|
|
Return of Purchase Payments Death Benefit
|
Provides protection for your Beneficiary(ies) by ensuring that they receive the greater of the Return of Purchase Payments Amount and Account Value.
|
|
0%
|
This Death Benefit may not be electively terminated.
The Death Benefit will terminate upon a change of Owner or Annuitant. The Death Benefit for any changed Owner or Annuitant will be Account Value. Withdrawals may significantly reduce the benefit, potentially by more than the amount withdrawn. The Death Benefit will terminate if you annuitize your Annuity. |
|
Performance Lock
|
Captures the Performance Lock Value of an Index Strategy at the end of any Valuation Day during the Index Strategy Term.
|
|
0%
|
Only one Performance Lock may occur for any given Index Strategy during an Index Strategy Term.
May not be applied retroactively and must be for the full amount of the Performance Lock Value. Cannot be reversed. Performance Lock Value will no longer participate in the Index Strategy performance for the current Index Strategy Term. Performance Lock Value cannot be reallocated until the next Index Anniversary Date. We reserve the right to limit the use of the Performance Lock feature for certain Index Strategies. We may discontinue the use of this feature for future Performance Lock requests at any time. |
|
Name of Benefit
|
Purpose
|
Standard or Optional
|
Maximum Fee
|
Restrictions/Limitations
|
|
Systematic Withdrawal Program
|
An administrative program designed for you to withdraw a specified amount from your Annuity on an automated basis at the frequency you select.
|
|
0%
|
Not available if you are receiving substantially equal periodic payments under Sections 72(t) and 72(q) of the Code or Required Minimum Distributions.
Terminates upon change of ownership or assignment. Systematic withdrawals may be subject to surrender charges, negative Interim Value adjustments, and tax consequences. |
|
Name of Benefit
|
Purpose
|
Standard or Optional
|
Maximum Fee
|
Restrictions/Limitations
|
|
Return of Purchase Payments Death Benefit
|
Provides protection for your Beneficiary(ies) by ensuring that they receive the greater of the Return of Purchase Payments Amount and Account Value.
|
|
0%
|
This Death Benefit may not be electively terminated.
The Death Benefit will terminate upon a change of Owner or Annuitant. The Death Benefit for any changed Owner or Annuitant will be Account Value. Withdrawals may significantly reduce the benefit, potentially by more than the amount withdrawn. The Death Benefit will terminate if you annuitize your Annuity. |
|
Performance Lock
|
Captures the Performance Lock Value of an Index Strategy at the end of any Valuation Day during the Index Strategy Term.
|
|
0%
|
Only one Performance Lock may occur for any given Index Strategy during an Index Strategy Term.
May not be applied retroactively and must be for the full amount of the Performance Lock Value. Cannot be reversed. Performance Lock Value will no longer participate in the Index Strategy performance for the current Index Strategy Term. Performance Lock Value cannot be reallocated until the next Index Anniversary Date. We reserve the right to limit the use of the Performance Lock feature for certain Index Strategies. We may discontinue the use of this feature for future Performance Lock requests at any time. |
|
Name of Benefit
|
Purpose
|
Standard or Optional
|
Maximum Fee
|
Restrictions/Limitations
|
|
Systematic Withdrawal Program
|
An administrative program designed for you to withdraw a specified amount from your Annuity on an automated basis at the frequency you select.
|
|
0%
|
Not available if you are receiving substantially equal periodic payments under Sections 72(t) and 72(q) of the Code or Required Minimum Distributions.
Terminates upon change of ownership or assignment. Systematic withdrawals may be subject to surrender charges, negative Interim Value adjustments, and tax consequences. |
APPENDIX A – INVESTMENT OPTIONS AVAILABLE UNDER THE CONTRACT
Certain Investment Options may not be
available through certain financial intermediaries. See Appendix
F, “Financial
Intermediary Variations” and the Cover
Page of this
prospectus for additional information.
Variable Options
The following is the list of Portfolios available under the Contract. More information about the Portfolios is available in the prospectuses for the Portfolios, which may be amended from time to time and can be found online at www.prudential.com/regdocs/PLAZ-FLEXGUARD-B-USP. You can also request this information at no cost by calling 1-800-346-3778 or by sending an email to service@prudential.com.
The current expenses and performance information below reflects fee and expenses of the Portfolio, but do not reflect the other fees and expenses that your Contract may charge. Expenses would be higher, and performance would be lower if these other charges were included. The Portfolio’s past performance is not necessarily an indication of future performance.
|
Fund Type
|
Portfolio Company and Advisor/Subadvisor
|
Current
Expenses |
Average Annual Total Returns
(as of 12/31/2025) |
||
|
1 Year
|
5 Year
|
10 Year
|
|||
|
Equity
|
MFS® International Growth Portfolio - Service Class♦
Massachusetts Financial Services Company |
1.13%
|
20.81%
|
6.80%
|
9.60%
|
|
Fixed Income
|
MFS® Total Return Bond Series - Service Class♦
Massachusetts Financial Services Company |
0.78%
|
6.94%
|
-0.09%
|
2.38%
|
|
Allocation
|
MFS® Total Return Series - Service Class♦
Massachusetts Financial Services Company |
0.86%
|
10.91%
|
6.16%
|
7.36%
|
|
Equity
|
MFS® Value Series - Service Class♦
Massachusetts Financial Services Company |
0.94%
|
12.77%
|
9.69%
|
9.77%
|
|
Fixed Income
|
PSF PGIM Government Money Market Portfolio - Class III
PGIM Fixed Income |
0.57%
|
3.79%
|
2.87%
|
N/A
|
Index-Linked Options
The following is a list of Index Strategies currently available under the Contract. We may change the features of the Index Strategies listed below (including the Index and the current limits on Index gains and losses), offer new Index Strategies, and terminate existing Index Strategies. We will provide you with written notice before making any changes other than changes to current limits on Index gains. Information about current limits on Index gains is available at www.prudential.com/flexguard-rates.
Note: If amounts are removed from an Index Strategy before the end of its Index Strategy Term, we will apply an Interim Value adjustment. This may result in a significant reduction in your Account Value that could exceed any protection from Index loss that would be in place if you waited until the end of the Strategy Term.
See “Description of Insurance Company, Registered Separate Account, and Investment Options” in the prospectus for a description of the Index Strategies’ features. See “Charges and Adjustments” in the prospectus for more information about Interim Value adjustments.
|
Index
|
Type of Index
|
Index Strategy Term
|
Index Crediting Methodology
|
Current Limit on Index Loss (if held until end of Index Strategy Term)
|
Minimum Limit on Index Gain (for the life of the Index Strategy)
|
|
Point-to-Point with Cap Index Strategy
|
|||||
|
S&P 500®1
|
U.S. Large-Cap Equities
|
1-Year
|
Point-to-Point with Cap Index Strategy
|
10% Buffer
|
Minimum Cap Rate: 1%
|
|
MSCI EAFE1
|
International Equities
|
1-Year
|
Point-to-Point with Cap Index Strategy
|
10% Buffer
|
Minimum Cap Rate: 1%
|
|
Invesco QQQ ETF2
|
Large-Cap Equities
|
1-Year
|
Point-to-Point with Cap Index Strategy
|
10% Buffer
|
Minimum Cap Rate: 1%
|
|
iShares® Russell 2000 ETF2
|
U.S. Small-Cap Equities
|
1-Year
|
Point-to-Point with Cap Index Strategy
|
10% Buffer
|
Minimum Cap Rate: 1%
|
|
S&P 500®1
|
U.S. Large-Cap Equities
|
1-Year
|
Point-to-Point with Cap Index Strategy
|
15% Buffer
|
Minimum Cap Rate: 1%
|
|
MSCI EAFE1
|
International Equities
|
1-Year
|
Point-to-Point with Cap Index Strategy
|
15% Buffer
|
Minimum Cap Rate: 1%
|
|
Invesco QQQ ETF2
|
Large-Cap Equities
|
1-Year
|
Point-to-Point with Cap Index Strategy
|
15% Buffer
|
Minimum Cap Rate: 1%
|
|
iShares® Russell 2000 ETF2
|
U.S. Small-Cap Equities
|
1-Year
|
Point-to-Point with Cap Index Strategy
|
15% Buffer
|
Minimum Cap Rate: 1%
|
|
S&P 500®1
|
U.S. Large-Cap Equities
|
1-Year
|
Point-to-Point with Cap Index Strategy
|
30% Buffer
|
Minimum Cap Rate: 1%
|
|
MSCI EAFE1
|
International Equities
|
1-Year
|
Point-to-Point with Cap Index Strategy
|
30% Buffer
|
Minimum Cap Rate: 1%
|
|
Invesco QQQ ETF2
|
Large-Cap Equities
|
1-Year
|
Point-to-Point with Cap Index Strategy
|
30% Buffer
|
Minimum Cap Rate: 1%
|
|
iShares® Russell 2000 ETF2
|
U.S. Small-Cap Equities
|
1-Year
|
Point-to-Point with Cap Index Strategy
|
30% Buffer
|
Minimum Cap Rate: 1%
|
|
S&P 500®1
|
U.S. Large-Cap Equities
|
1-Year
|
Point-to-Point with Cap Index Strategy
|
100% Buffer
|
Minimum Cap Rate: 1%
|
|
S&P 500®1
|
U.S. Large-Cap Equities
|
3-Year
|
Point-to-Point with Cap Index Strategy
|
10% Buffer
|
Minimum Cap Rate: 5%
|
|
MSCI EAFE1
|
International Equities
|
3-Year
|
Point-to-Point with Cap Index Strategy
|
10% Buffer
|
Minimum Cap Rate: 5%
|
|
iShares® Russell 2000 ETF2
|
U.S. Small-Cap Equities
|
3-Year
|
Point-to-Point with Cap Index Strategy
|
10% Buffer
|
Minimum Cap Rate: 5%
|
|
AB 500 Plus IndexSM1
|
U.S. Large-Cap Equities with Exposure to Global Equity Markets
|
3-Year
|
Point-to-Point with Cap Index Strategy
|
10% Buffer
|
Minimum Cap Rate: 5%
|
|
S&P 500®1
|
U.S. Large-Cap Equities
|
3-Year
|
Point-to-Point with Cap Index Strategy
|
20% Buffer
|
Minimum Cap Rate: 5%
|
|
iShares® Russell 2000 ETF2
|
U.S. Small-Cap Equities
|
3-Year
|
Point-to-Point with Cap Index Strategy
|
20% Buffer
|
Minimum Cap Rate: 5%
|
|
MSCI EAFE1
|
International Equities
|
3-Year
|
Point-to-Point with Cap Index Strategy
|
20% Buffer
|
Minimum Cap Rate: 5%
|
|
AB 500 Plus IndexSM1
|
U.S. Large-Cap Equities with Exposure to Global Equity Markets
|
3-Year
|
Point-to-Point with Cap Index Strategy
|
20% Buffer
|
Minimum Cap Rate: 5%
|
|
S&P 500®1
|
U.S. Large-Cap Equities
|
6-Year
|
Point-to-Point with Cap Index Strategy
|
20% Buffer
|
Minimum Cap Rate: 10%
|
|
MSCI EAFE1
|
International Equities
|
6-Year
|
Point-to-Point with Cap Index Strategy
|
20% Buffer
|
Minimum Cap Rate: 10%
|
|
iShares® Russell 2000 ETF2
|
U.S. Small-Cap Equities
|
6-Year
|
Point-to-Point with Cap Index Strategy
|
20% Buffer
|
Minimum Cap Rate: 10%
|
|
AB 500 Plus IndexSM1
|
U.S. Large-Cap Equities with Exposure to Global Equity Markets
|
6-Year
|
Point-to-Point with Cap Index Strategy
|
20% Buffer
|
Minimum Cap Rate: 10%
|
|
Dimensional International Equity Focus1
|
International Equities
|
6-Year
|
Point-to-Point with Cap Index Strategy
|
20% Buffer
|
Minimum Cap Rate: 10%
|
|
S&P 500®1
|
U.S. Large-Cap Equities
|
6-Year
|
Point-to-Point with Cap Index Strategy
|
30% Buffer
|
Minimum Cap Rate: 10%
|
|
MSCI EAFE1
|
International Equities
|
6-Year
|
Point-to-Point with Cap Index Strategy
|
30% Buffer
|
Minimum Cap Rate: 10%
|
|
iShares® Russell 2000 ETF2
|
U.S. Small-Cap Equities
|
6-Year
|
Point-to-Point with Cap Index Strategy
|
30% Buffer
|
Minimum Cap Rate: 10%
|
|
AB 500 Plus IndexSM1
|
U.S. Large-Cap Equities with Exposure to Global Equity Markets
|
6-Year
|
Point-to-Point with Cap Index Strategy
|
30% Buffer
|
Minimum Cap Rate: 10%
|
|
Dimensional International Equity Focus1
|
International Equities
|
6-Year
|
Point-to-Point with Cap Index Strategy
|
30% Buffer
|
Minimum Cap Rate: 10%
|
|
Enhanced Cap Rate Index Strategy (For Annuities with an Application Sign Date on or after July 1, 2024)
|
|||||
|
S&P 500®1, Spread A
|
U.S. Large-Cap Equities
|
1-Year
|
Enhanced Cap Rate Index Strategy
|
10% Buffer
|
Minimum Cap Rate: 1%
Maximum Spread: 3% |
|
S&P 500®1, Spread B
|
U.S. Large-Cap Equities
|
1-Year
|
Enhanced Cap Rate Index Strategy
|
10% Buffer
|
Minimum Cap Rate: 1%
Maximum Spread: 3% |
|
MSCI EAFE1, Spread A
|
International Equities
|
1-Year
|
Enhanced Cap Rate Index Strategy
|
10% Buffer
|
Minimum Cap Rate: 1%
Maximum Spread: 3% |
|
MSCI EAFE1, Spread B
|
International Equities
|
1-Year
|
Enhanced Cap Rate Index Strategy
|
10% Buffer
|
Minimum Cap Rate: 1%
Maximum Spread: 3% |
|
S&P 500®1, Spread A
|
U.S. Large-Cap Equities
|
1-Year
|
Enhanced Cap Rate Index Strategy
|
15% Buffer
|
Minimum Cap Rate: 1%
Maximum Spread: 3% |
|
S&P 500®1, Spread B
|
U.S. Large-Cap Equities
|
1-Year
|
Enhanced Cap Rate Index Strategy
|
15% Buffer
|
Minimum Cap Rate: 1%
Maximum Spread: 3% |
|
MSCI EAFE1, Spread A
|
International Equities
|
1-Year
|
Enhanced Cap Rate Index Strategy
|
15% Buffer
|
Minimum Cap Rate: 1%
Maximum Spread: 3% |
|
MSCI EAFE1, Spread B
|
International Equities
|
1-Year
|
Enhanced Cap Rate Index Strategy
|
15% Buffer
|
Minimum Cap Rate: 1%
Maximum Spread: 3% |
|
Step Rate Plus Index Strategy
|
|||||
|
S&P 500®1
|
U.S. Large-Cap Equities
|
1-Year
|
Step Rate Plus Index Strategy
|
5% Buffer
|
Minimum Step Rate: 1%
Minimum Participation Rate: 60% |
|
MSCI EAFE1
|
International Equities
|
1-Year
|
Step Rate Plus Index Strategy
|
5% Buffer
|
Minimum Step Rate: 1%
Minimum Participation Rate: 60% |
|
S&P 500®1
|
U.S. Large-Cap Equities
|
1-Year
|
Step Rate Plus Index Strategy
|
10% Buffer
|
Minimum Step Rate: 1%
Minimum Participation Rate: 60% |
|
Tiered Participation Rate Index Strategy
|
|||||
|
S&P 500®1
|
U.S. Large-Cap Equities
|
6-Year
|
Tiered Participation Rate Index Strategy
|
5% Buffer
|
Minimum Participation Rate: 100%
Maximum Tier Level: 35% |
|
MSCI EAFE1
|
International Equities
|
6-Year
|
Tiered Participation Rate Index Strategy
|
5% Buffer
|
Minimum Participation Rate: 100%
Maximum Tier Level: 35% |
|
iShares® Russell 2000 ETF2
|
U.S. Small-Cap Equities
|
6-Year
|
Tiered Participation Rate Index Strategy
|
5% Buffer
|
Minimum Participation Rate: 100%
Maximum Tier Level: 35% |
|
AB 500 Plus IndexSM1
|
U.S. Large-Cap Equities with Exposure to Global Equity Markets
|
6-Year
|
Tiered Participation Rate Index Strategy
|
5% Buffer
|
Minimum Participation Rate: 100%
Maximum Tier Level: 35% |
|
Dimensional International Equity Focus1
|
International Equities
|
6-Year
|
Tiered Participation Rate Index Strategy
|
5% Buffer
|
Minimum Participation Rate: 100%
Maximum Tier Level: 35% |
|
S&P 500®1
|
U.S. Large-Cap Equities
|
6-Year
|
Tiered Participation Rate Index Strategy
|
10% Buffer
|
Minimum Participation Rate: 100%
Maximum Tier Level: 35% |
|
MSCI EAFE1
|
International Equities
|
6-Year
|
Tiered Participation Rate Index Strategy
|
10% Buffer
|
Minimum Participation Rate: 100%
Maximum Tier Level: 35% |
|
AB 500 Plus IndexSM1
|
U.S. Large-Cap Equities with Exposure to Global Equity Markets
|
6-Year
|
Tiered Participation Rate Index Strategy
|
10% Buffer
|
Minimum Participation Rate: 100%
Maximum Tier Level: 35% |
|
Dimensional International Equity Focus1
|
International Equities
|
6-Year
|
Tiered Participation Rate Index Strategy
|
10% Buffer
|
Minimum Participation Rate: 100%
Maximum Tier Level: 35% |
|
Dual Directional Index Strategy
|
|||||
|
S&P 500®1
|
U.S. Large-Cap Equities
|
1-Year
|
Dual Directional Index Strategy
|
10% Buffer
|
Minimum Cap Rate: 1%
|
|
S&P 500®1
|
U.S. Large-Cap Equities
|
1-Year
|
Dual Directional Index Strategy
|
15% Buffer
|
Minimum Cap Rate: 1%
|
|
S&P 500®1
|
U.S. Large-Cap Equities
|
6-Year
|
Dual Directional Index Strategy
|
10% Buffer
|
Minimum Cap Rate: 10%
|
|
S&P 500®1
|
U.S. Large-Cap Equities
|
6-Year
|
Dual Directional Index Strategy
|
15% Buffer
|
Minimum Cap Rate: 10%
|
|
S&P 500®1
|
U.S. Large-Cap Equities
|
6-Year
|
Dual Directional Index Strategy
|
20% Buffer
|
Minimum Cap Rate: 10%
|
1. This Index is a “price return index,” not a “total return index,” and therefore does not reflect the dividends paid on the securities composing the Index, which will reduce the Index Return and may cause the Index to underperform a direct investment in the securities composing the Index.
2. This Index is an ETF. Index Values are based on the ETF’s closing prices. The Index Values reflect a “price return,” not a “total return,” and therefore do not reflect the dividends paid on the securities in which the ETF invests. In addition, fees and costs are deducted from the ETF, which reduces the ETF’s performance. These factors will reduce the Index Return and may cause the Index to underperform a direct investment in the ETF or the securities which the ETF invests.
|
●
|
Depending on the Index Strategy, the maximum amount of loss that you could experience from negative Index performance, after taking into account the current limits on Index loss provided under the Annuity, ranges from 0% (with 100% buffer) to 95% (with 5% buffer).
|
|
●
|
The Company does not guarantee that the Annuity will always offer Index Strategies that limit Index losses, which would mean risk of loss of the entire amount invested.
|
|
●
|
The Company limits the amount you can earn on an Index Strategy.
|
|
○
|
For Point-to-Point with Cap Index Strategies, the Guaranteed Minimum Cap Rate equals 1% for a one-year Index Strategy Term, 5% for a three-year Index Strategy Term and 10% for a six-year Index Strategy Term.
|
|
○
|
For Enhanced Cap Rate Index Strategies, the Guaranteed Minimum Cap Rate equals 1% and the Guaranteed Maximum Spread equals 3% for a one year Index Strategy Term.
|
|
○
|
For Step Rate Plus Index Strategies, the Guaranteed Minimum Step Rate equals 1% and the Guaranteed Minimum Participation Rate equals 60%.
|
|
○
|
For Tiered Participation Rate Index Strategies, the Guaranteed Minimum Participation Rate equals 100% and the Guaranteed Maximum Tier Level equals 35%.
|
|
○
|
For Dual Directional Index Strategies, the Guaranteed Minimum Cap Rate equals 1% for a one-year Index Strategy Term and 10% for a six-year Index Strategy Term.
|
|
Fund Type
|
Portfolio Company and Advisor/Subadvisor
|
Current
Expenses |
Average Annual Total Returns
(as of 12/31/2025) |
||
|
1 Year
|
5 Year
|
10 Year
|
|||
|
Equity
|
MFS® International Growth Portfolio - Service Class♦
Massachusetts Financial Services Company |
1.13%
|
20.81%
|
6.80%
|
9.60%
|
|
Fixed Income
|
MFS® Total Return Bond Series - Service Class♦
Massachusetts Financial Services Company |
0.78%
|
6.94%
|
-0.09%
|
2.38%
|
|
Allocation
|
MFS® Total Return Series - Service Class♦
Massachusetts Financial Services Company |
0.86%
|
10.91%
|
6.16%
|
7.36%
|
|
Equity
|
MFS® Value Series - Service Class♦
Massachusetts Financial Services Company |
0.94%
|
12.77%
|
9.69%
|
9.77%
|
|
Fixed Income
|
PSF PGIM Government Money Market Portfolio - Class III
PGIM Fixed Income |
0.57%
|
3.79%
|
2.87%
|
N/A
|
|
Index
|
Type of Index
|
Index Strategy Term
|
Index Crediting Methodology
|
Current Limit on Index Loss (if held until end of Index Strategy Term)
|
Minimum Limit on Index Gain (for the life of the Index Strategy)
|
|
Point-to-Point with Cap Index Strategy
|
|||||
|
S&P 500®1
|
U.S. Large-Cap Equities
|
1-Year
|
Point-to-Point with Cap Index Strategy
|
10% Buffer
|
Minimum Cap Rate: 1%
|
|
MSCI EAFE1
|
International Equities
|
1-Year
|
Point-to-Point with Cap Index Strategy
|
10% Buffer
|
Minimum Cap Rate: 1%
|
|
Invesco QQQ ETF2
|
Large-Cap Equities
|
1-Year
|
Point-to-Point with Cap Index Strategy
|
10% Buffer
|
Minimum Cap Rate: 1%
|
|
iShares® Russell 2000 ETF2
|
U.S. Small-Cap Equities
|
1-Year
|
Point-to-Point with Cap Index Strategy
|
10% Buffer
|
Minimum Cap Rate: 1%
|
|
S&P 500®1
|
U.S. Large-Cap Equities
|
1-Year
|
Point-to-Point with Cap Index Strategy
|
15% Buffer
|
Minimum Cap Rate: 1%
|
|
MSCI EAFE1
|
International Equities
|
1-Year
|
Point-to-Point with Cap Index Strategy
|
15% Buffer
|
Minimum Cap Rate: 1%
|
|
Invesco QQQ ETF2
|
Large-Cap Equities
|
1-Year
|
Point-to-Point with Cap Index Strategy
|
15% Buffer
|
Minimum Cap Rate: 1%
|
|
iShares® Russell 2000 ETF2
|
U.S. Small-Cap Equities
|
1-Year
|
Point-to-Point with Cap Index Strategy
|
15% Buffer
|
Minimum Cap Rate: 1%
|
|
S&P 500®1
|
U.S. Large-Cap Equities
|
1-Year
|
Point-to-Point with Cap Index Strategy
|
30% Buffer
|
Minimum Cap Rate: 1%
|
|
MSCI EAFE1
|
International Equities
|
1-Year
|
Point-to-Point with Cap Index Strategy
|
30% Buffer
|
Minimum Cap Rate: 1%
|
|
Invesco QQQ ETF2
|
Large-Cap Equities
|
1-Year
|
Point-to-Point with Cap Index Strategy
|
30% Buffer
|
Minimum Cap Rate: 1%
|
|
iShares® Russell 2000 ETF2
|
U.S. Small-Cap Equities
|
1-Year
|
Point-to-Point with Cap Index Strategy
|
30% Buffer
|
Minimum Cap Rate: 1%
|
|
S&P 500®1
|
U.S. Large-Cap Equities
|
1-Year
|
Point-to-Point with Cap Index Strategy
|
100% Buffer
|
Minimum Cap Rate: 1%
|
|
S&P 500®1
|
U.S. Large-Cap Equities
|
3-Year
|
Point-to-Point with Cap Index Strategy
|
10% Buffer
|
Minimum Cap Rate: 5%
|
|
MSCI EAFE1
|
International Equities
|
3-Year
|
Point-to-Point with Cap Index Strategy
|
10% Buffer
|
Minimum Cap Rate: 5%
|
|
iShares® Russell 2000 ETF2
|
U.S. Small-Cap Equities
|
3-Year
|
Point-to-Point with Cap Index Strategy
|
10% Buffer
|
Minimum Cap Rate: 5%
|
|
AB 500 Plus IndexSM1
|
U.S. Large-Cap Equities with Exposure to Global Equity Markets
|
3-Year
|
Point-to-Point with Cap Index Strategy
|
10% Buffer
|
Minimum Cap Rate: 5%
|
|
S&P 500®1
|
U.S. Large-Cap Equities
|
3-Year
|
Point-to-Point with Cap Index Strategy
|
20% Buffer
|
Minimum Cap Rate: 5%
|
|
iShares® Russell 2000 ETF2
|
U.S. Small-Cap Equities
|
3-Year
|
Point-to-Point with Cap Index Strategy
|
20% Buffer
|
Minimum Cap Rate: 5%
|
|
MSCI EAFE1
|
International Equities
|
3-Year
|
Point-to-Point with Cap Index Strategy
|
20% Buffer
|
Minimum Cap Rate: 5%
|
|
AB 500 Plus IndexSM1
|
U.S. Large-Cap Equities with Exposure to Global Equity Markets
|
3-Year
|
Point-to-Point with Cap Index Strategy
|
20% Buffer
|
Minimum Cap Rate: 5%
|
|
S&P 500®1
|
U.S. Large-Cap Equities
|
6-Year
|
Point-to-Point with Cap Index Strategy
|
20% Buffer
|
Minimum Cap Rate: 10%
|
|
MSCI EAFE1
|
International Equities
|
6-Year
|
Point-to-Point with Cap Index Strategy
|
20% Buffer
|
Minimum Cap Rate: 10%
|
|
iShares® Russell 2000 ETF2
|
U.S. Small-Cap Equities
|
6-Year
|
Point-to-Point with Cap Index Strategy
|
20% Buffer
|
Minimum Cap Rate: 10%
|
|
AB 500 Plus IndexSM1
|
U.S. Large-Cap Equities with Exposure to Global Equity Markets
|
6-Year
|
Point-to-Point with Cap Index Strategy
|
20% Buffer
|
Minimum Cap Rate: 10%
|
|
Dimensional International Equity Focus1
|
International Equities
|
6-Year
|
Point-to-Point with Cap Index Strategy
|
20% Buffer
|
Minimum Cap Rate: 10%
|
|
S&P 500®1
|
U.S. Large-Cap Equities
|
6-Year
|
Point-to-Point with Cap Index Strategy
|
30% Buffer
|
Minimum Cap Rate: 10%
|
|
MSCI EAFE1
|
International Equities
|
6-Year
|
Point-to-Point with Cap Index Strategy
|
30% Buffer
|
Minimum Cap Rate: 10%
|
|
iShares® Russell 2000 ETF2
|
U.S. Small-Cap Equities
|
6-Year
|
Point-to-Point with Cap Index Strategy
|
30% Buffer
|
Minimum Cap Rate: 10%
|
|
AB 500 Plus IndexSM1
|
U.S. Large-Cap Equities with Exposure to Global Equity Markets
|
6-Year
|
Point-to-Point with Cap Index Strategy
|
30% Buffer
|
Minimum Cap Rate: 10%
|
|
Dimensional International Equity Focus1
|
International Equities
|
6-Year
|
Point-to-Point with Cap Index Strategy
|
30% Buffer
|
Minimum Cap Rate: 10%
|
|
Enhanced Cap Rate Index Strategy (For Annuities with an Application Sign Date on or after July 1, 2024)
|
|||||
|
S&P 500®1, Spread A
|
U.S. Large-Cap Equities
|
1-Year
|
Enhanced Cap Rate Index Strategy
|
10% Buffer
|
Minimum Cap Rate: 1%
Maximum Spread: 3% |
|
S&P 500®1, Spread B
|
U.S. Large-Cap Equities
|
1-Year
|
Enhanced Cap Rate Index Strategy
|
10% Buffer
|
Minimum Cap Rate: 1%
Maximum Spread: 3% |
|
MSCI EAFE1, Spread A
|
International Equities
|
1-Year
|
Enhanced Cap Rate Index Strategy
|
10% Buffer
|
Minimum Cap Rate: 1%
Maximum Spread: 3% |
|
MSCI EAFE1, Spread B
|
International Equities
|
1-Year
|
Enhanced Cap Rate Index Strategy
|
10% Buffer
|
Minimum Cap Rate: 1%
Maximum Spread: 3% |
|
S&P 500®1, Spread A
|
U.S. Large-Cap Equities
|
1-Year
|
Enhanced Cap Rate Index Strategy
|
15% Buffer
|
Minimum Cap Rate: 1%
Maximum Spread: 3% |
|
S&P 500®1, Spread B
|
U.S. Large-Cap Equities
|
1-Year
|
Enhanced Cap Rate Index Strategy
|
15% Buffer
|
Minimum Cap Rate: 1%
Maximum Spread: 3% |
|
MSCI EAFE1, Spread A
|
International Equities
|
1-Year
|
Enhanced Cap Rate Index Strategy
|
15% Buffer
|
Minimum Cap Rate: 1%
Maximum Spread: 3% |
|
MSCI EAFE1, Spread B
|
International Equities
|
1-Year
|
Enhanced Cap Rate Index Strategy
|
15% Buffer
|
Minimum Cap Rate: 1%
Maximum Spread: 3% |
|
Step Rate Plus Index Strategy
|
|||||
|
S&P 500®1
|
U.S. Large-Cap Equities
|
1-Year
|
Step Rate Plus Index Strategy
|
5% Buffer
|
Minimum Step Rate: 1%
Minimum Participation Rate: 60% |
|
MSCI EAFE1
|
International Equities
|
1-Year
|
Step Rate Plus Index Strategy
|
5% Buffer
|
Minimum Step Rate: 1%
Minimum Participation Rate: 60% |
|
S&P 500®1
|
U.S. Large-Cap Equities
|
1-Year
|
Step Rate Plus Index Strategy
|
10% Buffer
|
Minimum Step Rate: 1%
Minimum Participation Rate: 60% |
|
Tiered Participation Rate Index Strategy
|
|||||
|
S&P 500®1
|
U.S. Large-Cap Equities
|
6-Year
|
Tiered Participation Rate Index Strategy
|
5% Buffer
|
Minimum Participation Rate: 100%
Maximum Tier Level: 35% |
|
MSCI EAFE1
|
International Equities
|
6-Year
|
Tiered Participation Rate Index Strategy
|
5% Buffer
|
Minimum Participation Rate: 100%
Maximum Tier Level: 35% |
|
iShares® Russell 2000 ETF2
|
U.S. Small-Cap Equities
|
6-Year
|
Tiered Participation Rate Index Strategy
|
5% Buffer
|
Minimum Participation Rate: 100%
Maximum Tier Level: 35% |
|
AB 500 Plus IndexSM1
|
U.S. Large-Cap Equities with Exposure to Global Equity Markets
|
6-Year
|
Tiered Participation Rate Index Strategy
|
5% Buffer
|
Minimum Participation Rate: 100%
Maximum Tier Level: 35% |
|
Dimensional International Equity Focus1
|
International Equities
|
6-Year
|
Tiered Participation Rate Index Strategy
|
5% Buffer
|
Minimum Participation Rate: 100%
Maximum Tier Level: 35% |
|
S&P 500®1
|
U.S. Large-Cap Equities
|
6-Year
|
Tiered Participation Rate Index Strategy
|
10% Buffer
|
Minimum Participation Rate: 100%
Maximum Tier Level: 35% |
|
MSCI EAFE1
|
International Equities
|
6-Year
|
Tiered Participation Rate Index Strategy
|
10% Buffer
|
Minimum Participation Rate: 100%
Maximum Tier Level: 35% |
|
AB 500 Plus IndexSM1
|
U.S. Large-Cap Equities with Exposure to Global Equity Markets
|
6-Year
|
Tiered Participation Rate Index Strategy
|
10% Buffer
|
Minimum Participation Rate: 100%
Maximum Tier Level: 35% |
|
Dimensional International Equity Focus1
|
International Equities
|
6-Year
|
Tiered Participation Rate Index Strategy
|
10% Buffer
|
Minimum Participation Rate: 100%
Maximum Tier Level: 35% |
|
Dual Directional Index Strategy
|
|||||
|
S&P 500®1
|
U.S. Large-Cap Equities
|
1-Year
|
Dual Directional Index Strategy
|
10% Buffer
|
Minimum Cap Rate: 1%
|
|
S&P 500®1
|
U.S. Large-Cap Equities
|
1-Year
|
Dual Directional Index Strategy
|
15% Buffer
|
Minimum Cap Rate: 1%
|
|
S&P 500®1
|
U.S. Large-Cap Equities
|
6-Year
|
Dual Directional Index Strategy
|
10% Buffer
|
Minimum Cap Rate: 10%
|
|
S&P 500®1
|
U.S. Large-Cap Equities
|
6-Year
|
Dual Directional Index Strategy
|
15% Buffer
|
Minimum Cap Rate: 10%
|
|
S&P 500®1
|
U.S. Large-Cap Equities
|
6-Year
|
Dual Directional Index Strategy
|
20% Buffer
|
Minimum Cap Rate: 10%
|
THE RETURN OF PURCHASE PAYMENTS DEATH BENEFIT
The Annuity provides a Death Benefit called the Return of Purchase Payments Death Benefit and will be attached to your Annuity contract once issued.
The amount of the Death Benefit under the Return of Purchase Payments Death Benefit is equal to the greater of:
|
●
|
The Return of Purchase Payments Amount, defined below; and
|
|
●
|
The Account Value on the date we receive Due Proof of Death.
|
Calculation of the Return of Purchase Payments Amount
Initially, the Return of Purchase Payment amount is equal to the sum of all Purchase Payments allocated to the Annuity on its Issue Date. Thereafter, the Return of Purchase Payments Amount is:
|
●
|
Increased by subsequent Purchase Payments allocated to the Annuity, and
|
|
●
|
Reduced for any partial withdrawals. A withdrawal will cause a proportional reduction to the Return of Purchase Payments Amount equal to the ratio of the amount of the withdrawal to the Account Value immediately prior to the withdrawal.
|
The proportional reduction in the Return of Purchase Payments Amount could be less or greater than the actual withdrawal based upon the level of the Account Value. If the Account Value exceeds the Return of Purchase Payments Amount prior to the withdrawal, then the impact on the Return of Purchase Payments Amount would be less than the reduction in the Account Value. If the Return of Purchase Payments Amount exceeds the Account Value prior to the withdrawal, then the impact on the Return of Purchase Payments Amount would exceed the reduction in the Account Value. This is outlined in the below examples.
Example 1:
Return of Purchase Payments Amount: $100,000
Gross Withdrawal: $18,000
Account Value at time of Withdrawal: $118,000
Return of Purchase Payments Amount Reduction Percent for Withdrawal: 15.25% ($18,000/$118,000)
Return of Purchase Payments Amount after Withdrawal: $84,750 ($100,000 × (1 - 15.25%))
Gross Withdrawal: $18,000
Account Value at time of Withdrawal: $118,000
Return of Purchase Payments Amount Reduction Percent for Withdrawal: 15.25% ($18,000/$118,000)
Return of Purchase Payments Amount after Withdrawal: $84,750 ($100,000 × (1 - 15.25%))
Example 2:
Return of Purchase Payments Amount: $100,000
Gross Withdrawal: $18,000
Account Value at time of Withdrawal: $90,000
Return of Purchase Payments Amount Reduction Percent for Withdrawal: 20% ($18,000/$90,000)
Return of Purchase Payments Amount after Withdrawal: $80,000 ($100,000 × (1 - 20%))
Gross Withdrawal: $18,000
Account Value at time of Withdrawal: $90,000
Return of Purchase Payments Amount Reduction Percent for Withdrawal: 20% ($18,000/$90,000)
Return of Purchase Payments Amount after Withdrawal: $80,000 ($100,000 × (1 - 20%))
|
Transaction Expenses
|
Maximum
|
|
Sales Charge Imposed on Purchases
|
None
|
|
Deferred Sales Charge (as a percentage of each Purchase Payment)1
|
7.00%
|
|
Transfer Fee
|
None
|
|
Additional Copies of Reports
|
$50
|
|
|
Age of Purchase Payment Being Withdrawn*
|
Percentage Applied Against Purchase Payment being Withdrawn
|
|
|
|
Less than 1 year old
|
7.0%
|
|
|
|
1 year old or older but not yet 2 years old
|
7.0%
|
|
|
|
2 years old or older but not yet 3 years old
|
6.0%
|
|
|
|
3 years old or older but not yet 4 years old
|
5.0%
|
|
|
|
4 years old or older but not yet 5 years old
|
4.0%
|
|
|
|
5 years old or older but not yet 6 years old
|
3.0%
|
|
|
|
6 years old or older
|
0.0%
|
|
If you surrender your Contract at the end of the applicable time period:
$9,601
$13,988
$17,630
$28,930
If you surrender your Contract at the end of the applicable time period:
$8,912
$11,913
$14,162
$21,967
If you annuitize your Contract at the end of the applicable time period:
$2,601
$7,988
$13,630
$28,930
If you annuitize your Contract at the end of the applicable time period:
$1,912
$5,913
$10,162
$21,967
If you do not surrender your Contract at the end of the applicable time period:
$2,601
$7,988
$13,630
$28,930
If you do not surrender your Contract at the end of the applicable time period:
$1,912
$5,913
$10,162
$21,967
|
Transaction Expenses
|
Maximum
|
|
Sales Charge Imposed on Purchases
|
None
|
|
Deferred Sales Charge (as a percentage applied against Purchase Payment being withdrawn)1
|
8.00%
|
|
Transfer Fee
|
None
|
|
Additional Copies of Reports
|
$50
|
|
|
Age of Purchase Payment Being Withdrawn*
|
Percentage Applied Against Purchase Payment being Withdrawn
|
|
|
|
Less than 1 year old
|
8.0%
|
|
|
|
1 year old or older but not yet 2 years old
|
8.0%
|
|
|
|
2 years old or older but not yet 3 years old
|
7.0%
|
|
|
|
3 years old or older but not yet 4 years old
|
6.0%
|
|
|
|
4 years old or older but not yet 5 years old
|
5.0%
|
|
|
|
5 years old or older but not yet 6 years old
|
4.0%
|
|
|
|
6 years old or older
|
0.0%
|
|
If you surrender your Contract at the end of the applicable time period:
$10,601
$14,988
$18,630
$28,930
If you surrender your annuity at the end of the applicable time period:
$9,912
$12,913
$15,162
$21,967
If you annuitize your Contract at the end of the applicable time period:
$2,601
$7,988
$13,630
$28,930
If you annuitize your annuity at the end of the applicable time period:
$1,912
$5,913
$10,162
$21,967
If you do not surrender your Contract at the end of the applicable time period:
$2,601
$7,988
$13,630
$28,930
If you do not surrender your annuity at the end of the applicable time period:
$1,912
$5,913
$10,162
$21,967
| [1] |
|
||||
| [2] |
|
||||
| [3] |
|
||||
| [4] |
|
||||
| [5] |
|
||||
| [6] |
|
||||
| [7] |
|
||||
| [8] |
|
||||
| [9] |
|
||||
| [10] |
|
||||
| [11] |
|