Pay vs Performance Disclosure - USD ($)
Dec. 31, 2025
Dec. 31, 2024
Dec. 31, 2023
Dec. 31, 2022
Dec. 31, 2021
Pay versus Performance
SEC rules require us to provide the following information regarding the relationship between executive compensation actually paid and our financial performance for Adam Singolda, our Chief Executive Officer, and for the remaining NEOs collectively, for the years listed below. For purposes of this disclosure, Mr. Singolda is referred to as our “PEO” (principal executive officer) and our remaining NEOs collectively are referred to as the “Non-PEO NEOs.”
Generally, under the rules “CAP” (compensation actually paid) is calculated by starting with the Summary Compensation Table total values and making the following adjustments: (1) deducting the grant date value of equity granted during the year, (2) deducting the change in pension value for the year (if any), (3) adding the year-end fair value of unvested equity awards granted during the year, (4) adding, for awards granted in prior years that are outstanding and unvested at the end of the year, the difference between the year-end fair value and the immediately prior year-end fair value, (5) adding, for awards granted in prior years that vested during the year, the difference between the fair value as of the vesting date and the immediately prior year-end fair value, and (6) adding the pension service cost for that year (if any).
Year-end value of $100 invested on 06/30/21 in: | ||||||||||||||||||||||||||
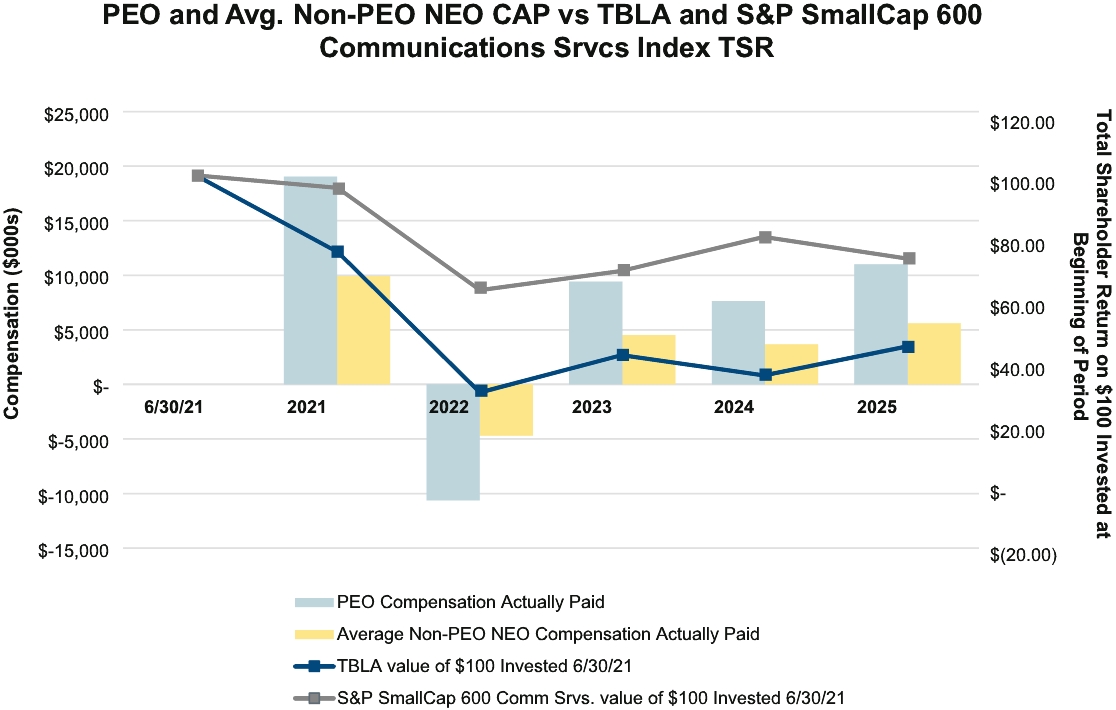
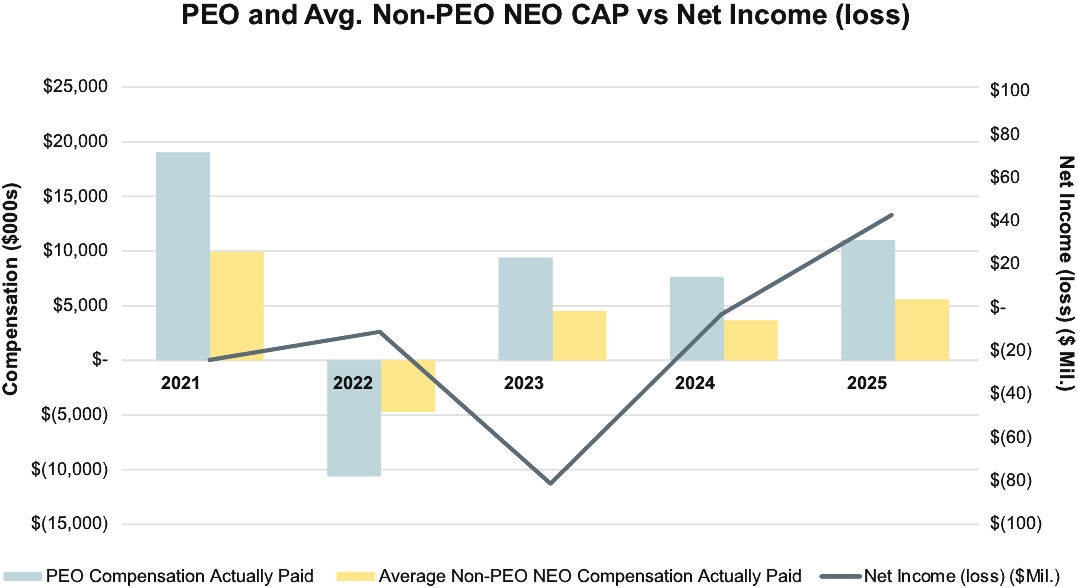
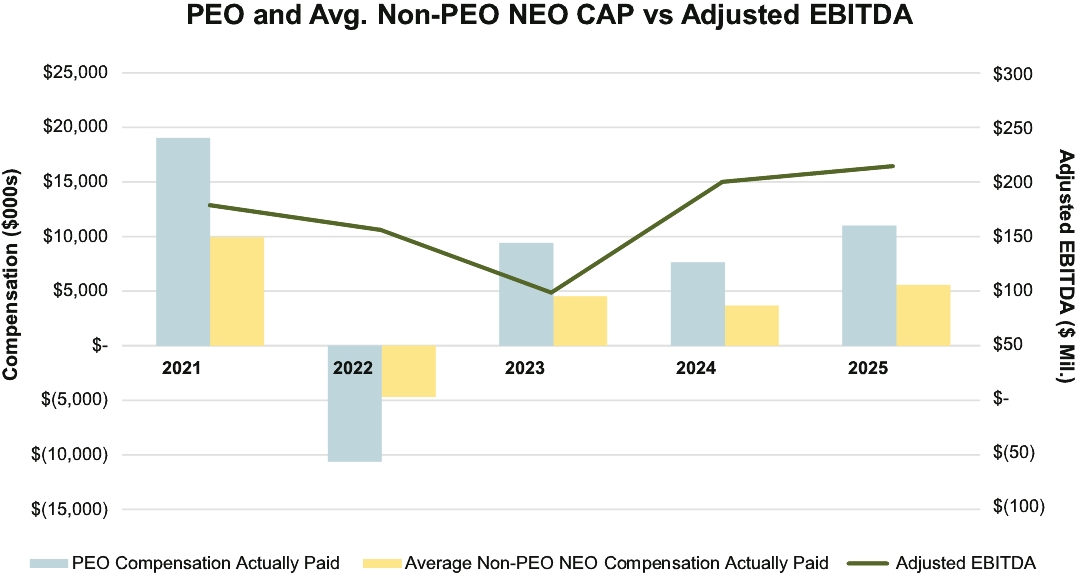
Year | Summary Compensation Table Total for PEO | Compensation Actually Paid to PEO (a)(b) | Average Summary Compensation Table Total for Non-PEO NEOs (c) | Average Compensation Actually Paid to Non-PEO NEOs (a)(b)(c)(d)(e)(F) | TBLA | S&P SmallCap 600 Communication Services | Net Income (loss) (in millions) | Adjusted EBITDA (in millions) $ | ||||||||||||||||||
2025 | $8,130,440 | $11,167,763 | $3,359,716 | $5,586,264 | $44.54 | $73.12 | $42.28 | $215.49 | ||||||||||||||||||
2024 | $10,491,344 | $7,641,511 | $4,959,920 | $3,677,021 | $35.27 | $80.08 | $(3.76) | $200.90 | ||||||||||||||||||
2023 | $6,165,107 | $9,412,843 | $3,106,536 | $4,525,359 | $41.84 | $69.11 | ($82.04) | $98.68 | ||||||||||||||||||
2022 | $802,411 | ($10,628,082) | $1,663,398 | $(4,709,425) | $29.76 | $62.86 | ($11.98) | $156.68 | ||||||||||||||||||
2021 | $18,257,391 | $19,034,854 | $10,612,439 | $9,910,999 | $75.17 | $95.91 | ($24.95) | $179.46 | ||||||||||||||||||
(a) | Deductions from, and additions to, total compensation in the Summary Compensation Table by year to calculate Compensation Actually Paid include: |
PEO – Reconciliation of SCT Total to CAP Total(1)
Year | SCT Total | Grant Date Fair Value of Awards Granted During Year(2) | Fair Value Of Equity Calculated Using SEC Methodology | CAP Total | |||||||||||||||||||
2025 | $8,130,440 | - | $6,886,506 | + | $9,923,829 | = | $11,167,763 | ||||||||||||||||
2024 | $10,491,344 | - | $6,662,742 | + | $3,812,909 | = | $7,641,511 | ||||||||||||||||
2023 | $6,165,107 | - | $4,514,693 | + | $7,762,429 | = | $9,412,843 | ||||||||||||||||
2022 | $802,411 | - | $0 | + | $(11,430,493) | = | $(10,628,082) | ||||||||||||||||
2021 | $18,257,391 | - | $16,812,544 | + | $17,590,007 | = | $19,034,854 | ||||||||||||||||
(1) | The CAP totals represent the SCT totals for the applicable year, but adjusted as required by SEC rules to include the fair value of current and prior year equity awards that are outstanding and unvested, vested or forfeited during the applicable year. |
(2) | Represents the total of the amounts reported in the Stock Awards and Option Awards columns of the SCT for the applicable year. |
Non-PEO NEOs (Average) – Reconciliation of SCT Total to CAP Total(1)
Year | SCT Total | Grant Date Fair Value of Awards Granted During Year(2) | Fair Value Of Equity Calculated Using SEC Methodology | CAP Total | |||||||||||||||||||
2025 | $3,359,716 | - | $2,573,376 | + | $4,799,924 | = | $5,586,264 | ||||||||||||||||
2024 | $4,959,920 | - | $3,036,673 | + | $1,753,774 | = | $3,677,021 | ||||||||||||||||
2023 | $3,106,536 | - | $2,185,696 | + | $3,604,519 | = | $4,525,359 | ||||||||||||||||
2022 | $1,663,398 | - | $1,150,001 | + | $(5,222,822) | = | $(4,709,425) | ||||||||||||||||
2021 | $10,612,439 | - | $9,428,848 | + | $8,727,408 | = | $9,910,999 | ||||||||||||||||
(1) | The CAP totals represent the SCT totals for the applicable year, but adjusted as required by SEC rules to include the fair value of current and prior year equity awards that are outstanding and unvested, vested or forfeited during the applicable year. |
(2) | Represents the average total of the amounts reported in the Stock Awards and Option Awards columns of the SCT for these NEOs for the applicable year. |
(b) | The following summarizes the valuation assumptions used for stock option awards included as part of Compensation Actually Paid: |
- | Expected life of each stock option is based on the “simplified method” using an average of the remaining vest and remaining term, as of the vest/FYE date. |
- | Strike price is based on each grant date closing price and share price is based on each vest/FYE closing price. |
- | Risk free rate is based on the Treasury Constant Maturity rate closest to the remaining expected life as of the vest/FYE date. |
- | Due to the limited trading history of our Ordinary shares, the expected volatility was derived from the average historical share volatilities based on peer group public companies over a period equivalent to the options expected terms. |
(c) | Non-PEO NEOs reflect the average Summary Compensation Table total compensation and average Compensation Actually Paid for the following executives for each of the years presented: Stephen Walker, Eldad Maniv, Lior Golan and Kristy Sundjaja. |
(d) | Mr. Singolda’s 2025 and 2023 RSU grants were subject to shareholder approval which were obtained on June 4, 2025 and June 1, 2023, respectively. |
(e) | The amounts reported for fiscal year 2024 have been revised from those previously disclosed in last year’s proxy statement to include Ms. Sundjaja and Mses. Golan and Maniv’s 2024 equity awards that were inadvertently omitted. |
(f) | See “Non-GAAP Financial Measures” in our 2025 Annual Report for reconciliation to the comparable GAAP measure. |
SEC rules require us to provide the following information regarding the relationship between executive compensation actually paid and our financial performance for Adam Singolda, our Chief Executive Officer, and for the remaining NEOs collectively, for the years listed below. For purposes of this disclosure, Mr. Singolda is referred to as our “PEO” (principal executive officer) and our remaining NEOs collectively are referred to as the “Non-PEO NEOs.”
(c) | Non-PEO NEOs reflect the average Summary Compensation Table total compensation and average Compensation Actually Paid for the following executives for each of the years presented: Stephen Walker, Eldad Maniv, Lior Golan and Kristy Sundjaja. |
The following graphs further illustrate the relationship between the pay and performance figures that are included in the pay versus performance tabular disclosure above. The first graph below illustrates the relationship between Company total shareholder return and that of the S&P SmallCap 600 Communication Services Index. As noted above, “compensation actually paid” for purposes of the tabular disclosure and the following graphs were calculated in accordance with SEC rules and do not fully represent the actual final amount of compensation earned by or actually paid to our NEOs during the applicable years.
(a) | Deductions from, and additions to, total compensation in the Summary Compensation Table by year to calculate Compensation Actually Paid include: |
PEO – Reconciliation of SCT Total to CAP Total(1)
Year | SCT Total | Grant Date Fair Value of Awards Granted During Year(2) | Fair Value Of Equity Calculated Using SEC Methodology | CAP Total | |||||||||||||||||||
2025 | $8,130,440 | - | $6,886,506 | + | $9,923,829 | = | $11,167,763 | ||||||||||||||||
2024 | $10,491,344 | - | $6,662,742 | + | $3,812,909 | = | $7,641,511 | ||||||||||||||||
2023 | $6,165,107 | - | $4,514,693 | + | $7,762,429 | = | $9,412,843 | ||||||||||||||||
2022 | $802,411 | - | $0 | + | $(11,430,493) | = | $(10,628,082) | ||||||||||||||||
2021 | $18,257,391 | - | $16,812,544 | + | $17,590,007 | = | $19,034,854 | ||||||||||||||||
(1) | The CAP totals represent the SCT totals for the applicable year, but adjusted as required by SEC rules to include the fair value of current and prior year equity awards that are outstanding and unvested, vested or forfeited during the applicable year. |
(2) | Represents the total of the amounts reported in the Stock Awards and Option Awards columns of the SCT for the applicable year. |
(a) | Deductions from, and additions to, total compensation in the Summary Compensation Table by year to calculate Compensation Actually Paid include: |
Non-PEO NEOs (Average) – Reconciliation of SCT Total to CAP Total(1)
Year | SCT Total | Grant Date Fair Value of Awards Granted During Year(2) | Fair Value Of Equity Calculated Using SEC Methodology | CAP Total | |||||||||||||||||||
2025 | $3,359,716 | - | $2,573,376 | + | $4,799,924 | = | $5,586,264 | ||||||||||||||||
2024 | $4,959,920 | - | $3,036,673 | + | $1,753,774 | = | $3,677,021 | ||||||||||||||||
2023 | $3,106,536 | - | $2,185,696 | + | $3,604,519 | = | $4,525,359 | ||||||||||||||||
2022 | $1,663,398 | - | $1,150,001 | + | $(5,222,822) | = | $(4,709,425) | ||||||||||||||||
2021 | $10,612,439 | - | $9,428,848 | + | $8,727,408 | = | $9,910,999 | ||||||||||||||||
(1) | The CAP totals represent the SCT totals for the applicable year, but adjusted as required by SEC rules to include the fair value of current and prior year equity awards that are outstanding and unvested, vested or forfeited during the applicable year. |
(2) | Represents the average total of the amounts reported in the Stock Awards and Option Awards columns of the SCT for these NEOs for the applicable year. |
Required Tabular Disclosure of Most Important Measures Linking Compensation Actually Paid During 2025 to Company Performance
As required, we disclose below the most important measures used by the Company to link compensation actually paid to our NEOs for 2025 to Company performance. For further information regarding these performance metrics, please see “Executive Compensation — Compensation Discussion and Analysis.”
Adjusted EBITDA | Ex-TAC Gross Profit | ||||
(f) | See “Non-GAAP Financial Measures” in our 2025 Annual Report for reconciliation to the comparable GAAP measure. |