Pay versus Performance
The following table shows (i) the total compensation for our principal executive officers (PEOs), and on an average basis, our other named executive officers (NEOs) as set forth in the summary compensation tables set forth in the Company’s proxy statements for 2025, 2024 and 2023 (“SCT”); (ii) the “compensation actually paid“ to our PEOs and, on an average basis, our other named executive officers (in each case, as determined under applicable SEC rules); (iii) our total shareholder return (“TSR”); and (iv) our net income. Compensation actually paid, as determined under SEC requirements, does not reflect the actual amount of compensation earned by or paid to our named executive officers during a covered year. No dividends were paid or accrued on stock awards for the years presented.
| Fiscal | SCT Total | Compensation | SCT Total | Compensation | Average | Average | OPRX | Net Income |
| 2025 | $0 | $0 | $2,717,717 | $3,846,197 | $1,534,218 | $2,410,807 | $72.98 | $5,132,000 |
| 2024 | $2,272,063 | $(305,928) |
|
| $991,218 | $81,079 | $28.93 | $(20,110,000) |
| 2023 | $2,789,528 | $2,298,481 |
|
| $950,042 | $322,486 | $85.18 | $(17,566,000) |
____________
(1) Our PEO for 2025 was Stephen Silvestro, who served as our interim Chief Executive Officer from January 1, 2025 through March 10, 2025 and as our Chief Executive Officer since March 10, 2025. For 2024 and 2023, our PEO was William Febbo, who served as our Chief Executive Officer during 2024 and 2023.
(2) The dollar amounts reported in this column represent the average of the amounts reported for our other NEOs in the “Total” column of the SCT in each applicable year. Our other NEOs in 2025 were Edward Stelmakh and Theresa Greco and, in 2024 and 2023, our other NEOs were Edward Stelmakh and Stephen Silvestro.
(3) SEC rules require certain adjustments be made to the SCT total compensation to determine “compensation actually paid” for purposes of the Pay versus Performance Table, which are detailed for 2025 in the table below. Neither our PEO nor our other NEOs participated in a defined benefit plan; therefore, no adjustment for pension benefits is included in the table below.
| Year | Position | Reported SCT | [Less] | [Plus/Minus] | [Equals] |
| 2025 | PEO | $2,717,717 | $(1,586,494) | $2,714,974 | $3,846,197 |
| Other NEOs Average | $1,534,218 | $(674,496) | $1,551,085 | $2,410,807 |
____________
(a) Represents the grant date fair value of equity awards reported in the “Stock Awards” and “Option Awards” columns of the SCT for 2025.
(b) The equity award adjustments include the addition (or subtraction, as applicable) of the following: (i) the year-end fair value of any equity awards granted in the applicable year that are outstanding and unvested as of the end of the year; (ii) the amount of change as of the end of the applicable year (from the end of the prior fiscal year) in fair value of any awards granted in prior years that are outstanding and unvested as of the end of the applicable year; (iii) for awards that are granted and vest in same applicable year, the fair value as of the vesting date; (iv) for awards granted in prior years that vest in the applicable year, the amount equal to the change as of the vesting date (from the end of the prior fiscal year) in fair value; and (v) for awards granted in prior years that are determined to fail to meet the applicable vesting conditions during the applicable year, a deduction for the amount equal to the fair value at the end of the prior fiscal year. The valuation methodologies and assumptions used to calculate fair values did not materially differ from those disclosed at the time of grant.
The amounts deducted or added in calculting the equity award adjustments are as follows:
| Fiscal | Executives | [Plus] | [Plus] | [Plus] Fair Value | [Plus] Change | [Less] Fair | Total Equity |
| 2025 | PEO | $1,519,992 | $608,031 | $586,951 | $0 | $0 | $2,714,974 |
| Other NEOs | $492,277 | $450,481 | $608,327 | $0 | $0 | $1,551,085 |
(4) TSR is determined based on the value of an initial fixed investment of $100 in the Company’s Common Stock at December 31, 2022.
(5) The dollar amounts reported represent the amount of net income (loss) reflected in the Company’s audited financial statements for the applicable year.
| Year | Position | Reported SCT | [Less] | [Plus/Minus] | [Equals] |
| 2025 | PEO | $2,717,717 | $(1,586,494) | $2,714,974 | $3,846,197 |
| Other NEOs Average | $1,534,218 | $(674,496) | $1,551,085 | $2,410,807 |
____________
(a) Represents the grant date fair value of equity awards reported in the “Stock Awards” and “Option Awards” columns of the SCT for 2025.
(b) The equity award adjustments include the addition (or subtraction, as applicable) of the following: (i) the year-end fair value of any equity awards granted in the applicable year that are outstanding and unvested as of the end of the year; (ii) the amount of change as of the end of the applicable year (from the end of the prior fiscal year) in fair value of any awards granted in prior years that are outstanding and unvested as of the end of the applicable year; (iii) for awards that are granted and vest in same applicable year, the fair value as of the vesting date; (iv) for awards granted in prior years that vest in the applicable year, the amount equal to the change as of the vesting date (from the end of the prior fiscal year) in fair value; and (v) for awards granted in prior years that are determined to fail to meet the applicable vesting conditions during the applicable year, a deduction for the amount equal to the fair value at the end of the prior fiscal year. The valuation methodologies and assumptions used to calculate fair values did not materially differ from those disclosed at the time of grant.
The amounts deducted or added in calculting the equity award adjustments are as follows:
| Fiscal | Executives | [Plus] | [Plus] | [Plus] Fair Value | [Plus] Change | [Less] Fair | Total Equity |
| 2025 | PEO | $1,519,992 | $608,031 | $586,951 | $0 | $0 | $2,714,974 |
| Other NEOs | $492,277 | $450,481 | $608,327 | $0 | $0 | $1,551,085 |
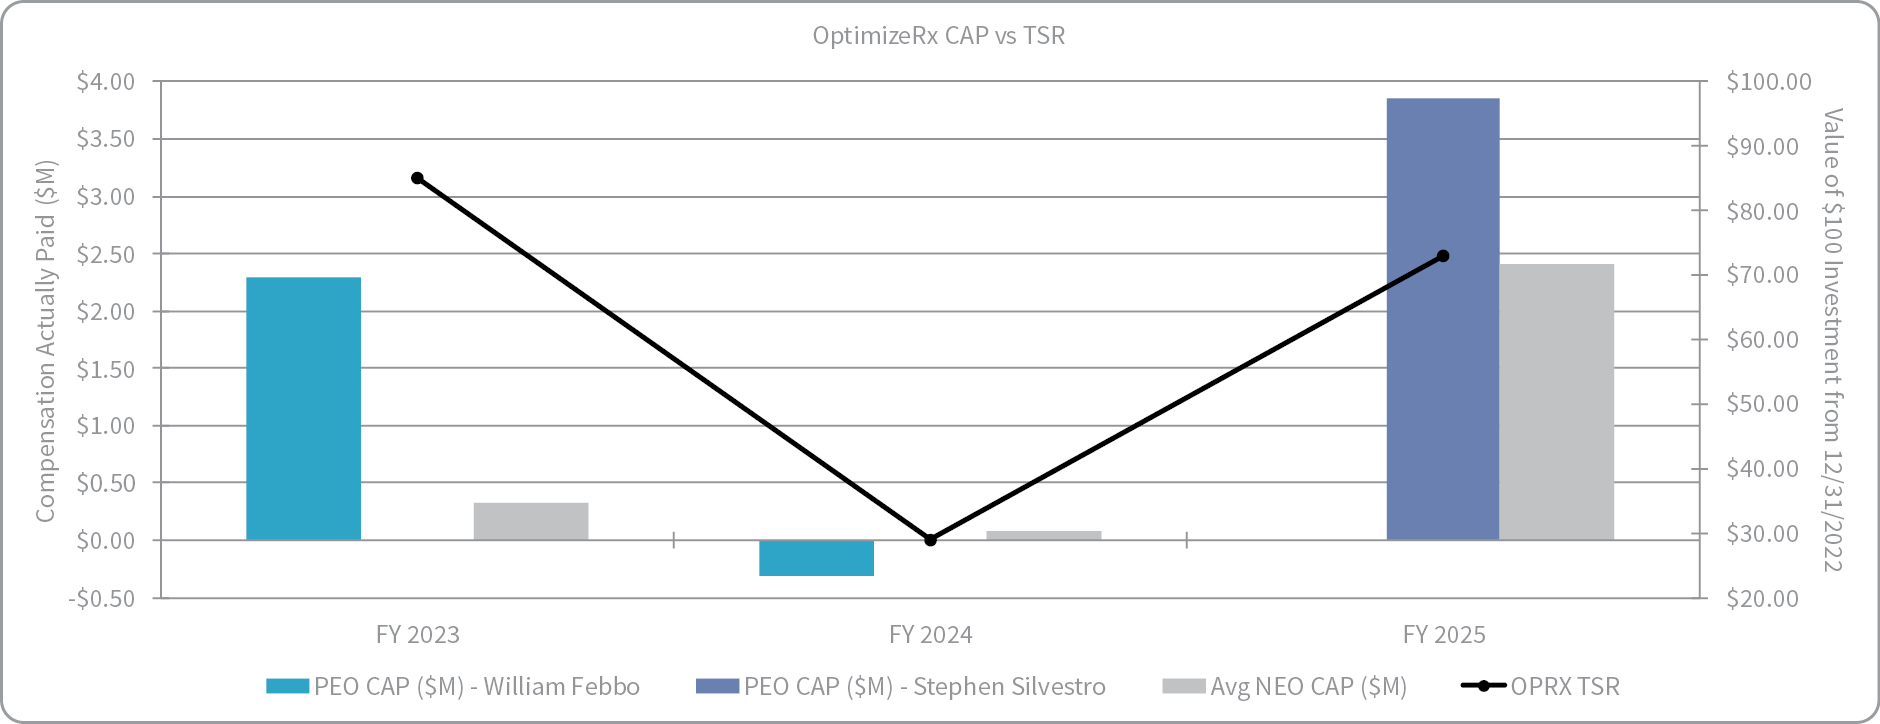
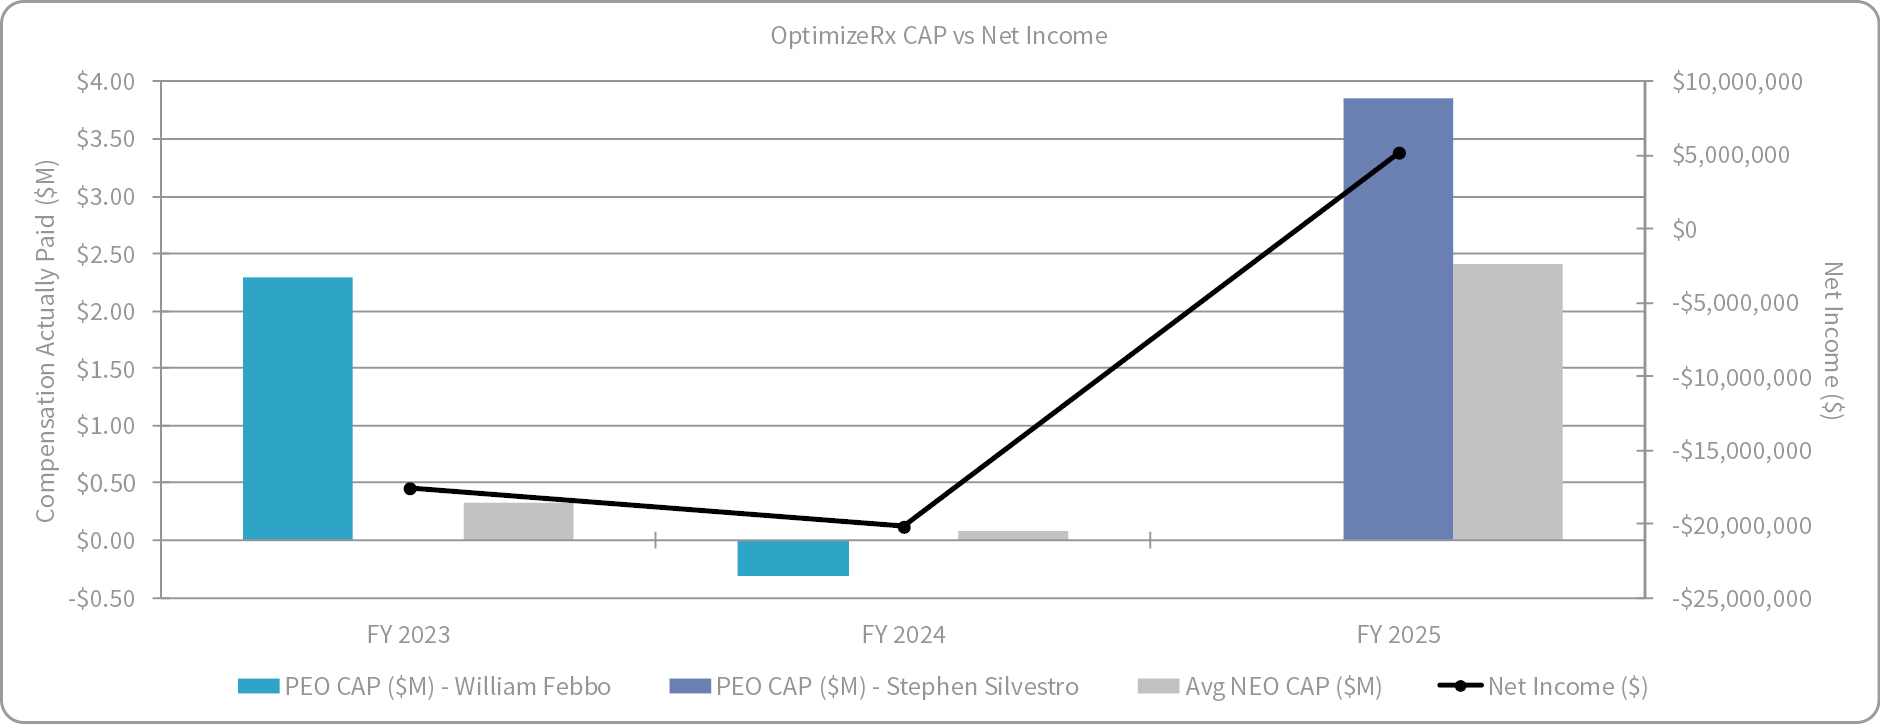
Comparisons
The charts below show, for the past three years, the following: the relationship of “compensation actually paid” to our PEOs and, on average, to our other NEOs as a group and each of (a) the Company’s TSR, and (b) the Company’s net income (loss).
The amounts deducted or added in calculting the equity award adjustments are as follows:
| Fiscal | Executives | [Plus] | [Plus] | [Plus] Fair Value | [Plus] Change | [Less] Fair | Total Equity |
| 2025 | PEO | $1,519,992 | $608,031 | $586,951 | $0 | $0 | $2,714,974 |
| Other NEOs | $492,277 | $450,481 | $608,327 | $0 | $0 | $1,551,085 |
| [1] | The dollar amounts reported in this column represent the average of the amounts reported for our other NEOs in the “Total” column of the SCT in each applicable year. Our other NEOs in 2025 were Edward Stelmakh and Theresa Greco and, in 2024 and 2023, our other NEOs were Edward Stelmakh and Stephen Silvestro. | ||||||||||||||||||||||||||||||||||||||||||
| [2] | SEC rules require certain adjustments be made to the SCT total compensation to determine “compensation actually paid” for purposes of the Pay versus Performance Table, which are detailed for 2025 in the table below. Neither our PEO nor our other NEOs participated in a defined benefit plan; therefore, no adjustment for pension benefits is included in the table below.
____________ (a) Represents the grant date fair value of equity awards reported in the “Stock Awards” and “Option Awards” columns of the SCT for 2025. (b) The equity award adjustments include the addition (or subtraction, as applicable) of the following: (i) the year-end fair value of any equity awards granted in the applicable year that are outstanding and unvested as of the end of the year; (ii) the amount of change as of the end of the applicable year (from the end of the prior fiscal year) in fair value of any awards granted in prior years that are outstanding and unvested as of the end of the applicable year; (iii) for awards that are granted and vest in same applicable year, the fair value as of the vesting date; (iv) for awards granted in prior years that vest in the applicable year, the amount equal to the change as of the vesting date (from the end of the prior fiscal year) in fair value; and (v) for awards granted in prior years that are determined to fail to meet the applicable vesting conditions during the applicable year, a deduction for the amount equal to the fair value at the end of the prior fiscal year. The valuation methodologies and assumptions used to calculate fair values did not materially differ from those disclosed at the time of grant. The amounts deducted or added in calculting the equity award adjustments are as follows:
|
||||||||||||||||||||||||||||||||||||||||||
| [3] | TSR is determined based on the value of an initial fixed investment of $100 in the Company’s Common Stock at December 31, 2022. | ||||||||||||||||||||||||||||||||||||||||||
| [4] | The dollar amounts reported represent the amount of net income (loss) reflected in the Company’s audited financial statements for the applicable year. | ||||||||||||||||||||||||||||||||||||||||||
| [5] | Our PEO for 2025 was Stephen Silvestro, who served as our interim Chief Executive Officer from January 1, 2025 through March 10, 2025 and as our Chief Executive Officer since March 10, 2025. For 2024 and 2023, our PEO was William Febbo, who served as our Chief Executive Officer during 2024 and 2023. | ||||||||||||||||||||||||||||||||||||||||||
| [6] | Represents the grant date fair value of equity awards reported in the “Stock Awards” and “Option Awards” columns of the SCT for 2025. | ||||||||||||||||||||||||||||||||||||||||||
| [7] | The equity award adjustments include the addition (or subtraction, as applicable) of the following: (i) the year-end fair value of any equity awards granted in the applicable year that are outstanding and unvested as of the end of the year; (ii) the amount of change as of the end of the applicable year (from the end of the prior fiscal year) in fair value of any awards granted in prior years that are outstanding and unvested as of the end of the applicable year; (iii) for awards that are granted and vest in same applicable year, the fair value as of the vesting date; (iv) for awards granted in prior years that vest in the applicable year, the amount equal to the change as of the vesting date (from the end of the prior fiscal year) in fair value; and (v) for awards granted in prior years that are determined to fail to meet the applicable vesting conditions during the applicable year, a deduction for the amount equal to the fair value at the end of the prior fiscal year. The valuation methodologies and assumptions used to calculate fair values did not materially differ from those disclosed at the time of grant. The amounts deducted or added in calculting the equity award adjustments are as follows:
|