The following performance information provides an indication of the risks of investing in the Fund. Past performance does not indicate how the Fund will perform in the future. The Calendar Year Total Returns chart shows performance year-by-year over the last ten years (Investment Class used for illustrative purposes—returns differ by Class). The Average Annual Total Returns table shows how the Fund’s average annual total returns for various periods compare with those of the Russell 3000 Index, a broad-based measure of U.S. equity market performance, and the Russell Microcap Index and the Russell 2000 Index, indexes that reflect the performance of the particular market segment in which the Fund primarily invests. The Classes have substantially similar returns because they invest in the same portfolio of securities, differing only to the extent that the Service Class has higher expenses than the Investment Class. If Service Class’s expenses had been reflected, returns for that Class would have been lower.
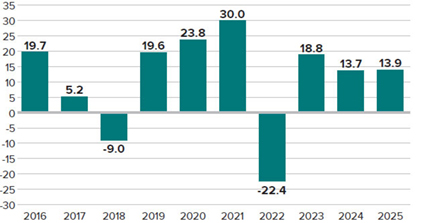
During the period shown in the bar chart, the highest return for a calendar quarter was 35.62% (quarter ended 12/31/20) and the lowest return for a calendar quarter was -31.90% (quarter ended 3/31/20).
The Fund’s total returns do not reflect any deduction for charges or expenses of the variable contracts investing in the Fund. If these costs and expenses were reflected, the returns shown would be lower. Current month-end performance information for all share classes may be obtained at www.royceinvest.com or by calling SS&C GIDS Shareholder Services at (800) 841-1180.
| 1 YEAR | 5 YEAR | 10 YEAR | |
| Investment Class | |||
| Return Before Taxes | 13.89 | 9.17 | 10.14 |
| Service Class | |||
| Return Before Taxes | 13.58 | 8.85 | 9.86 |
| Russell 3000 Index | |||
| (Reflects no deductions for fees, expenses, or taxes) | 17.15 | 13.15 | 14.29 |
| Russell Microcap Index | |||
| (Reflects no deductions for fees, expenses, or taxes) | 22.98 | 7.32 | 9.58 |
| Russell 2000 Index | |||
| (Reflects no deductions for fees, expenses, or taxes) | 12.81 | 6.09 | 9.62 |
The following performance information provides an indication of the risks of investing in the Fund. Past performance does not indicate how the Fund will perform in the future. The Calendar Year Total Returns chart shows performance year-by-year over the last ten years (Investment Class used for illustrative purposes—returns differ by Class). The Average Annual Total Returns table shows how the Fund’s average annual total returns for various periods compare with those of the Russell 3000 Index, a broad-based measure of U.S. equity market performance, and the Russell 2000 Value Index and the Russell 2000 Index, indexes that reflect the performance of the particular market segment in which the Fund primarily invests. Each Class has substantially similar returns because they invest in the same portfolio of securities, differing only to the extent that the Service Class has higher expenses than the Investment Class. If Service Class’s expenses had been reflected, returns for that Class would have been lower.
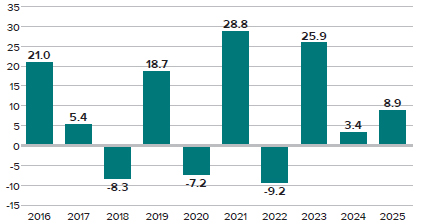
During the period shown in the bar chart, the highest return for a calendar quarter was 26.53% (quarter ended 12/31/20) and the lowest return for a calendar quarter was -39.32% (quarter ended 3/31/20).
The Fund’s total returns do not reflect any deduction for charges or expenses of the variable contracts investing in the Fund. If these costs and expenses were reflected, the returns shown would be lower. Current month-end performance information for all share classes may be obtained at www.royceinvest.com or by calling SS&C GIDS Shareholder Services at (800) 841-1180.
| 1 YEAR | 5 YEAR | 10 YEAR | |
| Investment Class | |||
| Return Before Taxes | 8.93 | 10.66 | 7.88 |
| Service Class | |||
| Return Before Taxes | 8.73 | 10.40 | 7.63 |
| Russell 3000 Index | |||
| (Reflects no deductions for fees, expenses, or taxes) | 17.15 | 13.15 | 14.29 |
| Russell 2000 Value Index | |||
| (Reflects no deductions for fees, expenses, or taxes) | 12.59 | 8.88 | 9.27 |
| Russell 2000 Index | |||
| (Reflects no deductions for fees, expenses, or taxes) | 12.81 | 6.09 | 9.62 |