Pay Versus Performance
The disclosure provided in this section is required by the SEC and does not necessarily align with the Company’s view of the relationship between its performance and the compensation of its Named Executive Officers. We believe our discussion in the “Compensation Discussion and Analysis” properly outlines how we view our executive compensation structure and how that aligns with the Company’s performance and objectives.
In accordance with Item 402(v) of Regulation S-K, the following table shows the total compensation for our Named Executive Officers for fiscal 2025, 2024, 2023, 2022 and 2021 as set forth in the Summary Compensation Table (the “SCT”) of this proxy statement and in the definitive proxy statement on Schedule 14A filed with the SEC on February 29, 2024, the “compensation actually paid,” as computed in accordance with Items 402(v) of Regulation S-K (the “CAP”), to our CEO, and, on an average basis, the compensation actually paid to our other Named Executive Officers (the “other NEOs”), our total shareholder return (“TSR”), the TSR of the Nasdaq Biotechnology Index, which constitutes the “Peer Group”, our net income, and our revenue, which is our company selected financial measure, all measures over the same time period.
For purposes of the chart below, Drs. Hsiao and Zerhouni and Messrs. Rubin and Logal are the other NEOs for fiscal 2025 2024, and 2023. Drs. Hsiao and Jon Cohen, the Company's former Senior Vice President who retired from the Company in 2022, and Messrs. Rubin and Logal are the other NEOs for fiscal 2022. Dr. Zerhouni's compensation is also taken into consideration in the compensation of our other NEOs with respect to a portion of fiscal 2022; and Drs. Hsiao and Cohen and Messrs. Rubin and Logal are the other NEOs for fiscal 2021.
|
SCT TOTAL |
|
|
|
AVG SCT |
|
AVG CAP |
|
Value of Initial $100 |
|
|
|
|
|
||||||||||
YEAR(1) |
PAY FOR |
|
CAP to |
|
FOR OTHER |
|
TO OTHER |
|
Company |
|
Peer Group |
|
Net |
|
Revenue(6) |
|
||||||||
2025 |
|
1,854,000 |
|
|
1,344,700 |
|
|
1,660,250 |
|
|
1,183,766 |
|
|
31.90 |
|
|
124.75 |
|
|
(225,680 |
) |
|
606,879 |
|
2024 |
|
2,163,800 |
|
|
2,015,925 |
|
|
1,950,675 |
|
|
1,818,205 |
|
|
37.22 |
|
|
93.49 |
|
|
(53,224 |
) |
|
713,142 |
|
2023 |
|
2,277,200 |
|
|
2,173,575 |
|
|
2,031,950 |
|
|
1,925,029 |
|
|
38.23 |
|
|
94.03 |
|
|
(188,863 |
) |
|
863,495 |
|
2022 |
|
972,200 |
|
|
(1,247,785 |
) |
|
803,001 |
|
|
(1,324,485 |
) |
|
31.66 |
|
|
89.90 |
|
|
(328,405 |
) |
|
1,004,196 |
|
2021 |
|
2,103,600 |
|
|
2,396,962 |
|
|
2,298,100 |
|
|
2,789,211 |
|
|
121.77 |
|
|
100.02 |
|
|
(30,143 |
) |
|
1,774,718 |
|
YEAR |
SCT TOTAL |
|
MINUS EQUITY |
|
PLUS YE FV OF |
|
PLUS YOY CHANGE |
|
PLUS YOY CHANGE |
|
CEO CAP |
|
||||||
2025 |
|
1,854,000 |
|
|
400,000 |
|
|
315,000 |
|
|
(279,600 |
) |
|
(144,700 |
) |
|
1,344,700.0 |
|
2024 |
|
2,163,800 |
|
|
710,000 |
|
|
735,000 |
|
|
(125,000 |
) |
|
(47,875 |
) |
|
2,015,925.0 |
|
2023 |
|
2,277,200 |
|
|
824,000 |
|
|
712,000 |
|
|
(37,000 |
) |
|
45,375 |
|
|
2,173,575.0 |
|
2022 |
|
972,200 |
|
|
— |
|
|
— |
|
|
(1,522,307 |
) |
|
(697,678 |
) |
|
(1,247,784.8 |
) |
2021 |
|
2,103,600 |
|
|
1,132,000 |
|
|
1,116,026 |
|
|
390,724 |
|
|
(81,388 |
) |
|
2,396,961.6 |
|
YEAR |
SCT AVERAGE |
|
MINUS EQUITY |
|
PLUS YE FV OF |
|
PLUS YOY CHANGE |
|
PLUS YOY CHANGE |
|
AVG OTHER |
|
||||||
2025 |
|
1,660,250 |
|
|
375,000 |
|
|
295,313 |
|
|
(262,125 |
) |
|
(134,671 |
) |
|
1,183,766 |
|
2024 |
|
1,950,675 |
|
|
665,625 |
|
|
689,063 |
|
|
(115,136 |
) |
|
(40,771 |
) |
|
1,818,205 |
|
2023 |
|
2,031,950 |
|
|
772,500 |
|
|
667,500 |
|
|
(28,298.14 |
) |
|
(26,377.50 |
) |
|
1,925,029 |
|
2022 |
|
803,001 |
|
|
8,801 |
|
|
8,091 |
|
|
(886,469.27 |
) |
|
(1,240,307.41 |
) |
|
(1,324,485 |
) |
2021 |
|
2,298,100 |
|
|
1,202,750 |
|
|
1,116,026 |
|
|
541,633.61 |
|
|
36,202.20 |
|
|
2,789,211 |
|
The fair value of options was determined by using the Black-Scholes option pricing method.
YEAR |
SCT TOTAL |
|
MINUS EQUITY |
|
PLUS YE FV OF |
|
PLUS YOY CHANGE |
|
PLUS YOY CHANGE |
|
CEO CAP |
|
||||||
2025 |
|
1,854,000 |
|
|
400,000 |
|
|
315,000 |
|
|
(279,600 |
) |
|
(144,700 |
) |
|
1,344,700.0 |
|
2024 |
|
2,163,800 |
|
|
710,000 |
|
|
735,000 |
|
|
(125,000 |
) |
|
(47,875 |
) |
|
2,015,925.0 |
|
2023 |
|
2,277,200 |
|
|
824,000 |
|
|
712,000 |
|
|
(37,000 |
) |
|
45,375 |
|
|
2,173,575.0 |
|
2022 |
|
972,200 |
|
|
— |
|
|
— |
|
|
(1,522,307 |
) |
|
(697,678 |
) |
|
(1,247,784.8 |
) |
2021 |
|
2,103,600 |
|
|
1,132,000 |
|
|
1,116,026 |
|
|
390,724 |
|
|
(81,388 |
) |
|
2,396,961.6 |
|
YEAR |
SCT AVERAGE |
|
MINUS EQUITY |
|
PLUS YE FV OF |
|
PLUS YOY CHANGE |
|
PLUS YOY CHANGE |
|
AVG OTHER |
|
||||||
2025 |
|
1,660,250 |
|
|
375,000 |
|
|
295,313 |
|
|
(262,125 |
) |
|
(134,671 |
) |
|
1,183,766 |
|
2024 |
|
1,950,675 |
|
|
665,625 |
|
|
689,063 |
|
|
(115,136 |
) |
|
(40,771 |
) |
|
1,818,205 |
|
2023 |
|
2,031,950 |
|
|
772,500 |
|
|
667,500 |
|
|
(28,298.14 |
) |
|
(26,377.50 |
) |
|
1,925,029 |
|
2022 |
|
803,001 |
|
|
8,801 |
|
|
8,091 |
|
|
(886,469.27 |
) |
|
(1,240,307.41 |
) |
|
(1,324,485 |
) |
2021 |
|
2,298,100 |
|
|
1,202,750 |
|
|
1,116,026 |
|
|
541,633.61 |
|
|
36,202.20 |
|
|
2,789,211 |
|
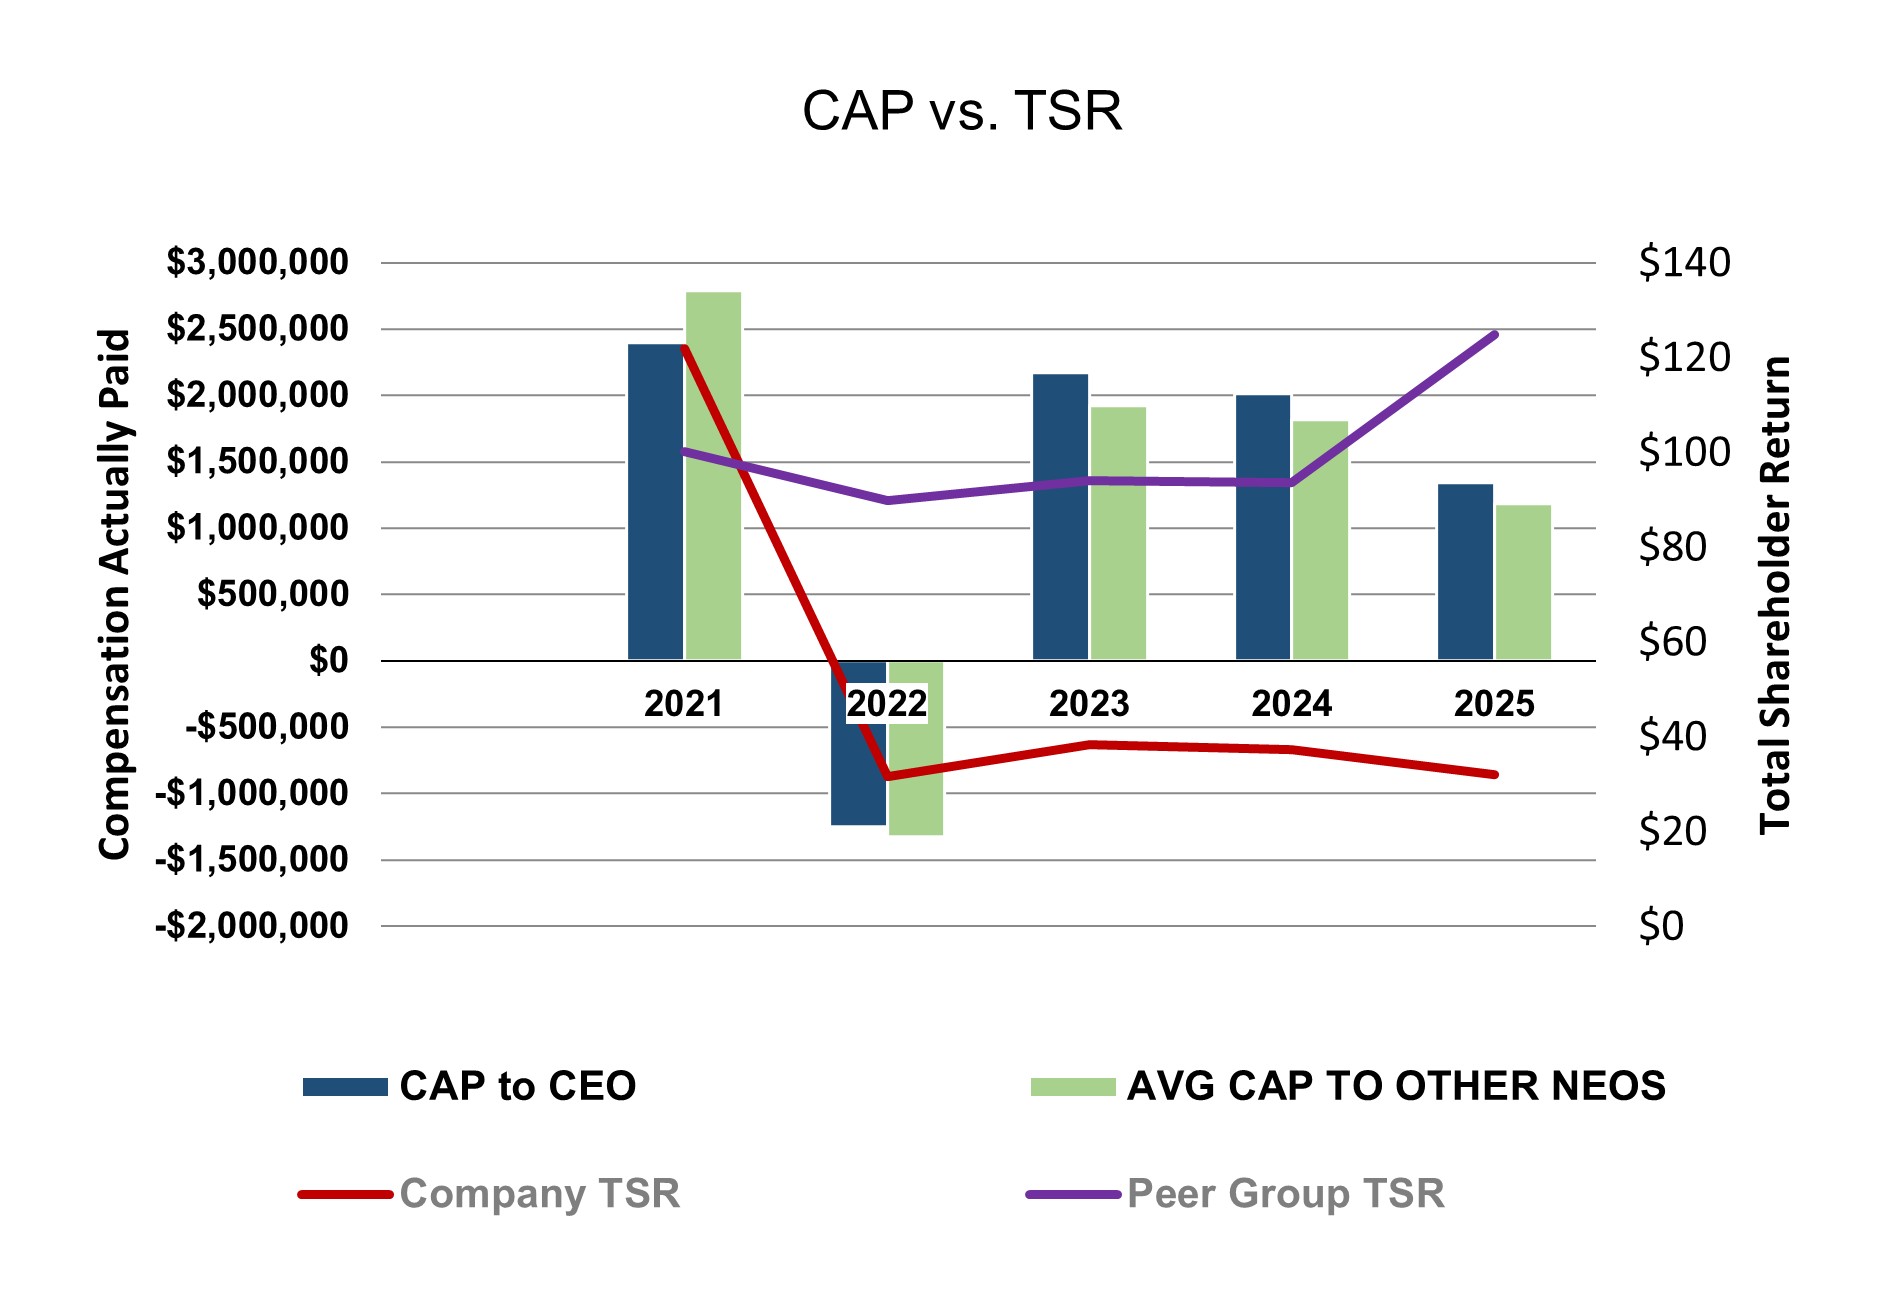
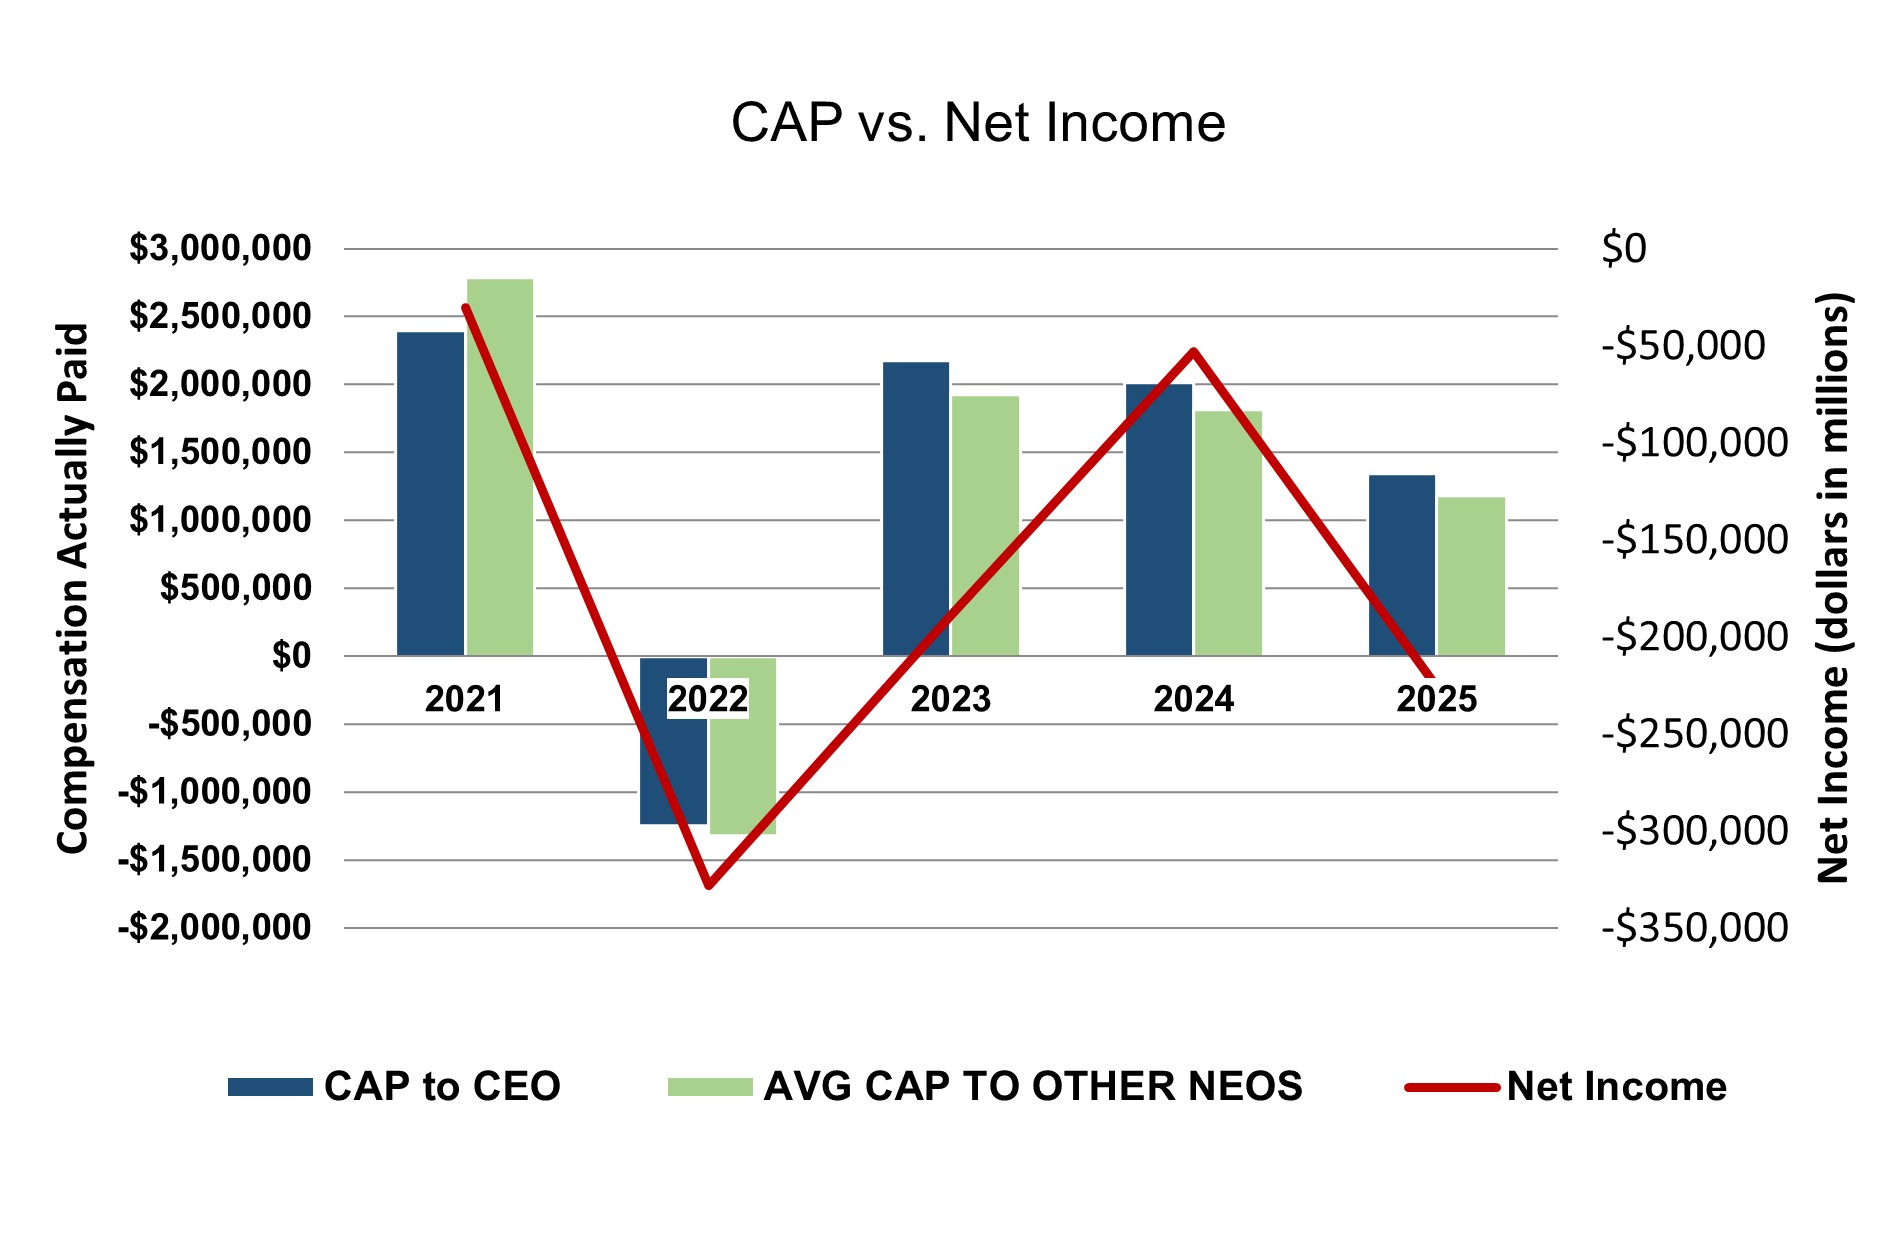
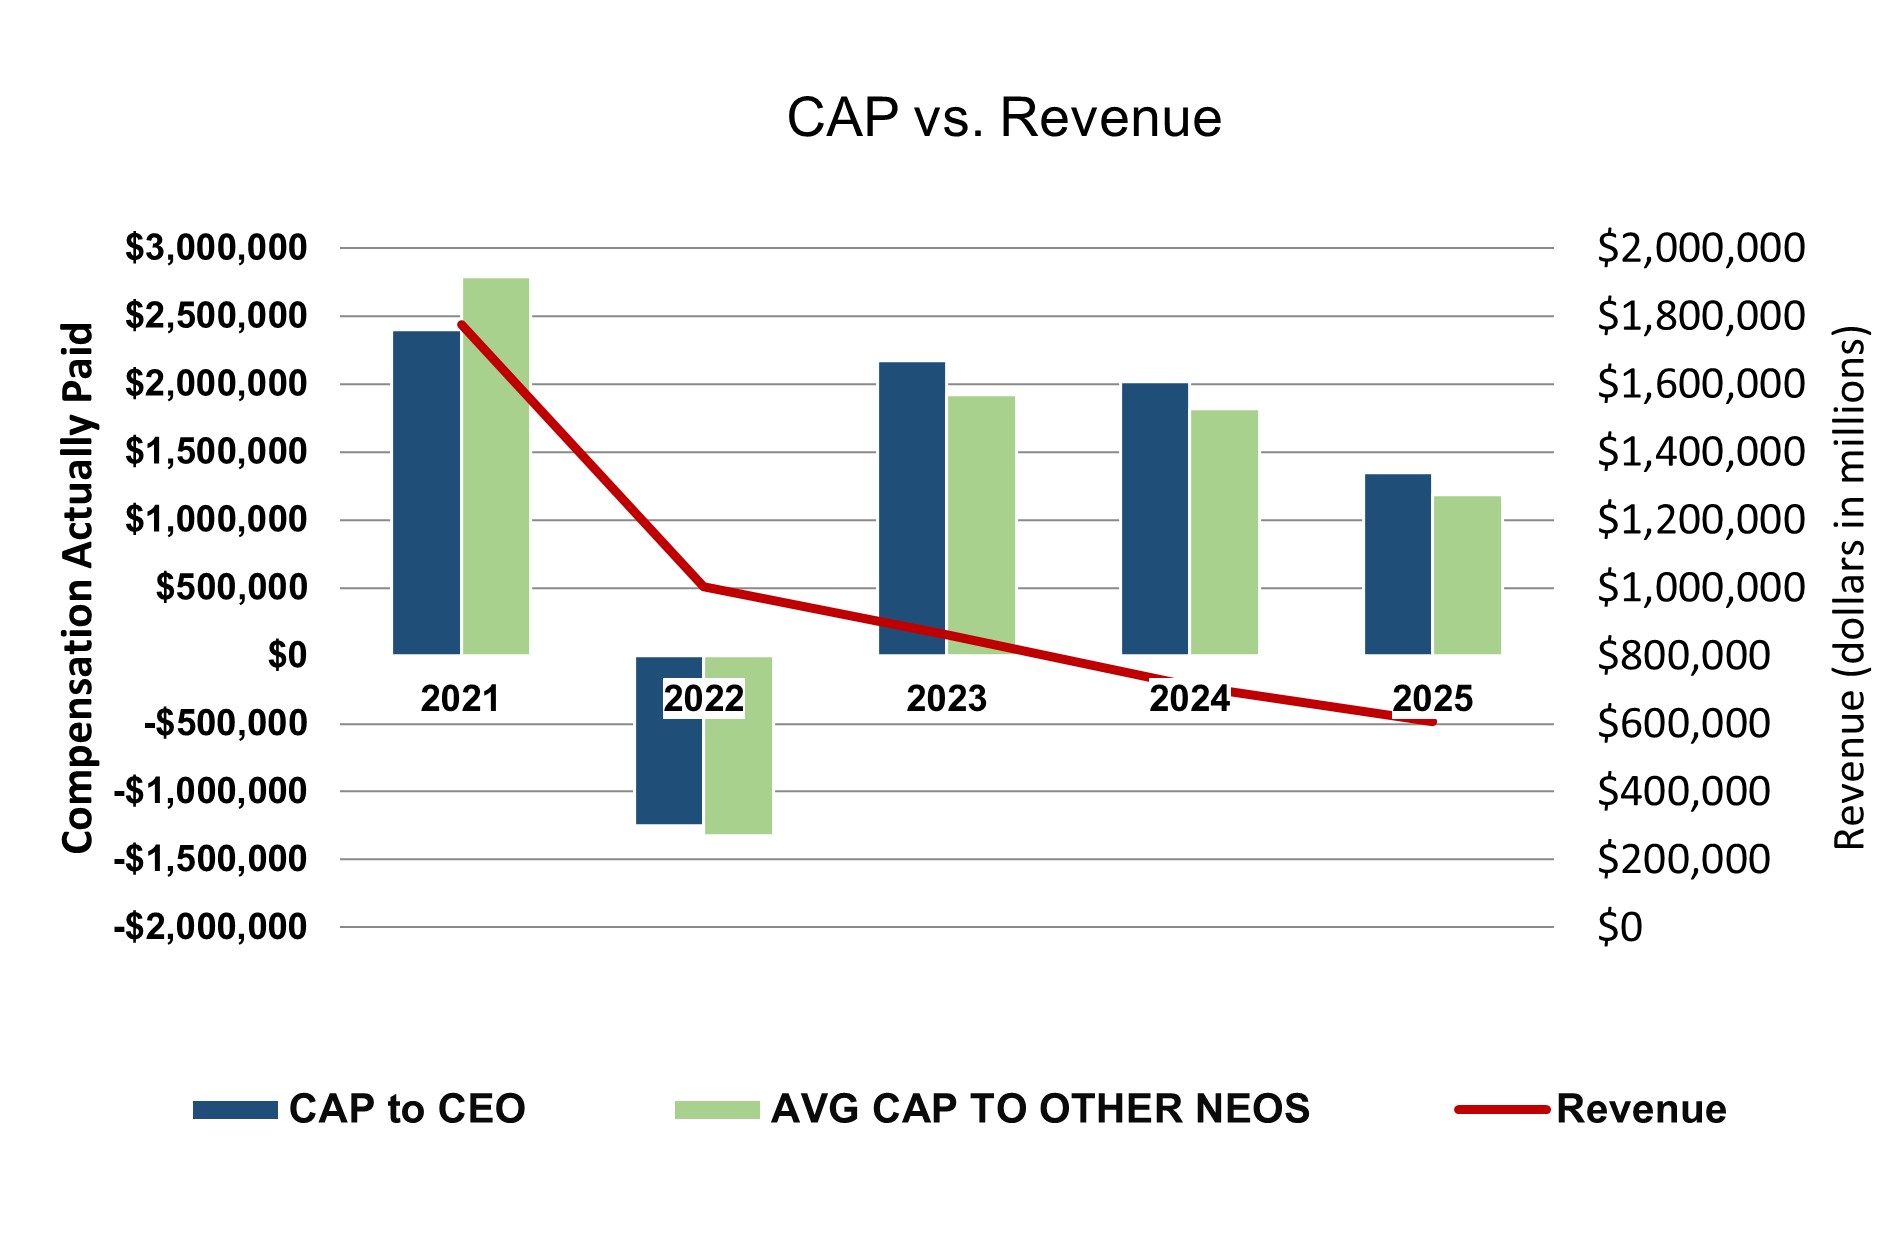
Relationship Between “Compensation Actually Paid” and Performance Measures. The charts below compare the CAP to our CEO and the average CAP to our other NEOs with (i) our TSR, (ii) our net income, and (iii) revenue, which is our company selected measure, for fiscal 2025, 2024, 2023, 2022 and 2021. In addition, the charts below compare our TSR with our Peer Group TSR. We believe the CAP in each of the years reported above aligns with the performance metrics presented.
Non-Financial Performance Measures. The Company also considered the success, failure or progress made with respect to its R&D pipeline in setting pay-for performance compensation for fiscal 2025, as well as certain strategic transactions, including a sale of certain assets of BioReference.
Financial Performance Measures. The most important financial performance measures used by the Company in setting pay-for-performance compensation for fiscal 2025 are set forth below, in no particular order.
-Adjusted Operating Income
-Revenue
-Relative Total Shareholder Return