Pay vs Performance Disclosure - USD ($)
|
12 Months Ended |
Dec. 31, 2025 |
Dec. 31, 2024 |
Dec. 31, 2023 |
Dec. 31, 2022 |
Dec. 31, 2021 |
| Pay vs Performance Disclosure |
|
|
|
|
|
| Pay vs Performance Disclosure, Table |
| | | | | | | | | | | | | | | | | | | | | | | | | | | | | | | | | | | | | | | | | | | | | | | | | | |
Year (1) | |
Summary Compensation Table Total for PEO ($)(2) | |
Compensation Actually Paid to PEO ($)(3)(4) | | Average Summary Compensation Table Total for Non-PEO NEOs ($)(2) | |
Average Compensation Actually Paid to Non-PEO NEOs ($)(3)(4) | | Value of Initial Fixed $100 Investment Based on: | |
GAAP
Net Income ($)(7) | | Company Selected Measure (8) | | | | | | Total Shareholder Return ($)(5) | | Peer Group Total Shareholder Return ($)(6) | | | | 2025 | | 8,708,648 | | 55,529,782 | | 3,022,489 | | 16,985,222 | | 35.71 | | 124.75 | | -303 | | N/A | | 2024 | | 13,427,668 | | 20,637,736 | | 3,981,473 | | 5,322,101 | | 9.33 | | 93.49 | | -183 | | N/A | | 2023 | | 2,120,512 | | 1,398,586 | | 933,453 | | 726,983 | | 2.70 | | 94.03 | | -123 | | N/A | | 2022 | | 6,028,078 | | -17,643,206 | | 2,450,241 | | -1,656,422 | | 4.33 | | 89.90 | | -214 | | N/A | | 2021 | | 10,905,820 | | -62,152,872 | | 4,118,514 | | -6,315,773 | | 35.81 | | 100.02 | | -167 | | N/A |
|
|
|
|
|
| Named Executive Officers, Footnote |
The PEO (CEO) for all reporting years is Marcio Souza. The non-PEO NEOs in the 2025, 2024 and 2023 reporting years are Timothy Kelly and Alex Nemiroff. The non-PEO NEOs in the 2022 reporting year are Timothy Kelly, Nicole Sweeny and Bernard Ravina. The non-PEO NEOs in the 2021 reporting year are Nicole Sweeny and Bernard Ravina.
|
|
|
|
|
| Peer Group Issuers, Footnote |
Peer Group Total Shareholder Return represents the cumulative return on a fixed investment of $100 in the Nasdaq Biotechnology (Total Return) Index (“XNBI”) for the period beginning on the last trading day of fiscal year 2020 through the end of the applicable fiscal year, assuming reinvestment of dividends. The peer group index was updated from the S&P Biotechnology Select Industry Total Return Index (“SPSIBITR”) to better reflect our industry alignment. In comparison, the value of the $100 invested in the S&P Biotechnology Select Industry Total Return Index would be the following: 2025: $87.80; 2024: $64.57; 2023: $63.82; 2022: $59.22; 2021: $79.62.
|
|
|
|
|
| PEO Total Compensation Amount |
$ 8,708,648
|
$ 13,427,668
|
$ 2,120,512
|
$ 6,028,078
|
$ 10,905,820
|
| PEO Actually Paid Compensation Amount |
$ 55,529,782
|
20,637,736
|
1,398,586
|
(17,643,206)
|
(62,152,872)
|
| Adjustment To PEO Compensation, Footnote |
CAP has been calculated based on the requirements and methodology set forth in the applicable SEC rules (Item 402(v) of Regulation S-K). The CAP calculation includes the end-of-year value of awards granted within the fiscal year, the change in fair value from prior year end of vested awards and the change in the fair value of unvested awards granted in prior years, regardless of if, when, or at which intrinsic value they will actually vest. To calculate CAP for 2025, the following amounts were deducted from and added to the total compensation number shown in the SCT: | | | | | | | | | | | | | 2025 | | PEO ($) | | Average
Non-PEO NEOs ($) | | | | Summary Compensation Table Total | 8,708,648 | | 3,022,489 | Less Change in Pension Value Reported in Summary Compensation Table | 0 | | 0 | Less values of Stock Awards and Option Awards Reported in Summary Compensation Table for the Covered Year | 6,059,250 | | 1,918,763 | Plus Fair Value of Equity Awards Granted During Fiscal Year that are Outstanding and Unvested at End of Year | 28,699,590 | | 9,088,203 | Plus (Less) Change in Fair Value of Equity Awards Granted in Any Prior Fiscal Year that are Outstanding and Unvested at End of Year | 23,691,477 | | 6,740,903 | Plus Fair Value at Vesting Date of Equity Awards Granted and Vested During the Fiscal Year | 0 | | 0 | Plus (Less) Change in Fair Value of Equity Awards granted in Prior Years that Vested During the Fiscal Year | 489,317 | | 52,390 | Less Fair Value of Equity Awards Granted in Prior Year that were Forfeited During the Fiscal Year | 0 | | 0 | Plus Value of Dividends or Other Earnings Paid on Equity Awards not Otherwise Reflected in Fair Value or Total Compensation | 0 | | 0 | | Compensation Actually Paid | 55,529,782 | | 16,985,222 |
(4)The fair value of stock options reported for CAP purposes is estimated using a Black-Scholes option pricing model for the purposes of this PVP calculation in accordance with FASB ASC Topic 718 and SEC rules. This model uses both historical data and current market data to estimate the fair value of options and requires several assumptions. The assumptions used in estimating fair value for awards outstanding during 2025 are as follows: | | | | | | | | | | | 2025 | | Volatility | | 78.01% - 106.04% | | Expected life (in years) | | 0.5 - 8.0 years | | Expected dividend yield | | 0.00% | | Risk-free rate | | 3.41% - 4.56% |
|
|
|
|
|
| Non-PEO NEO Average Total Compensation Amount |
$ 3,022,489
|
3,981,473
|
933,453
|
2,450,241
|
4,118,514
|
| Non-PEO NEO Average Compensation Actually Paid Amount |
$ 16,985,222
|
5,322,101
|
726,983
|
(1,656,422)
|
(6,315,773)
|
| Adjustment to Non-PEO NEO Compensation Footnote |
CAP has been calculated based on the requirements and methodology set forth in the applicable SEC rules (Item 402(v) of Regulation S-K). The CAP calculation includes the end-of-year value of awards granted within the fiscal year, the change in fair value from prior year end of vested awards and the change in the fair value of unvested awards granted in prior years, regardless of if, when, or at which intrinsic value they will actually vest. To calculate CAP for 2025, the following amounts were deducted from and added to the total compensation number shown in the SCT: | | | | | | | | | | | | | 2025 | | PEO ($) | | Average
Non-PEO NEOs ($) | | | | Summary Compensation Table Total | 8,708,648 | | 3,022,489 | Less Change in Pension Value Reported in Summary Compensation Table | 0 | | 0 | Less values of Stock Awards and Option Awards Reported in Summary Compensation Table for the Covered Year | 6,059,250 | | 1,918,763 | Plus Fair Value of Equity Awards Granted During Fiscal Year that are Outstanding and Unvested at End of Year | 28,699,590 | | 9,088,203 | Plus (Less) Change in Fair Value of Equity Awards Granted in Any Prior Fiscal Year that are Outstanding and Unvested at End of Year | 23,691,477 | | 6,740,903 | Plus Fair Value at Vesting Date of Equity Awards Granted and Vested During the Fiscal Year | 0 | | 0 | Plus (Less) Change in Fair Value of Equity Awards granted in Prior Years that Vested During the Fiscal Year | 489,317 | | 52,390 | Less Fair Value of Equity Awards Granted in Prior Year that were Forfeited During the Fiscal Year | 0 | | 0 | Plus Value of Dividends or Other Earnings Paid on Equity Awards not Otherwise Reflected in Fair Value or Total Compensation | 0 | | 0 | | Compensation Actually Paid | 55,529,782 | | 16,985,222 |
(4)The fair value of stock options reported for CAP purposes is estimated using a Black-Scholes option pricing model for the purposes of this PVP calculation in accordance with FASB ASC Topic 718 and SEC rules. This model uses both historical data and current market data to estimate the fair value of options and requires several assumptions. The assumptions used in estimating fair value for awards outstanding during 2025 are as follows: | | | | | | | | | | | 2025 | | Volatility | | 78.01% - 106.04% | | Expected life (in years) | | 0.5 - 8.0 years | | Expected dividend yield | | 0.00% | | Risk-free rate | | 3.41% - 4.56% |
|
|
|
|
|
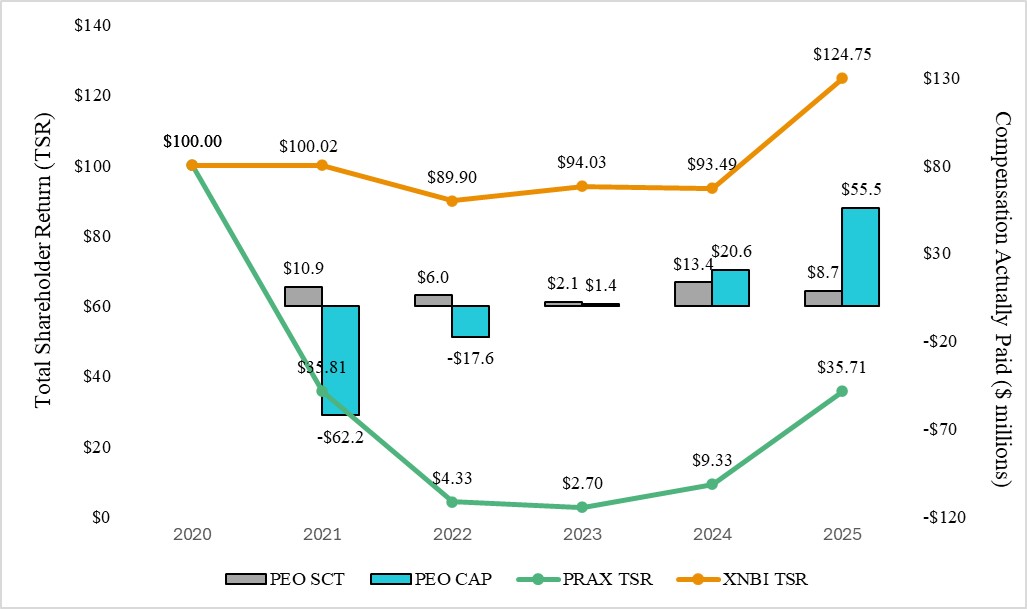
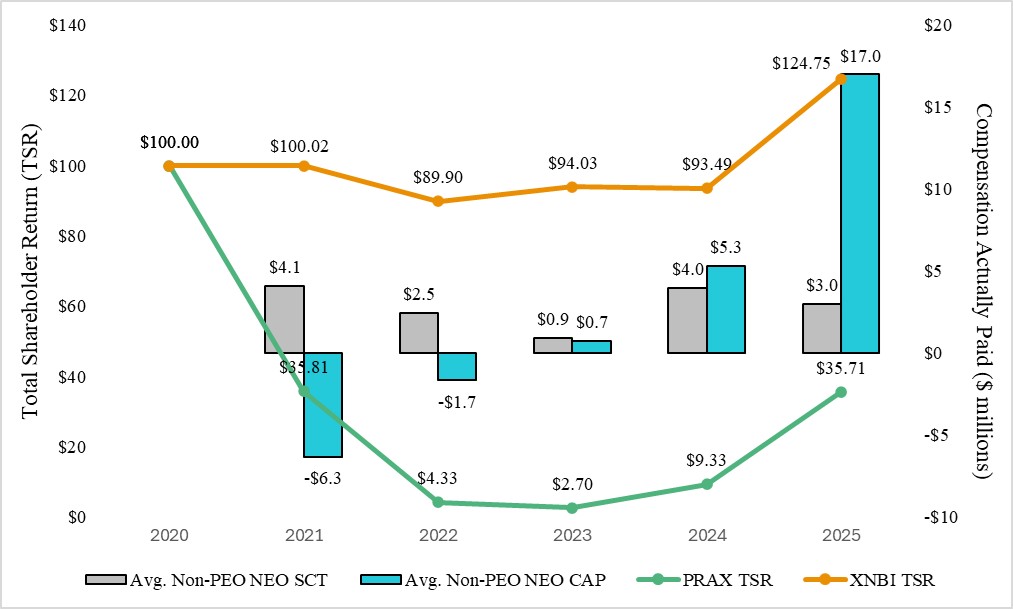
| Compensation Actually Paid vs. Total Shareholder Return |
CEO Pay vs Performance: Total Shareholder Return (12/31/20 to 12/31/25) Average Other NEO Pay vs Performance: Total Shareholder Return (12/31/20 to 12/31/25)
|
|
|
|
|
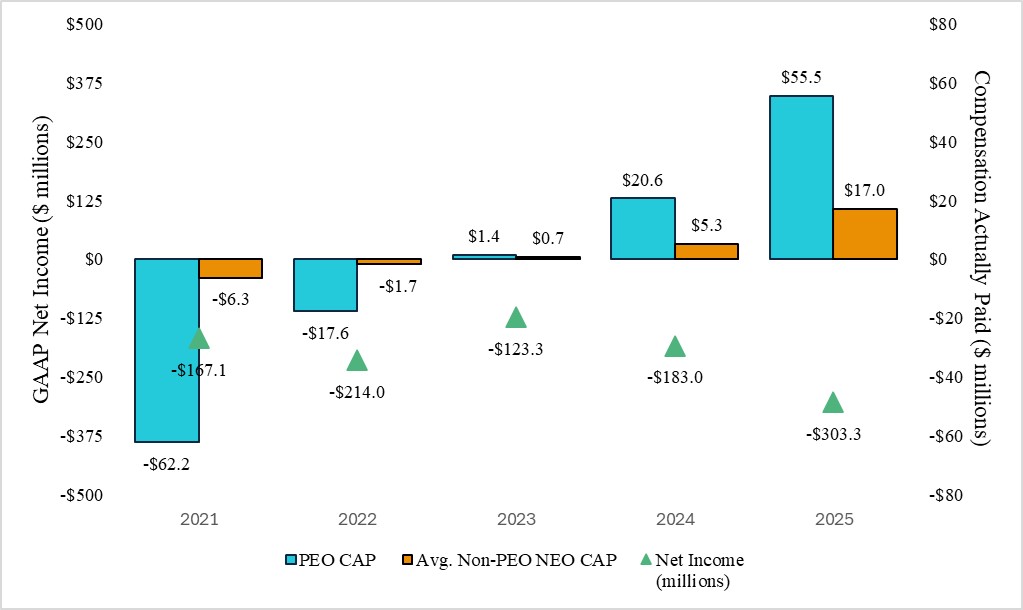
| Compensation Actually Paid vs. Net Income |
The graph below reflects the relationship between the PEO and Average Non-PEO NEO CAP and the Company’s GAAP Net Income for the applicable reporting year.
|
|
|
|
|
| Total Shareholder Return Amount |
$ 35.71
|
9.33
|
2.70
|
4.33
|
35.81
|
| Peer Group Total Shareholder Return Amount |
124.75
|
93.49
|
94.03
|
89.90
|
100.02
|
| Net Income (Loss) |
$ (303,000,000)
|
$ (183,000,000)
|
$ (123,000,000)
|
$ (214,000,000)
|
$ (167,000,000)
|
| PEO Name |
Marcio Souza
|
|
|
|
|
| Additional 402(v) Disclosure |
In accordance with the SEC’s disclosure requirements regarding pay versus performance (“PVP”) this section presents the SEC-defined Compensation Actually Paid (“CAP”). Also required by the SEC, this section compares CAP to various measures used to gauge performance at Praxis. Compensation decisions at Praxis are made independently of disclosure requirements. CAP is a supplemental measure to be viewed alongside performance measures as an addition to the philosophy and strategy of compensation-setting discussed elsewhere in the overview of the executive compensation program, not in replacement. Pay versus Performance Table - Compensation Definitions Salary, Bonus, Non-Equity Incentive Plan Compensation, and All Other Compensation are each calculated in the same manner for purposes of both CAP and Summary Compensation Table (“SCT”) values. The primary difference between the calculation of CAP and SCT total compensation is “Stock Awards” and “Option Awards.” | | | | | | | | | | | | | | | | | SCT Total | | CAP | | Stock and Option Awards | | Grant date fair value of stock and option awards granted during the year | | Change in the fair value of stock and option awards that are unvested as of the end of the year, or vested or were forfeited during the year, as compared to the value of such awards as of the end of the prior year |
The graphs below reflect the relationship between the PEO and Average Non-PEO NEO CAP and the Company’s cumulative indexed TSR, as well as the relationship between our TSR and the TSR of our Peer Group for the fiscal years ended December 31, 2021, 2022, 2023, 2024 and 2025: We do not currently use any financial performance measures to link executive compensation actually paid to our performance and therefore, no tabular list is reported. The metrics that we use for incentive awards instead focus on clinical, research and development and general business-related objectives.
|
|
|
|
|
| Fair Value Assumptions, Volatility Rate, Minimum |
78.01%
|
|
|
|
|
| Fair Value Assumptions, Volatility Rate, Maximum |
106.04%
|
|
|
|
|
| Fair Value Assumptions, Expected Term, Minimum |
6 months
|
|
|
|
|
| Fair Value Assumptions, Expected Term, Maximum |
8 years
|
|
|
|
|
| Fair Value Assumptions, Expected Dividend Rate |
0.00%
|
|
|
|
|
| Fair Value Assumptions, Risk Free Interest Rate, Minimum |
3.41%
|
|
|
|
|
| Fair Value Assumptions, Risk Free Interest Rate, Maximum |
4.56%
|
|
|
|
|
| Prior Peer Group Total Shareholder Return Amount |
$ 87.80
|
$ 64.57
|
$ 63.82
|
$ 59.22
|
$ 79.62
|
| PEO | Aggregate Change in Present Value of Accumulated Benefit for All Pension Plans Reported in Summary Compensation Table |
|
|
|
|
|
| Pay vs Performance Disclosure |
|
|
|
|
|
| Adjustment to Compensation, Amount |
$ 0
|
|
|
|
|
| PEO | Aggregate Grant Date Fair Value of Equity Award Amounts Reported in Summary Compensation Table |
|
|
|
|
|
| Pay vs Performance Disclosure |
|
|
|
|
|
| Adjustment to Compensation, Amount |
(6,059,250)
|
|
|
|
|
| PEO | Year-end Fair Value of Equity Awards Granted in Covered Year that are Outstanding and Unvested |
|
|
|
|
|
| Pay vs Performance Disclosure |
|
|
|
|
|
| Adjustment to Compensation, Amount |
28,699,590
|
|
|
|
|
| PEO | Year-over-Year Change in Fair Value of Equity Awards Granted in Prior Years That are Outstanding and Unvested |
|
|
|
|
|
| Pay vs Performance Disclosure |
|
|
|
|
|
| Adjustment to Compensation, Amount |
23,691,477
|
|
|
|
|
| PEO | Vesting Date Fair Value of Equity Awards Granted and Vested in Covered Year |
|
|
|
|
|
| Pay vs Performance Disclosure |
|
|
|
|
|
| Adjustment to Compensation, Amount |
0
|
|
|
|
|
| PEO | Change in Fair Value as of Vesting Date of Prior Year Equity Awards Vested in Covered Year |
|
|
|
|
|
| Pay vs Performance Disclosure |
|
|
|
|
|
| Adjustment to Compensation, Amount |
489,317
|
|
|
|
|
| PEO | Prior Year End Fair Value of Equity Awards Granted in Any Prior Year that Fail to Meet Applicable Vesting Conditions During Covered Year |
|
|
|
|
|
| Pay vs Performance Disclosure |
|
|
|
|
|
| Adjustment to Compensation, Amount |
0
|
|
|
|
|
| PEO | Dividends or Other Earnings Paid on Equity Awards not Otherwise Reflected in Total Compensation for Covered Year |
|
|
|
|
|
| Pay vs Performance Disclosure |
|
|
|
|
|
| Adjustment to Compensation, Amount |
0
|
|
|
|
|
| Non-PEO NEO | Aggregate Change in Present Value of Accumulated Benefit for All Pension Plans Reported in Summary Compensation Table |
|
|
|
|
|
| Pay vs Performance Disclosure |
|
|
|
|
|
| Adjustment to Compensation, Amount |
0
|
|
|
|
|
| Non-PEO NEO | Aggregate Grant Date Fair Value of Equity Award Amounts Reported in Summary Compensation Table |
|
|
|
|
|
| Pay vs Performance Disclosure |
|
|
|
|
|
| Adjustment to Compensation, Amount |
(1,918,763)
|
|
|
|
|
| Non-PEO NEO | Year-end Fair Value of Equity Awards Granted in Covered Year that are Outstanding and Unvested |
|
|
|
|
|
| Pay vs Performance Disclosure |
|
|
|
|
|
| Adjustment to Compensation, Amount |
9,088,203
|
|
|
|
|
| Non-PEO NEO | Year-over-Year Change in Fair Value of Equity Awards Granted in Prior Years That are Outstanding and Unvested |
|
|
|
|
|
| Pay vs Performance Disclosure |
|
|
|
|
|
| Adjustment to Compensation, Amount |
6,740,903
|
|
|
|
|
| Non-PEO NEO | Vesting Date Fair Value of Equity Awards Granted and Vested in Covered Year |
|
|
|
|
|
| Pay vs Performance Disclosure |
|
|
|
|
|
| Adjustment to Compensation, Amount |
0
|
|
|
|
|
| Non-PEO NEO | Change in Fair Value as of Vesting Date of Prior Year Equity Awards Vested in Covered Year |
|
|
|
|
|
| Pay vs Performance Disclosure |
|
|
|
|
|
| Adjustment to Compensation, Amount |
52,390
|
|
|
|
|
| Non-PEO NEO | Prior Year End Fair Value of Equity Awards Granted in Any Prior Year that Fail to Meet Applicable Vesting Conditions During Covered Year |
|
|
|
|
|
| Pay vs Performance Disclosure |
|
|
|
|
|
| Adjustment to Compensation, Amount |
0
|
|
|
|
|
| Non-PEO NEO | Dividends or Other Earnings Paid on Equity Awards not Otherwise Reflected in Total Compensation for Covered Year |
|
|
|
|
|
| Pay vs Performance Disclosure |
|
|
|
|
|
| Adjustment to Compensation, Amount |
$ 0
|
|
|
|
|