Shareholder Report
|
12 Months Ended |
|
Feb. 28, 2026
USD ($)
Holding
|
|---|
| Shareholder Report [Line Items] |
|
| Document Type |
N-CSR
|
| Amendment Flag |
false
|
| Registrant Name |
Edward Jones Money Market Fund
|
| Entity Central Index Key |
0000314650
|
| Entity Investment Company Type |
N-1A
|
| Document Period End Date |
Feb. 28, 2026
|
| C000024633 [Member] |
|
| Shareholder Report [Line Items] |
|
| Fund Name |
EDWARD JONES MONEY MARKET FUND
|
| Class Name |
RETIREMENT SHARES
|
| Trading Symbol |
JRSXX
|
| Annual or Semi-Annual Statement [Text Block] |
This annual shareholder report contains important information about the Edward Jones Money Market Fund (the “Fund”) for the period of March 1, 2025 to February 28, 2026 (the “Reporting Period”).
|
| Shareholder Report Annual or Semi-Annual |
annual shareholder report
|
| Additional Information [Text Block] |
You can find additional information about the Fund at www.edwardjones.com/moneymarket. You can also request this information by contacting us at
1-800-441-2357.
|
| Additional Information Phone Number |
1-800-441-2357
|
| Additional Information Website |
www.edwardjones.com/moneymarket
|
| Expenses [Text Block] |
What were the Fund costs for the Reporting Period? (Based on a hypothetical $10,000 investment) The below table explains the costs that you would have paid within the Reporting Period.
|
|
|
|
|
|
|
|
|
| |
|
Cost of a
$10,000 investment |
|
|
Cost paid as a
% of a $10,000
investment |
|
| Retirement Shares |
|
$ |
73 |
|
|
|
0.72% |
|
|
| Expenses Paid, Amount |
$ 73
|
| Expense Ratio, Percent |
0.72%
|
| Net Assets |
$ 34,738,107,000
|
| Holdings Count | Holding |
160
|
| Advisory Fees Paid, Amount |
$ 64,007,000
|
| Additional Fund Statistics [Text Block] |
Key Fund Statistics:
|
|
|
|
|
|
|
| Total Net Assets (000s) |
|
$ |
34,738,107 |
|
|
|
| Number of Portfolio Holdings |
|
|
160 |
|
|
|
| Net Advisory Fee (000s) |
|
$ |
64,007 |
|
|
| Holdings [Text Block] |
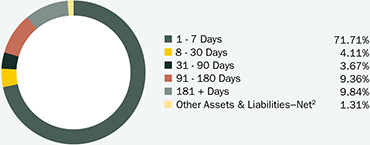
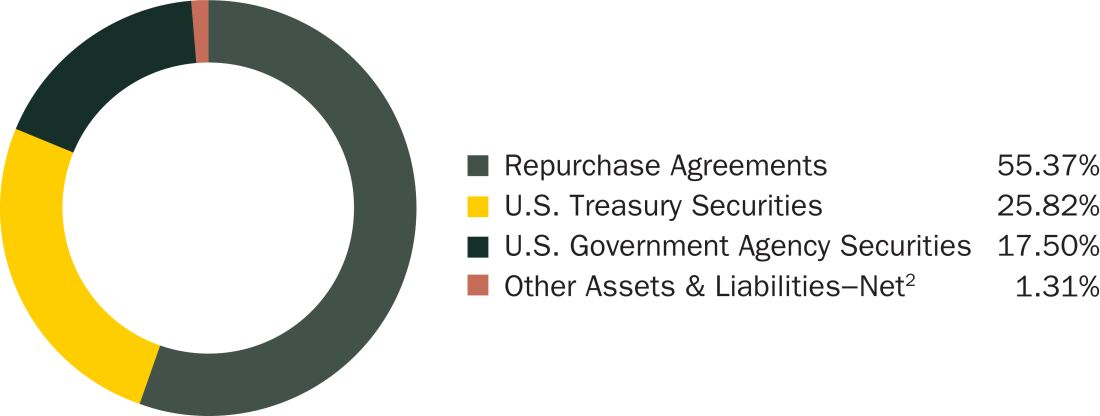
Graphical Representation of Holdings (as a percentage of net assets) Portfolio Composition by Effective Maturity1 Portfolio Composition by Security Type3
| 1 |
Effective maturity is determined in accordance with the requirements of Rule 2a‑7 under the Investment Company Act of 1940, as amended, which regulates money market funds. |
| 2 |
Assets, other than investments in securities, less liabilities. |
| 3 |
See the Fund’s Prospectus and Statement of Additional Information for descriptions of the principal types of securities in which the Fund invests. |
|
| C000024632 [Member] |
|
| Shareholder Report [Line Items] |
|
| Fund Name |
EDWARD JONES MONEY MARKET FUND
|
| Class Name |
INVESTMENT SHARES
|
| Trading Symbol |
JNSXX
|
| Annual or Semi-Annual Statement [Text Block] |
This annual shareholder report contains important information about the Edward Jones Money Market Fund (the “Fund”) for the period of March 1, 2025 to February 28, 2026 (the “Reporting Period”).
|
| Shareholder Report Annual or Semi-Annual |
annual shareholder report
|
| Additional Information [Text Block] |
You can find additional information about the Fund at www.edwardjones.com/moneymarket. You can also request this information by contacting us at
1‑800‑441‑2357.
|
| Additional Information Phone Number |
1‑800‑441‑2357
|
| Additional Information Website |
www.edwardjones.com/moneymarket
|
| Expenses [Text Block] |
What were the Fund costs for the Reporting Period? (Based on a hypothetical $10,000 investment) The below table explains the costs that you would have paid within the Reporting Period.
|
|
|
|
|
|
|
|
|
| |
|
Cost of a
$10,000 investment |
|
|
Cost paid as a
% of a $10,000
investment |
|
| Investment Shares |
|
$ |
72 |
|
|
|
0.71% |
|
|
| Expenses Paid, Amount |
$ 72
|
| Expense Ratio, Percent |
0.71%
|
| Net Assets |
$ 34,738,107,000
|
| Holdings Count | Holding |
160
|
| Advisory Fees Paid, Amount |
$ 64,007,000
|
| Additional Fund Statistics [Text Block] |
Key Fund Statistics:
|
|
|
|
|
|
|
| Total Net Assets (000s) |
|
$ |
34,738,107 |
|
|
|
| Number of Portfolio Holdings |
|
|
160 |
|
|
|
| Net Advisory Fee (000s) |
|
$ |
64,007 |
|
|
| Holdings [Text Block] |
Graphical Representation of Holdings (as a percentage of net assets) Portfolio Composition by Effective Maturity1 Portfolio Composition by Security Type3
| 1 |
Effective maturity is determined in accordance with the requirements of Rule 2a‑7 under the Investment Company Act of 1940, as amended, which regulates money market funds. |
| 2 |
Assets, other than investments in securities, less liabilities. |
| 3 |
See the Fund’s Prospectus and Statement of Additional Information for descriptions of the principal types of securities in which the Fund invests. |
|