Pay vs Performance Disclosure - USD ($)
|
12 Months Ended |
Dec. 31, 2025 |
Dec. 31, 2024 |
Dec. 31, 2023 |
Dec. 31, 2022 |
Dec. 31, 2021 |
| Pay vs Performance Disclosure |
|
|
|
|
|
| Pay vs Performance Disclosure, Table |
| | | | | | | | | | | | | | | | | | | | | | | | | | | | Year | Summary
Compensation
Table Total
for CEO | Compensation Actually Paid to CEO (1) | Average
Summary
Compensation
Table Total
for Non-CEO
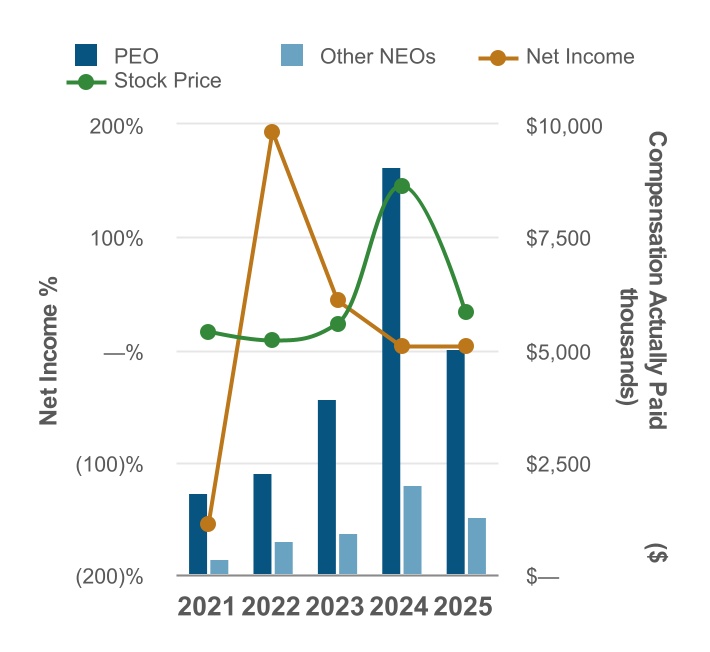
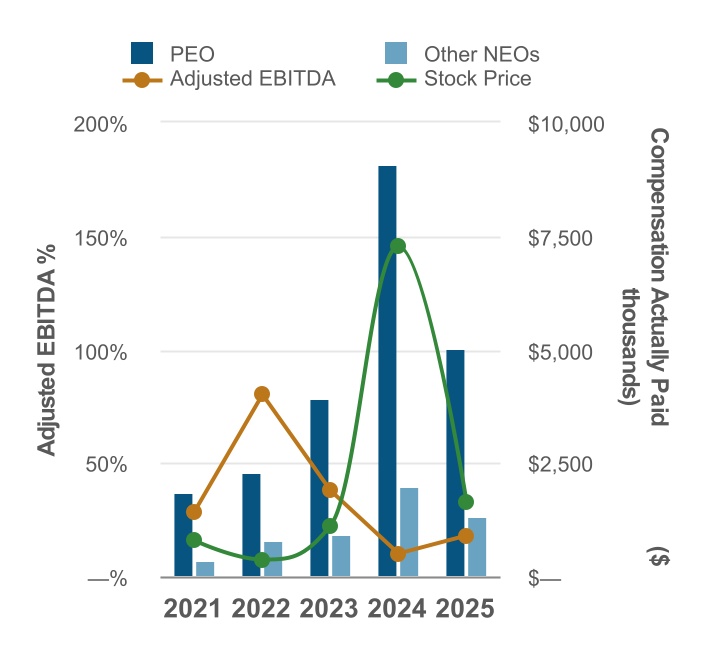
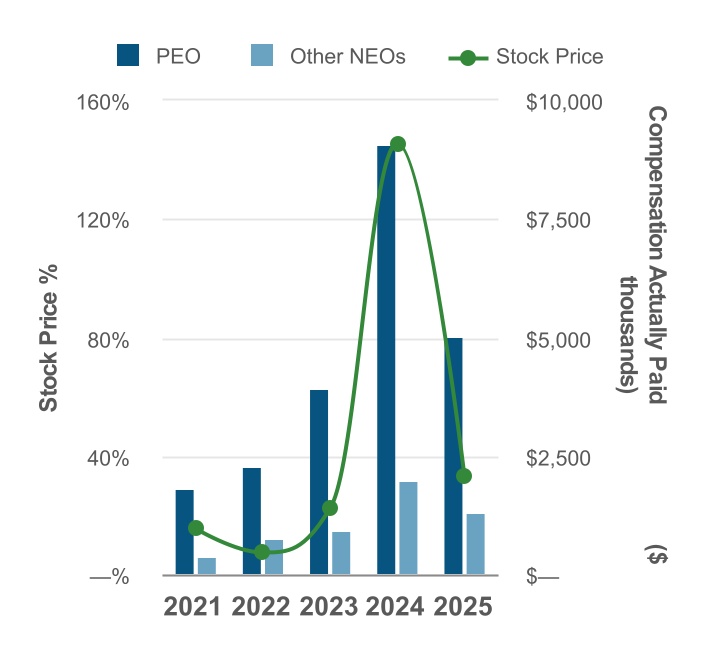
NEOs | Average Compensation Actually Paid to Non-CEO NEOs (2) | Total Shareholder Return(3) | Peer Group Total Shareholder Return(4) | Net Income (in millions) | Adjusted EBITDA(5) | | 2025 | $ | 4,594,369 | | $ | 5,028,916 | | $ | 1,238,639 | | $ | 1,302,765 | | $ | 487 | | $ | 157 | | $ | 88.7 | | $ | 225.3 | | | 2024 | 5,254,317 | | 9,060,415 | | 1,159,565 | | 2,000,817 | | 366 | | 145 | | 70.4 | | 191.3 | | | 2023 | 5,103,439 | | 3,915,330 | | 1,181,650 | | 942,193 | | 149 | | 123 | | 68.7 | | 174.3 | | | 2022 | 3,417,956 | | 2,277,567 | | 736,045 | | 773,910 | | 122 | | 97 | | 48.1 | | 126.8 | | | 2021 | 2,380,437 | | 1,828,867 | | 352,607 | | 371,171 | | 114 | | 120 | | 16.4 | | 70.2 | |
|
|
|
|
|
| Company Selected Measure Name |
adjusted EBITDA
|
|
|
|
|
| Named Executive Officers, Footnote |
Amounts represent compensation actually paid to David Little - Chief Executive Officer.mounts represent average compensation actually paid to Non-CEO NEOs - Nick Little, Kent Yee, Paz Maestas, and Chris Gregory.
|
|
|
|
|
| Peer Group Issuers, Footnote |
Reflects a $100 investment in a peer group consisting of Dow Jones US Industrial Supplies Index, NASDAQ Industrial Index and S&P 400 Index.
|
|
|
|
|
| PEO Total Compensation Amount |
$ 4,594,369
|
$ 5,254,317
|
$ 5,103,439
|
$ 3,417,956
|
$ 2,380,437
|
| PEO Actually Paid Compensation Amount |
$ 5,028,916
|
9,060,415
|
3,915,330
|
2,277,567
|
1,828,867
|
| Adjustment To PEO Compensation, Footnote |
| | | | | | | | | | | | | | | | | | | Compensation Actually Paid to CEO | 2025 | 2024 | 2023 | | Summary Compensation Table | $ | 4,594,369 | | $ | 5,254,317 | | $ | 5,103,439 | | | Deductions for amounts reported under the "Stock Awards" column in the Summary Compensation Table | (1,856,223) | | (2,700,000) | | (2,700,000) | | | Change in fair value of awards granted during the year that remain unvested as of year-end | 449,147 | | 1,424,616 | | 680,014 | | | Increase/(deduction) for change in fair value from prior year-end to current year-end of awards granted prior to year that were outstanding and unvested as of year-end | 1,854,685 | | 3,958,161 | | 226,935 | | | Increase/(deduction) for change in fair value from prior year-end to vesting date of awards granted prior to year that vested during the year | (13,062) | | 1,123,321 | | 604,942 | | | Compensation Actually Paid to CEO | $ | 5,028,916 | | $ | 9,060,415 | | $ | 3,915,330 | |
|
|
|
|
|
| Non-PEO NEO Average Total Compensation Amount |
$ 1,238,639
|
1,159,565
|
1,181,650
|
736,045
|
352,607
|
| Non-PEO NEO Average Compensation Actually Paid Amount |
$ 1,302,765
|
2,000,817
|
942,193
|
773,910
|
371,171
|
| Adjustment to Non-PEO NEO Compensation Footnote |
| | | | | | | | | | | | | | | | | | | Compensation Actually Paid to Other NEOs | 2025 | 2024 | 2023 | | Summary Compensation Table | $ | 1,238,639 | | $ | 1,159,565 | | $ | 1,181,650 | | | Deductions for amounts reported under the "Stock Awards" column in the Summary Compensation Table | (348,429) | | (475,000) | | (525,000) | | | Change in fair value of awards granted during the year that remain unvested as of year-end | 71,814 | | 250,621 | | 132,224 | | | Increase/(deduction) for change in fair value from prior year-end to current year-end of awards granted prior to year that were outstanding and unvested as of year-end | 343,417 | | 873,864 | | 54,792 | | | Increase/(deduction) for change in fair value from prior year-end to vesting date of awards granted prior to year that vested during the year | (2,676) | | 191,767 | | 98,527 | | | Average Compensation Actually Paid to NEOs | $ | 1,302,765 | | $ | 2,000,817 | | $ | 942,193 | |
|
|
|
|
|
| Compensation Actually Paid vs. Net Income |
|
|
|
|
|
| Compensation Actually Paid vs. Company Selected Measure |
|
|
|
|
|
| Tabular List, Table |
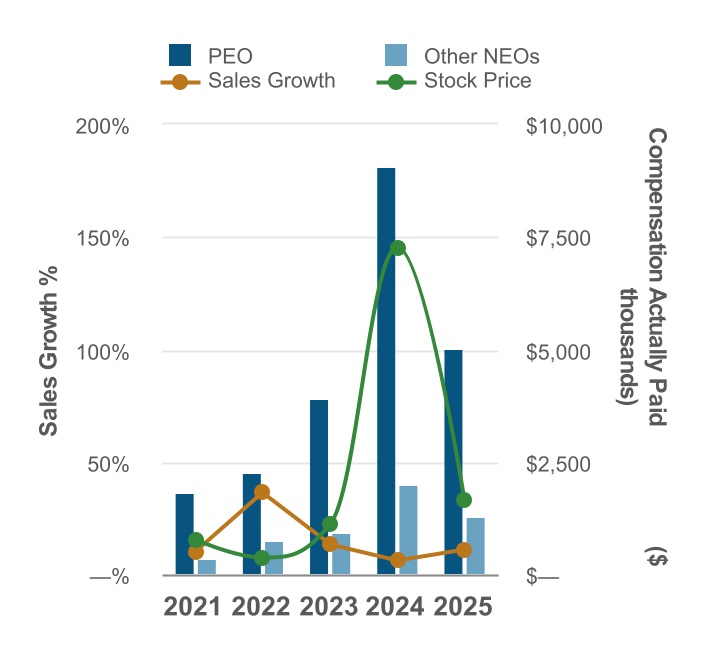
The following table sets forth the four principal compensation measures that the Company used to measure the performance of its executive officers, including the NEOs, during 2025.
| | | | | | | Key Compensation Performance Measures | | Stock price performance | | Sales growth (year-over-year) | | Adjusted EBITDA | | Net Income |
|
|
|
|
|
| Total Shareholder Return Amount |
$ 487
|
366
|
149
|
122
|
114
|
| Peer Group Total Shareholder Return Amount |
157
|
145
|
123
|
97
|
120
|
| Net Income (Loss) Available to Common Stockholders, Basic |
$ 88,700,000
|
$ 70,400,000
|
$ 68,700,000
|
$ 48,100,000
|
$ 16,400,000
|
| Company Selected Measure Amount |
225,300,000
|
191,300,000
|
174,300,000
|
126,800,000
|
70,200,000
|
| Additional 402(v) Disclosure |
Reflects a $100 calculated as an investment in DXP Enterprises, Inc. from the beginning to the end of the fiscal year.
|
|
|
|
|
| Measure:: 1 |
|
|
|
|
|
| Pay vs Performance Disclosure |
|
|
|
|
|
| Name |
Adjusted EBITDA
|
|
|
|
|
| Non-GAAP Measure Description |
Adjusted EBITDA is a non-GAAP financial measure.
|
|
|
|
|
| Measure:: 2 |
|
|
|
|
|
| Pay vs Performance Disclosure |
|
|
|
|
|
| Compensation Actually Paid vs. Other Measure |
|
|
|
|
|
| Name |
Stock price performance
|
|
|
|
|
| Measure:: 3 |
|
|
|
|
|
| Pay vs Performance Disclosure |
|
|
|
|
|
| Compensation Actually Paid vs. Other Measure |
|
|
|
|
|
| Name |
Sales growth (year-over-year)
|
|
|
|
|
| Measure:: 4 |
|
|
|
|
|
| Pay vs Performance Disclosure |
|
|
|
|
|
| Name |
Net Income
|
|
|
|
|
| PEO | Aggregate Grant Date Fair Value of Equity Award Amounts Reported in Summary Compensation Table |
|
|
|
|
|
| Pay vs Performance Disclosure |
|
|
|
|
|
| Adjustment to Compensation, Amount |
$ (1,856,223)
|
$ (2,700,000)
|
$ (2,700,000)
|
|
|
| PEO | Year-end Fair Value of Equity Awards Granted in Covered Year that are Outstanding and Unvested |
|
|
|
|
|
| Pay vs Performance Disclosure |
|
|
|
|
|
| Adjustment to Compensation, Amount |
449,147
|
1,424,616
|
680,014
|
|
|
| PEO | Year-over-Year Change in Fair Value of Equity Awards Granted in Prior Years That are Outstanding and Unvested |
|
|
|
|
|
| Pay vs Performance Disclosure |
|
|
|
|
|
| Adjustment to Compensation, Amount |
1,854,685
|
3,958,161
|
226,935
|
|
|
| PEO | Change in Fair Value as of Vesting Date of Prior Year Equity Awards Vested in Covered Year |
|
|
|
|
|
| Pay vs Performance Disclosure |
|
|
|
|
|
| Adjustment to Compensation, Amount |
(13,062)
|
1,123,321
|
604,942
|
|
|
| Non-PEO NEO | Aggregate Grant Date Fair Value of Equity Award Amounts Reported in Summary Compensation Table |
|
|
|
|
|
| Pay vs Performance Disclosure |
|
|
|
|
|
| Adjustment to Compensation, Amount |
(348,429)
|
(475,000)
|
(525,000)
|
|
|
| Non-PEO NEO | Year-end Fair Value of Equity Awards Granted in Covered Year that are Outstanding and Unvested |
|
|
|
|
|
| Pay vs Performance Disclosure |
|
|
|
|
|
| Adjustment to Compensation, Amount |
71,814
|
250,621
|
132,224
|
|
|
| Non-PEO NEO | Year-over-Year Change in Fair Value of Equity Awards Granted in Prior Years That are Outstanding and Unvested |
|
|
|
|
|
| Pay vs Performance Disclosure |
|
|
|
|
|
| Adjustment to Compensation, Amount |
343,417
|
873,864
|
54,792
|
|
|
| Non-PEO NEO | Change in Fair Value as of Vesting Date of Prior Year Equity Awards Vested in Covered Year |
|
|
|
|
|
| Pay vs Performance Disclosure |
|
|
|
|
|
| Adjustment to Compensation, Amount |
$ (2,676)
|
$ 191,767
|
$ 98,527
|
|
|