Pay vs Performance Disclosure - USD ($)
|
12 Months Ended |
Dec. 31, 2025 |
Dec. 31, 2024 |
Dec. 31, 2023 |
Dec. 31, 2022 |
Dec. 31, 2021 |
| Pay vs Performance Disclosure |
|
|
|
|
|
| Pay vs Performance Disclosure, Table |
| | | | | | | | | | | | | | | | | | | | | | | | | | | | Year | Summary compensation table for PEO
($) | Compensation actually paid to PEO
($) (a) | Average summary compensation table for other NEOs
($) | Average compensation actually paid to other NEOs
($) (b) | Value of initial fixed $100 investment made December 31, 2020 based on: | Net income (loss)
(in thousands, $) (d) | Adjusted EBITDA (in thousands, $) (e) | TSR
($) | TSR of peer group
($) (c) | | 2025 | 2,446,411 | | 2,602,644 | | 888,525 | | 926,254 | | 161 | 291 | (61,189) | | 101,515 | | | 2024 | 2,746,993 | | (501,805) | | 889,068 | | 216,803 | | 140 | | 218 | | (3,590) | | 128,108 | | | 2023 | 3,205,216 | | 3,068,528 | | 1,050,427 | | 997,323 | | 306 | | 163 | | 83,706 | | 205,229 | | | 2022 | 3,310,256 | | 5,068,537 | | 1,147,329 | | 1,624,920 | | 315 | | 122 | | 179,186 | | 252,969 | | | 2021 | 4,548,330 | | 5,153,371 | | 1,127,359 | | 1,383,280 | | 226 | | 126 | | 49,891 | | 134,964 | |
|
|
|
|
|
| Company Selected Measure Name |
Adjusted EBITDA
|
|
|
|
|
| Named Executive Officers, Footnote |
Compensation actually paid to the principal executive officer (the PEO) is adjusted based on: (1) addition of the amount of change in fair value of any equity awards granted in the covered fiscal year that are outstanding and unvested as of the end of the covered fiscal year; (2) addition of the amount of change in fair value as of the end of the covered fiscal year (from the end of the prior fiscal year) of any awards granted in prior years that are outstanding and unvested as of the end of the covered fiscal year and (3) addition of the amount of change in fair value from the end of the prior fiscal year to the vesting date for awards granted in prior years that vest in the covered fiscal year. Mr. Reitz is the PEO for the years ended December 31, 2025, 2024, 2023, 2022, and 2021. For our NEOs other than our principal executive officer, the compensation reported is an average. Messrs. Eheli, Martin, and Narancich are the other NEOs for the years ended December 31, 2025. Messrs. Martin, Troyanovich, Narancich and Eheli are the other NEOs for the years ended December 31, 2024. Messrs. Martin, Troyanovich and Eheli are the other NEOs for the years ended December 31, 2023, 2022, and 2021.
|
|
|
|
|
| Peer Group Issuers, Footnote |
The peer group used for calculating "TSR of peer group" is the same peer group used by the company for reviewing its compensation practices.
|
|
|
|
|
| PEO Total Compensation Amount |
$ 2,446,411
|
$ 2,746,993
|
$ 3,205,216
|
$ 3,310,256
|
$ 4,548,330
|
| PEO Actually Paid Compensation Amount |
$ 2,602,644
|
(501,805)
|
3,068,528
|
5,068,537
|
5,153,371
|
| Adjustment To PEO Compensation, Footnote |
| | | | | | | | | | | | | | | | | | | | | | Year | Summary compensation
($) | Change in Fair Value of Outstanding and Unvested Equity Awards Granted in the Current Year
($)
| Year over Year Change in Fair Value of Outstanding and Unvested Equity Awards Granted in Prior Years
($)
| Year over Year Change in Fair Value of Equity Awards Granted in Prior Years that Vested in the Year
($)
| Awards Granted in Prior Years that Forfeited in the Year
($) | Compensation actually paid
($) | | | PEO | | | | | | | | 2025 | 2,446,411 | | (83,200) | | 86,667 | | 152,766 | | — | | 2,602,644 | | | 2024 | 2,746,993 | | (486,400) | | (701,136) | | (2,061,262) | | — | | (501,805) | | | 2023 | 3,205,216 | | 302,400 | | (134,570) | | (304,518) | | — | | 3,068,528 | | | 2022 | 3,310,256 | | 245,600 | | 1,297,131 | | 215,550 | | — | | 5,068,537 | | | 2021 | 4,548,330 | | 163,105 | | 278,135 | | 163,801 | | — | | 5,153,371 | | | Average Other NEOs | | | | | | | 2025 | 888,525 | | (36,400) | | 26,694 | | 47,435 | | — | | 926,254 | | | 2024 | 889,068 | | (136,060) | | (208,995) | | (176,931) | | (150,279) | | 216,803 | | | 2023 | 1,050,427 | | 112,000 | | (29,244) | | (135,860) | | — | | 997,323 | | | 2022 | 1,147,329 | | 112,566 | | 269,843 | | 95,182 | | — | | 1,624,920 | | | 2021 | 1,127,359 | | 63,210 | | 125,822 | | 66,889 | | — | | 1,383,280 | | | | | | | | | | | | | | | | | | | | | | | | | | | | | |
|
|
|
|
|
| Non-PEO NEO Average Total Compensation Amount |
$ 888,525
|
889,068
|
1,050,427
|
1,147,329
|
1,127,359
|
| Non-PEO NEO Average Compensation Actually Paid Amount |
$ 926,254
|
216,803
|
997,323
|
1,624,920
|
1,383,280
|
| Adjustment to Non-PEO NEO Compensation Footnote |
| | | | | | | | | | | | | | | | | | | | | | Year | Summary compensation
($) | Change in Fair Value of Outstanding and Unvested Equity Awards Granted in the Current Year
($)
| Year over Year Change in Fair Value of Outstanding and Unvested Equity Awards Granted in Prior Years
($)
| Year over Year Change in Fair Value of Equity Awards Granted in Prior Years that Vested in the Year
($)
| Awards Granted in Prior Years that Forfeited in the Year
($) | Compensation actually paid
($) | | | PEO | | | | | | | | 2025 | 2,446,411 | | (83,200) | | 86,667 | | 152,766 | | — | | 2,602,644 | | | 2024 | 2,746,993 | | (486,400) | | (701,136) | | (2,061,262) | | — | | (501,805) | | | 2023 | 3,205,216 | | 302,400 | | (134,570) | | (304,518) | | — | | 3,068,528 | | | 2022 | 3,310,256 | | 245,600 | | 1,297,131 | | 215,550 | | — | | 5,068,537 | | | 2021 | 4,548,330 | | 163,105 | | 278,135 | | 163,801 | | — | | 5,153,371 | | | Average Other NEOs | | | | | | | 2025 | 888,525 | | (36,400) | | 26,694 | | 47,435 | | — | | 926,254 | | | 2024 | 889,068 | | (136,060) | | (208,995) | | (176,931) | | (150,279) | | 216,803 | | | 2023 | 1,050,427 | | 112,000 | | (29,244) | | (135,860) | | — | | 997,323 | | | 2022 | 1,147,329 | | 112,566 | | 269,843 | | 95,182 | | — | | 1,624,920 | | | 2021 | 1,127,359 | | 63,210 | | 125,822 | | 66,889 | | — | | 1,383,280 | | | | | | | | | | | | | | | | | | | | | | | | | | | | | |
|
|
|
|
|
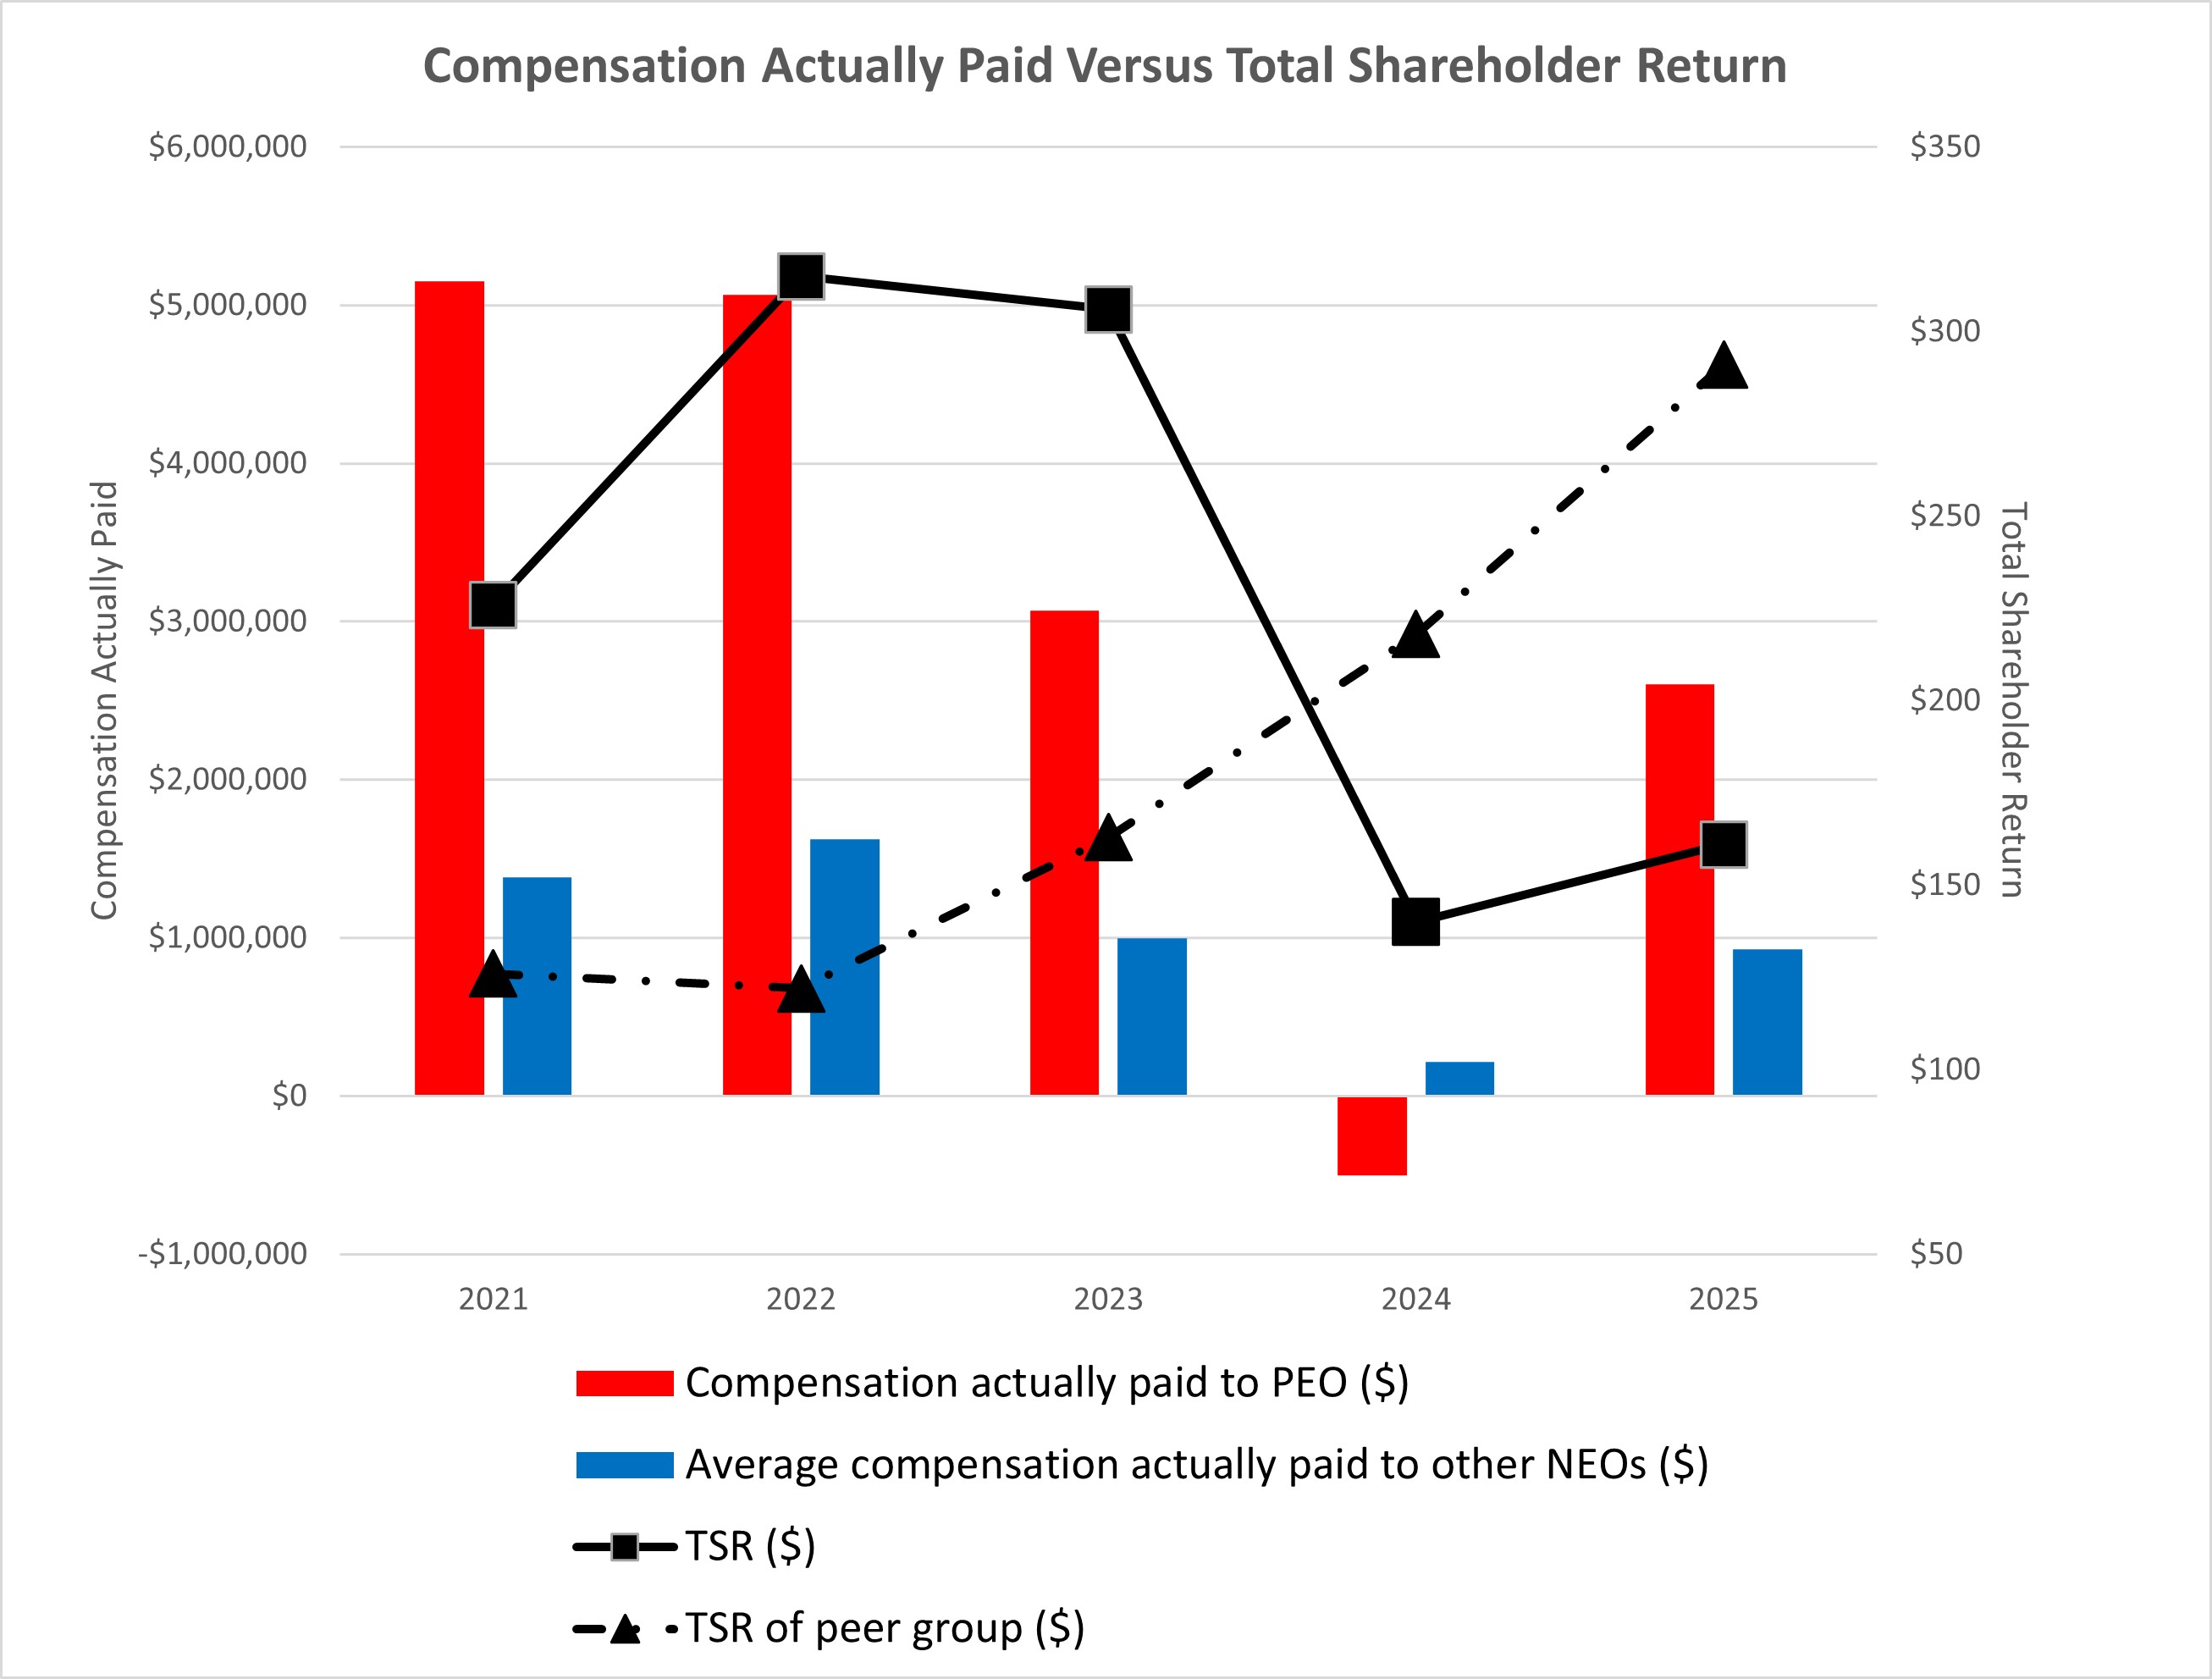
| Compensation Actually Paid vs. Total Shareholder Return |
The graphs below reflect the relationship between the compensation actually paid to our PEO, the average of the compensation actually paid to our remaining NEOs and the Company and the peer group’s cumulative indexed Total Shareholder Return, or TSR, (assuming an initial fixed investment of $100) for the years ended December 31, 2025, 2024, 2023, 2022 and 2021:
|
|
|
|
|
| Compensation Actually Paid vs. Net Income |
The following graph compares the compensation actually paid to our PEO and the average of the compensation actually paid to our remaining NEOs with the Company's net income.
|
|
|
|
|
| Compensation Actually Paid vs. Company Selected Measure |
The following graph compares the compensation actually paid to our PEO and the average of the compensation actually paid to our remaining NEOs with Adjusted EBITDA. The Company has chosen Adjusted EBITDA as the most important measure it uses in linking compensation to financial performance.
|
|
|
|
|
| Tabular List, Table |
The following table presents the financial performance measures that the Company considers to have been the most important in linking Compensation Actually Paid to our PEO and other NEOs for 2025 to Company performance. The measures in this table are not ranked. | | | | | | | | | | | | | | | | | Adjusted EBITDA | | | Cash Flow | | | | | | | | Working Capital Management | | | | | | | | | | | | | | | | | | | | | | | | | | | |
|
|
|
|
|
| Total Shareholder Return Amount |
$ 161
|
140
|
306
|
315
|
226
|
| Peer Group Total Shareholder Return Amount |
291
|
218
|
163
|
122
|
126
|
| Net Income (Loss) |
$ (61,189,000)
|
$ (3,590,000)
|
$ 83,706,000
|
$ 179,186,000
|
$ 49,891,000
|
| Company Selected Measure Amount |
101,515,000
|
128,108,000
|
205,229,000
|
252,969,000
|
134,964,000
|
| PEO Name |
Mr. Reitz
|
|
|
|
|
| Additional 402(v) Disclosure |
(d) The compensation committee does not utilize net income as a metric in setting the PEO and other NEOs incentive compensation because net income includes certain items that the Compensation Committee believes are not reflective of operational performance of the business. The Compensation Committee instead utilizes Adjusted EBITDA, as it views that metric as more reflective of the operational performance of the business.
|
|
|
|
|
| Measure:: 1 |
|
|
|
|
|
| Pay vs Performance Disclosure |
|
|
|
|
|
| Name |
Adjusted EBITDA
|
|
|
|
|
| Non-GAAP Measure Description |
Reconciliations of net income (loss) to Adjusted EBITDA, a non-GAAP financial measures, for the years ended December 31, 2025, 2024, 2023, 2022, and 2021 are included in Appendix A filed herewith.
|
|
|
|
|
| Measure:: 2 |
|
|
|
|
|
| Pay vs Performance Disclosure |
|
|
|
|
|
| Name |
Cash Flow
|
|
|
|
|
| Measure:: 3 |
|
|
|
|
|
| Pay vs Performance Disclosure |
|
|
|
|
|
| Name |
Working Capital Management
|
|
|
|
|
| PEO | Equity Awards Granted During The Year, Unvested [Member] |
|
|
|
|
|
| Pay vs Performance Disclosure |
|
|
|
|
|
| Adjustment to Compensation, Amount |
$ (83,200)
|
$ (486,400)
|
$ 302,400
|
$ 245,600
|
$ 163,105
|
| PEO | Equity Awards Granted in Prior Years, Unvested [Member] |
|
|
|
|
|
| Pay vs Performance Disclosure |
|
|
|
|
|
| Adjustment to Compensation, Amount |
86,667
|
(701,136)
|
(134,570)
|
1,297,131
|
278,135
|
| PEO | Equity Awards Granted During the Year, Vested [Member] |
|
|
|
|
|
| Pay vs Performance Disclosure |
|
|
|
|
|
| Adjustment to Compensation, Amount |
152,766
|
(2,061,262)
|
(304,518)
|
215,550
|
163,801
|
| PEO | Equity Awards Granted Prior Years, Forfeited [Member] |
|
|
|
|
|
| Pay vs Performance Disclosure |
|
|
|
|
|
| Adjustment to Compensation, Amount |
0
|
0
|
0
|
0
|
0
|
| Non-PEO NEO | Equity Awards Granted During The Year, Unvested [Member] |
|
|
|
|
|
| Pay vs Performance Disclosure |
|
|
|
|
|
| Adjustment to Compensation, Amount |
(36,400)
|
(136,060)
|
112,000
|
112,566
|
63,210
|
| Non-PEO NEO | Equity Awards Granted in Prior Years, Unvested [Member] |
|
|
|
|
|
| Pay vs Performance Disclosure |
|
|
|
|
|
| Adjustment to Compensation, Amount |
26,694
|
(208,995)
|
(29,244)
|
269,843
|
125,822
|
| Non-PEO NEO | Equity Awards Granted During the Year, Vested [Member] |
|
|
|
|
|
| Pay vs Performance Disclosure |
|
|
|
|
|
| Adjustment to Compensation, Amount |
47,435
|
(176,931)
|
(135,860)
|
95,182
|
66,889
|
| Non-PEO NEO | Equity Awards Granted Prior Years, Forfeited [Member] |
|
|
|
|
|
| Pay vs Performance Disclosure |
|
|
|
|
|
| Adjustment to Compensation, Amount |
$ 0
|
$ (150,279)
|
$ 0
|
$ 0
|
$ 0
|