Pay vs Performance Disclosure
Dec. 31, 2025
USD ($)
Pay Versus Performance
Section 953(a) of the Dodd-Frank Act and Item 402(v) of Regulation
S-K
requires us to provide the following disclosure regarding compensation for our Chief Executive Officer, who is our principal executive officer (“PEO”), and the average compensation for our other non-PEO
NEOs (“Non-PEO
NEOs”). The amounts shown for “Compensation Actually Paid” (or, “CAP”) have been calculated in accordance with SEC rules and do not reflect compensation actually earned, realized, or received by any of our NEOs. The table includes adjustments as described in the footnotes and also provides information on our cumulative total stockholder return (“TSR”), the cumulative TSR of our peer group, net income, and our company-selected measure, which is Adjusted EBITDA. Our IPO occurred in September 2025, and we do not present information for years prior to when we became a public reporting company. The information contained in this “Pay Versus Performance” section will not be incorporated into any of our filings under the Securities Act or the Exchange Act, except to the extent we specifically incorporate such information by reference therein. Value of an initial $100 Investment: |
||||||||||||||||||||||||||||||||
Fiscal Year |
Summary Compensation Table Total for PEO 1,2 |
Compensation Actually Paid to PEO 1,3 |
Average Summary Compensation Table Total for Non-PEO NEOs 1,2 |
Average Compensation Actually Paid to Non-PEO NEOs 1,3 |
Total Stockholder Return 4 |
Peer Group Total Stockholder Return 5 |
Net Income ($ Millions) 6 |
Adjusted EBITDA ($ Millions) 7 |
||||||||||||||||||||||||
2025 |
$ |
8,281,845 |
$ |
11,990,443 |
$ |
2,749,118 |
$ |
4,126,331 |
$ |
141.11 |
$ |
106.85 |
($ |
59.8 |
) |
$ |
298.8 |
|||||||||||||||
| (1) | NEOs included in these columns reflect the following individuals: |
Year |
PEO |
Non-PEO NEOs | ||
| 2025 | Jeffrey Sprau |
Stephen Butz, Steve Hansen, Justin Schwartz, Bryce Seki |
| (2) | Amounts reflect Summary Compensation Table Total Pay for our NEOs for each corresponding year. |
| (3) | CAP has been calculated based on the requirements and methodology set forth in the applicable SEC rules (Item 402(v) of Regulation S-K). The CAP calculation includes the end-of-year |
| compensation number shown in the Summary Compensation Table included elsewhere in this Proxy Statement: |
Reconciliation of Summary Compensation Table Total to Compensation Actually Paid for PEO |
Fiscal Year 2025 (For PEO) ($) |
Fiscal Year 2025 (Average for Non-PEO NEOs) ($) |
||||||
Summary Compensation Table Total |
$ |
8,281,845 |
$ |
2,749,118 |
||||
(Minus) : Grant Date Fair Value of Equity Awards Reported in the Summary Compensation Table |
($ | 5,622,112 | ) | ($ | 1,609,056 | ) | ||
(Minus) : Change in Actuarial Present Value of The NEO’s Accumulated Benefit Under All Defined Benefit and Actuarial Pension Plans Reported In the Summary Compensation Table |
$ | 0 | $ | 0 | ||||
Plus: Pension Service Cost and Associated Prior Service Cost |
$ | 0 | $ | 0 | ||||
Plus: Fair Value at Fiscal Year End of Outstanding and Unvested Equity Awards Granted in the Fiscal Year |
$ | 8,457,907 | $ | 2,376,100 | ||||
Adjust for: Change in Fair Value of Outstanding and Unvested Equity Awards Granted in Prior Fiscal Years |
$ | 281,937 | $ | 398,222 | ||||
Plus: Fair Value at Vesting of Equity Awards Granted and Vested in the Fiscal Year |
$ | 72,744 | $ | 53,389 | ||||
Adjust for: Change in Fair Value as of the Vesting Date of Equity Awards Granted in Prior Fiscal Years that Vested in the Fiscal Year |
$ | 518,123 | $ | 158,558 | ||||
(Minus): Fair Value as of the Prior Fiscal Year End of Equity Awards Granted in Prior Fiscal Years that Failed to Meet Vesting Conditions in the Fiscal Year |
$ | 0 | $ | 0 | ||||
Adjust for: Value of Dividends or Other Earnings Paid on Equity Awards Not Otherwise Reflected in Total Compensation for the Fiscal Year |
$ | 0 | $ | 0 | ||||
Compensation Actually Paid |
$ |
11,990,443 |
$ |
4,126,331 |
||||
For purposes of the above adjustments, the fair value of equity awards on the applicable date were determined in accordance with Topic 718 or Topic 710, as applicable, using valuation methodologies that are generally consistent with those used to determine the grant-date fair value for accounting purposes.
| (4) | TSR represents the cumulative return on a fixed investment of $100 in the Company’s Class A Common Stock, for the period beginning on September 12, 2025, the date that our Class A Common Stock commenced trading on the Nasdaq Global Select Market, through the end of the applicable fiscal year, assuming reinvestment of dividends, determined on the same cumulative basis as used in Item 201(e) of Regulation S-K. |
| (5) | Peer Group Total Stockholder Return represents the cumulative return on a fixed investment of $100 in the S&P Composite 1500 Construction & Engineering (Industry) for the period beginning on September 12, 2025 through the end of the applicable fiscal year, assuming reinvestment of dividends, determined on the same cumulative basis as used in Item 201(e) of Regulation S-K. |
| (6) | The dollar amounts reported represent the net income reflected in the Company’s audited financial statements for the applicable year. |
| (7) | The dollar amounts reported in this column represent Adjusted EBITDA, which is the most important financial performance measure that we used in fiscal 2025 to link compensation actually paid to performance. Adjusted EBITDA is defined as net loss adjusted to exclude, or otherwise reflect, interest expense, net of capitalized interest, interest income, income tax expense (benefit), depreciation and amortization, credit agreement amendment fees, goodwill impairment, long-lived asset impairment, net |
| (gain) loss on sale and disposition of property and equipment, loss on debt extinguishment, changes in the fair value of contingent consideration liabilities, acquisition and integration costs, system deployment costs, strategic initiative costs, indemnification asset adjustments, Tax Receivable Agreement liability remeasurements, stock-based compensation expense and accelerated project sale. |
| (1) | NEOs included in these columns reflect the following individuals: |
Year |
PEO |
Non-PEO NEOs | ||
| 2025 | Jeffrey Sprau |
Stephen Butz, Steve Hansen, Justin Schwartz, Bryce Seki |
| (3) | CAP has been calculated based on the requirements and methodology set forth in the applicable SEC rules (Item 402(v) of Regulation S-K). The CAP calculation includes the end-of-year |
| compensation number shown in the Summary Compensation Table included elsewhere in this Proxy Statement: |
Reconciliation of Summary Compensation Table Total to Compensation Actually Paid for PEO |
Fiscal Year 2025 (For PEO) ($) |
Fiscal Year 2025 (Average for Non-PEO NEOs) ($) |
||||||
Summary Compensation Table Total |
$ |
8,281,845 |
$ |
2,749,118 |
||||
(Minus) : Grant Date Fair Value of Equity Awards Reported in the Summary Compensation Table |
($ | 5,622,112 | ) | ($ | 1,609,056 | ) | ||
(Minus) : Change in Actuarial Present Value of The NEO’s Accumulated Benefit Under All Defined Benefit and Actuarial Pension Plans Reported In the Summary Compensation Table |
$ | 0 | $ | 0 | ||||
Plus: Pension Service Cost and Associated Prior Service Cost |
$ | 0 | $ | 0 | ||||
Plus: Fair Value at Fiscal Year End of Outstanding and Unvested Equity Awards Granted in the Fiscal Year |
$ | 8,457,907 | $ | 2,376,100 | ||||
Adjust for: Change in Fair Value of Outstanding and Unvested Equity Awards Granted in Prior Fiscal Years |
$ | 281,937 | $ | 398,222 | ||||
Plus: Fair Value at Vesting of Equity Awards Granted and Vested in the Fiscal Year |
$ | 72,744 | $ | 53,389 | ||||
Adjust for: Change in Fair Value as of the Vesting Date of Equity Awards Granted in Prior Fiscal Years that Vested in the Fiscal Year |
$ | 518,123 | $ | 158,558 | ||||
(Minus): Fair Value as of the Prior Fiscal Year End of Equity Awards Granted in Prior Fiscal Years that Failed to Meet Vesting Conditions in the Fiscal Year |
$ | 0 | $ | 0 | ||||
Adjust for: Value of Dividends or Other Earnings Paid on Equity Awards Not Otherwise Reflected in Total Compensation for the Fiscal Year |
$ | 0 | $ | 0 | ||||
Compensation Actually Paid |
$ |
11,990,443 |
$ |
4,126,331 |
||||
For purposes of the above adjustments, the fair value of equity awards on the applicable date were determined in accordance with Topic 718 or Topic 710, as applicable, using valuation methodologies that are generally consistent with those used to determine the grant-date fair value for accounting purposes.
Pay versus Performance Comparative Disclosure
Relationship between CAP vs. Cumulative TSR of Company and the Peer Group
The following chart illustrates the relationship between CAP for our PEO and the average CAP for our
Non-PEO
NEOs against the Company’s TSR, as well as the relationship between our TSR and the TSR of our peer group: 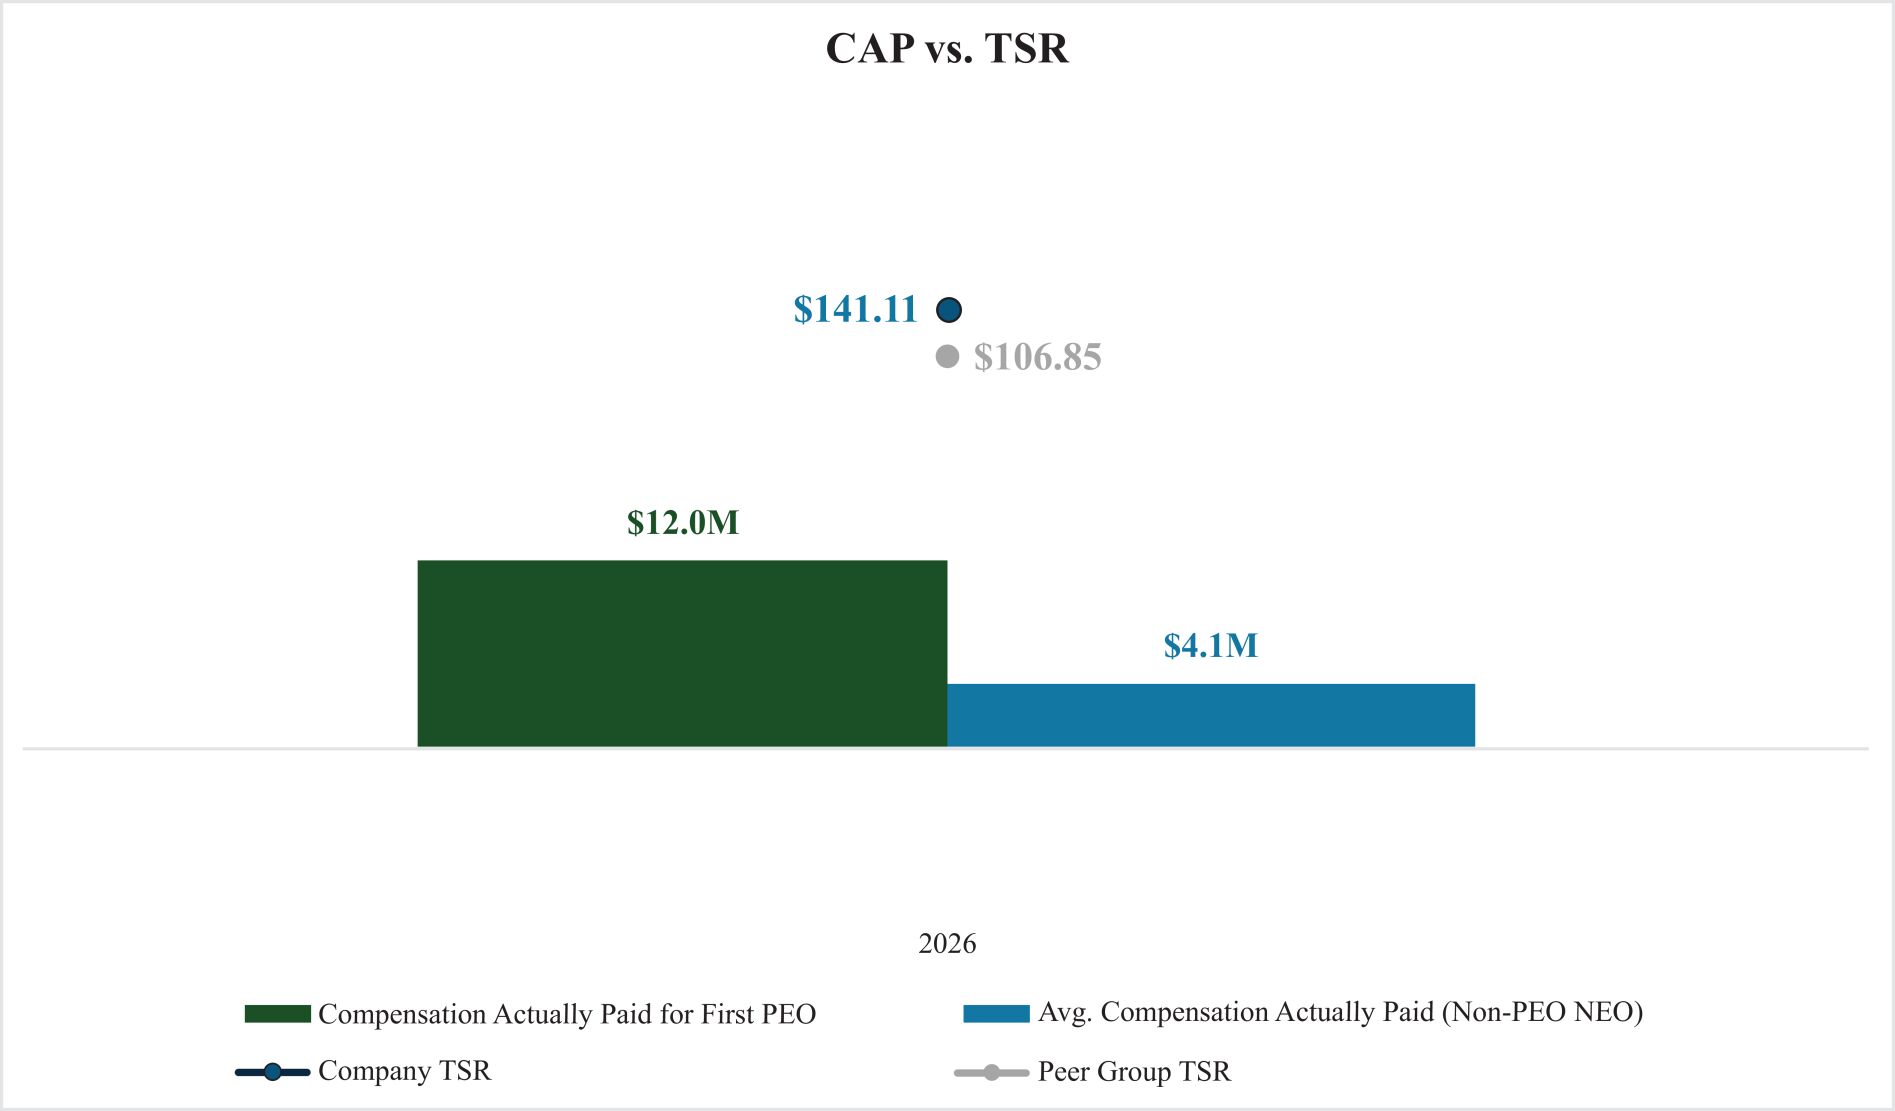
Relationship between CAP vs. Net Income
The following chart illustrates the relationship between CAP for our PEO and the average CAP for our
Non-PEO
NEOs against the Company’s net income: 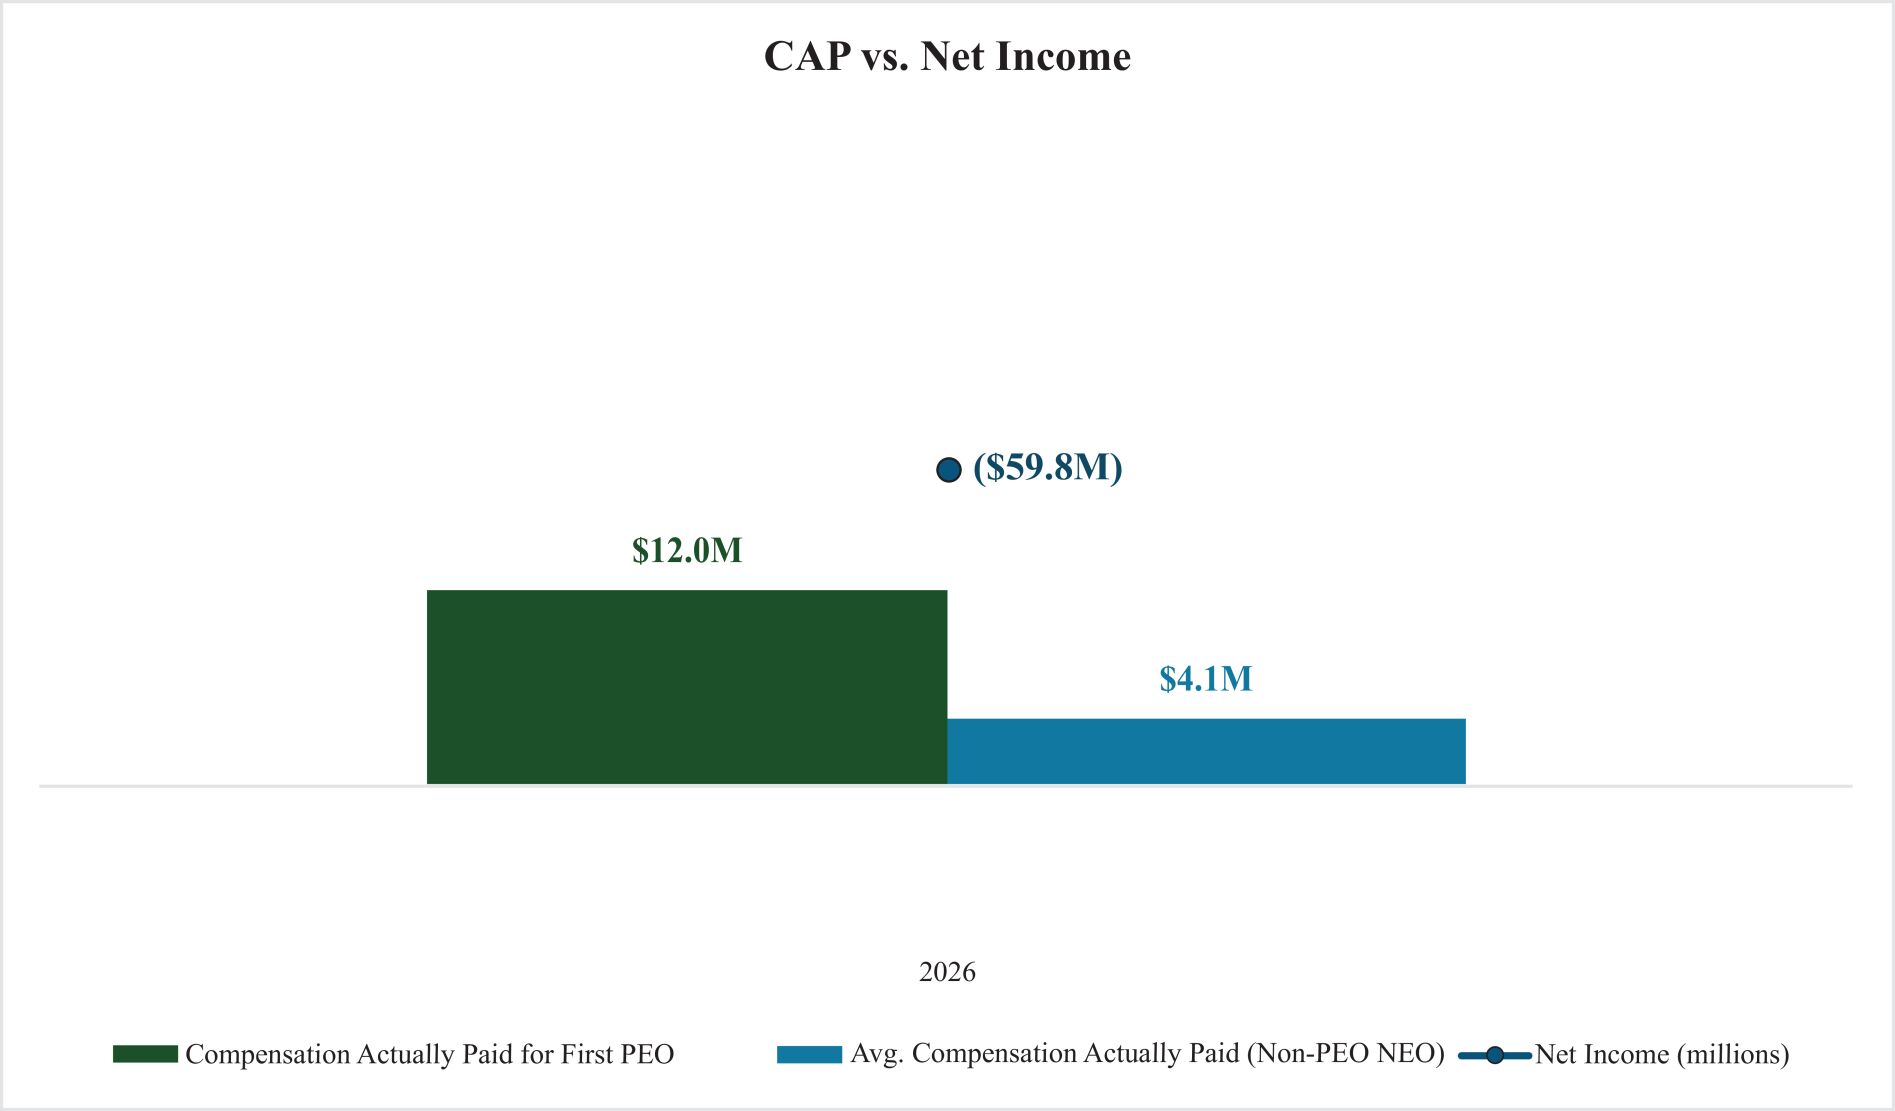
Relationship between CAP vs. Adjusted EBITDA
The following chart illustrates the relationship between CAP for our PEO and the average CAP for our
Non-PEO
NEOs against the Company’s Adjusted EBITDA: 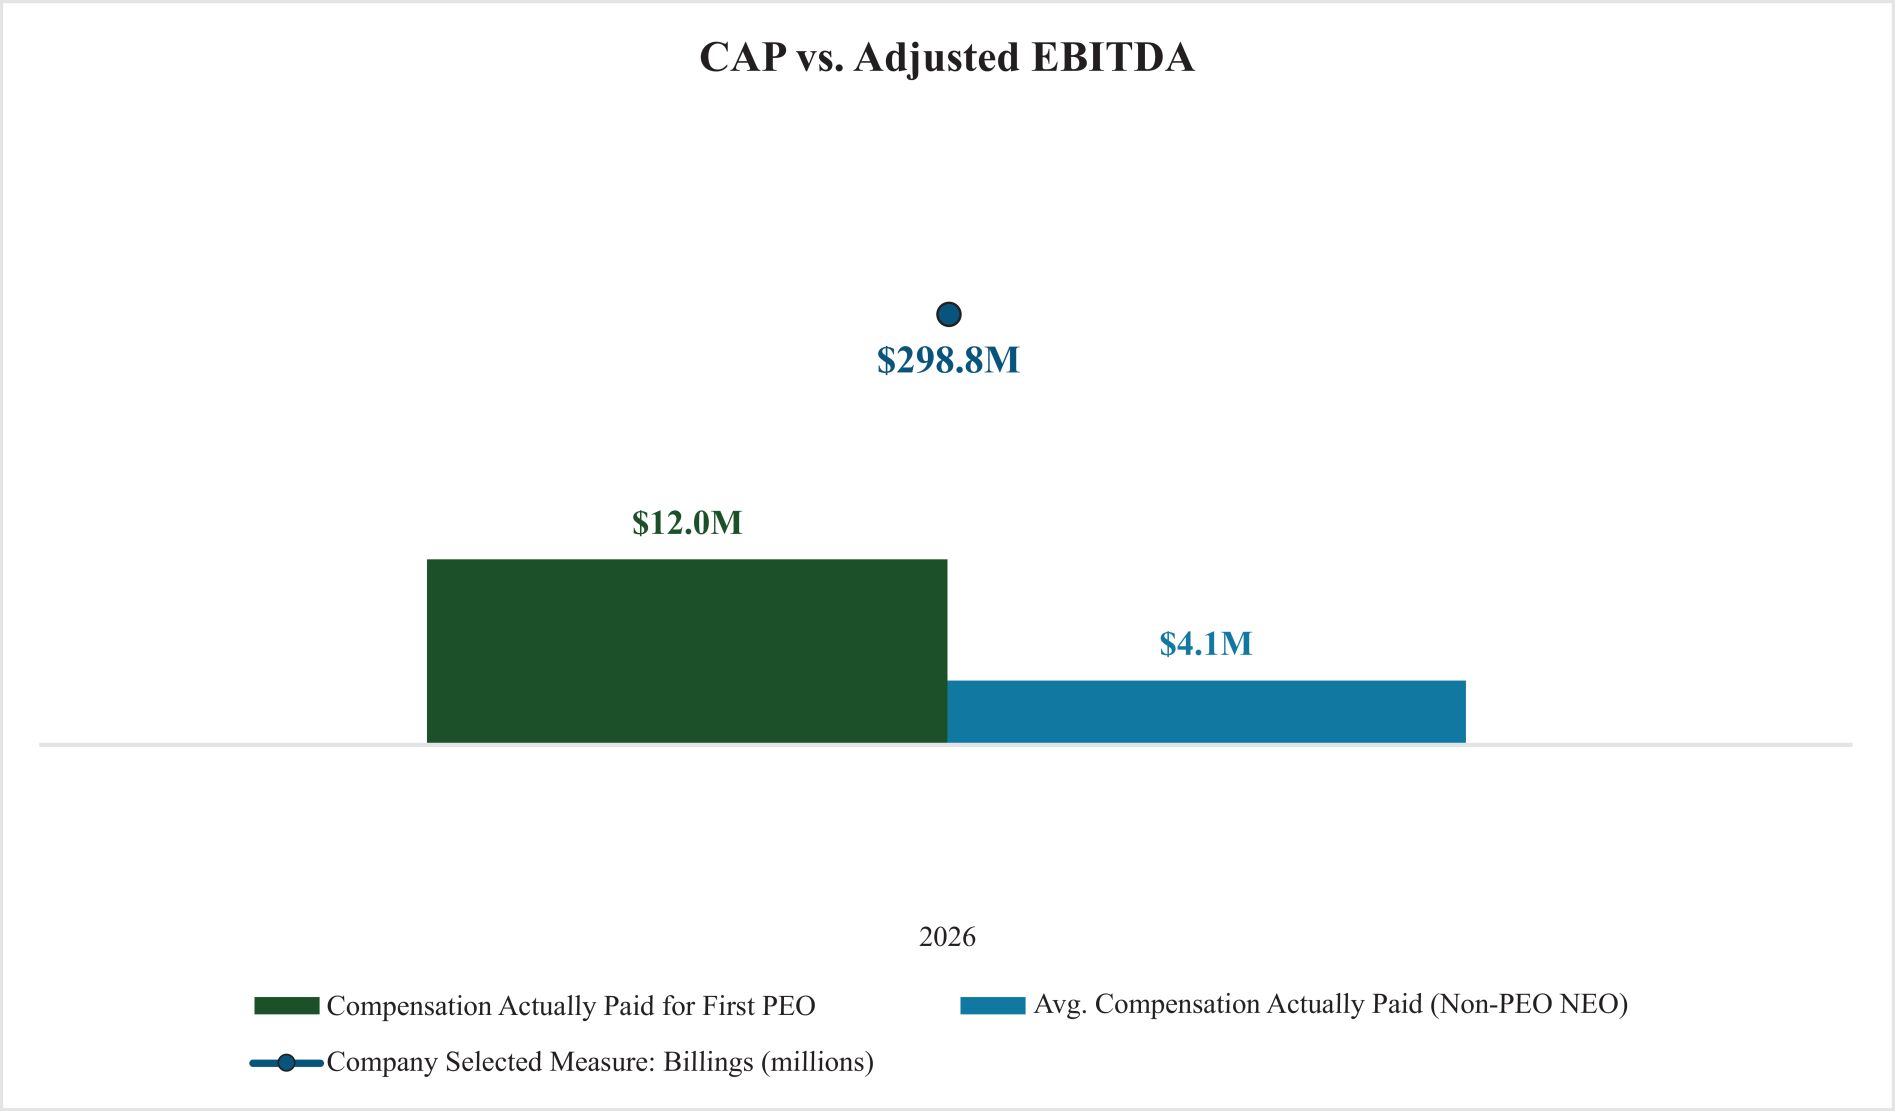
Pay versus Performance Comparative Disclosure
Relationship between CAP vs. Cumulative TSR of Company and the Peer Group
The following chart illustrates the relationship between CAP for our PEO and the average CAP for our
Non-PEO
NEOs against the Company’s TSR, as well as the relationship between our TSR and the TSR of our peer group: Most Important Performance Measures
Following is an unranked list of the performance measures we consider most important in linking company performance and compensation actually paid to our Named Executive Officers for the most recently completed fiscal year. Further information on our performance measures is described in our Compensation Discussion & Analysis (CD&A) above.
Most Important Performance Measures |
| Adjusted EBITDA |
| EBITDA |
| Safety TRIR |