
Exhibit 99.2
1Q 2026 Financial Results 1 April 29, 2026
Forward Looking Statements 2 Certain statements contained in this presentation that are not historical facts may constitute forward - looking statements within the meaning of Section 27 A of the Securities Act of 1933 , as amended, and Section 21 E of the Securities Exchange Act of 1934 , as amended, and are intended to be covered by the safe harbor provisions of the Private Securities Litigation Reform Act of 1995 . The Company may also make forward - looking statements in other documents it files with the Securities and Exchange Commission ("SEC"), in our annual reports to shareholders, in press releases and other written materials, and in oral statements made by our officers, directors or employees . You can identify forward looking statements by the use of the words “believe,” “expect,” “anticipate,” “intend,” “estimate,” “assume,” “outlook,” “will,” “should,” and other expressions that predict or indicate future events and trends and which do not relate to historical matters, including statements regarding the Company’s business, credit quality, financial condition, liquidity and results of operations . Forward - looking statements may differ, possibly materially, from what is included in this press release due to factors and future developments that are uncertain and beyond the scope of the Company’s control . These include, but are not limited to, changes in interest rates ; general economic conditions (including the impact of ongoing armed conflicts, tariffs, inflation, and concerns about liquidity) on a national basis or in the local markets in which the Company operates ; turbulence in the capital and debt markets ; competitive pressures from other financial institutions ; changes in consumer behavior due to changing political, business and economic conditions, or legislative or regulatory initiatives ; changes in the value of securities and other assets in the Company’s investment portfolio ; increases in loan and lease default and charge - off rates ; the adequacy of allowances for loan and lease losses ; decreases in deposit levels that necessitate increases in borrowing to fund loans and investments ; operational risks including, but not limited to, cybersecurity incidents, fraud, natural disasters, and future pandemics ; changes in regulation ; the possibility that future credit losses may be higher than currently expected due to changes in economic assumptions and adverse economic developments ; the risk that goodwill and intangibles recorded in the Company’s financial statements will become impaired ; and changes in assumptions used in making such forward - looking statements . Forward - looking statements involve risks and uncertainties which are difficult to predict . The Company’s actual results could differ materially from those projected in the forward - looking statements as a result of, among others, the risks outlined in the Company’s Annual Report on Form 10 - K, as updated by its Quarterly Reports on Form 10 - Q and other filings submitted to the SEC . The Company does not undertake any obligation to update any forward - looking statement to reflect circumstances or events that occur after the date the forward - looking statements are made . Non - GAAP In addition to financial measures presented in accordance with U . S . generally accepted accounting principles (“GAAP”), this presentation contains certain non - GAAP financial measures, including, without limitation, operating earnings, and the ratios of tangible common equity to tangible assets . The presentation of non - GAAP financial information is not intended to be considered in isolation or as a substitute for any measure prepared in accordance with GAAP . Please see the Earnings Release for certain Non - GAAP reconciliations .
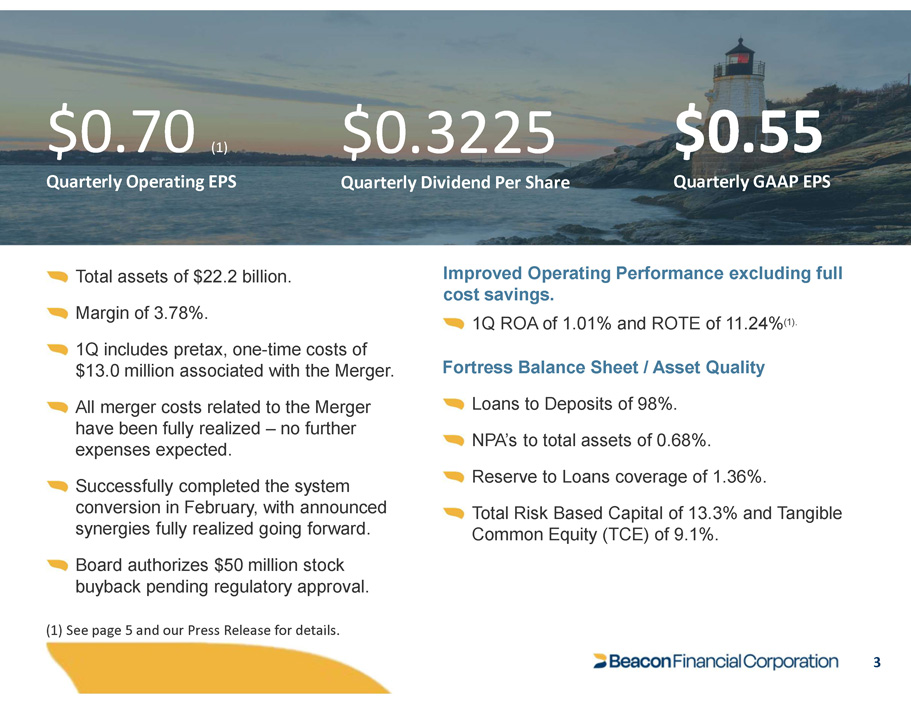
$0.55 Quarterly GAAP EPS $0.70 (1) Quarterly Operating EPS $0.3225 Quarterly Dividend Per Share Total assets of $22.2 billion. Margin of 3.78%. 1Q includes pretax, one - time costs of $13.0 million associated with the Merger. All merger costs related to the Merger have been fully realized – no further expenses expected. Successfully completed the system conversion in February, with announced synergies fully realized going forward. Board authorizes $50 million stock buyback pending regulatory approval. (1) See page 5 and our Press Release for details. Improved Operating Performance excluding full cost savings. 1Q ROA of 1.01% and ROTE of 11.24% (1). Fortress Balance Sheet / Asset Quality Loans to Deposits of 98%. NPA’s to total assets of 0.68%. Reserve to Loans coverage of 1.36%. Total Risk Based Capital of 13.3% and Tangible Common Equity (TCE) of 9.1%. 3
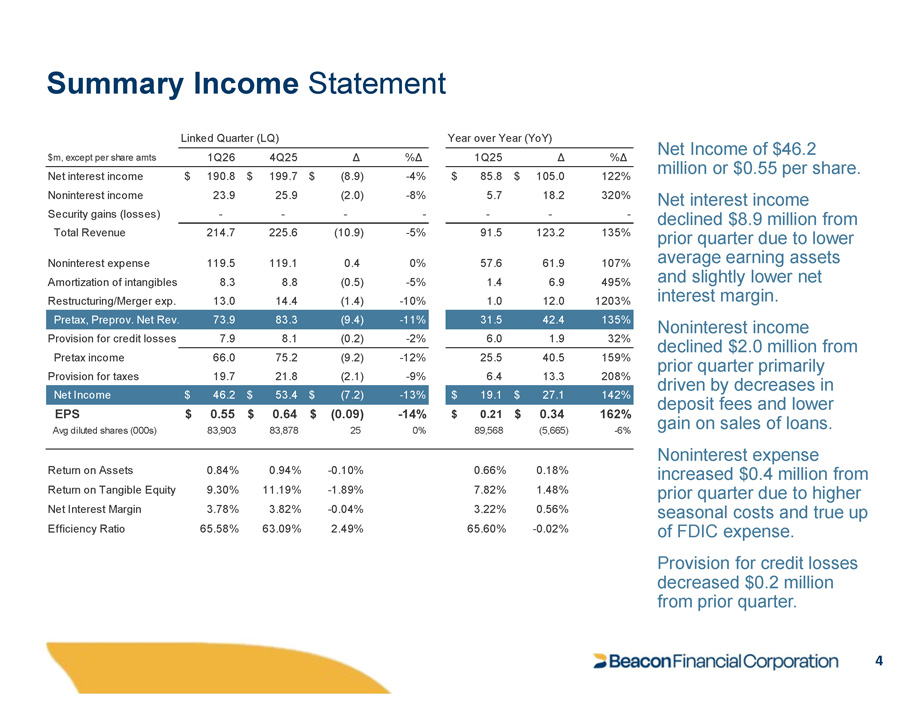
Summary Income Statement Net Income of $46.2 million or $0.55 per share. Net interest income declined $8.9 million from prior quarter due to lower average earning assets and slightly lower net interest margin. Noninterest income declined $2.0 million from prior quarter primarily driven by decreases in deposit fees and lower gain on sales of loans. Noninterest expense increased $0.4 million from prior quarter due to higher seasonal costs and true up of FDIC expense. Provision for credit losses decreased $0.2 million from prior quarter. . Year over Year (YoY) Linked Quarter (LQ) %Δ 1Q25 Δ %Δ Δ 1Q26 4Q25 $m, except per share amts 122% $ 85.8 $ 105.0 - 4% $ (8.9) $ 190.8 $ 199.7 Net interest income 320% 5.7 18.2 - 8% (2.0) 23.9 25.9 Noninterest income - - - - - - Security gains (losses) - 135% 123.2 91.5 - 5% (10.9) 225.6 Total Revenue 214.7 107% 61.9 57.6 0% 0.4 119.1 119.5 Noninterest expense 495% 6.9 1.4 - 5% (0.5) 8.8 8.3 Amortization of intangibles 1203% 12.0 1.0 - 10% (1.4) 14.4 13.0 Restructuring/Merger exp. 135% 42.4 31.5 - 11% (9.4) 83.3 73.9 Pretax, Preprov. Net Rev 32% 1.9 6.0 - 2% (0.2) 8.1 7.9 Provision for credit losses 159% 40.5 25.5 - 12% (9.2) 75.2 66.0 Pretax income 208% 13.3 6.4 - 9% (2.1) 21.8 19.7 Provision for taxes 142% $ 27.1 $ 19.1 - 13% $ (7.2) $ 53.4 $ 46.2 Net Income 162% $ 0.34 $ 0.21 - 14% $ (0.09) $ 0.64 $ 0.55 EPS - 6% (5,665) 89,568 0% 25 83,878 83,903 Avg diluted shares (000s) 0.18% 0.66% - 0.10% 0.94% 0.84% Return on Assets 1.48% 7.82% - 1.89% 11.19% 9.30% Return on Tangible Equity 0.56% 3.22% - 0.04% 3.82% 3.78% Net Interest Margin - 0.02% 65.60% 2.49% 63.09% 65.58% Efficiency Ratio 4
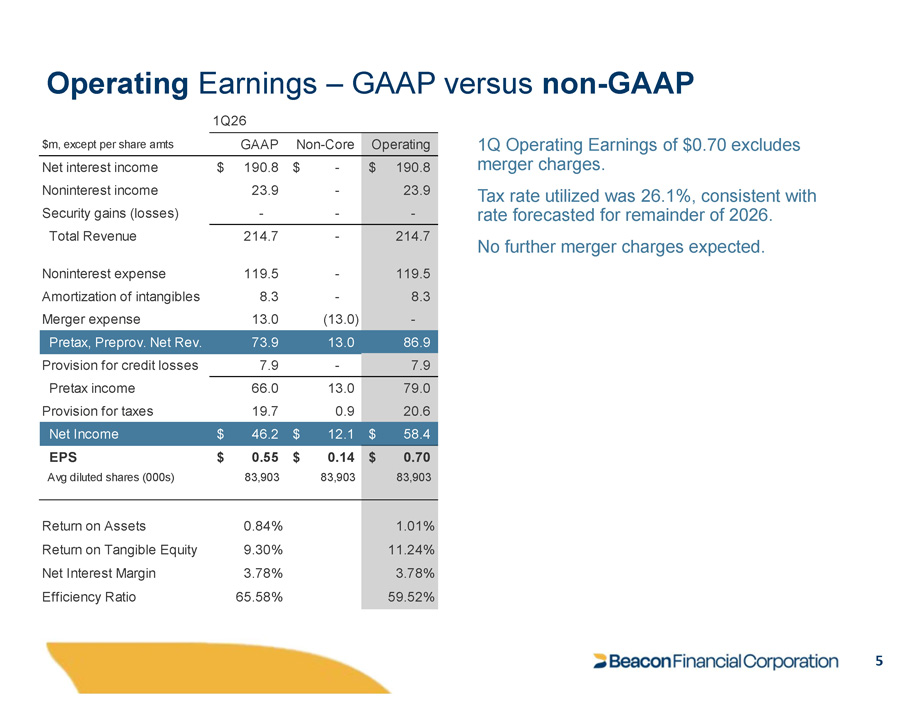
Operating Earnings – GAAP versus non - GAAP 5 1Q Operating Earnings of $0.70 excludes merger charges. Tax rate utilized was 26.1%, consistent with rate forecasted for remainder of 2026. No further merger charges expected. Operating Non - Core GAAP $m, except per share amts $ 190.8 $ 190.8 $ - Net interest income 23.9 23.9 - Noninterest income - - - Security gains (losses) 214.7 214.7 - Total Revenue 119.5 119.5 - Noninterest expense 8.3 8.3 - Amortization of intangibles - 13.0 (13.0) Merger expense 86.9 13.0 73.9 Pretax, Preprov. Net Rev. 7.9 7.9 - Provision for credit losses 79.0 13.0 66.0 Pretax income 20.6 0.9 19.7 Provision for taxes $ 58.4 $ 12.1 $ 46.2 Net Income $ 0.70 EPS $ 0.55 $ 0.14 83,903 Avg diluted shares (000s) 83,903 83,903 1.01% 0.84% Return on Assets 11.24% 9.30% Return on Tangible Equity 3.78% 3.78% Net Interest Margin 59.52% 65.58% Efficiency Ratio 1Q26
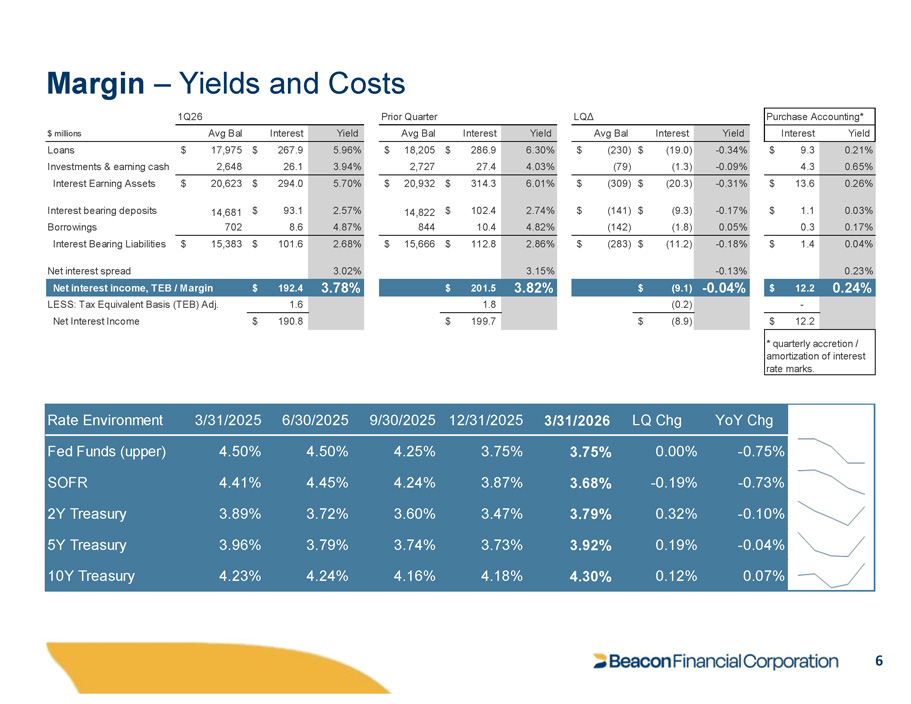
Margin – Yields and Costs Yield Interest Avg Bal $ millions 5.96% $ 267.9 $ 17,975 Loans 3.94% 26.1 2,648 Investments & earning cash 5.70% $ 294.0 $ 20,623 Interest Earning Assets 2.57% $ 93.1 14,681 Interest bearing deposits 4.87% 8.6 702 Borrowings 2.68% $ 101.6 $ 15,383 Interest Bearing Liabilities 3.02% Net interest spread Yield Interest Avg Bal 6.30% $ 286.9 $ 18,205 4.03% 27.4 2,727 6.01% $ 314.3 $ 20,932 2.74% $ 102.4 14,822 4.82% 10.4 844 2.86% 3.15% $ 112.8 $ 15,666 Yield Interest Avg Bal - 0.34% $ (19.0) $ (230) - 0.09% (1.3) (79) - 0.31% $ (20.3) $ (309) - 0.17% $ (9.3) $ (141) 0.05% (1.8) (142) - 0.18% - 0.13% $ (11.2) $ (283) Purchase Accounting* Yield Interest 0.21% $ 9.3 0.65% 4.3 0.26% $ 13.6 0.03% $ 1.1 0.17% 0.3 0.04% 0.23% $ 1.4 1Q26 Prior Quarter LQΔ Net interest income, TEB / Margin $ 192.4 3.78% $ 201.5 3.82% $ (9.1) - 0.04% $ 12.2 0.24% - $ 12.2 * quarterly accretion / amortization of interest rate marks. LESS: Tax Equivalent Basis (TEB) Adj. 1.6 Net Interest Income $ 190.8 1.8 (0.2) 199.7 $ (8.9) $ YoY Chg LQ Chg 3/31/2026 12/31/2025 9/30/2025 6/30/2025 3/31/2025 Rate Environment - 0.75% 0.00% 3.75% 3.75% 4.25% 4.50% 4.50% Fed Funds (upper) - 0.73% - 0.19% 3.68% 3.87% 4.24% 4.45% 4.41% SOFR - 0.10% 0.32% 3.79% 3.47% 3.60% 3.72% 3.89% 2Y Treasury - 0.04% 0.19% 3.92% 3.73% 3.74% 3.79% 3.96% 5Y Treasury 0.07% 0.12% 4.30% 4.18% 4.16% 4.24% 4.23% 10Y Treasury 6
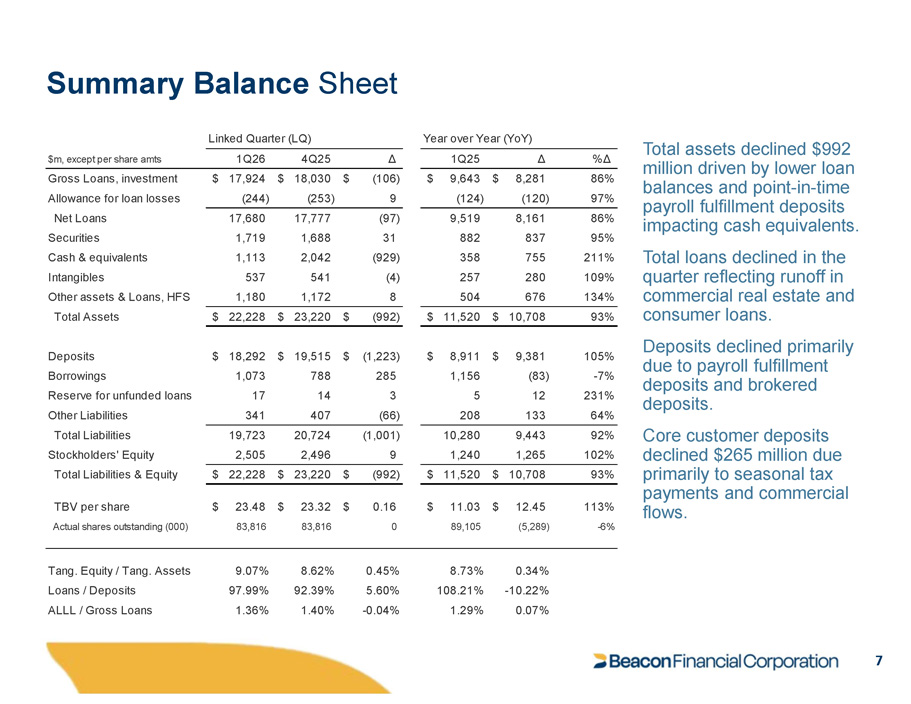
Summary Balance Sheet primarily to seasonal tax payments and commercial flows. %Δ Δ 1Q25 Δ 4Q25 1Q26 $m, except per share amts 86% $ 8,281 $ 9,643 $ (106) $ 18,030 $ 17,924 Gross Loans, investment 97% (120) (124) 9 (253) (244) Allowance for loan losses 86% 8,161 9,519 (97) 17,777 17,680 Net Loans 1,719 1,113 537 1,180 1,688 2,042 541 1,172 31 (929) (4) 8 882 358 257 504 837 755 280 676 95% 211% 109% 134% Securities Cash & equivalents Intangibles Other assets & Loans, HFS Total Assets Total assets declined $992 million driven by lower loan balances and point - in - time payroll fulfillment deposits impacting cash equivalents. Total loans declined in the quarter reflecting runoff in commercial real estate and 93% consumer loans. Deposits declined primarily due to payroll fulfillment deposits and brokered deposits. $ 22,228 $ 23,220 $ (992) $ 11,520 $ 10,708 105% $ 9,381 $ 8,911 $ (1,223) $ 19,515 $ 18,292 Deposits - 7% (83) 1,156 285 788 1,073 Borrowings 231% 12 5 3 14 17 Reserve for unfunded loans 64% 133 208 (66) 407 341 Other Liabilities Core customer deposits 92% 9,443 10,280 (1,001) 20,724 19,723 Total Liabilities declined $265 million due 102% 1,265 1,240 9 2,496 2,505 Stockholders' Equity 93% $ 10,708 $ 11,520 $ (992) $ 23,220 $ 22,228 Total Liabilities & Equity 113% $ 12.45 $ 11.03 $ 0.16 $ 23.32 $ 23.48 TBV per share - 6% (5,289) 89,105 0 83,816 83,816 Actual shares outstanding (000) 0.34% 8.73% 0.45% 8.62% 9.07% Tang. Equity / Tang. Assets - 10.22% 108.21% 5.60% 92.39% 97.99% Loans / Deposits 0.07% 1.29% - 0.04% 1.40% 1.36% ALLL / Gross Loans Linked Quarter (LQ) Year over Year (YoY) 7
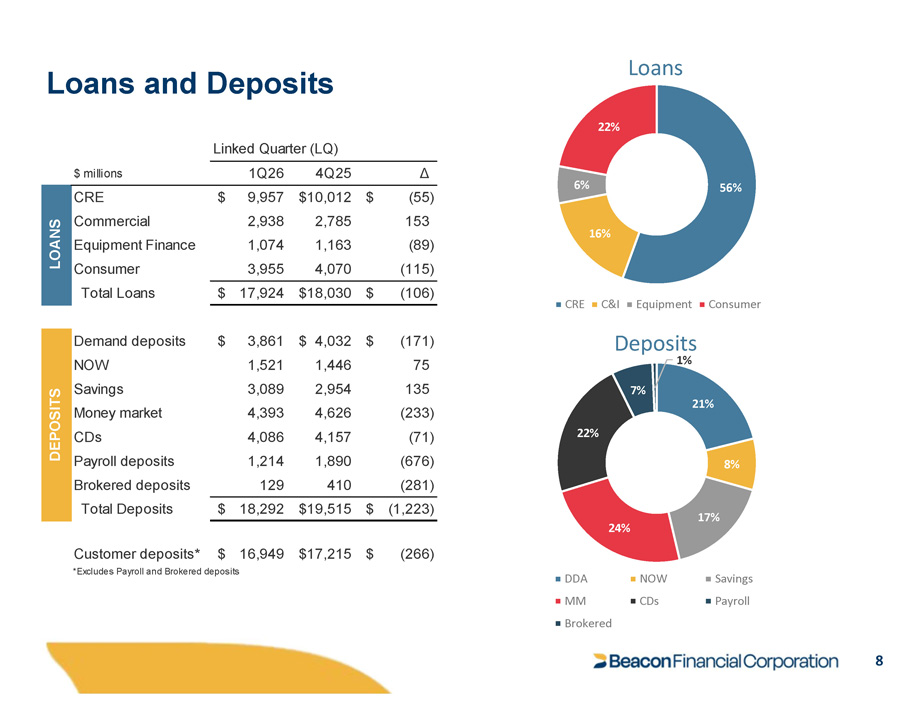
Loans and Deposits 56% 16% 6% 22% Loans CRE C&I Equipment Consumer 21% 8% 17% 24% 22% 7% 1% Deposits NOW CDs Savings Payroll DDA MM Brokered $ millions 1Q26 4Q25 Δ $ 9,957 2,938 1,074 3,955 $10,012 $ 2,785 1,163 4,070 (55) 153 (89) (115) CRE Commercial Equipment Finance Consumer Total Loans $ 17,924 $18,030 $ (106) Demand deposits NOW Savings Money market CDs Payroll deposits Brokered deposits Total Deposits $ 3,861 1,521 3,089 4,393 4,086 1,214 129 $ 4,032 1,446 2,954 4,626 4,157 1,890 410 $ (171) 75 135 (233) (71) (676) (281) $ 18,292 $19,515 $ (1,223) 16,949 Customer deposits* $ *Excludes Payroll and Brokered deposits $17,215 $ (266) Linked Quarter (LQ) LOANS DEPOSITS 8
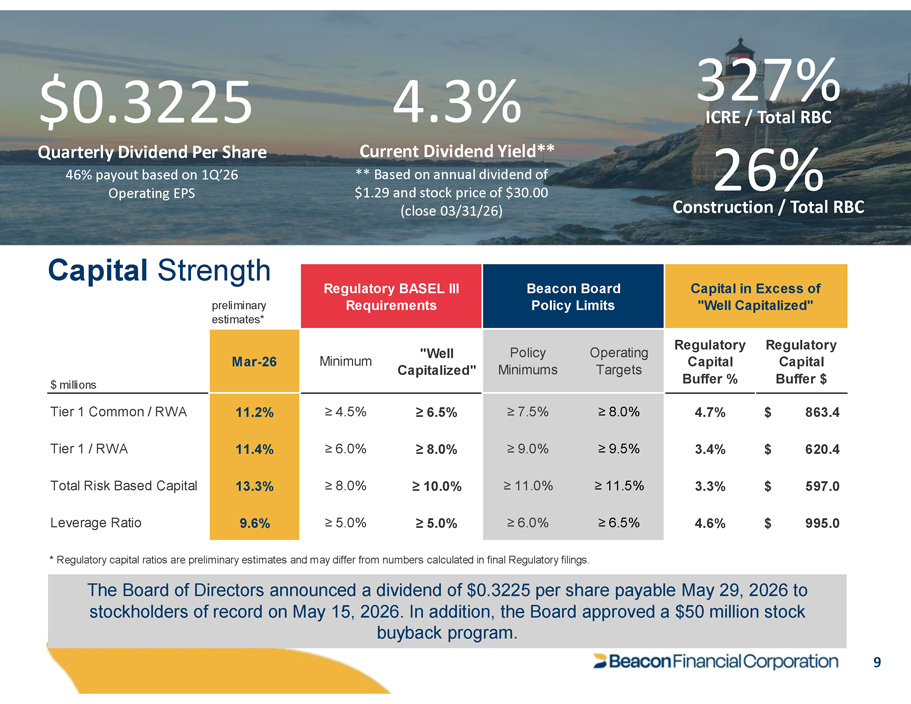
Capital Strength 9 preliminary estimates* Capital in Excess of "Well Capitalized" Beacon Board Policy Limits Regulatory BASEL III Requirements Regulatory Capital Buffer $ Regulatory Capital Buffer % Operating Targets Policy Minimums "Well Capitalized" Minimum Mar - 26 $ millions $ 863.4 4.7% ≥ 8.0% ≥ 7.5% ≥ 6.5% ≥ 4.5% 11.2% Tier 1 Common / RWA $ 620.4 3.4% ≥ 9.5% ≥ 9.0% ≥ 8.0% ≥ 6.0% 11.4% Tier 1 / RWA $ 597.0 3.3% ≥ 11.5% ≥ 11.0% ≥ 10.0% ≥ 8.0% 13.3% Total Risk Based Capital $ 995.0 4.6% ≥ 6.5% ≥ 6.0% ≥ 5.0% ≥ 5.0% 9.6% Leverage Ratio * Regulatory capital ratios are preliminary estimates and may differ from numbers calculated in final Regulatory filings. $0.3225 Quarterly Dividend Per Share 46% payout based on 1Q’26 Operating EPS 4.3% Current Dividend Yield** ** Based on annual dividend of $1.29 and stock price of $30.00 (close 03/31/26) 327% ICRE / Total RBC The Board of Directors announced a dividend of $0.3225 per share payable May 29, 2026 to stockholders of record on May 15, 2026. In addition, the Board approved a $50 million stock buyback program. 26% Construction / Total RBC
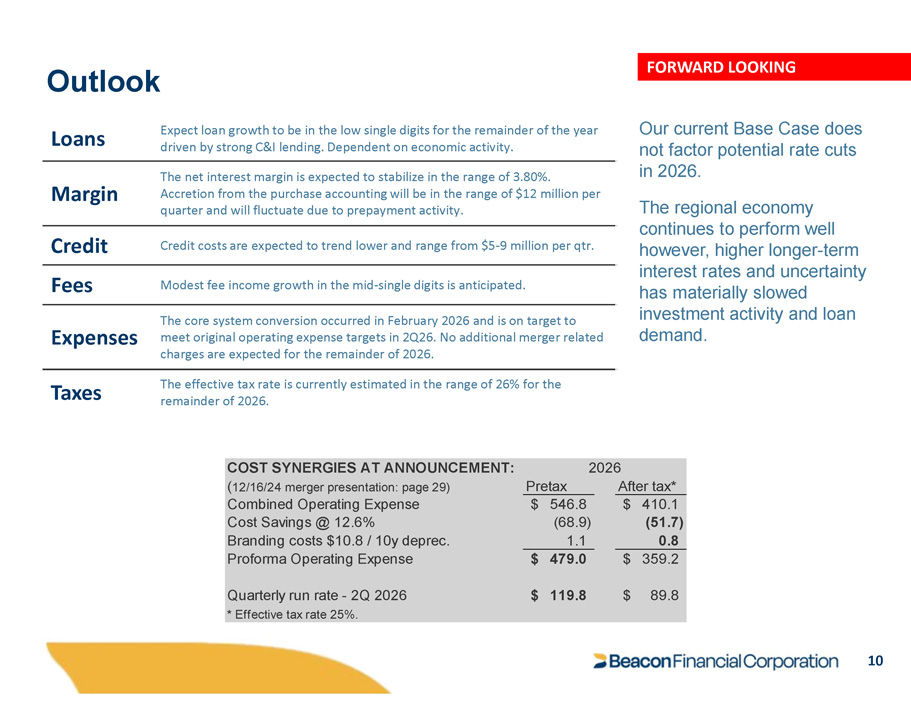
Outlook 10 Our current Base Case does not factor potential rate cuts in 2026. The regional economy continues to perform well however, higher longer - term interest rates and uncertainty has materially slowed investment activity and loan demand. FORWARD LOOKING Expect loan growth to be in the low single digits for the remainder of the year driven by strong C&I lending. Dependent on economic activity. Loans The net interest margin is expected to stabilize in the range of 3.80%. Accretion from the purchase accounting will be in the range of $12 million per quarter and will fluctuate due to prepayment activity. Margin Credit costs are expected to trend lower and range from $5 - 9 million per qtr. Credit Modest fee income growth in the mid - single digits is anticipated. Fees The core system conversion occurred in February 2026 and is on target to meet original operating expense targets in 2Q26. No additional merger related charges are expected for the remainder of 2026. Expenses The effective tax rate is currently estimated in the range of 26% for the remainder of 2026. Taxes 26 After tax* COST SYNERGIES AT ANNOUNCEMENT: 20 ( 12/16/24 merger presentation: page 29) Pretax $ 410.1 $ 546.8 Combined Operating Expense (51.7) (68.9) Cost Savings @ 12.6% 0.8 1.1 Branding costs $10.8 / 10y deprec. $ 359.2 $ 479.0 Proforma Operating Expense $ 89.8 $ 119.8 Quarterly run rate - 2Q 2026 * Effective tax rate 25%.
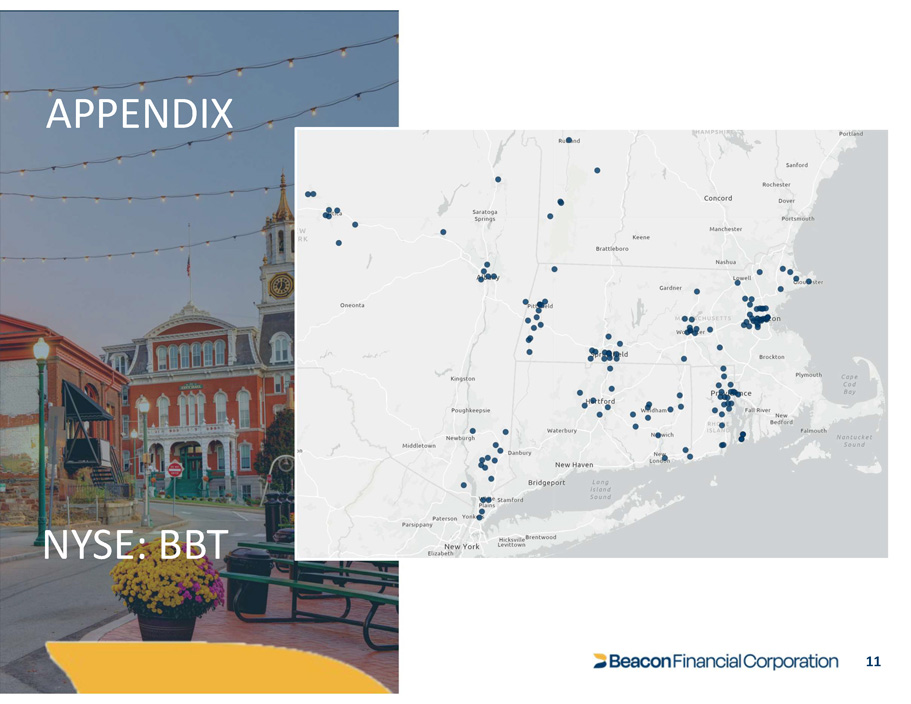
APPENDIX NYSE: BBT 11
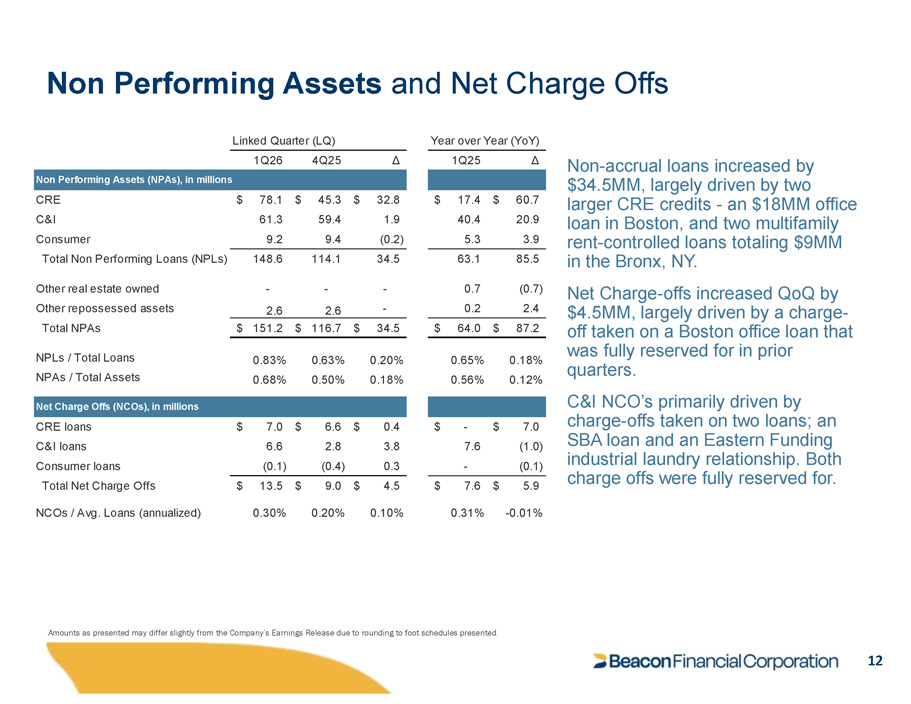
Non Performing Assets and Net Charge Offs 12 Non - accrual loans increased by $34.5MM, largely driven by two larger CRE credits - an $18MM office loan in Boston, and two multifamily rent - controlled loans totaling $9MM in the Bronx, NY. Net Charge - offs increased QoQ by $4.5MM, largely driven by a charge - off taken on a Boston office loan that was fully reserved for in prior quarters. C&I NCO’s primarily driven by charge - offs taken on two loans; an SBA loan and an Eastern Funding industrial laundry relationship. Both charge offs were fully reserved for. Δ 1Q25 Δ 4Q25 1Q26 Non Performing Assets (NPAs), in millions $ 60.7 $ 17.4 $ 32.8 $ 45.3 $ 78.1 CRE 20.9 40.4 1.9 59.4 61.3 C&I 3.9 5.3 (0.2) 9.4 9.2 Consumer 85.5 63.1 34.5 114.1 148.6 Total Non Performing Loans (NPLs) (0.7) 0.7 - - - Other real estate owned 2.4 0.2 2.6 2.6 - Other repossessed assets $ 87.2 $ 64.0 $ 34.5 $ 116.7 $ 151.2 Total NPAs 0.18% 0.65% 0.20% 0.63% 0.83% NPLs / Total Loans 0.12% 0.56% 0.18% 0.50% 0.68% NPAs / Total Assets Net Charge Offs (NCOs), in millions $ 7.0 $ - $ 0.4 $ 6.6 $ 7.0 CRE loans (1.0) 7.6 3.8 2.8 6.6 C&I loans (0.1) - 0.3 (0.4) (0.1) Consumer loans $ 5.9 $ 7.6 $ 4.5 $ 9.0 $ 13.5 Total Net Charge Offs - 0.01% 0.31% 0.10% 0.20% 0.30% NCOs / Avg. Loans (annualized) Linked Quarter (LQ) Year over Year (YoY) Amounts as presented may differ slightly from the Company’s Earnings Release due to rounding to foot schedules presented.
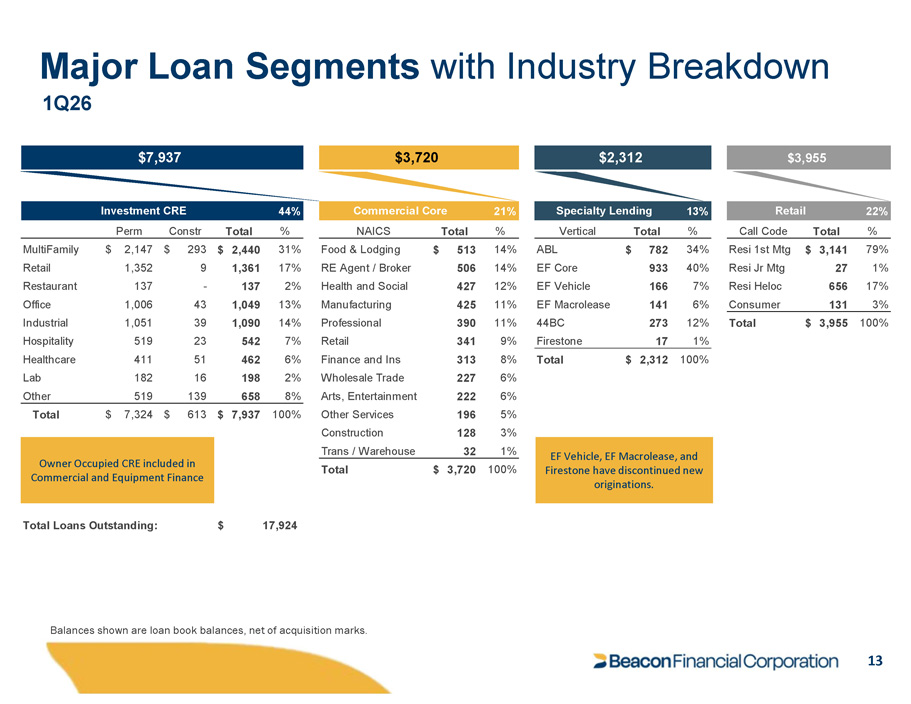
$7,937 $3,720 $2,312 $3,955 Investment CRE 44% Commercial Core 21% Specialty Lending 13% Retail 22% Perm Constr Total % NAICS Total % Vertical Total % Call Code Total % 79% $ 3,141 Resi 1st Mtg 34% $ 782 ABL 14% $ 513 Food & Lodging 31% $ 2,440 $ 293 $ 2,147 MultiFamily 1% 27 Resi Jr Mtg 40% 933 EF Core 14% 506 RE Agent / Broker 17% 1,361 9 1,352 Retail 17% 656 Resi Heloc 7% 166 EF Vehicle 12% 427 Health and Social 2% 137 - 137 Restaurant Consumer 131 3% 6% 141 EF Macrolease 11% 425 Manufacturing 13% 1,049 43 1,006 Office 100% $ 3,955 Total 12% 273 44BC 11% 390 Professional 14% 1,090 39 1,051 Industrial Firestone 17 1% 9% 341 Retail 7% 542 23 519 Hospitality Total $ 2,312 100% 8% 313 Finance and Ins 6% 462 51 411 Healthcare 6% 227 Wholesale Trade 2% 198 16 182 Lab 6% 222 Arts, Entertainment 8% 658 139 519 Other 5% 196 Other Services 100% $ 7,937 $ 613 $ 7,324 Total 3% 128 Construction 1% 32 Trans / Warehouse Total $ 3,720 100% Owner Occupied CRE included in Commercial and Equipment Finance Total Loans Outstanding: 17,924 $ Balances shown are loan book balances, net of acquisition marks. 13 Major Loan Segments with Industry Breakdown 1Q26 EF Vehicle, EF Macrolease, and Firestone have discontinued new originations.
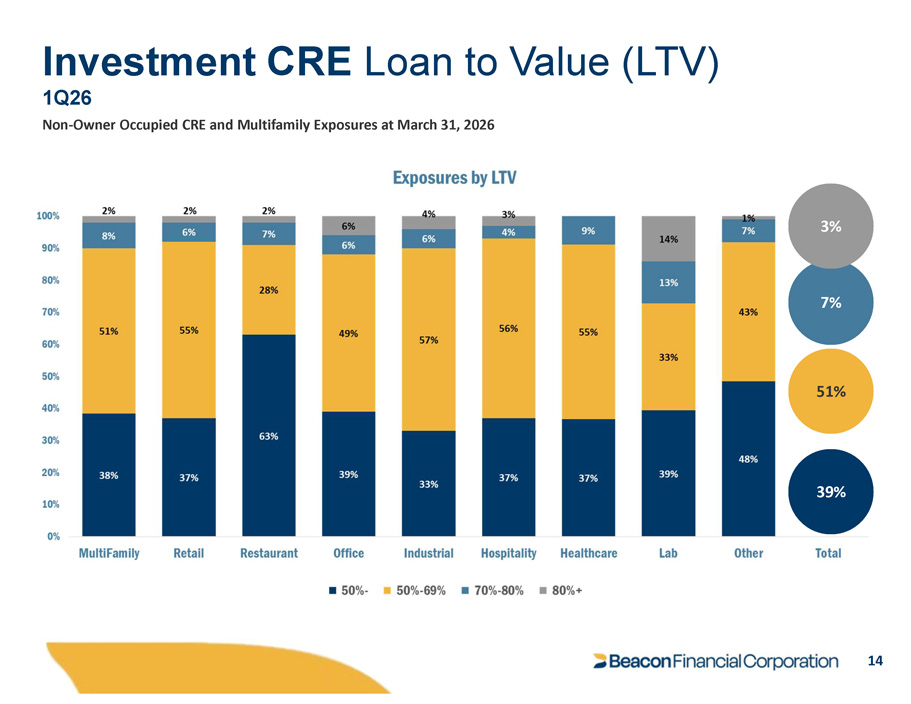
1Q26 Non - Owner Occupied CRE and Multifamily Exposures at March 31, 2026 39% 51% 7% 3% 14 Investment CRE Loan to Value (LTV)
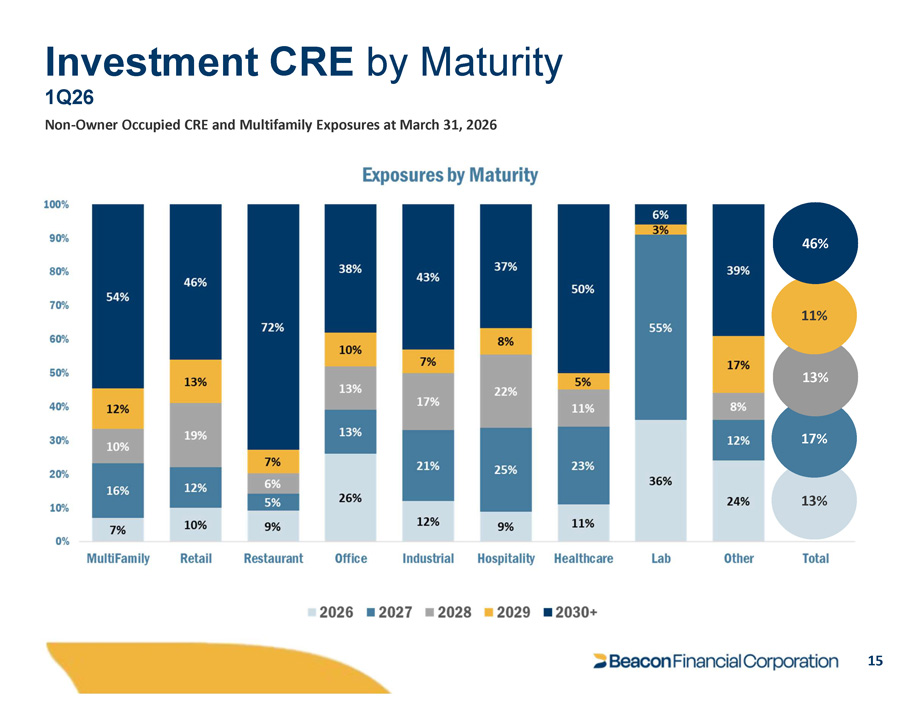
13% 13% 17% Investment CRE by Maturity 1Q26 Non - Owner Occupied CRE and Multifamily Exposures at March 31, 2026 11% 46% 15
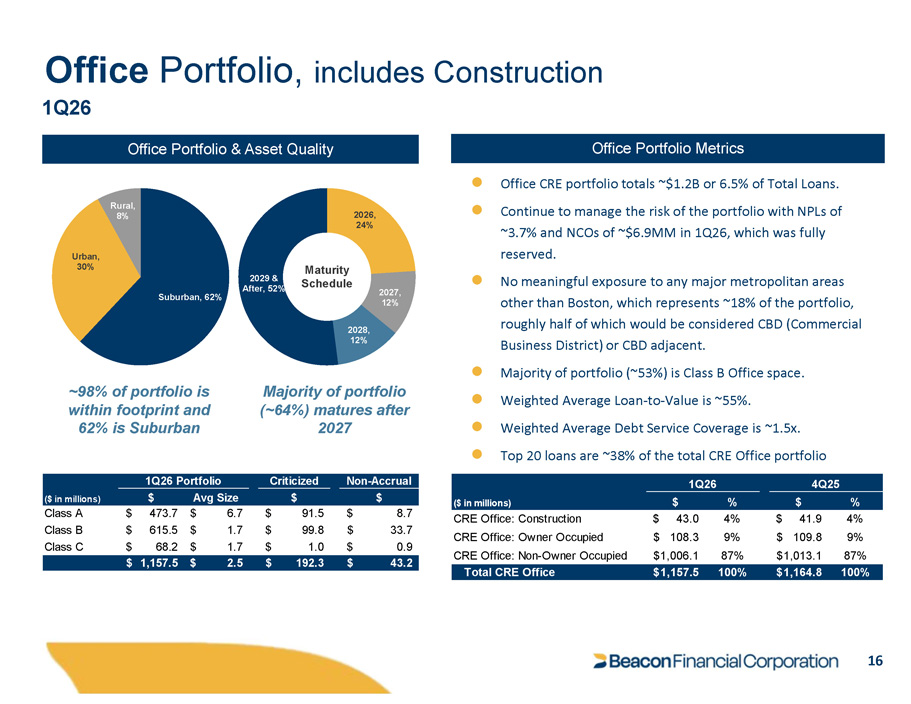
● Office CRE portfolio totals ~$1.2B or 6.5% of Total Loans. ● Continue to manage the risk of the portfolio with NPLs of ~3.7% and NCOs of ~$6.9MM in 1Q26, which was fully reserved. ● No meaningful exposure to any major metropolitan areas other than Boston, which represents ~18% of the portfolio, roughly half of which would be considered CBD (Commercial Business District) or CBD adjacent. ● Majority of portfolio (~53%) is Class B Office space. ● Weighted Average Loan - to - Value is ~55%. ● Weighted Average Debt Service Coverage is ~1.5x. ● Top 20 loans are ~38% of the total CRE Office portfolio Office Portfolio & Asset Quality Office Portfolio Metrics Suburban, 62% Urban, 30% Rural, 8% 2026, 24% 2027, 12% 2028, 12% 2029 & After, 52% Maturity Schedule ~98% of portfolio is within footprint and 62% is Suburban Majority of portfolio (~64%) matures after 2027 Office Portfolio, includes Construction 1Q26 1Q26 4Q25 % $ % $ ($ in millions) 4% $ 41.9 4% $ 43.0 CRE Office: Construction 9% $ 109.8 9% $ 108.3 CRE Office: Owner Occupied 87% $1,013.1 87% $1,006.1 CRE Office: Non - Owner Occupied Total CRE Office $1,157.5 100% $1,164.8 100% 16 Non - Accrual $ Criticized $ ortfolio Avg Size 1Q26 P $ ($ in millions) $ 8.7 $ 91.5 $ 6.7 $ 473.7 Class A $ 33.7 $ 99.8 $ 1.7 $ 615.5 Class B $ 0.9 $ 1.0 $ 1.7 $ 68.2 Class C $ 43.2 $ 192.3 $ 2.5 $ 1,157.5
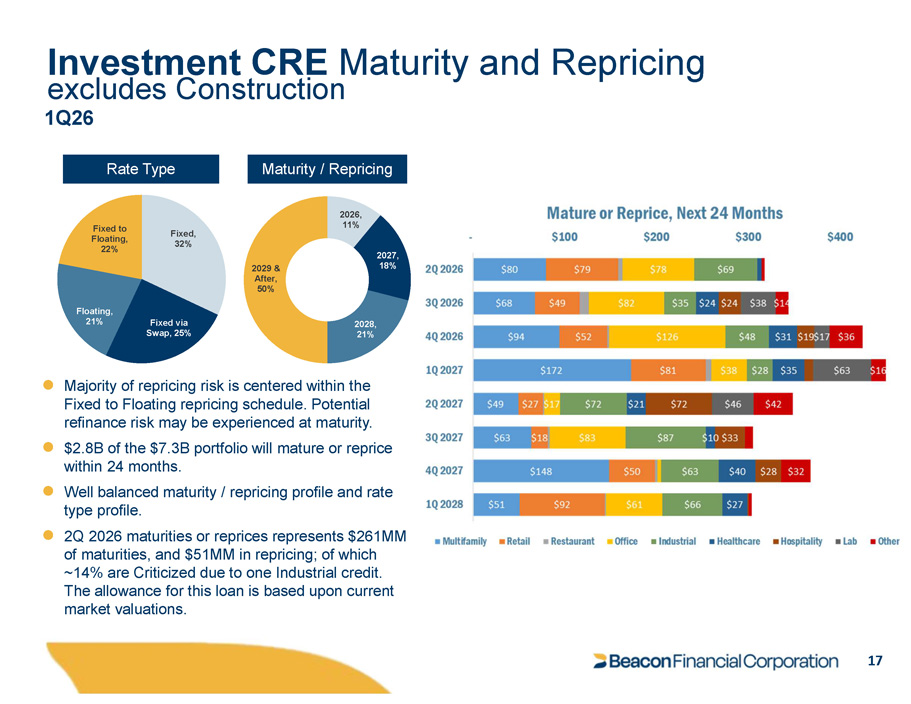
● Majority of repricing risk is centered within the Fixed to Floating repricing schedule . Potential refinance risk may be experienced at maturity . ● $2.8B of the $7.3B portfolio will mature or reprice within 24 months. ● Well balanced maturity / repricing profile and rate type profile. ● 2Q 2026 maturities or reprices represents $261MM of maturities, and $51MM in repricing; of which ~14% are Criticized due to one Industrial credit. The allowance for this loan is based upon current market valuations. Rate Type Fixed, 32% Fixed via Swap, 25% Floating, 21% Fixed to Floating, 22% 2026, 11% 2027, 18% 2028, 21% 2029 & After, 50% Maturity / Repricing Investment CRE Maturity and Repricing excludes Construction 1Q26 17
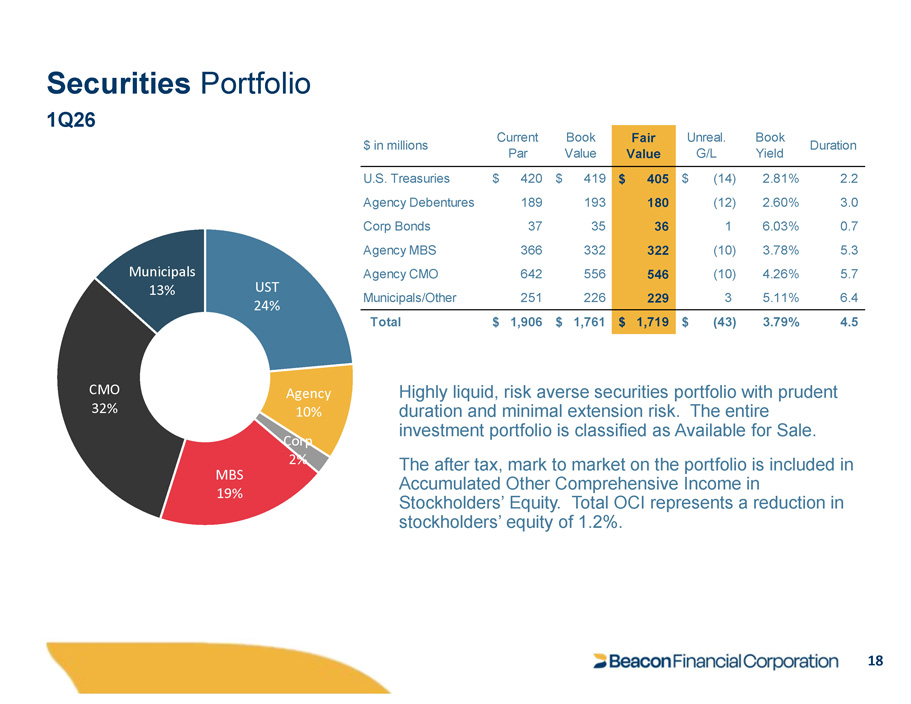
Securities Portfolio 1Q26 UST 24% 18 Agency 10% Corp 2% MBS 19% CMO 32% Municipals 13% Duration Book Yield Unreal. G/L Fair Value Book Value Current Par $ in millions 2.2 2.81% $ (14) $ 405 $ 419 $ 420 U.S. Treasuries 3.0 2.60% (12) 180 193 189 Agency Debentures 0.7 6.03% 1 36 35 37 Corp Bonds 5.3 3.78% (10) 322 332 366 Agency MBS 5.7 4.26% (10) 546 556 642 Agency CMO 6.4 5.11% 3 229 226 251 Municipals/Other 4.5 3.79% $ (43) $ 1,719 $ 1,761 $ 1,906 Total Highly liquid, risk averse securities portfolio with prudent duration and minimal extension risk. The entire investment portfolio is classified as Available for Sale. The after tax, mark to market on the portfolio is included in Accumulated Other Comprehensive Income in Stockholders’ Equity. Total OCI represents a reduction in stockholders’ equity of 1.2%.
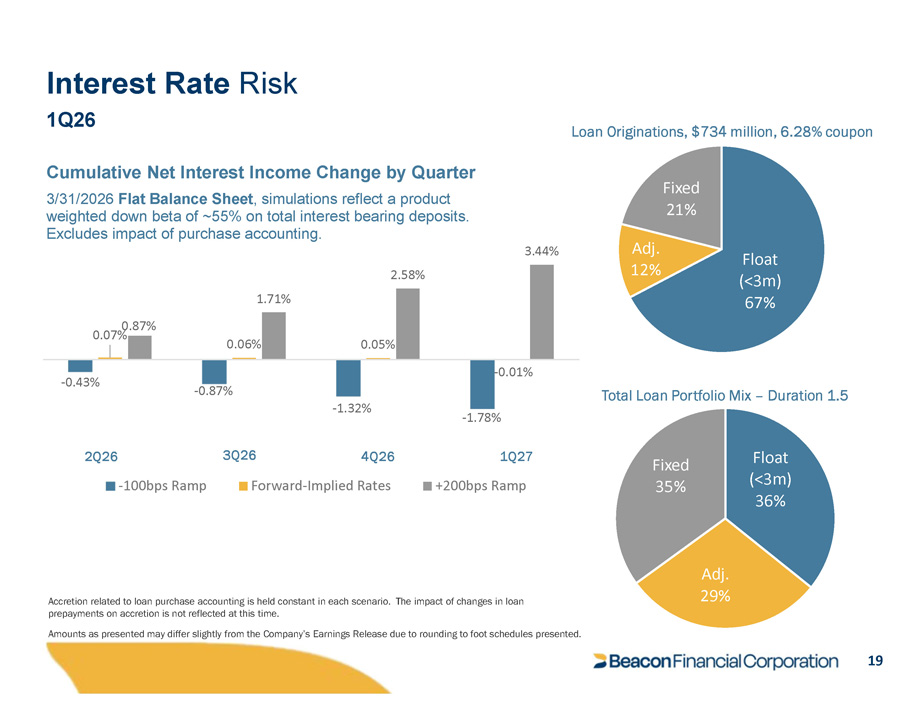
Interest Rate Risk 1Q26 Float (< 3 m) 67 % Adj. 12% Fixed 21% Loan Originations, $734 million, 6.28% coupon Total Loan Portfolio Mix – Duration 1.5 - 0.43% - 0.87% - 1.32% - 1.78% 0.07% 0.06% 0.05% - 0.01% 0.87% 1.71% 2.58% 3.44% Cumulative Net Interest Income Change by Quarter 3/31/2026 Flat Balance Sheet , simulations reflect a product weighted down beta of ~55% on total interest bearing deposits. Excludes impact of purchase accounting. - 100bps Ramp Forward - Implied Rates +200bps Ramp Float (< 3 m) 36 % 19 Adj. 29% Fixed 35% 3Q26 4Q26 1Q27 2Q26 Accretion related to loan purchase accounting is held constant in each scenario. The impact of changes in loan prepayments on accretion is not reflected at this time. Amounts as presented may differ slightly from the Company’s Earnings Release due to rounding to foot schedules presented.
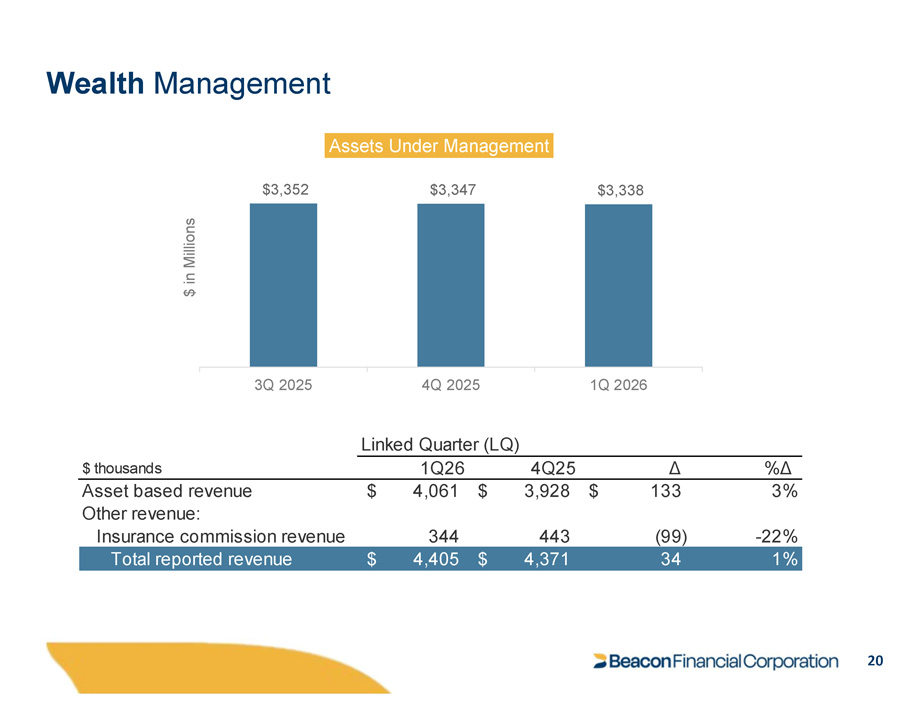
Wealth Management %Δ Δ 4Q25 1Q26 $ thousands 3% $ 133 $ 3,928 $ 4,061 Asset based revenue Other revenue: - 22% (99) 443 344 Insurance commission revenue 1% 34 $ 4,371 $ 4,405 Total reported revenue Linked Quarter (LQ) $3,352 20 $3,347 $3,338 3Q 2025 4Q 2025 1Q 2026 $ in Millions Assets Under Management

NYSE: BBT 21