
First Quarter 2026
Shareholder Letter

Laura Garcia, ‘artandpeople’ shop on Etsy

2
Dear Shareholders,
After more than 15 years at Etsy, I’ve stepped into the Chief Executive Officer role with a strong
understanding of what makes this marketplace special and where we have more work to do. Etsy has a
differentiated value proposition that remains deeply resonant with buyers and sellers, but we have not
consistently translated that strength into our customer experience. Over the past year, we’ve shared what
needed to change and the priorities we’re pursuing to bridge that gap.
Etsy’s path back to long-term growth is grounded in a focused plan: expanding how and where buyers
discover us, connecting them with items that feel personal and relevant, and building relationships that go
beyond transactions. This is how we’re working to turn the uniqueness and scale of our marketplace into a
lasting advantage, in order to drive greater engagement and stronger frequency.
We saw encouraging signals during the first quarter that our growth priorities are taking hold. We are
executing with discipline and measuring progress through observable changes in customer behavior. So,
following the completion of my first quarter as Etsy’s CEO, I have even more conviction in our focus, and
confidence in our ability to execute and translate recent momentum into durable growth.
First Quarter 2026 Key Performance Indicators
We are pleased that all key performance indicators are in-line with or ahead of the outlook provided for the
quarter, as shown in the table below. More importantly, we are beginning to see early improvements in
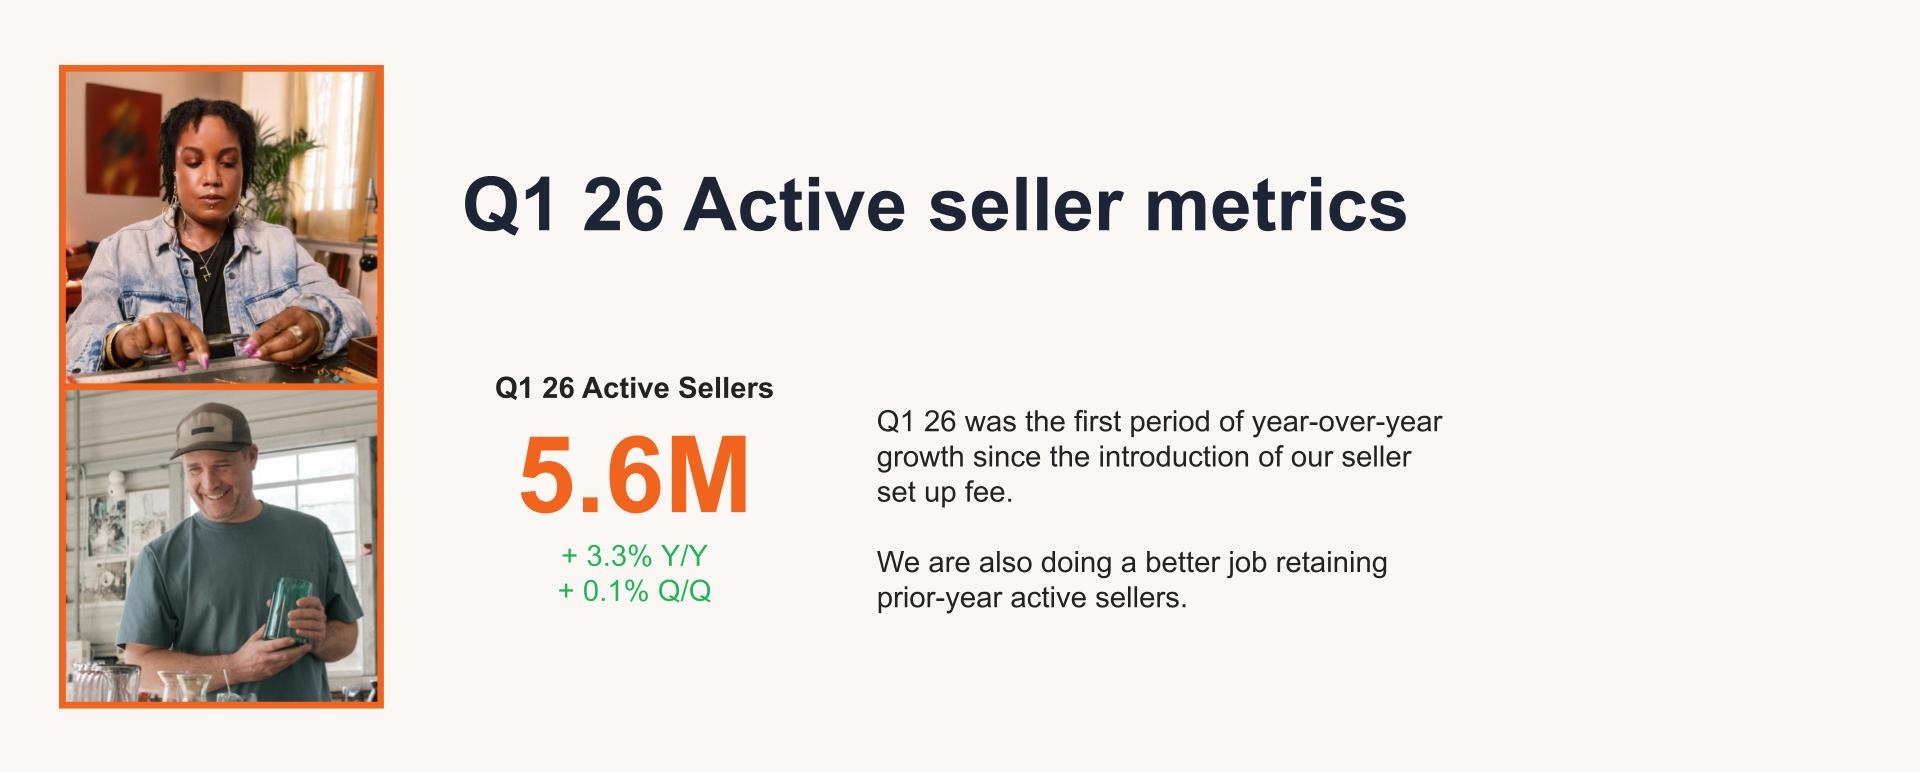
customer behavior that reflect progress against our strategy: active buyers grew sequentially for the first time
in two years, though still down from the prior year, and we delivered year-over-year growth in new buyers,
active sellers, and GMS per buyer, alongside continued momentum in our mobile app.
On February 15, we entered an agreement to sell Depop to eBay for $1.2 billion. We have received regulatory clearance for the transaction in the United States and Germany, and reviews are in progress for other markets (including the United Kingdom and Australia). Closing is currently expected by the end of the third quarter of 2026. Given this pending sale, Etsy’s results of operations are presented on a continuing operations basis, while Depop is presented as a discontinued operation for all periods presented. Due to the sale of Reverb on June 2, 2025, continuing operations presented herein includes Reverb and Etsy marketplaces for Q1 2025, but Q1 2026 reflects the Etsy marketplace only. This makes year- over-year continuing operations results not directly comparable. To provide investors with a meaningful basis for comparing our go-forward operations, we have included Etsy marketplace standalone year-over-year comparisons for GMS, Revenue, and Net Income below, along with comparisons on a continuing operations basis. | ||
Q1 2026 Key Performance Indicators | GMS | |
$2.5B +5.5% Y/Y Etsy Marketplace growth -3.9% Y/Y Continuing Operations basis | ||
REVENUE | TAKE RATE | |
$631M +7.6% Y/Y Etsy Marketplace growth +3.1% Y/Y Continuing Operations basis | 25.7% | |
NET INCOME | N E T I N C O M E | ADJ. EBITDA |
$105M +$33 million Y/Y Etsy Marketplace +$140 million Y/Y Continuing Operations basis | $185M 29.3% Adj. EBITDA Margin | |
Etsy Marketplace year-over-year revenue, net income growth, Adj. EBITDA and Adj. EBITDA Margin are non-GAAP financial measures. Reconciliation of
non-GAAP financial measures to the most comparable GAAP measures can be found in “Non-GAAP Financial Measures” below.
3
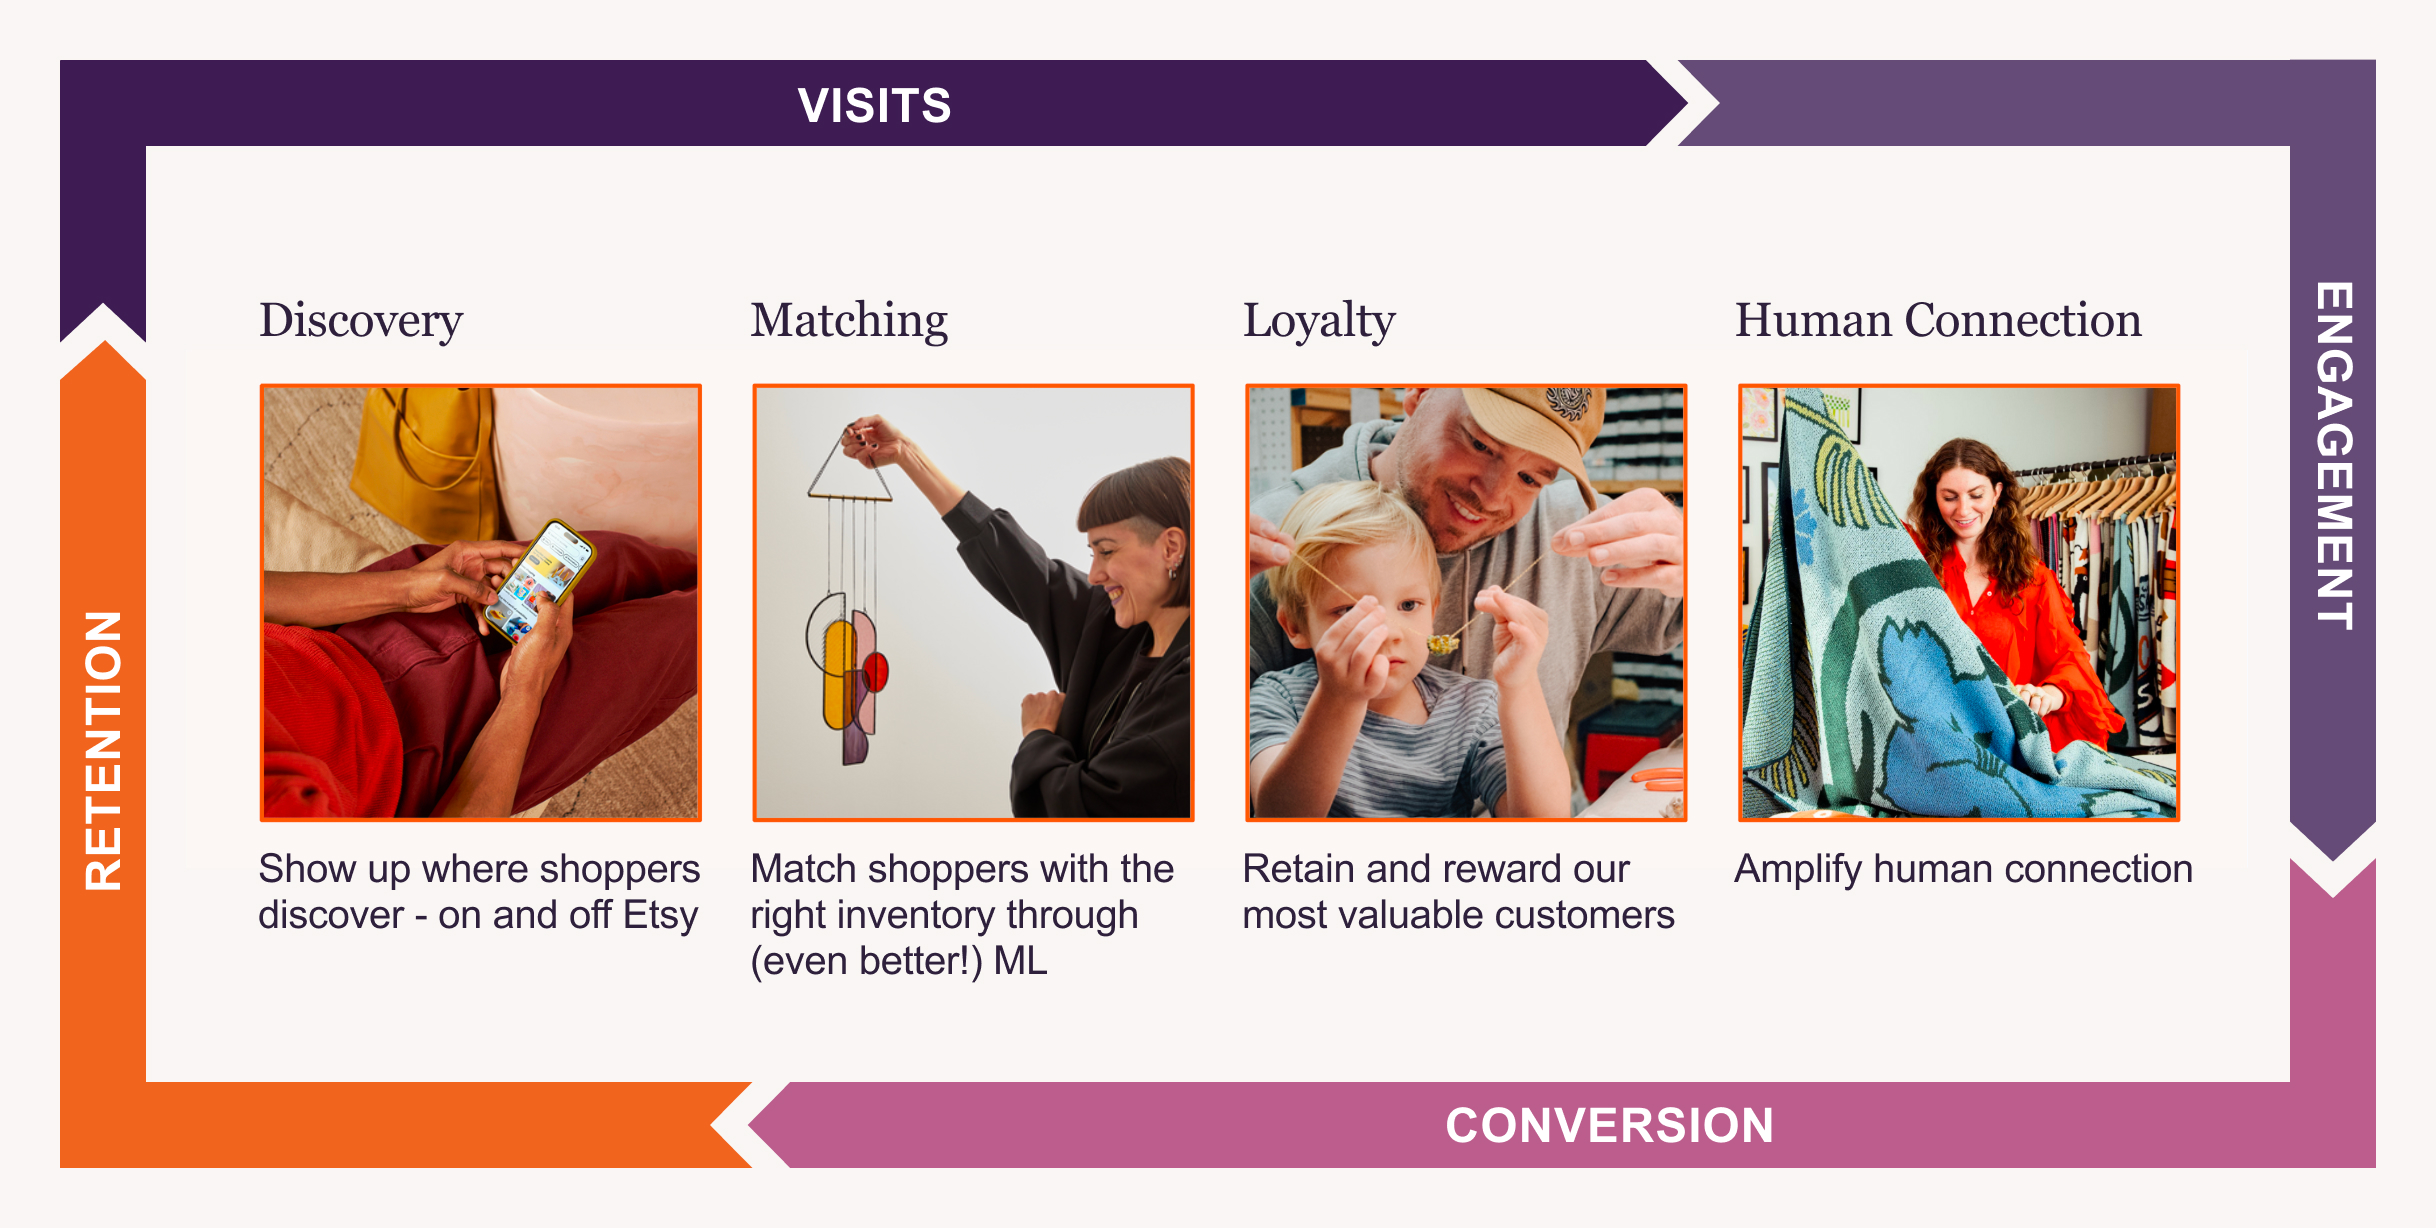
Progress Against Our Growth Priorities
Last year, we began executing against a focused set of growth priorities designed to improve the customer
experience and strengthen the core drivers of marketplace performance: visits, engagement, conversion, and
retention. These are to:
•Show up where shoppers discover — on and off Etsy
•Match shoppers with the right inventory through better machine learning (ML)
•Retain and reward our most valuable customers
•Amplify human connection
These priorities are designed to operate as a system, not as independent initiatives, to drive repeat purchase
behavior over time. Discovery and Matching help buyers discover and connect with the right items, while
Loyalty and Human Connection give them reasons to return.
Discovery and Matching are positively contributing to our performance
Today, we’re seeing our systematic approach come to life most clearly in the areas of Discovery and
Matching, where coordinated investments are already driving meaningful impact across the customer
experience and in our financial results. At its core, Etsy’s growth will depend on helping buyers discover items
that feel personal, relevant, and worth coming back for.
Our app is central to this transformation. It is where our investments in personalization, machine learning,
and direct buyer relationships come together most effectively. We’re seeing that translate into performance,
with app GMS growth continuing to outpace non-app GMS growth, and now representing ~47% of total GMS.
That gives us both validation and a clear path forward: as we continue improving personalization, optimizing
owned marketing, and growing adoption, we see meaningful opportunity to further increase app share and
drive frequency over time.
We are making meaningful progress improving how we match buyers with the right inventory.
Historically, our search systems have often prioritized what was most likely to convert in the moment —
favoring popular items over those most relevant to an individual buyer. We are shifting toward a more
personalized, relevance-driven approach with ML models that learn from both past behavior and real-time
intent. In early tests, these improvements are driving increases in add-to-cart rates and conversion. Examples
are shown below.
4

We’re continuing to expand the role of our personalized home feed recommendations. After driving
strong gains in engagement last year and into the first quarter, we are now inspiring discovery beyond a
shopper’s immediate intent. Early experiments using AI-generated buyer profiles are encouraging, driving
exploration across new shopping missions.
More personalized content in our owned email and push channels continues to drive strong
engagement - focusing on relevance over volume, helping deepen direct relationships with buyers.

As we move through the year, we’re investing where
we see the greatest opportunity to drive change –
particularly in Discovery – evolving our marketing
to engage shoppers earlier in their journey and
in more inspirational contexts. This includes
curated, occasion-based experiences, such as
recent activations around cultural moments, that
showcase Etsy’s differentiated, design-led inventory
and help expand when and how buyers consider
Etsy.
[Left: Tanner Fletcher x Etsy collaboration for New
York Bridal Fashion Week. Right: PinkPantheress x
Etsy collaboration for Coachella.]
Digging Deeper to Build Loyalty and Strengthen Human Connection
Retaining and Rewarding Our Most Valuable Customers. Our highest-value buyers and sellers drive a
disproportionate share of marketplace performance, making them a critical focus for driving growth. We are
prioritizing activities that enable us to test, learn and build conviction around the most effective ways to
deepen engagement for these customers. Here are some examples:
For Buyers: We’re learning that long term loyalty isn't built through a single program or initiative — but across
every interaction. So our approach spans the full experience—from more personalized recommendations, to
5
targeted offers, to programs like our Etsy Insider beta. We’re also moving towards more intentionally serving
our highest-value buyers. And importantly, we’re expanding ownership of our loyalty initiatives across product,
engineering, marketing, and operations—because all of those moments together determine whether a
customer chooses to return.
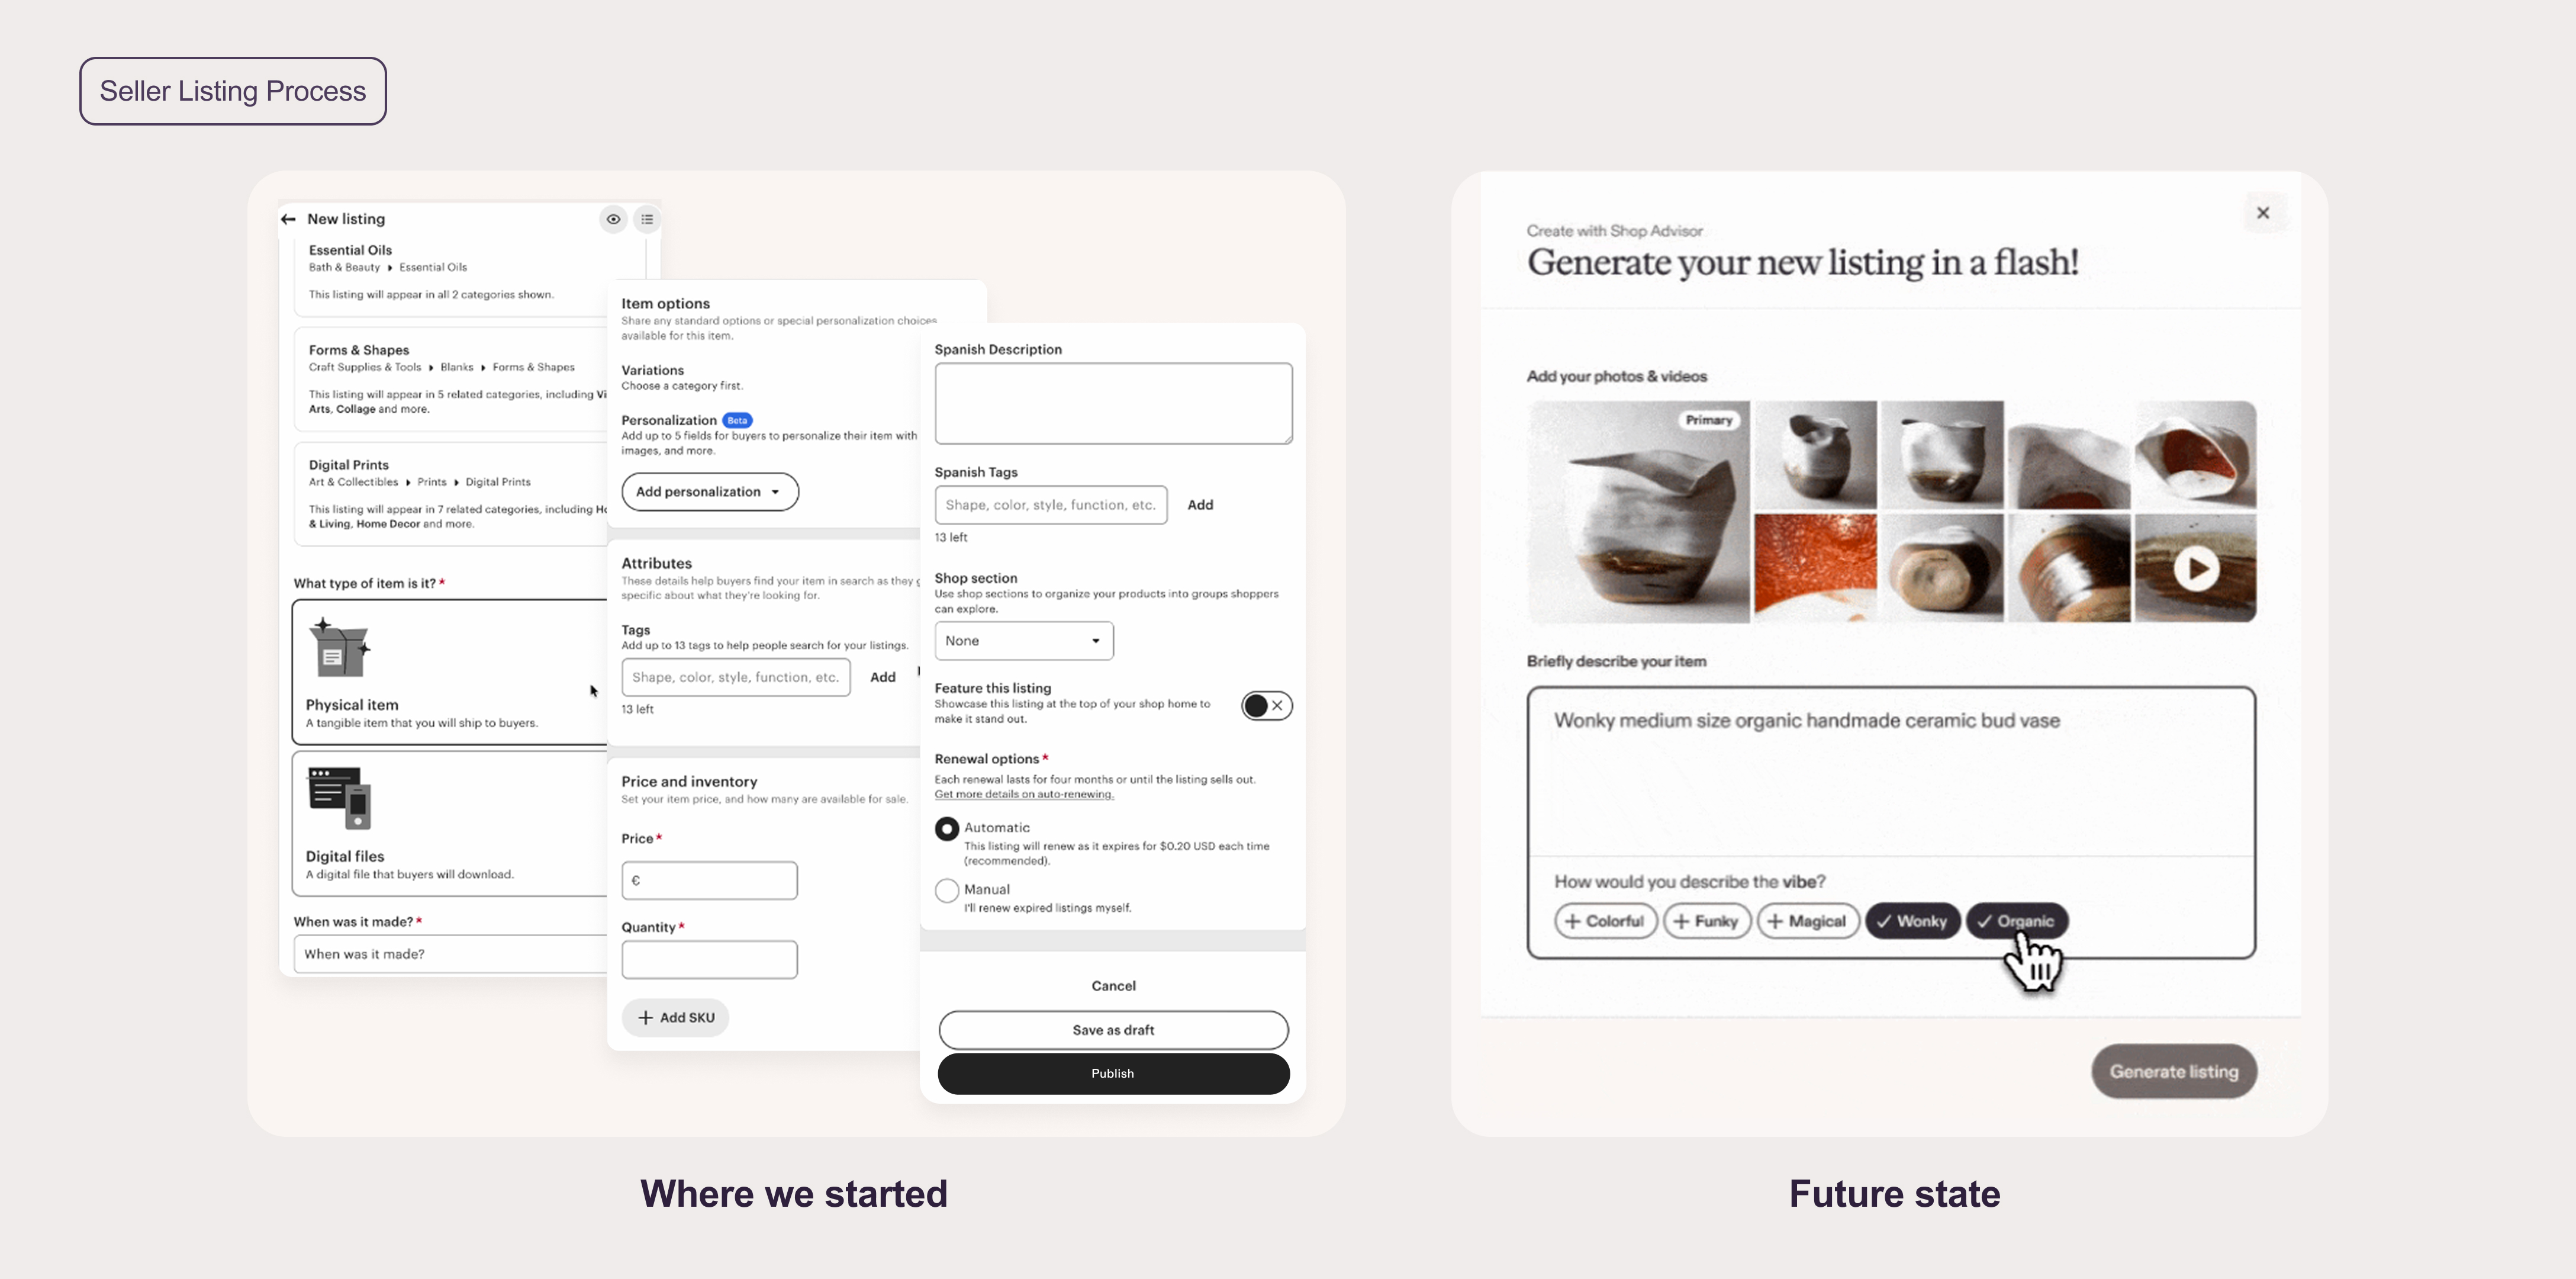
For Sellers: We’re looking to reduce friction and enable growth — particularly for those who drive the most
value to the marketplace — by addressing their most acute pain points. Today, much of the listing process
remains manual, requiring detailed inputs to bring products to life. We are using AI to simplify this work –
building on the AI-powered listing tools developed last year, and expanding into more automated workflows –
so sellers can spend less time managing their shops and more time creating and connecting with buyers.
At the same time, we’re investing more intentionally in understanding what enables our most successful
sellers to grow and how to make that path more accessible to others, which we expect will ultimately lead to a
stronger inventory offering, better buyer experiences, and higher lifetime value across the marketplace.
The below image reflects our prior seller listing process and where we are heading with this work.
For both Buyers and Sellers: In order to better support and build trust with both our buyers and sellers,
we’re making targeted improvements to the Etsy Purchase Protection program designed to make it more
effective and valued by our customers. Separately, we’re strengthening our customer support experience —
testing more targeted support and issue resolution for our top buyers and sellers.
Amplifying Human Connection. Buyers come to Etsy not only for what they buy, but for who they buy it
from. This connection is among our most defensible sources of differentiation – and one we have not yet fully
delivered on. Over the past several months, we have taken a more structured approach to understanding how
signals of seller identity – including craftsmanship, process visibility, and maker stories – influence buyer
behavior. We’re seeing from early tests that when these signals are more visible, buyers engage more deeply
and make decisions with greater confidence. Now we’ll begin to integrate these elements into core shopping
surfaces, strengthening trust, differentiation, and the overall experience.
6

Integrated agentic experiences, off-site and on
Agentic commerce as a driver of incremental traffic to Etsy. Much of the conversation around AI in
ecommerce has focused on agentic shopping — and we’re leaning into that opportunity through our
partnerships with OpenAI, Microsoft, and Google. We’re encouraged by the early learnings shared on our last
earnings call — and data continues to support strong growth in traffic and high-intent engagement from
buyers who come to Etsy through agentic search. We see this channel as an important and growing source of
discovery — particularly for a marketplace like Etsy, which has high brand awareness, but has historically
lacked buyer consideration for the many types of purchase occasions we can serve. These are early
partnerships in a space that is evolving rapidly: for example, we recently developed an Etsy App in ChatGPT,
aligned with Open AI’s shift for agentic shopping to be focused on retailer-run apps.
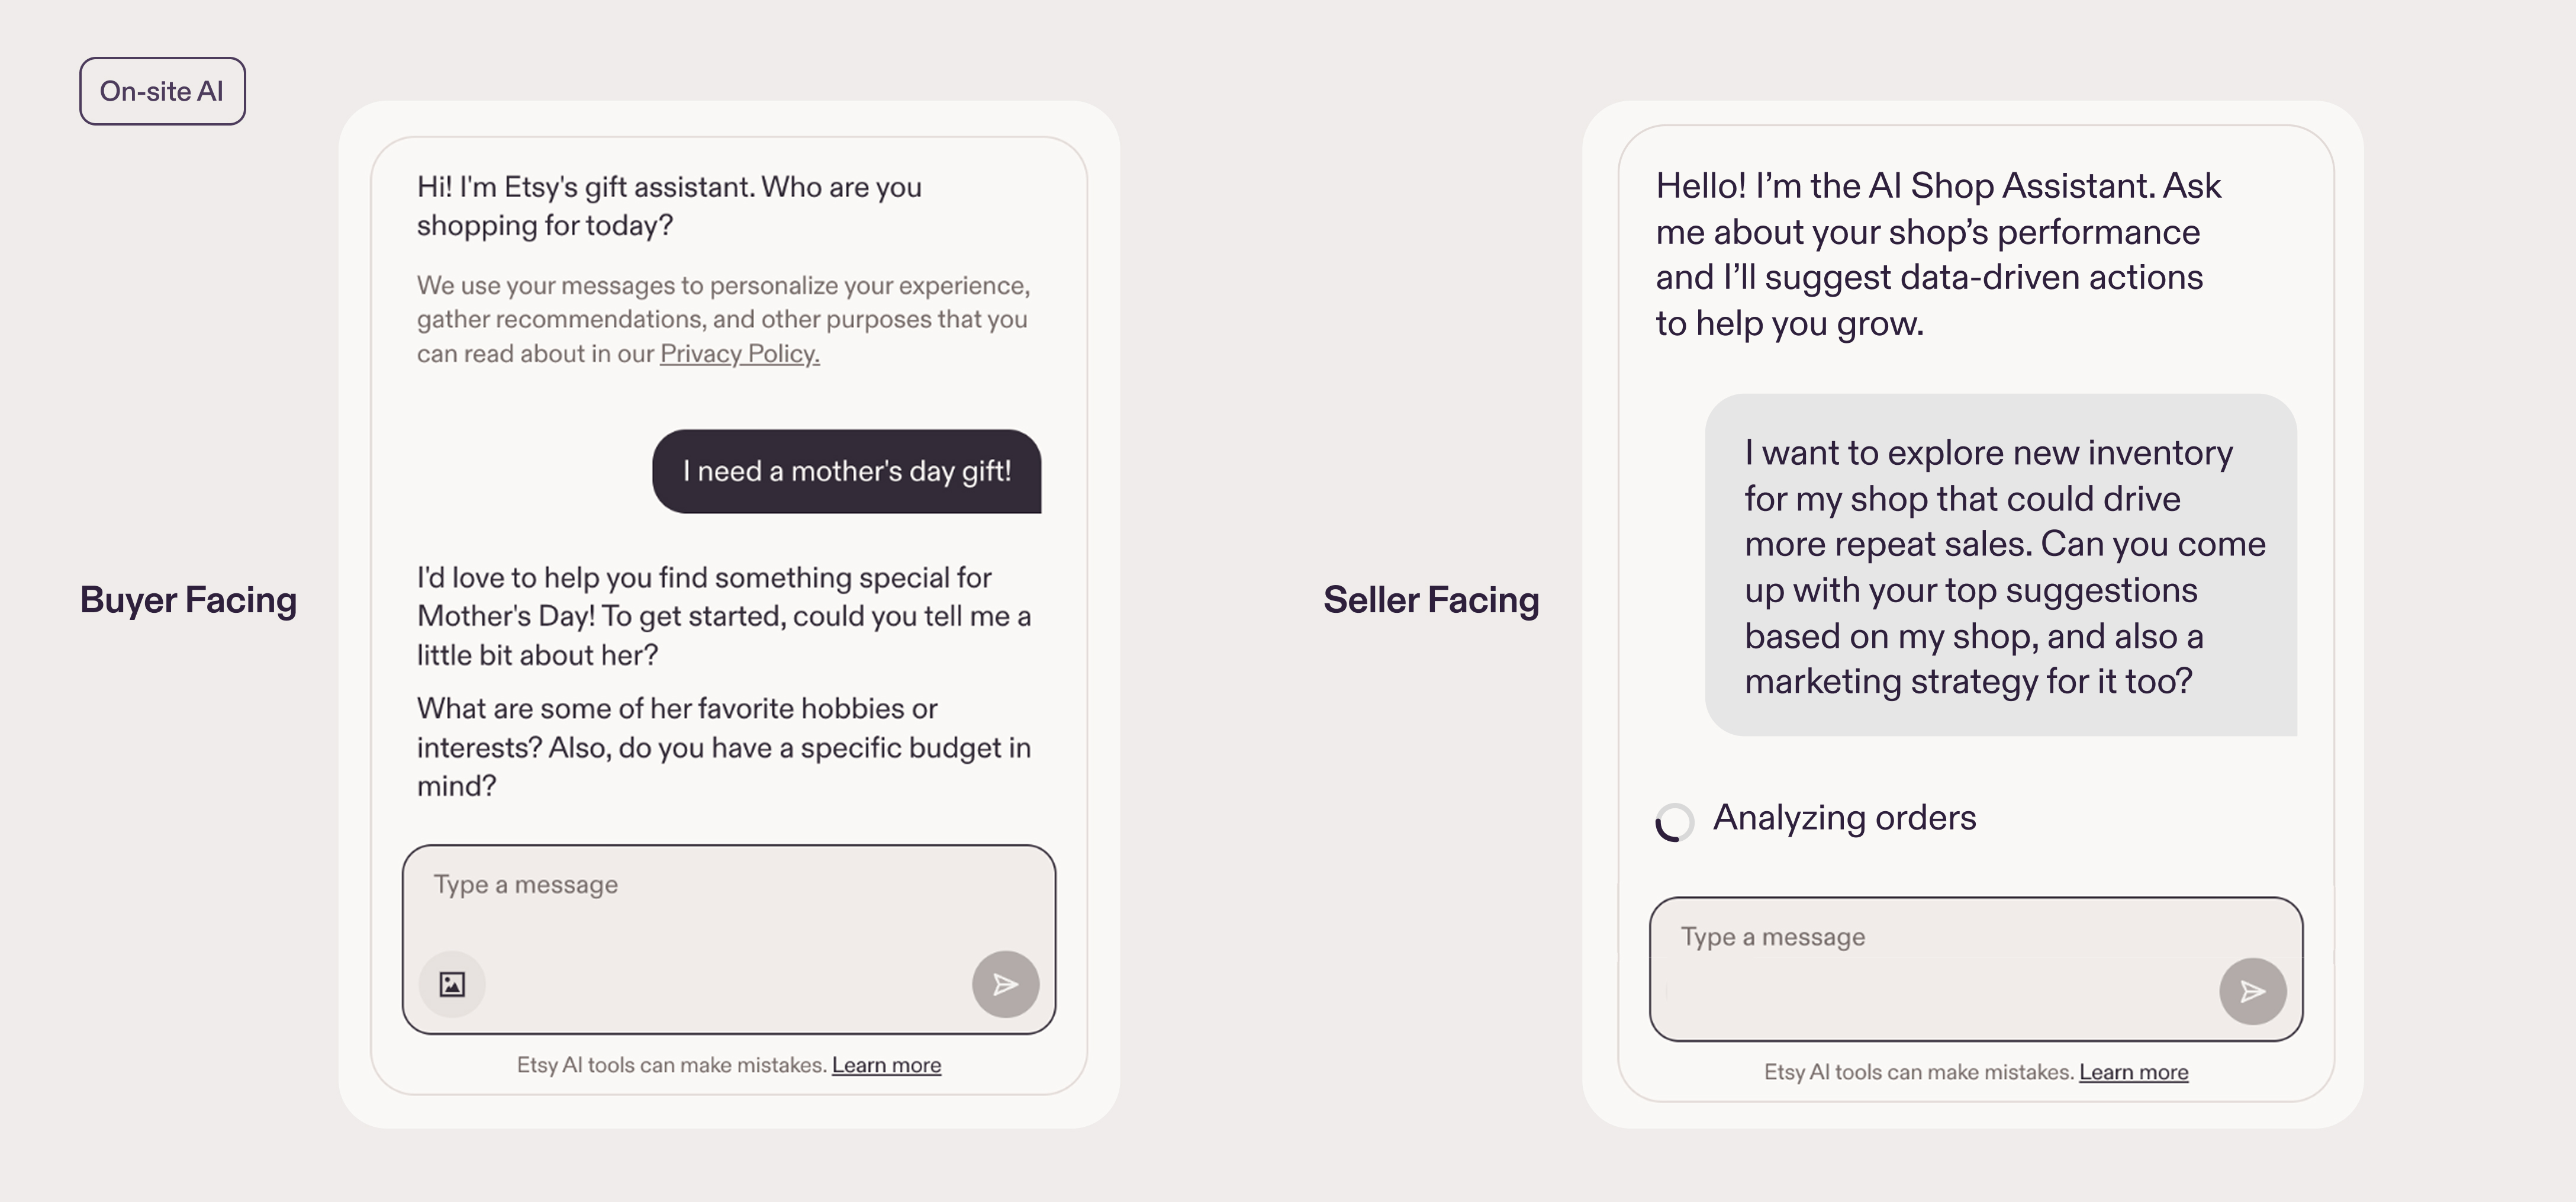
We’re also leaning into agentic commerce on Etsy — and have begun testing conversational AI
functionality. We’ve built two ‘agents’ (as shown below) — one for buyers, whose initial focus is to help them
find a great gift, and one for sellers, which brings together insights from across the platform — intended to
help them make better decisions, access the right resources, and reduce operational friction.
Speeding time-to-market. These are early examples of how we believe ML and AI will make our marketplace
meaningfully better for our customers at every touchpoint. Just as importantly, we’re now able to build and
iterate on these experiences in weeks rather than months by leveraging advances in modeling capabilities —
allowing us to move faster and learn more quickly, and ultimately contribute to our growth.
7
2026: Executing With Focus, Building For Growth
We’ve now delivered two consecutive quarters of year-over-year Etsy marketplace GMS growth, and our
outlook points to growth again this quarter. We are investing deliberately in the areas that matter most, guided
by early proof points and a sharper operating model. As a result, we are seeing our priorities gain traction,
and we expect continued progress. At the same time, we recognize that progress is not always linear, and it is
likely to take time to fully translate into sustained, durable growth. That is the nature of meaningful change.
While we’re closely monitoring the macroeconomic environment – particularly consumer confidence and
discretionary spending trends – our primary focus remains on what we can control: accelerating product
innovation, evolving how and where we show up for discovery, reinforcing trust through stronger customer
experiences, and executing with discipline against the priorities outlined in this letter.
What gives me confidence is not just what we’re seeing in our metrics, but what’s driving them. We are
grounded in what makes Etsy special, and have a clearer understanding of how our marketplace works at its
best. And we are rebuilding it around that system: expanding discovery, connecting buyers with meaningful,
differentiated items, and creating relationships that go beyond transactions. Etsy has always stood for
something different – creativity, human connection, and meaningful commerce. As technology continues to
evolve, particularly with the rise of AI, we believe those qualities become more important, not less.
We thank our employees for their creativity and dedication, our buyers and sellers who continue to build Etsy
with us, and you, our shareholders, for your continued trust.
Sincerely,

Kruti Patel Goyal
Chief Executive Officer
April 29, 2026
Images presented above are for illustrative purposes only and may depict work in progress.
8
Q1 2026 Financial Results
Given the pending sale of Depop, Etsy’s results of operations are presented on a continuing operations basis,
while Depop is presented as a discontinued operation for all periods presented. Due to the sale of Reverb on
June 2, 2025, continuing operations for Q1 2025 include Reverb and Etsy marketplaces, but Q1 2026 reflects
the Etsy marketplace only. This makes year-over-year continuing operations results not directly comparable.
The GMS drivers and key customer metrics presented below are for the Etsy marketplace only.
Q1 2026 Etsy Marketplace GMS Drivers and Key Customer Metrics
Etsy marketplace GMS advances to solid year-over-year growth
Etsy marketplace GMS was $2.5 billion, up 5.5% year-over-year, representing a 540 basis-points (bps)
improvement compared to GMS growth in the fourth quarter of 2025. On a currency neutral basis, GMS
growth was up 3.6% year-over-year. Progress in both product development and marketing are beginning to
translate into underlying improvements across marketplace fundamentals, and we also benefited from foreign
exchange tailwinds and softer performance in the prior-year comparable period.
Given our focus to make the mobile app our premier shopping experience, it is encouraging to see further
acceleration in its GMS growth, with app share of the total continuing to climb. This is important, as app users
consistently visit more often, engage more deeply, and convert at higher rates than non-app users on
average.
Mobile app continued to drive GMS share gains, reaching ~47% of total GMS (~240 bps year-over-year expansion). | Mobile app GMS growth accelerated to +11.2% year- over-year in the first quarter of 2026 (vs. +6.6% last quarter). | Non-app GMS also improved, growing +1.0% year-over-year (vs. -4.8% last quarter). |
We are also seeing solid performance from our marketing efforts, as we continue to evolve our portfolio mix to
meet shoppers where they discover, and scale the impact of our owned and organic channels. In the first
quarter, we leaned into paid search, where we saw strong returns and benefited from continued structural
improvements in product listing ad (PLA) segmentation, data feeds, and reach. We also benefited from search
engine optimization (SEO) improvements, which strengthened search visibility and ranking.
Additional drivers of Q1 2026 GMS include:
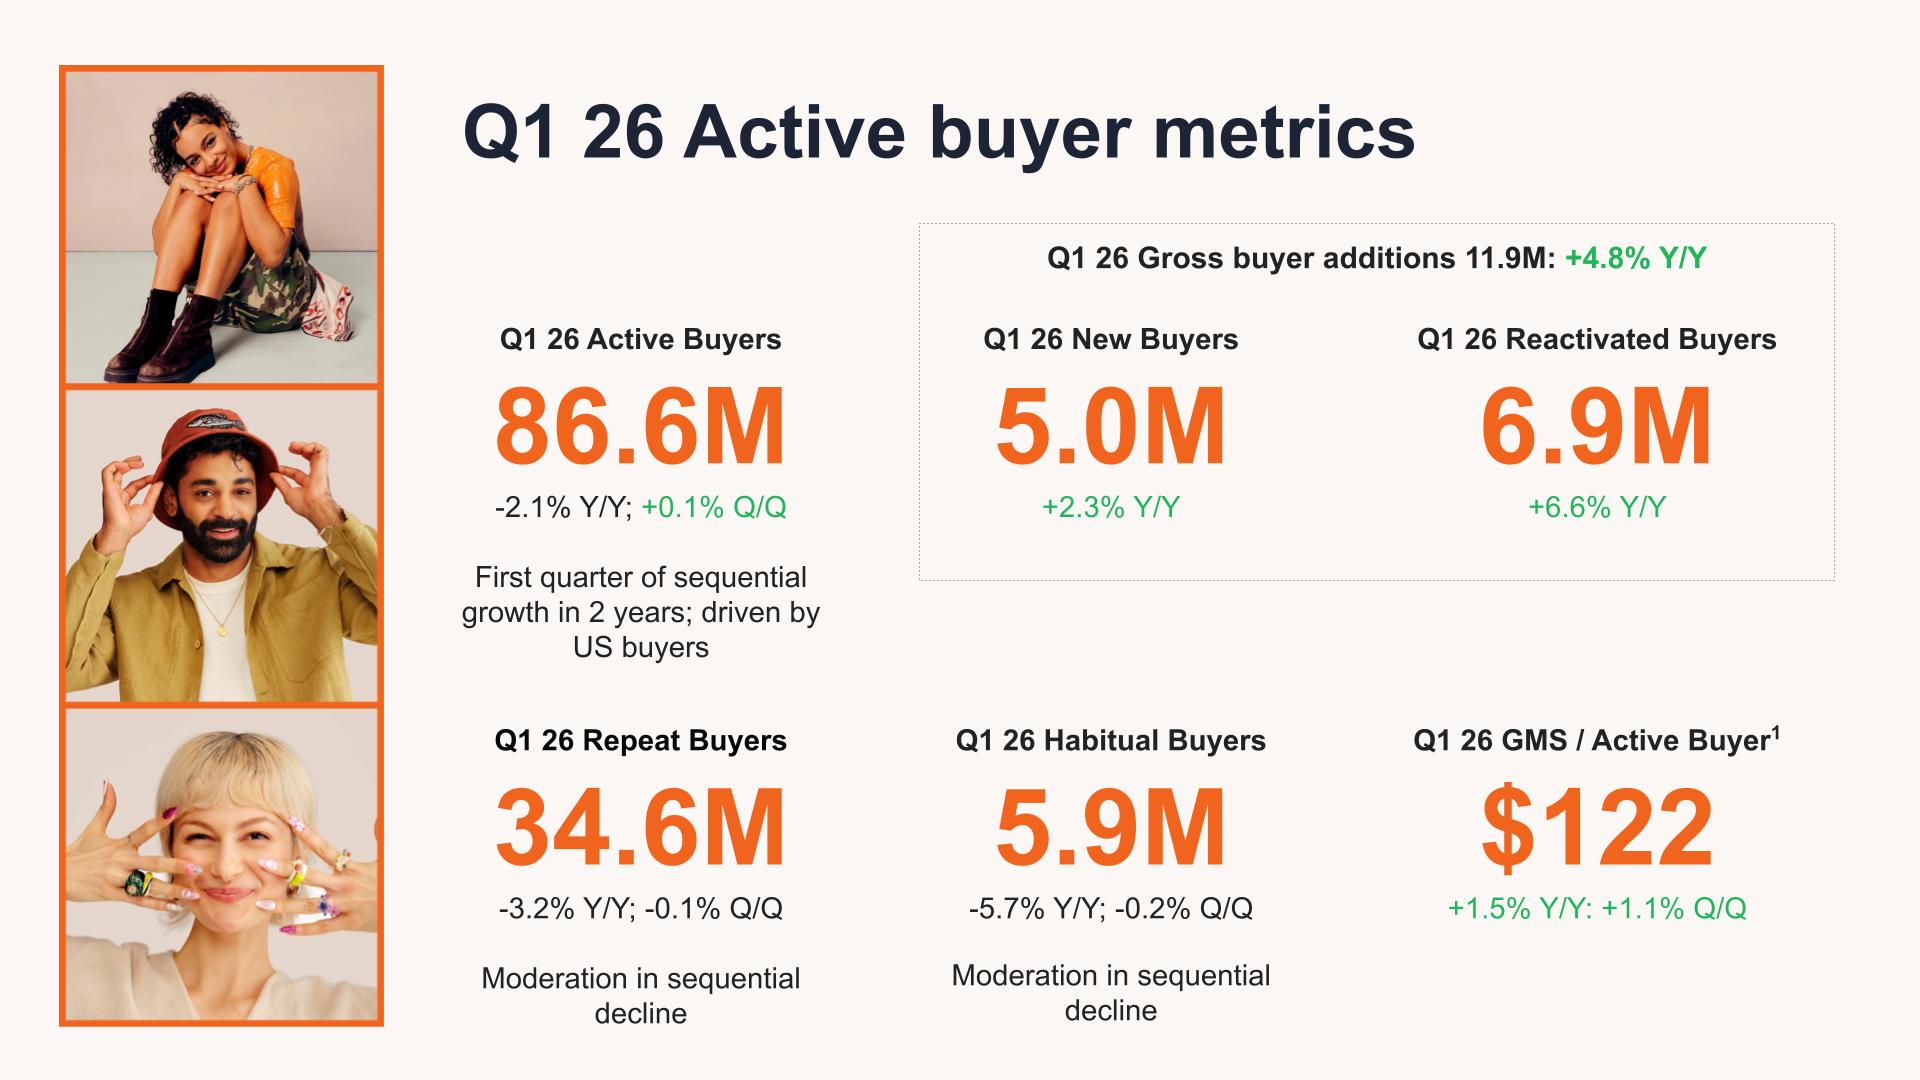
•GMS growth was driven by higher spend per buyer, with active buyers returning to modest sequential
growth, as detailed below, though still below prior-year levels.
•GMS per active buyer increased year-over-year for the first time since late-2022, reaching $122 on a
trailing twelve month basis and marking a fourth consecutive quarter of sequential improvement.
Purchase frequency remained modestly lower than prior-year levels, while average order value
increased year-over-year.
◦Several factors—some of which we expect to be temporary—contributed to higher AOV,
including foreign exchange tailwinds, the expiration of the de minimis tariff exemption, and
subsequent seller listing-price increases. We anticipate that these benefits, and the resulting
impact to AOV, will moderate as the year progresses.
◦Product improvements have also benefited AOV, including changes to our search and
discovery algorithms that better surface higher-quality, more differentiated inventory, as
described above.
•Both U.S. and non-U.S. buyer GMS grew year-over-year, with non-U.S. buyer GMS growth positive
on a constant currency basis for the first time since 2023.
While we are carefully watching global macroeconomic trends for any potential softening in consumer
discretionary spending, as of the publication of this letter, we have seen relatively stable trends. Further, our
first quarter 2026 GMS growth was broad-based across all income cohorts, with the strongest performance
continuing to come from the highest household income segment.
9
Key customer metrics are continuing to move in a healthier direction
Buyer and seller metrics presented below represent the Etsy marketplace only.
Y/Y reflects Q1 2026 vs. Q1 2025, Q/Q reflects Q1 2026 vs Q4 2025.
¹ TTM GMS per active buyer on the Etsy marketplace.
10
Merchandise Spotlight: During the first quarter, we continued to see Etsy win in shopping occasions where our sellers offer differentiated merchandise. Buyers appreciate shopping on our marketplace for meaningful purchases, celebrations, and special occasions. | |||
 |  |  |  |
Valentines Day performance accelerated with items centered on ‘love,’ ‘breakups’ and ‘galentines’ | Easter drove buyer demand for personalization across baskets, tags, and toys | Birthdays were the largest and fastest growing gift segment in the quarter | We had strong growth in weddings, with buyers customizing the big and little moments across their wedding journeys, and finding ‘quality for value’ heirlooms |
Our ML and AI curation efforts enable deeper personalization and fresher recommendations, which is an underpinning of success for these initiatives. | |||
Q1 2026 Revenue and Take Rate Performance
Of our total $631 million first quarter 2026 revenue, Marketplace revenue was $432.8 million, up 1.1% year-
over-year on a continuing operations basis and 6.3% for the Etsy marketplace, and Services revenue was
$198.5 million, up 7.9% year-over-year on a continuing operations basis and 10.5% for the Etsy marketplace.
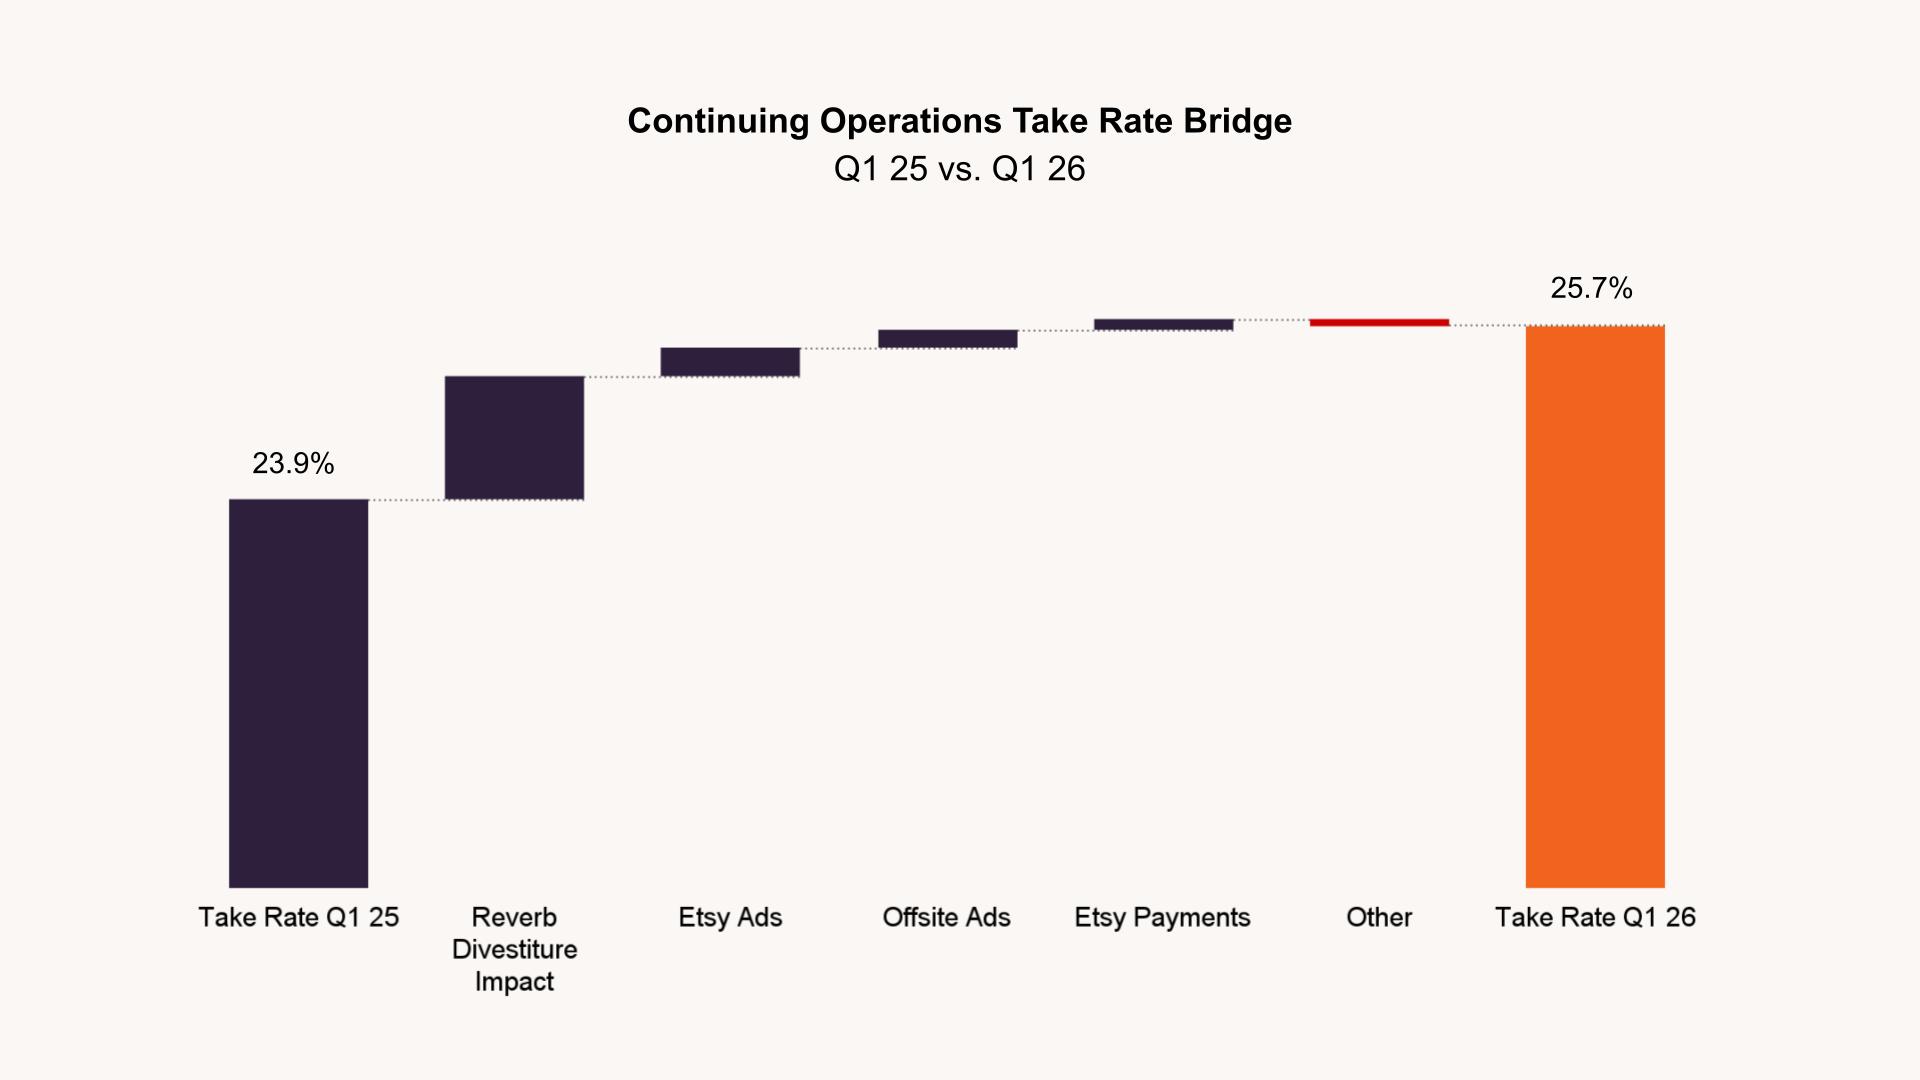
First quarter take rate was 25.7%, up 180 bps year-over-year, including an approximate +130 bps impact from
the Reverb divestiture. Etsy marketplace take rate expansion was led by Etsy Ads, where we continued to
benefit from machine learning-driven improvements to relevance and seller budget pacing. Offsite Ads and
Etsy Payments also contributed to take rate expansion, with Offsite Ads benefiting from a shift in paid
marketing activity toward higher-monetizing channels, and Etsy Payments continuing to see tailwinds from
expansion efforts implemented in 2025.
11
Q1 2026 Operating Expenses
We are presenting operating expenses for continuing operations, which exclude Depop in all periods
presented, and we are showing Reverb’s Q1 2025 contribution in the bar charts below. To help investors
understand the key drivers of performance, our discussion of year-over-year leverage (as a percentage of
revenue) in this section is for the Etsy marketplace only.
We are executing against our near-term priorities while improving the ways we work, continuously looking for
operational efficiencies, and keeping tight control on expenses.
We gained leverage in Etsy marketplace Product Development, as modestly higher employee costs were
offset by savings in other areas. We also gained leverage in Marketing, reflecting targeted shifts in portfolio
mix, and a continued focus on efficiency and meeting customers where they discover. We increased year-
over-year investment in paid search, where strong returns supported incremental spend, while reducing
lower-funnel paid social spend to prioritize incrementality and new and lapsed buyer acquisition. We
continued to shift spend away from linear TV toward more efficient digital channels, and reduced above-the-
line spend overall. Marketing efficiency was further supported by progress in owned channels, which continue
to scale. We’ve also fully in-sourced our paid social efforts, increasing control, improving efficiency, and
positioning this channel for accelerated growth. General and Administrative expenses also gained leverage on
a year-over-year basis as employee costs were stable on a larger revenue base, and we had a one-time
reversal of non-income tax expense.
Q1 26 Continuing Operations Operating Expenses
Product Development | Marketing | General & Administrative |
In the bar chart graphic above, Q1 2026 continuing operations results reflect the Etsy marketplace only, while Q1 2025 results include
both Etsy and Reverb.
Balance Sheet Update
As of March 31, 2026, Etsy held $1.6 billion in cash, cash equivalents and short- and long-term investments.
Net cash provided by operating activities of continuing operations for the three months ended March 31, 2026
was $102.5 million. We converted 50% of our Adjusted EBITDA to free cash flow during the quarter, more
than twice the rate of conversion realized in the year-ago quarter.
During the first quarter, Etsy repurchased an aggregate of approximately $145 million in stock, which reduced
the outstanding share count by approximately 2.7 million shares. As of March 31, 2026, we have $827.9
million remaining on our current Board-authorized share repurchase programs.
12
Reaffirming our Capital Allocation Strategy
With a singular focus on the $10+ billion GMS Etsy marketplace, we are reaffirming our approach to capital
structure and capital allocation, which is designed to support continued investment in our marketplace and
drive shareholder value. Our capital strategy is based on four enduring priorities:
Maintaining financial strength to fully support organic investment in the Etsy marketplace | Preserving strategic flexibility to selectively pursue opportunities to strengthen our business | Ensuring we effectively manage our financial commitments | Enhancing returns for our equity holders - as made possible by our strong free cash flow generation |
Consistent with these priorities, we plan to:
Continue to target gross debt levels in the range of 3x current Adjusted EBITDA. We are pleased with
the access we’ve had to the debt markets in the past, and maintaining debt levels in this range should
continue to benefit our credit profile, and provide ongoing flexibility at attractive borrowing costs.
Consistently retain cash on hand to cover the next 18-24 months of debt maturities. We believe this
conservative posture has and will continue to insulate against maturity pressures and allow us to be
opportunistic in accessing the market for refinancing.
Continue to use excess cash above and beyond these constraints to accelerate shareholder returns
through the repurchase of our shares. Over the past 24 months, share repurchases have enabled Etsy to
reduce shares outstanding by approximately 19%, net of new issuances. The pending sale of Depop will allow
us to further accelerate the direct return of capital to shareholders via repurchases.
13
Second Quarter 2026 and Updated Full-Year Outlook for
Continuing Operations
With the anticipated sale of Depop, which has been classified as discontinued operations beginning in the first
quarter of 2026, our outlook pertains to continuing operations only, or the Etsy marketplace.
We currently assume that overall macroeconomic factors remain relatively consistent, currency tailwinds
moderate, and prior-year comparisons become less favorable as we move through the year. For the full year,
we now anticipate that GMS growth will be in the low single-digit range, as our outlook for the Etsy
marketplace has improved relative to the full year commentary provided in mid-February. Our updated full
year view incorporates stronger-than-expected first quarter GMS as well as the progress we are making on
our growth priorities, and we continue to expect year-over-year growth in Etsy GMS in each quarter of 2026.
Q2 26 Outlook | FY 26 Outlook | |
GMS | $2.48B to $2.53B +3-5% Y/Y growth for the Etsy marketplace | We currently expect Etsy marketplace GMS will grow in the low-single-digit range for the full year. |
Take Rate | ~25.7% | Roughly equal to 1H 2026 |
Adjusted EBITDA Margin | 27-29% | 28-30%, unchanged from prior outlook |
Our outlook assumes currency exchange rates remain unchanged at current spot levels.
With respect to our outlook, a reconciliation of Adjusted EBITDA margin guidance to the closest
corresponding GAAP measure is not available without unreasonable efforts on a forward-looking basis due to
the high variability, complexity, and low visibility with respect to the charges excluded from Adjusted EBITDA;
in particular, stock-based compensation expense and related payroll taxes, foreign exchange (gain) loss,
interest and other non-operating income, net, provision for income taxes, acquisition, divestiture, and
corporate structure-related expenses, and other non-recurring expenses.
Webcast and Conference Call Information
Etsy will host a webcast conference call to discuss these results at 8:30 a.m. Eastern Time today, which will
be live-streamed via our Investor Relations website under the Events section.
A replay of the webcast will be available through the same link following the conference call starting at 12:00
p.m. Eastern Time today, for at least three months thereafter.
14
Cautionary Statement Regarding Forward-Looking
Statements
This shareholder letter contains or references forward-looking statements within the meaning of the federal
securities laws. Forward-looking statements include statements relating to our financial outlook for the second
quarter and full year of 2026, and the underlying assumptions; the expected timing of the closing of the Depop
transaction; the momentum of our customer-centric priorities; and the future impact of our strategic
investments. Forward-looking statements include all statements that are not historical facts. In some cases,
forward-looking statements can be identified by terms such as “aim,” “anticipate,” “believe,” “could,” “enable,”
“estimate,” “expect,” “goal,” “intend,” “may,” “optimistic,” “outlook,” “plan,” “potential,” “should,” “target,” “will,”
or similar expressions and derivative forms and/or the negatives of those words. Forward-looking statements
involve substantial risks and uncertainties that may cause actual results to differ materially from those that we
expect. These risks and uncertainties include but are not limited to: (1) macroeconomic, geopolitical, and
other events outside of our control; (2) the level of demand for our services or products sold in our
marketplaces; (3) the importance to our success of the trustworthiness and safety of our marketplaces and
our ability to attract and retain active and engaged communities of buyers and sellers; (4) any real or
perceived inaccuracies in our operational metrics; (5) if we or our third-party providers are unable to protect
against technology vulnerabilities, service interruptions, security breaches, or other cyber incidents; (6) our
dependence on continued and unimpeded access to third-party services, platforms, and infrastructure; (7)
operational and compliance risks related to our payments systems; (8) the global scope of our business; (9)
our ability to recruit and deploy that talent effectively; (10) our ability to compete effectively; (11) our ability to
enhance our current offerings and develop new offerings to respond to the changing needs of sellers and
buyers; (12) risks related to our environmental, social, and governance activities and disclosures; (13) barriers
to international trade and our efforts to grow our marketplace globally; (14) acquisitions, dispositions, or
strategic partnerships that may prove unsuccessful or divert management attention; (15) our ability to deal
effectively with fraud or other illegal activity increasingly amplified by advances in AI; and (16) litigation and
evolving global legal and regulatory requirements, including privacy and data protection laws, tax laws,
product liability laws, laws regulating speech and platform moderation, antitrust laws, and intellectual property
and counterfeiting regulations. These and other risks and uncertainties are more fully described in our filings
with the Securities and Exchange Commission, including in the section entitled “Risk Factors” in our Annual
Report on Form 10-K for the year ended December 31, 2025, and subsequent reports that we file with the
Securities and Exchange Commission. Moreover, we operate in a very competitive and rapidly changing
environment. New risks emerge from time to time. It is not possible for our management to predict all risks,
nor can we assess the impact of all factors on our business or the extent to which any factor, or combination
of factors, may cause actual results to differ materially from those contained in any forward-looking
statements we may make. In light of these risks, uncertainties, and assumptions, we cannot guarantee future
results, levels of activity, performance, achievements, or events and circumstances reflected in the forward-
looking statements will occur. Forward-looking statements represent our beliefs and assumptions only as of
the date of this shareholder letter. We disclaim any obligation to update forward-looking statements.
15
First Quarter 2026 Financial Summary
(in thousands, except percentages; unaudited)
Our key operating and financial metrics for continuing operations (which excludes Depop’s results, as Depop
is presented as discontinued operations) are presented in the table below for all periods presented.
Additionally, Reverb’s financial results until its sale on June 2, 2025 are included in continuing operations for
the three months ended March 31, 2025, but not for the three months ended March 31, 2026. To provide
investors with a meaningful basis for comparing our results year-over-year, we have presented Etsy
marketplace results for the three months ended March 31, 2025 below. Our calculation of trailing twelve
months free cash flow includes activity for combined continuing and discontinued operations. See “Non-GAAP
Financial Measures” for a reconciliation of our non-GAAP financial measures (Etsy marketplace financial
metrics, Adjusted EBITDA, Adjusted EBITDA margin, and free cash flow) to the most directly comparable
GAAP financial measures.
Our key operating and financial metrics are (in thousands, except percentages):
Three Months Ended March 31, | % (Decline) Growth Y/Y for Continuing Operations | % Growth (Decline) Y/Y for the Etsy Marketplace (Non-GAAP) (1) | |||
2026 | 2025 | ||||
Continuing Operations | Continuing Operations | Etsy Marketplace (Non-GAAP) | |||
GMS (2) | $2,460,195 | $2,559,821 | $2,331,462 | (3.9)% | 5.5% |
Revenue | $631,277 | $612,204 | $586,557 | 3.1% | 7.6% |
Revenue take rate (3) | 25.7% | 23.9% | 25.2% | 180 bps | 50 bps |
Marketplace revenue | $432,773 | $428,236 | $406,965 | 1.1% | 6.3% |
Services revenue | $198,504 | $183,968 | $179,592 | 7.9% | 10.5% |
Gross profit | $455,598 | $444,403 | $432,168 | 2.5% | 5.4% |
Operating expenses | $335,752 | $448,276 | $329,015 | (25.1)% | 2.0% |
Net income (loss) | $104,662 | $(35,087) | $71,491 | (398.3)% | 46.4% |
Net income (loss) margin | 16.6% | (5.7)% | 12.2% | 2,230 bps | 440 bps |
Adjusted EBITDA (Non-GAAP) | $184,711 | $173,521 | $170,649 | 6.4% | 8.2% |
Adjusted EBITDA margin (Non-GAAP) | 29.3% | 28.3% | 29.1% | 100 bps | 20 bps |
(1)% growth (decline) Y/Y for the Etsy marketplace is the change in continuing operations for the three months ended March 31, 2026,
which represents activity for the Etsy marketplace only, compared to the Etsy marketplace excluding Reverb for the three months
ended March 31, 2025, as Reverb was sold in the second quarter of 2025.
(2)Excluded from the table above is GMS for Depop, which was $348.9 million and $233.5 million for the three months ended March
31, 2026 and 2025, respectively.
(3)Revenue take rate is revenue divided by GMS.
As of March 31, | % Decline Y/Y | ||
2026 | 2025 | ||
Continuing and Discontinued Operations | Continuing and Discontinued Operations | ||
Net cash provided by operating activities - trailing twelve months | $724,973 | $732,619 | (1.0)% |
Free cash flow - trailing twelve months (Non-GAAP) | $671,155 | $684,924 | (2.0)% |
16
Etsy, Inc.
Condensed Consolidated Balance Sheets
(in thousands; unaudited)
As of March 31, 2026 | As of December 31, 2025 | |
Assets | ||
Current assets: | ||
Cash and cash equivalents | $1,214,374 | $1,355,428 |
Short-term investments | 211,391 | 224,088 |
Accounts receivable, net | 8,711 | 8,690 |
Prepaid and other current assets | 98,625 | 113,953 |
Funds receivable and seller accounts | 185,863 | 205,002 |
Current assets of discontinued operations | 393,845 | 53,822 |
Total current assets | 2,112,809 | 1,960,983 |
Restricted cash | 7,591 | 8,524 |
Property and equipment, net | 202,426 | 205,552 |
Goodwill | 37,600 | 38,067 |
Intangible assets, net | 13,168 | 14,511 |
Deferred tax assets | 114,612 | 119,051 |
Long-term investments | 150,591 | 134,376 |
Other assets | 42,256 | 38,964 |
Noncurrent assets of discontinued operations | — | 307,226 |
Total assets | $2,681,053 | $2,827,254 |
Liabilities and Stockholders' Deficit | ||
Current liabilities: | ||
Accounts payable | $15,444 | $27,732 |
Accrued expenses | 260,602 | 342,200 |
Short-term debt, net | 649,301 | 649,008 |
Funds payable and amounts due to sellers | 185,863 | 205,002 |
Deferred revenue | 30,347 | 27,049 |
Other current liabilities | 57,142 | 60,354 |
Current liabilities of discontinued operations | 51,854 | 52,274 |
Total current liabilities | 1,250,553 | 1,363,619 |
Finance lease obligations—net of current portion | 91,902 | 93,482 |
Deferred tax liabilities | 9,783 | 8,808 |
Long-term debt, net | 2,334,570 | 2,333,230 |
Other liabilities | 131,117 | 125,103 |
Noncurrent liabilities of discontinued operations | — | 1,107 |
Total liabilities | 3,817,925 | 3,925,349 |
Total stockholders’ deficit | (1,136,872) | (1,098,095) |
Total liabilities and stockholders’ deficit | $2,681,053 | $2,827,254 |
17
Etsy, Inc.
Condensed Consolidated Statements of Operations
(in thousands, except per share amounts; unaudited)
Three Months Ended March 31, | ||
2026 | 2025 | |
Revenue | $631,277 | $612,204 |
Cost of revenue | 175,679 | 167,801 |
Gross profit | 455,598 | 444,403 |
Operating expenses: | ||
Marketing | 174,239 | 171,857 |
Product development | 99,052 | 100,810 |
General and administrative | 62,461 | 73,906 |
Asset impairment charge | — | 101,703 |
Total operating expenses | 335,752 | 448,276 |
Income (loss) from operations | 119,846 | (3,873) |
Other income (expense), net | 9,414 | (10,714) |
Income (loss) from continuing operations before income taxes | 129,260 | (14,587) |
Provision for income taxes from continuing operations | (24,598) | (20,500) |
Net income (loss) from continuing operations | 104,662 | (35,087) |
Discontinued operations: | ||
Loss from discontinued operations before income taxes | (35,809) | (18,732) |
Benefit for income taxes from discontinued operations | 827 | 1,723 |
Net loss from discontinued operations | (34,982) | (17,009) |
Net income (loss) | $69,680 | $(52,096) |
Basic net income (loss) from continuing operations per share attributable to common stockholders | $1.09 | $(0.33) |
Total basic net income (loss) per share attributable to common stockholders | $0.72 | $(0.49) |
Diluted net income (loss) from continuing operations per share attributable to common stockholders | $0.89 | $(0.33) |
Total diluted net income (loss) per share attributable to common stockholders | $0.60 | $(0.49) |
Weighted-average common shares outstanding: | ||
Basic | 96,235 | 107,084 |
Diluted | 121,029 | 107,084 |
18
Condensed Consolidated Statements of Cash Flows
(in thousands; unaudited)
Three Months Ended March 31, | ||
2026 | 2025 | |
Cash flows from operating activities | ||
Net income (loss) | $69,680 | $(52,096) |
Net loss from discontinued operations | (34,982) | (17,009) |
Net income (loss) from continuing operations | 104,662 | (35,087) |
Adjustments to reconcile net income (loss) from continuing operations to net cash provided by operating activities: | ||
Stock-based compensation expense | 52,963 | 56,178 |
Depreciation and amortization expense | 15,315 | 17,189 |
Provision for expected credit losses | 1,136 | 2,385 |
Deferred provision (benefit) for income taxes | 6,705 | (2,542) |
Asset impairment charge | — | 101,703 |
Other non-cash (income) expense, net | (2,257) | 14,746 |
Changes in operating assets and liabilities | (75,988) | (104,756) |
Net cash provided by operating activities of continuing operations | 102,536 | 49,816 |
Net cash used in operating activities of discontinued operations | (21,794) | (633) |
Net cash provided by operating activities | 80,742 | 49,183 |
Cash flows from investing activities | ||
Purchases of property and equipment | (1,484) | (3,248) |
Website and app development | (8,378) | (8,950) |
Purchases of investments | (84,460) | (116,958) |
Sales and maturities of investments | 81,003 | 110,192 |
Net cash used in investing activities of continuing operations | (13,319) | (18,964) |
Net cash used in investing activities of discontinued operations | (3,202) | (1,712) |
Net cash used in investing activities | (16,521) | (20,676) |
Cash flows from financing activities | ||
Payment of tax obligations on vested equity awards | (13,974) | (8,169) |
Repurchase of stock | (145,223) | (189,177) |
Proceeds from exercise of stock options | 2,238 | 2,945 |
Payments on finance lease obligations | (1,587) | (1,514) |
Other financing, net | 100 | (8,867) |
Net cash used in financing activities | (158,446) | (204,782) |
Effect of exchange rate changes on cash | (6,626) | 14,288 |
Net decrease in cash and cash equivalents | (100,851) | (161,987) |
Cash, cash equivalents, and restricted cash at beginning of period | 1,404,360 | 811,178 |
Cash, cash equivalents, and restricted cash at end of period | $1,303,509 | $649,191 |
19
Currency-Neutral GMS
We calculate currency-neutral GMS by translating current period GMS for goods sold that were listed in non-
U.S. dollar currencies into U.S. dollars using prior year foreign currency exchange rates.
As reported and currency-neutral GMS (decline) growth for the periods presented below are as follows:
Three Months Ended March 31, | ||||||
2026 | 2025 | |||||
As Reported | Currency- Neutral | FX Impact | As Reported | Currency- Neutral | FX Impact | |
GMS - Continuing operations | (3.9)% | (5.7)% | 1.8% | (8.9)% | (8.2)% | (0.7)% |
GMS - Etsy marketplace | 5.5% | 3.6% | 1.9% | (8.9)% | (8.1)% | (0.8)% |
Non-GAAP Financial Measures
Other Key Financial Metrics
(in thousands, except percentages; unaudited)
Given the pending sale of Depop, Etsy results are presented on a continuing operations basis, while Depop
results are reported as discontinued operations across all periods presented. Due to the sale of Reverb on
June 2, 2025, continuing operations includes Reverb and Etsy marketplaces for the three months ended
March 31, 2025, but the three months ended March 31, 2026 reflects the Etsy marketplace only. This makes
year-over-year continuing operations results not directly comparable.
To provide investors with a meaningful basis for comparing our ongoing operating results year-over-year, we
have presented certain Etsy marketplace financial measures for the three months ended March 31, 2025 in
this Shareholder Letter. These measures include the following non-GAAP financial measures for the three
months ended March 31, 2025 where we exclude the impact of Reverb: (1) Revenue and Revenue take rate,
(2) Marketplace revenue, (3) Services revenue, (4) Gross profit, (5) Marketing expense, (6) Product
development expense, (7) General and administrative expense, (8) Operating expenses, (9) Net (loss)
income and Net (loss) income margin, and (10) Adjusted EBITDA and Adjusted EBITDA margin.
Management believes that presenting these Etsy marketplace non-GAAP financial measures is useful to
investors because they:
•provide a clearer, normalized baseline to evaluate the organic growth, financial performance, and
underlying trends of our remaining Etsy marketplace business;
•facilitate more direct year-over-year comparisons of our continuing operations by removing the impact
of the divested Reverb marketplace; and
•align with how management evaluates the performance of the business, allocates resources, and sets
internal operational targets moving forward.
20
A reconciliation of these non-GAAP measures to the most directly comparable GAAP measures is provided in
the following tables:
Three Months Ended March 31, 2025 | |||
Continuing Operations (As Reported) | Less: Reverb Marketplace | Etsy Marketplace (Non-GAAP) | |
Revenue | $612,204 | $25,647 | $586,557 |
Revenue take rate | 23.9% | 11.2% | 25.2% |
Marketplace revenue | $428,236 | $21,271 | $406,965 |
Services revenue | $183,968 | $4,376 | $179,592 |
Gross profit | $444,403 | $12,235 | $432,168 |
Marketing expense | $171,857 | $7,476 | $164,381 |
Product development expense | $100,810 | $5,166 | $95,644 |
General and administrative expense | $73,906 | $4,916 | $68,990 |
Operating expenses | $448,276 | $119,261 | $329,015 |
Net (loss) income | $(35,087) | $(106,578) | $71,491 |
Net (loss) income margin | (5.7)% | (415.6)% | 12.2% |
Reconciliation of Net Cash Provided by Operating Activities to Free Cash
Flow
(in thousands; unaudited)
Free cash flow represents our net cash provided by operating activities, reduced by purchases of property
and equipment and website and app development that are included in cash flows from investing activities.
The following table reflects the reconciliation of operating activities to free cash flow for combined continuing
and discontinued operations on a trailing twelve month basis (in thousands):
As of March 31, | ||
2026 | 2025 | |
Continuing and Discontinued Operations | Continuing and Discontinued Operations | |
Net cash provided by operating activities | $724,973 | $732,619 |
Purchases of property and equipment | (13,677) | (15,199) |
Website and app development | (40,141) | (32,496) |
Free cash flow | $671,155 | $684,924 |
Quarterly 2025 Continuing Operations Net Income (Loss) and Etsy
Marketplace Adjusted EBITDA
(in thousands, except percentages; unaudited)
Three Months Ended | ||||
December 31, 2025 | September 30, 2025 | June 30, 2025 | March 31, 2025 | |
Net income (loss) from continuing operations | $156,213 | $104,596 | $45,638 | $(35,087) |
Net income (loss) margin from continuing operations | 18.8% | 16.8% | 7.3% | (5.7)% |
Adjusted EBITDA - Etsy Marketplace (Non-GAAP) | $250,359 | $183,607 | $167,592 | $170,649 |
Adjusted EBITDA margin - Etsy Marketplace (Non-GAAP) | 30.1% | 29.4% | 27.4% | 29.1% |
21
Reconciliation of Net Income (Loss) to Adjusted EBITDA and the
Calculation of Adjusted EBITDA Margin
(in thousands, except percentages; unaudited)
Adjusted EBITDA represents our net income (loss) adjusted to exclude: stock-based compensation expense
and related payroll taxes; depreciation and amortization expense; provision (benefit) for income taxes; interest
and other non-operating (income) expense, net; foreign exchange (gain) loss; acquisition, divestiture, and
corporate structure-related expenses; asset impairment charge; restructuring and other exit costs (income);
retroactive non-income tax income; and loss on sale of business. The following tables reflect the reconciliation
of net income (loss) to Adjusted EBITDA as well as the calculation of Adjusted EBITDA margin for continuing
operations, the Etsy marketplace, and the Reverb marketplace:
Three Months Ended March 31, | ||||
2026 | 2025 | |||
Continuing Operations | Continuing Operations (As Reported) | Less: Reverb Marketplace | Etsy Marketplace (Non-GAAP) | |
Net income (loss) | $104,662 | $(35,087) | $(106,578) | $71,491 |
Excluding: | ||||
Stock-based compensation expense and related payroll taxes (1) | 55,537 | 57,639 | 4,083 | 53,556 |
Depreciation and amortization expense | 15,315 | 17,189 | 4,112 | 13,077 |
Provision (benefit) for income taxes | 24,598 | 20,500 | (443) | 20,943 |
Interest and other non-operating (income) expense, net | (6,956) | (4,902) | 220 | (5,122) |
Foreign exchange (gain) loss | (2,448) | 15,616 | (225) | 15,841 |
Acquisition, divestiture, and corporate structure-related expenses | 39 | 1,263 | — | 1,263 |
Asset impairment charge | — | 101,703 | 101,703 | — |
Restructuring and other exit income | — | (400) | — | (400) |
Retroactive non-income tax income | (6,036) | — | — | — |
Adjusted EBITDA | $184,711 | $173,521 | $2,872 | $170,649 |
Divided by: | ||||
Revenue | $631,277 | $612,204 | $25,647 | $586,557 |
Adjusted EBITDA margin | 29.3% | 28.3% | 11.2% | 29.1% |
(1)Stock-based compensation expense included in continuing operations in the Condensed Consolidated Statements of Operations for
the periods presented below is as follows:
Three Months Ended March 31, | ||
2026 | 2025 | |
Cost of revenue | $5,832 | $6,886 |
Marketing | 3,772 | 64 |
Product development | 27,538 | 31,986 |
General and administrative | 15,821 | 17,242 |
Stock-based compensation expense | $52,963 | $56,178 |
22
Three Months Ended | |||||
December 31, | September 30, | June 30, | |||
2025 | |||||
Continuing Operations (Etsy Marketplace) | Continuing Operations | Less: Reverb Marketplace | Etsy Marketplace (Non-GAAP) | ||
Net income (loss) | $156,213 | $104,596 | $45,638 | $(1,668) | $47,306 |
Excluding: | |||||
Stock-based compensation expense (income) and related payroll taxes | 60,502 | 56,521 | 55,382 | (1,048) | 56,430 |
Depreciation and amortization expense | 14,099 | 13,299 | 14,598 | 966 | 13,632 |
Provision for income taxes | 24,914 | 15,554 | 23,267 | 552 | 22,715 |
Interest and other non-operating (income) expense, net | (6,419) | (7,680) | (4,939) | 160 | (5,099) |
Foreign exchange (gain) loss | (49) | (548) | 25,356 | (348) | 25,704 |
Acquisition, divestiture, and corporate structure-related expenses (income) | 8 | (18) | 5,903 | 4,093 | 1,810 |
Restructuring and other exit costs (income) | 1,091 | 1,883 | (3) | — | (3) |
Loss on sale of business | — | — | 5,097 | — | 5,097 |
Adjusted EBITDA | $250,359 | $183,607 | $170,299 | $2,707 | $167,592 |
Divided by: | |||||
Revenue | $831,454 | $624,153 | $629,131 | $17,589 | $611,542 |
Adjusted EBITDA margin | 30.1% | 29.4% | 27.1% | 15.4% | 27.4% |