Pay vs Performance Disclosure - USD ($)
Dec. 31, 2025
Dec. 31, 2024
Dec. 31, 2023
Dec. 31, 2022
| Value of initial fixed $100 investment based on: | Company Selected Measure | |||||||||||||||||||||||||
| Fiscal Year | Summary Compensation Table Total for CEO (1)(2) | Compensation Actually Paid to CEO (3) | Average Summary Compensation Table Total for Non-PEO NEOs (1)(2) | Average Compensation Actually Paid to Non-PEO NEOs (3) | Total Shareholder Return (4) | Peer Group Total Shareholder Return (4) | Net Income (Loss) (In Thousands) (5) | Total Net Revenues (In Thousands) (6) | ||||||||||||||||||
| (a) | (b) | (c) | (d) | (e) | (f) | (g) | (h) | (i) | ||||||||||||||||||
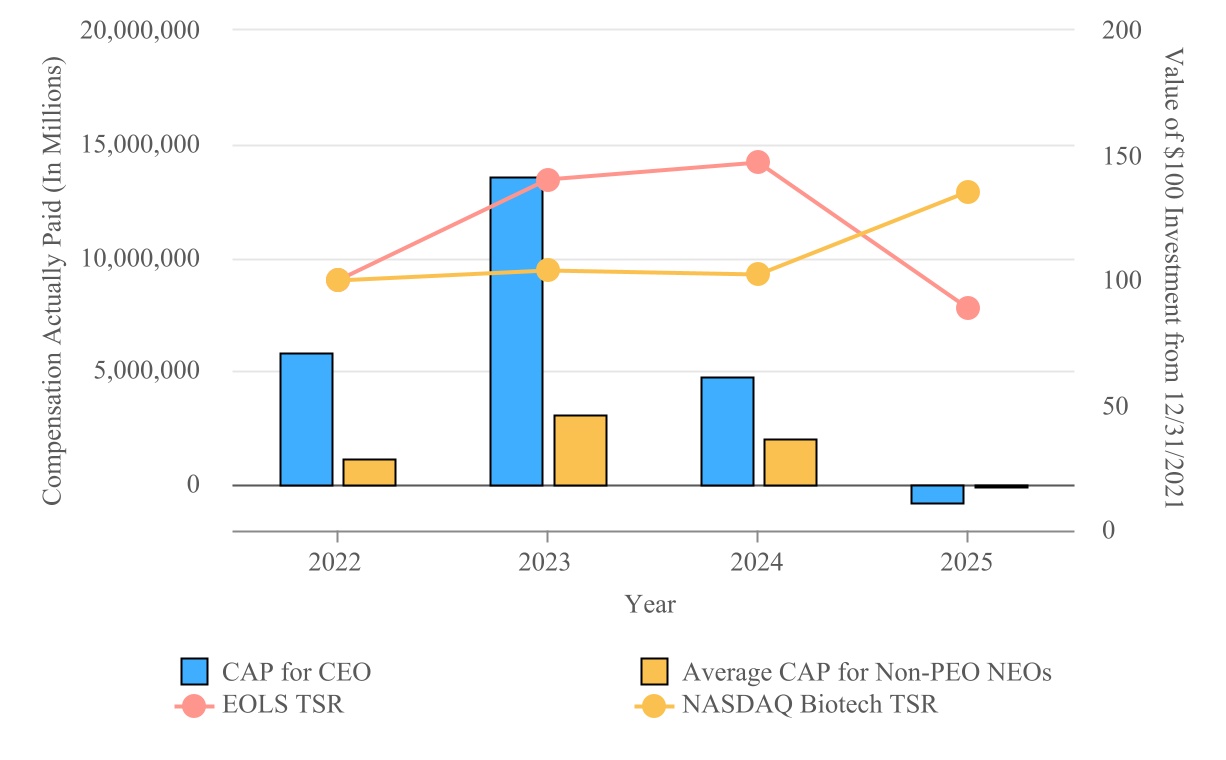
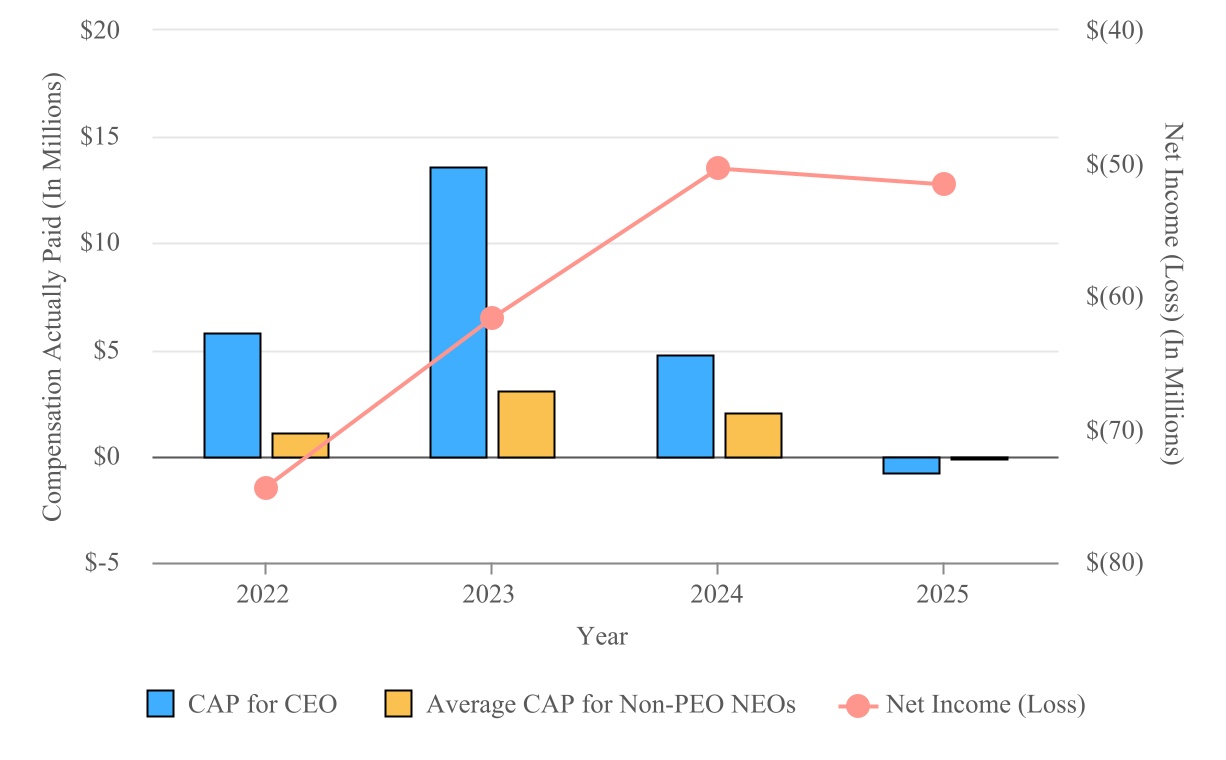
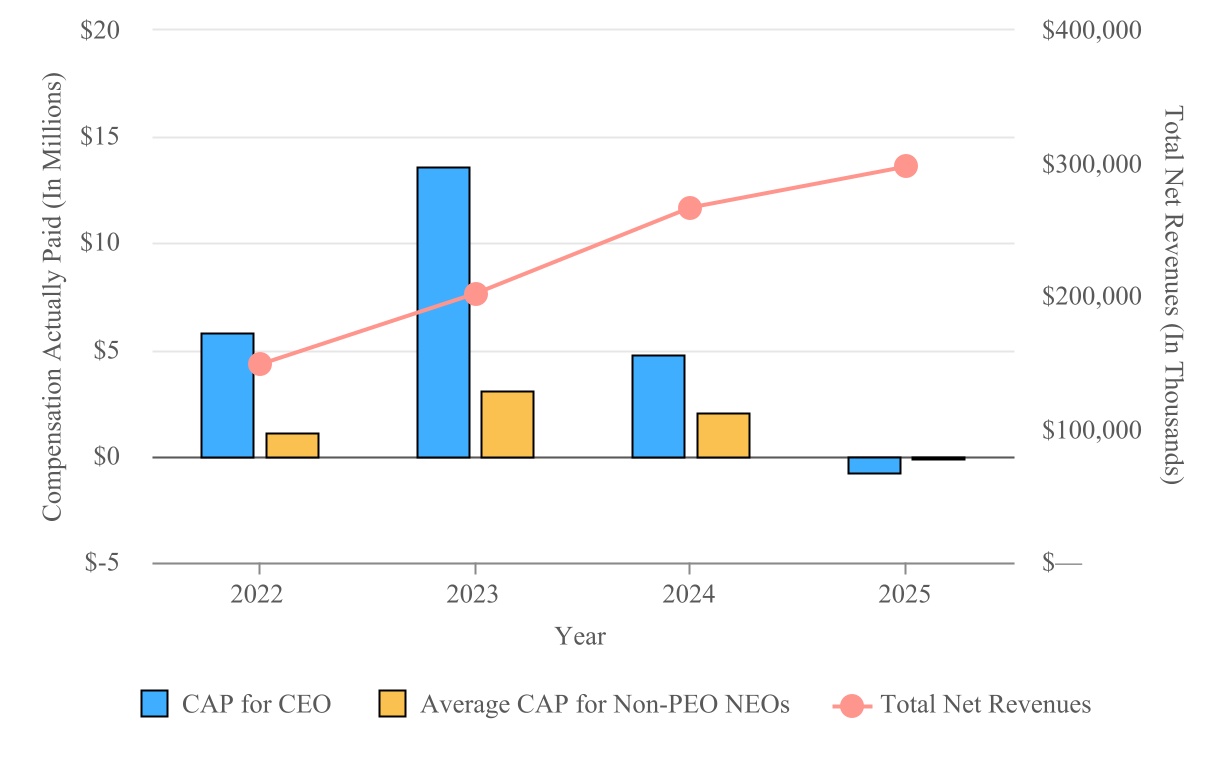
| 2025 | $ | 6,412,214 | $ | (746,485) | $ | 2,037,591 | $ | (97,489) | $ | 102.15 | $ | 119.52 | $ | (51,641) | $ | 297,176 | ||||||||||
| 2024 | $ | 6,998,877 | $ | 4,809,987 | $ | 2,094,664 | $ | 2,035,205 | $ | 169.59 | $ | 90.57 | $ | (50,420) | $ | 266,274 | ||||||||||
| 2023 | $ | 11,240,447 | $ | 13,563,751 | $ | 2,694,458 | $ | 3,122,361 | $ | 161.75 | $ | 91.84 | $ | (61,685) | $ | 202,085 | ||||||||||
| 2022 | $ | 3,599,590 | $ | 5,819,944 | $ | 1,508,272 | $ | 1,131,158 | $ | 115.36 | $ | 90.11 | $ | (74,412) | $ | 148,616 | ||||||||||
1.Less the amounts reported in the “Stock Awards” and “Option Awards” columns of the Summary Compensation Table for the applicable fiscal year,
2.Plus the fiscal year-end value of option and stock awards granted in the covered fiscal year which were outstanding and unvested at the end of the covered fiscal year,
3.Plus/(less) the change in value as of the end of the covered fiscal year as compared to the value at the end of the prior fiscal year for option and stock awards which were granted in prior fiscal years and were outstanding and unvested at the end of the covered fiscal year,
4.Plus the vesting date value of option and stock awards which were granted and vested during the same covered fiscal year,
5.Plus/(less) the change in value as of the vesting date as compared to the value at the end of the prior fiscal year for option and stock awards which were granted in prior fiscal years and vested in the covered fiscal year,
6.Less, as to any option and stock awards which were granted in prior fiscal years and were forfeited during the covered fiscal year, the value of such awards as of the end of the prior fiscal year.
In making each of these adjustments, the “value” of an option or stock award is the fair value of the award on the applicable date determined in accordance with FASB ASC Topic 718 using the valuation assumptions we then used to calculate the fair value of our equity awards. For more information on the valuation of our equity awards, please see the notes to our financial statements that appear in our Annual Report on Form 10-K each fiscal year and the footnotes to the Summary Compensation Table that appear in our annual Proxy Statement.
The table above reflects the CAP (determined as noted above) for our CEO and, for our Non-PEO NEOs, the average of the CAP determined for the Non-PEO NEOs for each of the fiscal years shown in the table.
The following table provides a reconciliation of the Summary Compensation Table Total to Compensation Actually Paid for our CEO.
| Reconciliation of Summary Compensation Table Total to Compensation Actually Paid for CEO | Fiscal Year 2025 ($) | Fiscal Year 2024 ($) | Fiscal Year 2023 ($) | Fiscal Year 2022 ($) | ||||||||||
| Total Compensation Reported in the Summary Compensation Table | $ | 6,412,214 | $ | 6,998,877 | $ | 11,240,447 | $ | 3,599,590 | ||||||
| (-) Grant Date Fair Value of Option and Stock Awards Granted in Fiscal Year | 5,183,266 | 5,326,920 | 9,493,277 | 2,331,524 | ||||||||||
| (+) Fair Value at Fiscal Year-End of Outstanding and Unvested Option and Stock Awards Granted in Fiscal Year | 2,334,045 | 4,229,361 | 9,116,924 | 3,352,269 | ||||||||||
| (+) Change in Fair Value of Outstanding and Unvested Option and Stock Awards Granted in Prior Fiscal Years | (5,197,680) | (1,604,462) | 1,595,693 | 340,037 | ||||||||||
| (+) Fair Value at Vesting of Option and Stock Awards Granted in Fiscal Year That Vested During Fiscal Year | — | — | 299,278 | — | ||||||||||
| (+) Change in Fair Value as of Vesting Date of Option and Stock Awards Granted in Prior Fiscal Years For Which Applicable Vesting Conditions Were Satisfied During Fiscal Year | 888,202 | 513,131 | 804,686 | 859,572 | ||||||||||
| Compensation Actually Paid | $ | (746,485) | $ | 4,809,987 | $ | 13,563,751 | $ | 5,819,944 | ||||||
The following table provides a reconciliation of the average of the Summary Compensation Table Total for the Non-PEO NEOs for a fiscal year to the average of the Compensation Actually Paid for the Non-PEO NEOs for that fiscal year.
| Reconciliation of Average Summary Compensation Table Total to Average Compensation Actually Paid for Non-PEO NEOs | Fiscal Year 2025 ($) | Fiscal Year 2024 ($) | Fiscal Year 2023 ($) | Fiscal Year 2022 ($) | ||||||||||
| Total Compensation Reported in the Summary Compensation Table | $ | 2,037,591 | $ | 2,094,664 | $ | 2,694,458 | $ | 1,508,272 | ||||||
| (-) Grant Date Fair Value of Option and Stock Awards Granted in Fiscal Year | 1,484,378 | 1,347,445 | 1,912,791 | 970,245 | ||||||||||
| (+) Fair Value at Fiscal Year-End of Outstanding and Unvested Option and Stock Awards Granted in Fiscal Year | 435,367 | 1,108,961 | 1,717,226 | 657,324 | ||||||||||
| (+) Change in Fair Value of Outstanding and Unvested Option and Stock Awards Granted in Prior Fiscal Years | (314,123) | 10,298 | 399,102 | 34,210 | ||||||||||
| (+) Fair Value at Vesting of Option and Stock Awards Granted in Fiscal Year That Vested During Fiscal Year | — | — | 64,127 | — | ||||||||||
| (+) Change in Fair Value as of Vesting Date of Option and Stock Awards Granted in Prior Fiscal Years For Which Applicable Vesting Conditions Were Satisfied During Fiscal Year | 70,985 | 168,727 | 160,239 | 25,995 | ||||||||||
| (-) Fair Value at Prior Fiscal Year-End of Options and Stock Awards Forfeited During Fiscal Year | 842,930 | — | — | 124,398 | ||||||||||
| Compensation Actually Paid | $ | (97,489) | $ | 2,035,205 | $ | 3,122,361 | $ | 1,131,158 | ||||||
As described in greater detail in “Executive Compensation—Compensation Discussion and Analysis,” the Company’s executive compensation program reflects a variable pay-for-performance philosophy. The metrics that the Company uses for both our long-term and short-term incentive awards are selected based on an objective of incentivizing our NEOs to increase the value of our enterprise for our stockholders. The most important financial performance measures used by the Company to link executive compensation actually paid to the Company’s NEOs, for the most recently completed fiscal year, to the Company’s performance are as follows:
•Net revenues
•Non-GAAP operating expenses
•Non-GAAP income (loss) from operations
Non-GAAP operating expenses and non-GAAP income (loss) from operations are non-GAAP financial measures. Please refer to the detailed definitions of these key financial measures, and the reconciliations of these measures to the most directly comparable financial measures calculated and presented in accordance with GAAP, in our press release filed as Exhibit 99.1 to the Form 8-K filed with the Securities and Exchange Commission on March 3, 2026.