Pay vs Performance Disclosure - USD ($)
|
12 Months Ended |
Dec. 31, 2025 |
Dec. 31, 2024 |
| Pay vs Performance Disclosure |
|
|
| Pay vs Performance Disclosure, Table |
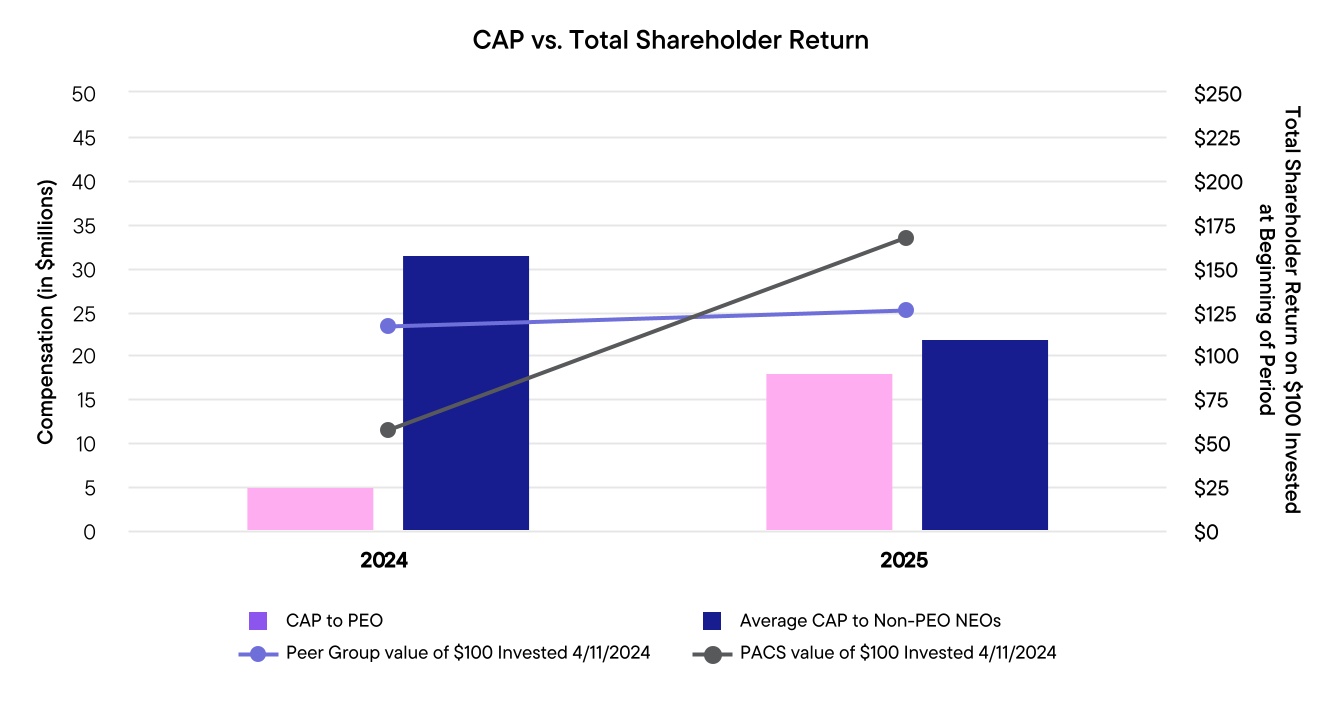
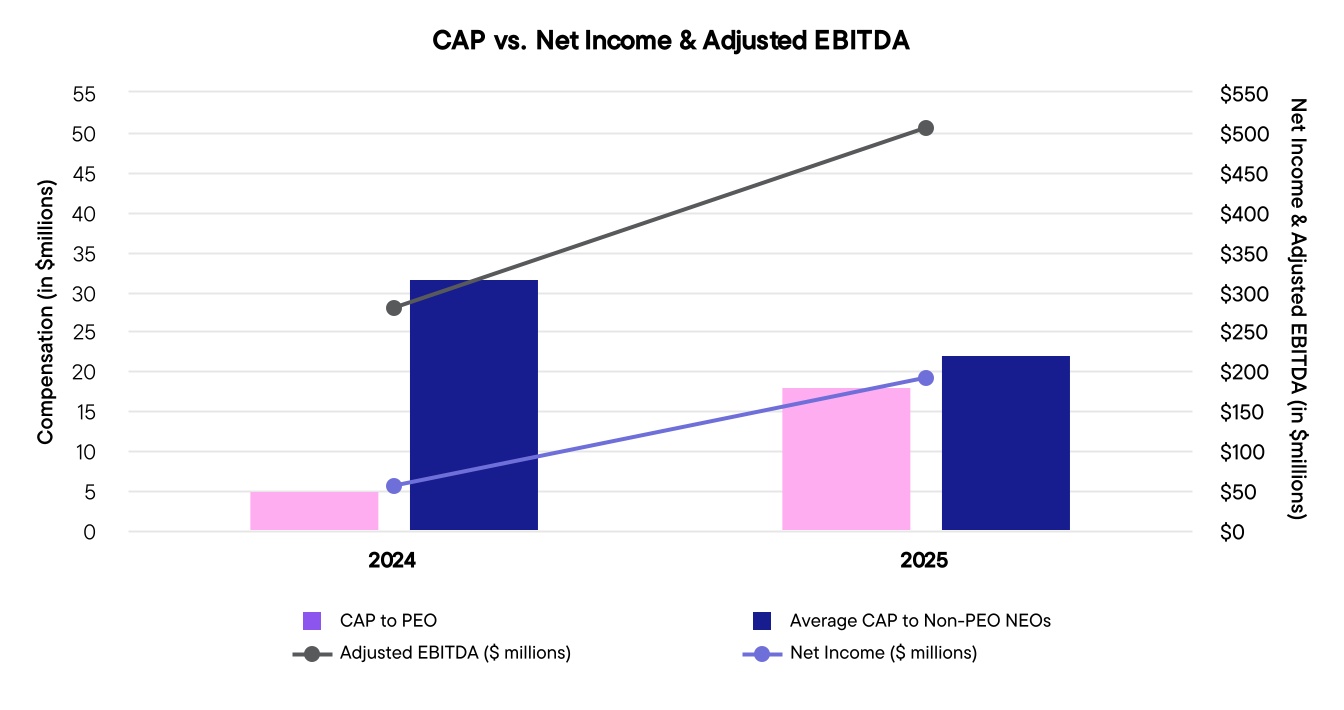
| | | | | | | | | | | | | | | | | | | | | | | | | | | | | | | | | | | | | | | | | | | | | | | | | | VALUE OF INITIAL FIXED $100 INVESTMENT ON 4/11/2024 AS OF YEAR-END IN: | | | | | | | | | | | | | | | | | | | | | | | | | | | YEAR | SUMMARY COMPENSATION TABLE TOTAL FOR PEO ($)(1) | COMPENSATION ACTUALLY PAID TO PEO ($)(1)(2) | AVERAGE SUMMARY COMPENSATION TABLE TOTAL FOR NON-PEO NEOS ($)(1) | AVERAGE COMPENSATION ACTUALLY PAID TO NON-PEO NEOS ($)(1)(2) | TOTAL SHAREHOLDER RETURN ($)(3) | PEER GROUP TOTAL SHAREHOLDER RETURN ($)(3) | NET INCOME ($ IN MILLIONS)(4) | ADJUSTED EBITDA ($ IN MILLIONS)(5) | | | | | | | | | | | | | | 2025 | 17,071,124 | 17,965,301 | 10,440,812 | 21,983,762 | 167 | 125.49 | 191.5 | 505.0 | | | 2024 | 5,039,085 | 5,039,085 | 40,959,587 | 31,554,093 | 57 | 116.06 | 55.3 | 279.5 | |
|
|
| Company Selected Measure Name |
Adjusted EBITDA
|
|
| Named Executive Officers, Footnote |
For 2024 and 2025, the PEO was Jason Murray. For 2025, the Non-PEO NEOs were Mark Hancock, Derick Apt, Josh Jergensen, John Mitchell and Michelle Lewis. For 2024, the Non-PEO NEOs were Derick Apt, Josh Jergensen, John Mitchell and PJ Sanford. Although we voluntarily included Mark Hancock as an NEO for the fiscal year ended December 31, 2024, we have excluded him from the calculations applicable to our Non-PEO NEOs in the above table for the fiscal year ended December 31, 2024 because he was not a “named executive officer” under SEC regulations for 2024.
|
|
| Peer Group Issuers, Footnote |
Represents the cumulative TSR of our common stock and the cumulative TSR of our peer group (the “Peer Group TSR”), as reflected in our stock performance graph as disclosed in our 2025 Annual Report. In accordance with SEC rules, the table assumes $100 was invested at the market close on April 11, 2024, the date our common stock commenced regular-way trading on the New York Stock Exchange, through the end of each fiscal year shown. The companies included in our peer group (“Peer Group”) are as follows: The Ensign Group, Inc. (“ENSG”), Encompass Health Corporation (“EHC”), and Selected Medical Holdings Corporation (“SEM”). For the Peer Group, the Peer Group TSR includes the re-investment of dividends.
|
|
| PEO Total Compensation Amount |
$ 17,071,124
|
$ 5,039,085
|
| PEO Actually Paid Compensation Amount |
$ 17,965,301
|
5,039,085
|
| Adjustment To PEO Compensation, Footnote |
For 2025, compensation actually paid (“CAP”) was determined by making the following adjustments to Summary Compensation Totals for equity awards: | | | | | | | | | | | | | | | | | | | | | | PEO
($) | AVERAGE OF NON-PEO NEOS
($) | | | | | | | | Reported Summary Compensation Table (“SCT”) Total | 17,071,124 | 10,440,812 | | | Adjustments: | | | | | Deduction of Amounts Reported in “Stock Awards” Column of the SCT(i) | (8,358,504) | (4,026,473) | | | Year End Fair Value of Equity Awards Granted in the Reported Year that remain Unvested at Year End(ii) | 9,252,681 | 4,457,217 | | | Fair Value at Vesting of Equity Awards Granted and Vested in the Reported Year(v) | — | — | | | Year over Year Change in Fair Value of Equity Awards Granted in Prior Years that Remain Unvested at Year End(iii) | — | 13,665,033 | | | Change in Fair Value Between Prior Year End and Vesting Date for Awards Granted in Prior that Vested in the Reported Year(iv) | — | (701,218) | | | Deduction of Fair Value at the End of the Prior Year of Equity Awards Granted in Prior Years that were Forfeited in the Reported Year(vi) | — | (1,851,609) | | | Value of Dividends or Other Earnings Paid on Option and Stock Awards Not Otherwise Reflected in Total Compensation(vii) | — | — | | | Compensation Actually Paid | 17,965,301 | 21,983,762 | |
|
|
| Non-PEO NEO Average Total Compensation Amount |
$ 10,440,812
|
40,959,587
|
| Non-PEO NEO Average Compensation Actually Paid Amount |
$ 21,983,762
|
31,554,093
|
| Adjustment to Non-PEO NEO Compensation Footnote |
For 2025, compensation actually paid (“CAP”) was determined by making the following adjustments to Summary Compensation Totals for equity awards: | | | | | | | | | | | | | | | | | | | | | | PEO
($) | AVERAGE OF NON-PEO NEOS
($) | | | | | | | | Reported Summary Compensation Table (“SCT”) Total | 17,071,124 | 10,440,812 | | | Adjustments: | | | | | Deduction of Amounts Reported in “Stock Awards” Column of the SCT(i) | (8,358,504) | (4,026,473) | | | Year End Fair Value of Equity Awards Granted in the Reported Year that remain Unvested at Year End(ii) | 9,252,681 | 4,457,217 | | | Fair Value at Vesting of Equity Awards Granted and Vested in the Reported Year(v) | — | — | | | Year over Year Change in Fair Value of Equity Awards Granted in Prior Years that Remain Unvested at Year End(iii) | — | 13,665,033 | | | Change in Fair Value Between Prior Year End and Vesting Date for Awards Granted in Prior that Vested in the Reported Year(iv) | — | (701,218) | | | Deduction of Fair Value at the End of the Prior Year of Equity Awards Granted in Prior Years that were Forfeited in the Reported Year(vi) | — | (1,851,609) | | | Value of Dividends or Other Earnings Paid on Option and Stock Awards Not Otherwise Reflected in Total Compensation(vii) | — | — | | | Compensation Actually Paid | 17,965,301 | 21,983,762 | |
|
|
| Compensation Actually Paid vs. Total Shareholder Return |
|
|
| Compensation Actually Paid vs. Net Income |
|
|
| Compensation Actually Paid vs. Company Selected Measure |
|
|
| Tabular List, Table |
We believe the following performance measures represent the most important financial performance measures used by us to link compensation actually paid to our NEOs for 2025. . | | | | Adjusted EBITDA | | Net Operating Income | | Financial Guidance Metrics (Annual Revenue and Adjusted EBITDA) | | CMS Quality Measures Star rating |
|
|
| Total Shareholder Return Amount |
$ 167
|
57
|
| Peer Group Total Shareholder Return Amount |
125.49
|
116.06
|
| Net Income (Loss), Including Portion Attributable to Noncontrolling Interest |
$ 191,500,000
|
$ 55,300,000
|
| Company Selected Measure Amount |
505,000,000.0
|
279,500,000
|
| PEO Name |
Jason Murray
|
Jason Murray
|
| Additional 402(v) Disclosure |
The dollar amounts reported represent the amount of net income reflected in our audited financial statements for the applicable year.
|
|
| Measure:: 1 |
|
|
| Pay vs Performance Disclosure |
|
|
| Non-GAAP Measure Description |
See the section titled “Non-GAAP Financial Measures” in the Appendix for a definition of Adjusted EBITDA, a non-GAAP financial measure used for the purpose of the Management Bonus Program in effect for 2025, which is our Company-Selected Measure.
|
|
| PEO | Aggregate Change in Present Value of Accumulated Benefit for All Pension Plans Reported in Summary Compensation Table |
|
|
| Pay vs Performance Disclosure |
|
|
| Adjustment to Compensation, Amount |
$ (8,358,504)
|
|
| PEO | Year-end Fair Value of Equity Awards Granted in Covered Year that are Outstanding and Unvested |
|
|
| Pay vs Performance Disclosure |
|
|
| Adjustment to Compensation, Amount |
9,252,681
|
|
| PEO | Year-over-Year Change in Fair Value of Equity Awards Granted in Prior Years That are Outstanding and Unvested |
|
|
| Pay vs Performance Disclosure |
|
|
| Adjustment to Compensation, Amount |
0
|
|
| PEO | Vesting Date Fair Value of Equity Awards Granted and Vested in Covered Year |
|
|
| Pay vs Performance Disclosure |
|
|
| Adjustment to Compensation, Amount |
0
|
|
| PEO | Change in Fair Value as of Vesting Date of Prior Year Equity Awards Vested in Covered Year |
|
|
| Pay vs Performance Disclosure |
|
|
| Adjustment to Compensation, Amount |
0
|
|
| PEO | Prior Year End Fair Value of Equity Awards Granted in Any Prior Year that Fail to Meet Applicable Vesting Conditions During Covered Year |
|
|
| Pay vs Performance Disclosure |
|
|
| Adjustment to Compensation, Amount |
0
|
|
| PEO | Dividends or Other Earnings Paid on Equity Awards not Otherwise Reflected in Total Compensation for Covered Year |
|
|
| Pay vs Performance Disclosure |
|
|
| Adjustment to Compensation, Amount |
$ 0
|
|
| Non-PEO NEO | Measure:: 1 |
|
|
| Pay vs Performance Disclosure |
|
|
| Name |
Adjusted EBITDA
|
|
| Non-PEO NEO | Measure:: 2 |
|
|
| Pay vs Performance Disclosure |
|
|
| Name |
Net Operating Income
|
|
| Non-PEO NEO | Measure:: 3 |
|
|
| Pay vs Performance Disclosure |
|
|
| Name |
Financial Guidance Metrics (Annual Revenue and Adjusted EBITDA)
|
|
| Non-PEO NEO | Measure:: 4 |
|
|
| Pay vs Performance Disclosure |
|
|
| Name |
CMS Quality Measures Star rating
|
|
| Non-PEO NEO | Aggregate Change in Present Value of Accumulated Benefit for All Pension Plans Reported in Summary Compensation Table |
|
|
| Pay vs Performance Disclosure |
|
|
| Adjustment to Compensation, Amount |
$ (4,026,473)
|
|
| Non-PEO NEO | Year-end Fair Value of Equity Awards Granted in Covered Year that are Outstanding and Unvested |
|
|
| Pay vs Performance Disclosure |
|
|
| Adjustment to Compensation, Amount |
4,457,217
|
|
| Non-PEO NEO | Year-over-Year Change in Fair Value of Equity Awards Granted in Prior Years That are Outstanding and Unvested |
|
|
| Pay vs Performance Disclosure |
|
|
| Adjustment to Compensation, Amount |
13,665,033
|
|
| Non-PEO NEO | Vesting Date Fair Value of Equity Awards Granted and Vested in Covered Year |
|
|
| Pay vs Performance Disclosure |
|
|
| Adjustment to Compensation, Amount |
0
|
|
| Non-PEO NEO | Change in Fair Value as of Vesting Date of Prior Year Equity Awards Vested in Covered Year |
|
|
| Pay vs Performance Disclosure |
|
|
| Adjustment to Compensation, Amount |
(701,218)
|
|
| Non-PEO NEO | Prior Year End Fair Value of Equity Awards Granted in Any Prior Year that Fail to Meet Applicable Vesting Conditions During Covered Year |
|
|
| Pay vs Performance Disclosure |
|
|
| Adjustment to Compensation, Amount |
(1,851,609)
|
|
| Non-PEO NEO | Dividends or Other Earnings Paid on Equity Awards not Otherwise Reflected in Total Compensation for Covered Year |
|
|
| Pay vs Performance Disclosure |
|
|
| Adjustment to Compensation, Amount |
$ 0
|
|