Pay versus Performance Table
As a Small Reporting Company (SRC), the following table shows the past two fiscal years’ total compensation for our Named Executive Officers (NEOs) as set forth in the Summary Compensation Table (“SCT”), the CAP paid to our NEOs, the Company’s total stockholder return (TSR), and our net income.
2025 Pay vs. Performance Table
| Year | Summary Compensation Table Total for CEO | Compensation Actually Paid to CEO | Average Summary Compensation Table Total for Non-CEO NEOs | Average Compensation Actually Paid to Non-CEO NEOs | Value of Initial Fixed $100 Investment Based On: TSR | Net Loss | ||||||||||||||||||||
| 2025 | $ | 1,449,855 | $ | (2,198,450 | ) | $ | 1,190,524 | $ | 1,882,920 | $ | 185 | $ | (32,273,128 | ) | ||||||||||||
| 2024 | $ | 1,036,428 | $ | 4,425,677 | $ | 713,126 | $ | 2,182,513 | $ | 108 | $ | (73,538,157 | ) | |||||||||||||
(1) In the table above, our CEO is Paul Travers
(2) The non-CEO NEOs for each applicable year are as follows:
| – | 2025: Grant Russell, Peter Jameson, and Chris Parkinson |
| – | 2024: Grant Russell and Peter Jameson |
(3) The SEC rules require that certain adjustments be made to the Summary Compensation Table totals to determine CAP, as reported in the Pay versus Performance table above. The following table details the applicable adjustments that were made to determine CAP:
Relationship Between Compensation Actually Paid (CAP) and Performance Measures
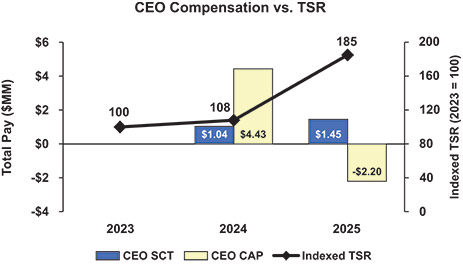
The Pay versus Performance table above and the charts below illustrate the following:
| Equity | ||||||||||||||||||||||||
| Year | Executives | SCT Total | Deduct SCT Stock Awards & Option Awards | Add Year- End Fair Value of Unvested Equity Granted in the Year | Add Year-over- Year Change in Fair Value of Outstanding and Unvested Equity Granted in Prior Years | Add Fair Value as of Vesting Date of Equity Awards Granted and Vested in the Year | Add Year-over- Year Change in Fair Value of Equity Awards Granted in Prior Years that Vested in the Year | Compensation Actually Paid | ||||||||||||||||
| 2025 | CEO | $ | 1,449,855 | $ | (919,416 | ) | $ | 1,103,299 | $ | (3,903,541 | ) | $ | $ | 71,353 | $ | (2,198,450 | ) | |||||||
| Non-CEO NEOs (average) | $ | 1,190,524 | $ | (474,144 | ) | $ | 2,326,042 | $ | (1,216,876 | ) | $ | 47,250 | $ | 10,124 | $ | 1,882,920 | ||||||||
| 2024 | CEO | $ | 1,036,428 | $ | (618,125 | ) | $ | 1,956,797 | $ | 2,041,102 | $ | $ | 9,474 | $ | 4,425,677 | |||||||||
| Non-CEO NEOs (average) | $ | 713,126 | $ | (332,431 | ) | $ | 1,052,373 | $ | 640,682 | $ | $ | 108,764 | $ | 2,182,513 | ||||||||||
CAP to our CEO and other NEOs has moved in line with our TSR – i.e., increases in our TSR over 2024 and 2025 were paired with increasing compensation outcomes during those years. The CAP definition of pay reflects changes in the value of unvested and vested equity, so increases in the value of our stock price were similarly reflected in the value of equity (both unvested and vested) as compared to grant-date Summary Compensation Table values of pay. In 2025 and 2024, the value of outstanding equity held by our NEOs was mixed and resulted in negative CAP for our CEO and positive CAP for our average other NEOs. The negative CAP for our CEO was primarily driven by the cancellation of our former LTIP in June 2025. The positive CAP for our other NEOs was primarily driven by new equity awards granted in 2025 that remain unvested as of December 31, 2025. We would expect that as the market value of Vuzix stock increases, CAP values will also increase given both the equity tie to stock price and the potential impact of positive financial results on incentive payouts.
CAP does not move in line with our net loss or income, as the measure can be volatile year-over-year due to accounting requirements, such as the inclusion of changes in the value of inventories, acquisitions, and related metrics. As such, we use other key measures of financial performance for a growing company, such as revenue, gross margin, and EBITDA margin, in our incentive programs.
(2) The non-CEO NEOs for each applicable year are as follows:
| – | 2025: Grant Russell, Peter Jameson, and Chris Parkinson |
| – | 2024: Grant Russell and Peter Jameson |
The Pay versus Performance table above and the charts below illustrate the following:
| Equity | ||||||||||||||||||||||||
| Year | Executives | SCT Total | Deduct SCT Stock Awards & Option Awards | Add Year- End Fair Value of Unvested Equity Granted in the Year | Add Year-over- Year Change in Fair Value of Outstanding and Unvested Equity Granted in Prior Years | Add Fair Value as of Vesting Date of Equity Awards Granted and Vested in the Year | Add Year-over- Year Change in Fair Value of Equity Awards Granted in Prior Years that Vested in the Year | Compensation Actually Paid | ||||||||||||||||
| 2025 | CEO | $ | 1,449,855 | $ | (919,416 | ) | $ | 1,103,299 | $ | (3,903,541 | ) | $ | $ | 71,353 | $ | (2,198,450 | ) | |||||||
| Non-CEO NEOs (average) | $ | 1,190,524 | $ | (474,144 | ) | $ | 2,326,042 | $ | (1,216,876 | ) | $ | 47,250 | $ | 10,124 | $ | 1,882,920 | ||||||||
| 2024 | CEO | $ | 1,036,428 | $ | (618,125 | ) | $ | 1,956,797 | $ | 2,041,102 | $ | $ | 9,474 | $ | 4,425,677 | |||||||||
| Non-CEO NEOs (average) | $ | 713,126 | $ | (332,431 | ) | $ | 1,052,373 | $ | 640,682 | $ | $ | 108,764 | $ | 2,182,513 | ||||||||||
CAP to our CEO and other NEOs has moved in line with our TSR – i.e., increases in our TSR over 2024 and 2025 were paired with increasing compensation outcomes during those years. The CAP definition of pay reflects changes in the value of unvested and vested equity, so increases in the value of our stock price were similarly reflected in the value of equity (both unvested and vested) as compared to grant-date Summary Compensation Table values of pay. In 2025 and 2024, the value of outstanding equity held by our NEOs was mixed and resulted in negative CAP for our CEO and positive CAP for our average other NEOs. The negative CAP for our CEO was primarily driven by the cancellation of our former LTIP in June 2025. The positive CAP for our other NEOs was primarily driven by new equity awards granted in 2025 that remain unvested as of December 31, 2025. We would expect that as the market value of Vuzix stock increases, CAP values will also increase given both the equity tie to stock price and the potential impact of positive financial results on incentive payouts.