Pay vs Performance Disclosure - USD ($)
Jan. 28, 2023
May 16, 2025
May 12, 2022
Dec. 01, 2022
Jan. 31, 2026
Jan. 31, 2026
Feb. 01, 2025
Feb. 03, 2024
Jan. 28, 2023
Jan. 29, 2022
2025 Pay Versus Performance Disclosure
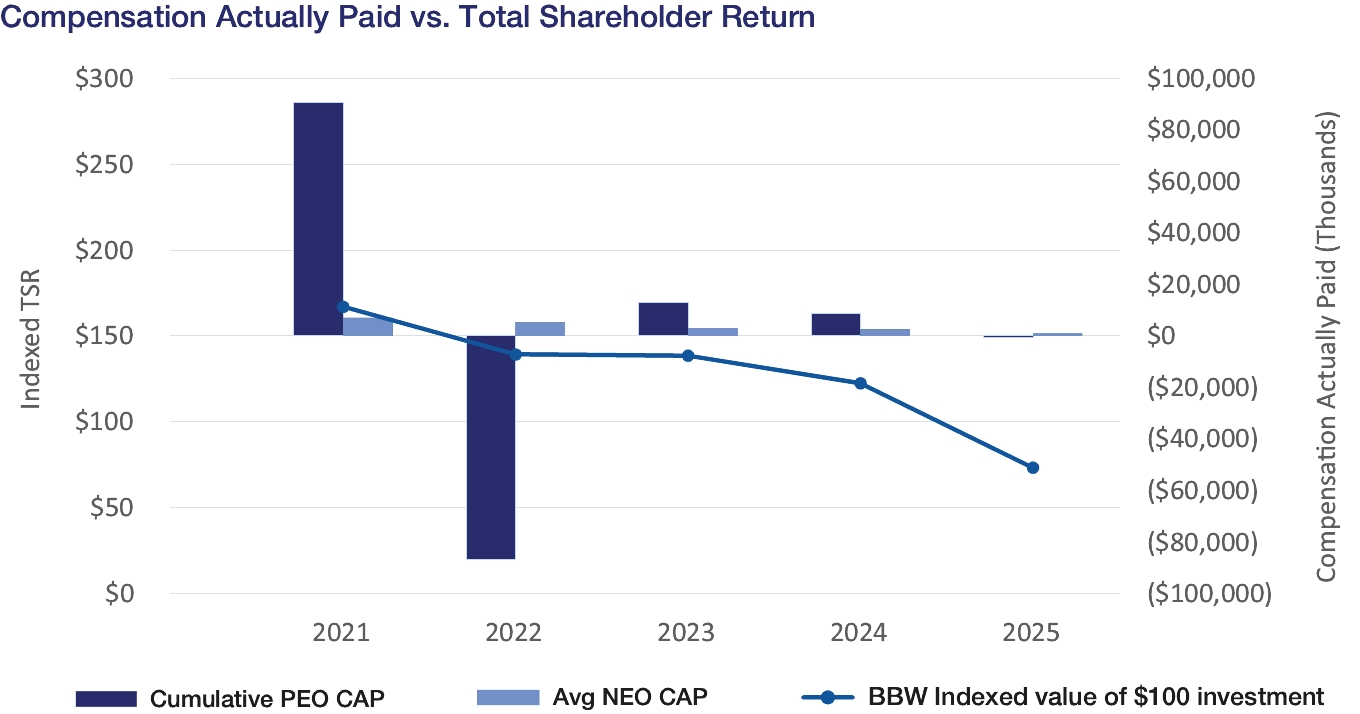
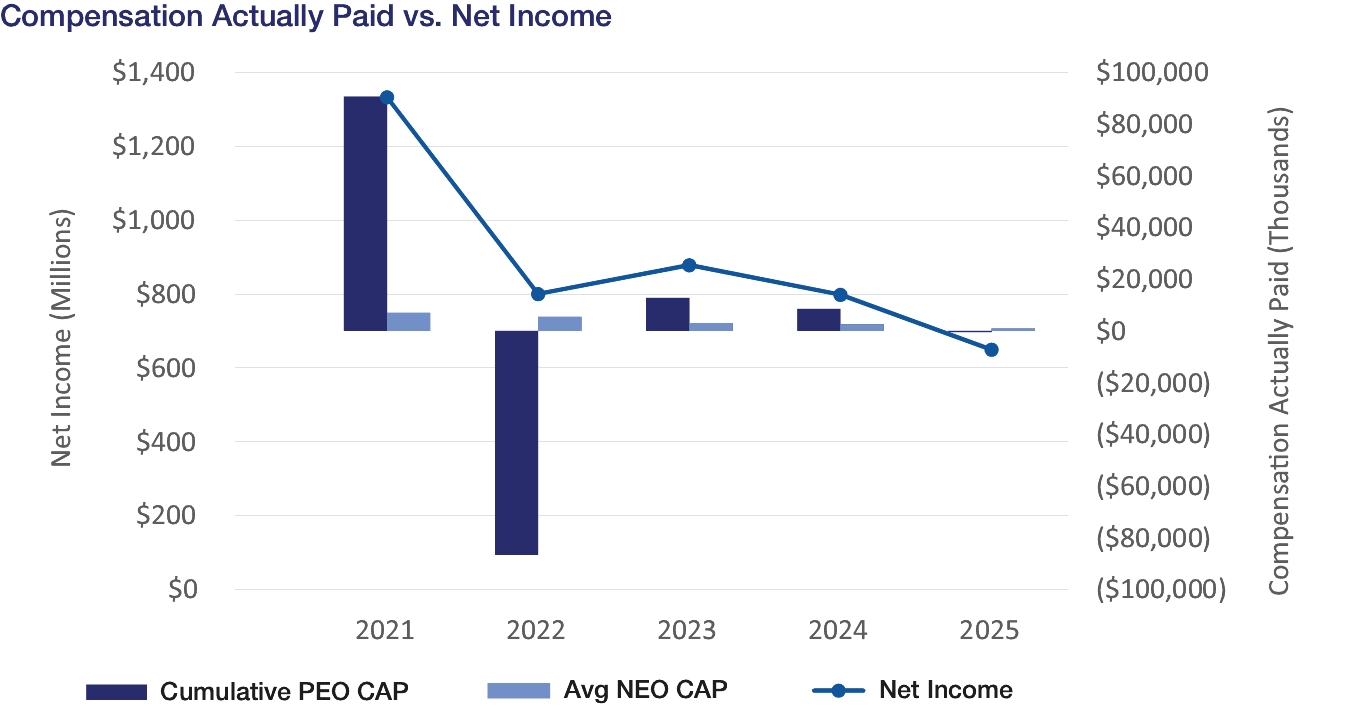
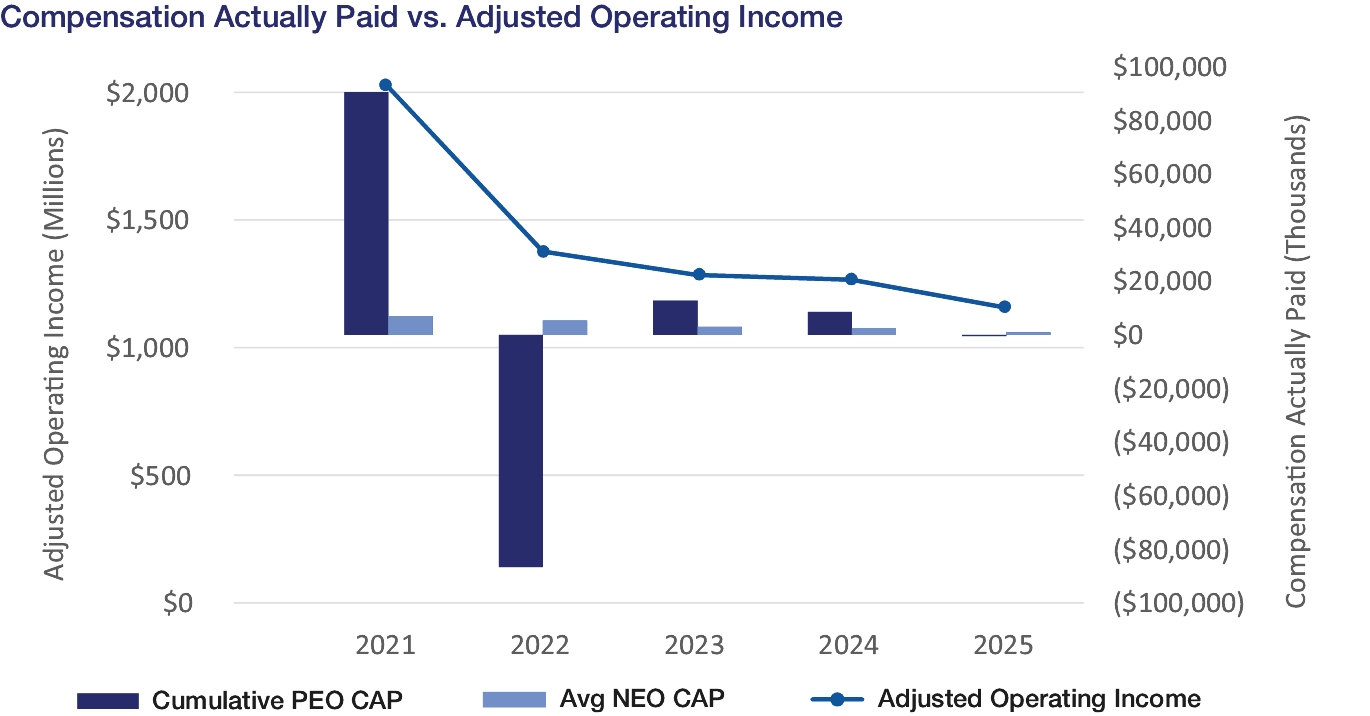
The following table sets forth the compensation for our Principal Executive Officers (“PEO”) and the average compensation for our other non-PEO NEOs, both as reported in the 2024 Summary Compensation Table and with certain adjustments to reflect the “compensation actually paid” (as defined under Commission rules) to such individuals for each of fiscal 2025, 2024, 2023, 2022 and 2021. The table also provides information on our cumulative TSR, the cumulative TSR of our peer group, our net income and our adjusted operating income over such years in accordance with Commission rules.
Heaf(1) | Boswell(1) | Nash(1) | Meslow(1) | |||||||||||||||||||||
Year | Summary Compensation Table "SCT" Total for PEO ($) | Compensation Actually Paid to PEO(2) ($) | Summary Compensation Table Total for PEO ($) | Compensation Actually Paid to PEO(2) ($) | Summary Compensation Table Total for PEO ($) | Compensation Actually Paid to PEO(2) ($) | Summary Compensation Table Total for PEO ($) | Compensation Actually Paid to PEO(2) ($) | ||||||||||||||||
2025 | 6,587,902 | 4,286,615 | 12,567,136 | (4,768,809) | — | — | — | — | ||||||||||||||||
2024 | — | — | 12,570,293 | 8,575,701 | — | — | — | — | ||||||||||||||||
2023 | — | — | 11,694,513 | 12,796,859 | — | — | — | — | ||||||||||||||||
2022 | — | — | 6,908,991 | 7,029,815 | 22,795,013 | 21,646,899 | 9,467,439 | (115,380,126) | ||||||||||||||||
2021 | — | — | — | — | — | — | 17,668,627 | 90,562,269 | ||||||||||||||||
Year | Average Summary Compensation Table Total for Non-PEO NEOs(2)(3) ($) | Average Compensation Actually Paid to Non-PEO NEOs(2)(3) ($) | Value of Initial Fixed $100 Investment Based on: | |||||||||||||||
Total Shareholder Return(4) ($) | Peer Group Total Shareholder Return(4) ($) | Net Income ($M) | Adjusted Operating Income(5) ($M) | |||||||||||||||
2025 | 3,192,016 | 862,665 | 73.27 | 122.45 | 649 | 1,156 | ||||||||||||
2024 | 4,138,178 | 2,506,748 | 122.41 | 134.96 | 798 | 1,266 | ||||||||||||
2023 | 3,749,110 | 2,984,218 | 138.47 | 102.42 | 878 | 1,285 | ||||||||||||
2022 | 6,048,032 | 5,371,173 | 139.22 | 93.72 | 800 | 1,376 | ||||||||||||
2021 | 5,340,605 | 6,947,481 | 167.02 | 101.29 | 1,333 | 2,019 | ||||||||||||
(1) | The Company’s PEOs include the following: (i) for fiscal 2025, Daniel Heaf and Gina Boswell; (ii) for fiscal 2023 and 2024, Gina Boswell; (iii) for fiscal 2022, Gina Boswell, Sarah Nash and Andrew Meslow; and (iv) for fiscal 2021, Andrew Meslow. |
(2) | The “compensation actually paid” (“CAP”) for the PEOs and average CAP for the Company’s non-PEO NEOs in each of fiscal 2025, 2024, 2023, 2022 and 2021 reflect such individuals’ “Total Compensation” for the applicable year (as reported in the Summary Compensation Table for such year), adjusted as set forth in the following table in accordance with Commission rules. The dollar amounts of CAP reflected in the table on the previous page of this proxy statement do not reflect the actual amount of compensation earned by or paid to the PEOs or our other NEOs during the applicable fiscal year, but rather reflect each NEO’s CAP for such year determined pursuant to Commission rules. For information regarding the compensation decisions made by the HCC Committee in regard to the Company’s PEO and other NEOs for fiscal 2025, see “—Compensation Discussion and Analysis” beginning on page 29 of this proxy statement. |
Total from Summary Compensation Table | Subtract FV of awards granted in Year from SCT(a) | Add FV of equity awards granted during the covered fiscal year remains outstanding and unvested at the end of the covered fiscal year(a) | Add FV of equity awards granted during the covered fiscal year and vested during the fiscal year(a) | Change in FV of all the equity awards granted during any prior fiscal year and vested during the fiscal year(a) | Change in FV of equity awards granted during any prior fiscal year that fail to meet the applicable vesting conditions during the covered fiscal year(a) | Granted during any prior fiscal year remains outstanding and unvested as of the end of the covered fiscal year(a) | Compensation Actually Paid | |||||||||||||||||
($) | ($) | ($) | ($) | ($) | ($) | ($) | ($) | |||||||||||||||||
Fiscal 2025 | ||||||||||||||||||||||||
Mr. Heaf | 6,587,902 | 5,043,771 | 2,742,484 | — | — | — | — | 4,286,615 | ||||||||||||||||
Ms. Boswell | 12,567,136 | 8,141,147 | 232,397 | 199,806 | (853,283) | (5,919,359) | (2,854,359) | (4,768,809) | ||||||||||||||||
Non-PEO NEO Average | 3,192,016 | 2,091,179 | 1,207,437 | — | (241,225) | — | (1,204,384) | 862,665 | ||||||||||||||||
Fiscal 2024: | ||||||||||||||||||||||||
Ms. Boswell | 12,570,293 | 8,126,164 | 6,141,959 | — | 37,659 | — | (2,048,047) | 8,575,701 | ||||||||||||||||
Non-PEO NEO Average | 4,138,178 | 1,941,748 | 1,216,202 | — | 73,956 | (609,467) | (370,373) | 2,506,748 | ||||||||||||||||
Fiscal 2023: | ||||||||||||||||||||||||
Ms. Boswell | 11,694,513 | 7,333,900 | 8,738,905 | — | (276,498) | — | (26,161) | 12,796,859 | ||||||||||||||||
Non-PEO NEO Average | 3,749,110 | 1,370,407 | 1,636,606 | — | (152,427) | (253,153) | (625,511) | 2,984,218 | ||||||||||||||||
Fiscal 2022: | ||||||||||||||||||||||||
Ms. Boswell | 6,908,991 | 3,853,024 | 3,973,847 | — | — | — | — | 7,029,815 | ||||||||||||||||
Ms. Nash | 22,795,013 | 17,412,228 | 16,342,298 | — | (43,538) | — | (34,646) | 21,646,899 | ||||||||||||||||
Mr. Meslow | 9,467,439 | — | — | — | (451,632) | (124,395,933) | — | (115,380,126) | ||||||||||||||||
Non-PEO NEO Average | 6,048,032 | 2,642,339 | 2,409,483 | — | (141,718) | — | (302,285) | 5,371,173 | ||||||||||||||||
Fiscal 2021: | ||||||||||||||||||||||||
Mr. Meslow | 17,668,627 | 7,348,518 | 6,102,879 | — | 1,405,205 | — | 72,734,076 | 90,562,269 | ||||||||||||||||
Non-PEO NEO Average | 5,340,605 | 1,126,764 | 1,023,384 | — | 735,793 | (480,289) | 1,454,751 | 6,947,481 | ||||||||||||||||
(a) | Represents the fair value of equity awards calculated in accordance with ASC Topic 718 Compensation—Stock Compensation. |
Stock options are valued on the applicable measurement date using the Black-Scholes option pricing model. Valuation assumptions are based on an expected term calculated as the product of (i) the original expected term, multiplied by (ii) the ratio of remaining and original terms. Dividend yield is calculated based on the projected dividend at the time of measurement over the expected term. Volatility is calculated based on historical volatility at the time of measurement for the same time period as the expected term. The risk-free interest rate is based on U.S. Treasury rates on the measurement date for a time period that most closely aligns with the expected term. |
RSUs and PSUs are valued based on the fair market value of a share of the Company’s common stock on the measurement date, adjusted for anticipated dividend yields. PSU value is determined based on the probable outcome of the performance conditions as of the applicable measurement date. |
(3) | The average compensation for the non-PEO NEOs reflects the compensation for the following individuals: (i) for fiscal 2025, Eva Boratto, Michael Wu, and Tom Mazurek; (ii) for fiscal 2024, Eva Boratto, Michael Wu, Tom Mazurek, Julie Rosen and Deon Riley; (iii) for fiscal 2023, Wendy Arlin, Eva Boratto, Julie Rosen, Deon Riley and Michael Wu; (iv) for fiscal 2022, Wendy Arlin, Julie Rosen, Deon Riley and Michael Wu; and (v) for fiscal 2021, Wendy Arlin, James Bersani, Julie Rosen, Deon Riley and Stuart Burgdoerfer. |
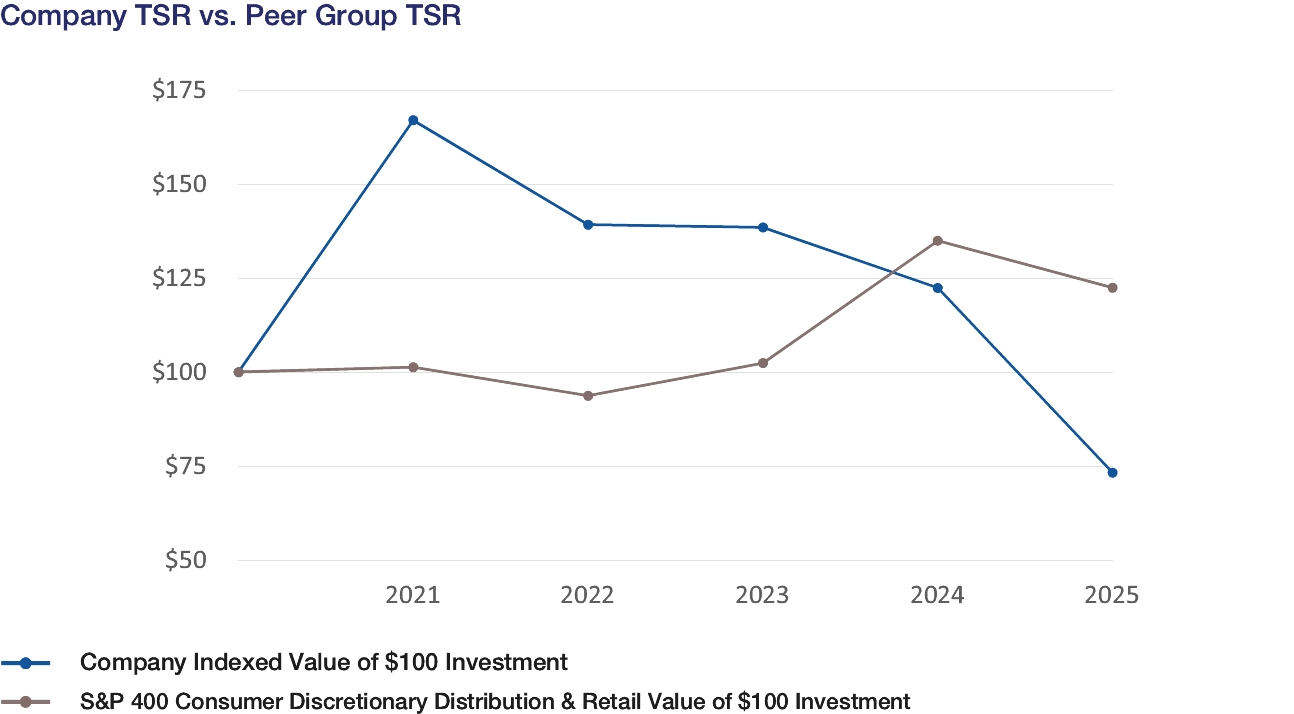
(4) | TSR is cumulative for the measurement periods beginning on January 31, 2021 and ending on the last day of each of fiscal 2025, 2024, 2023, 2022 and 2021, calculated in accordance with Item 201(e) of Regulation S-K, including reinvestment of dividends. The Company’s stock prices prior to August 3, 2021 have been adjusted to give effect to the spin-off of Victoria’s Secret & Co. For fiscal 2025, the Company updated its peer group for purposes of Item 201(e) of Regulation S-K to the S&P 400 Consumer Discretionary Distribution and Retail Index in connection with the Company’s inclusion in the S&P MidCap 400 Consumer Discretionary Index beginning in 2025. Accordingly, the peer group total shareholder return amounts presented in the table above for all years reflect this updated peer group. In prior fiscal years, the Company utilized the S&P 500 Consumer Discretionary Distribution and Retail Index as its peer group. The prior peer group TSR presented for the years fiscal years 2025, 2024, 2023, 2022, and 2021 were $164.12, $161.20, $123.16, $87.69, and $105.90, respectively. |
(5) | Adjusted operating income is a non-GAAP financial measure that reflects the Company’s operating income excluding certain special items. Attached as Appendix A are reconciliations of the Company’s fiscal 2025, 2024, 2023, 2022 and 2021 adjusted operating income to the Company’s fiscal 2025, 2024, 2023, 2022 and 2021 GAAP operating income, as well as other important disclosures regarding non-GAAP financial measures. For fiscal 2024, 2023 and 2022, we did not make any adjustments to operating income; therefore, for fiscal 2024, 2023 and 2022, adjusted operating income is equal to our GAAP operating income for fiscal 2024, 2023 and 2022, respectively. |
(1) | The Company’s PEOs include the following: (i) for fiscal 2025, Daniel Heaf and Gina Boswell; (ii) for fiscal 2023 and 2024, Gina Boswell; (iii) for fiscal 2022, Gina Boswell, Sarah Nash and Andrew Meslow; and (iv) for fiscal 2021, Andrew Meslow. |
(3) | The average compensation for the non-PEO NEOs reflects the compensation for the following individuals: (i) for fiscal 2025, Eva Boratto, Michael Wu, and Tom Mazurek; (ii) for fiscal 2024, Eva Boratto, Michael Wu, Tom Mazurek, Julie Rosen and Deon Riley; (iii) for fiscal 2023, Wendy Arlin, Eva Boratto, Julie Rosen, Deon Riley and Michael Wu; (iv) for fiscal 2022, Wendy Arlin, Julie Rosen, Deon Riley and Michael Wu; and (v) for fiscal 2021, Wendy Arlin, James Bersani, Julie Rosen, Deon Riley and Stuart Burgdoerfer. |
(4) | TSR is cumulative for the measurement periods beginning on January 31, 2021 and ending on the last day of each of fiscal 2025, 2024, 2023, 2022 and 2021, calculated in accordance with Item 201(e) of Regulation S-K, including reinvestment of dividends. The Company’s stock prices prior to August 3, 2021 have been adjusted to give effect to the spin-off of Victoria’s Secret & Co. For fiscal 2025, the Company updated its peer group for purposes of Item 201(e) of Regulation S-K to the S&P 400 Consumer Discretionary Distribution and Retail Index in connection with the Company’s inclusion in the S&P MidCap 400 Consumer Discretionary Index beginning in 2025. Accordingly, the peer group total shareholder return amounts presented in the table above for all years reflect this updated peer group. In prior fiscal years, the Company utilized the S&P 500 Consumer Discretionary Distribution and Retail Index as its peer group. The prior peer group TSR presented for the years fiscal years 2025, 2024, 2023, 2022, and 2021 were $164.12, $161.20, $123.16, $87.69, and $105.90, respectively. |
(4) | TSR is cumulative for the measurement periods beginning on January 31, 2021 and ending on the last day of each of fiscal 2025, 2024, 2023, 2022 and 2021, calculated in accordance with Item 201(e) of Regulation S-K, including reinvestment of dividends. The Company’s stock prices prior to August 3, 2021 have been adjusted to give effect to the spin-off of Victoria’s Secret & Co. For fiscal 2025, the Company updated its peer group for purposes of Item 201(e) of Regulation S-K to the S&P 400 Consumer Discretionary Distribution and Retail Index in connection with the Company’s inclusion in the S&P MidCap 400 Consumer Discretionary Index beginning in 2025. Accordingly, the peer group total shareholder return amounts presented in the table above for all years reflect this updated peer group. In prior fiscal years, the Company utilized the S&P 500 Consumer Discretionary Distribution and Retail Index as its peer group. The prior peer group TSR presented for the years fiscal years 2025, 2024, 2023, 2022, and 2021 were $164.12, $161.20, $123.16, $87.69, and $105.90, respectively. |
(2) | The “compensation actually paid” (“CAP”) for the PEOs and average CAP for the Company’s non-PEO NEOs in each of fiscal 2025, 2024, 2023, 2022 and 2021 reflect such individuals’ “Total Compensation” for the applicable year (as reported in the Summary Compensation Table for such year), adjusted as set forth in the following table in accordance with Commission rules. The dollar amounts of CAP reflected in the table on the previous page of this proxy statement do not reflect the actual amount of compensation earned by or paid to the PEOs or our other NEOs during the applicable fiscal year, but rather reflect each NEO’s CAP for such year determined pursuant to Commission rules. For information regarding the compensation decisions made by the HCC Committee in regard to the Company’s PEO and other NEOs for fiscal 2025, see “—Compensation Discussion and Analysis” beginning on page 29 of this proxy statement. |
Total from Summary Compensation Table | Subtract FV of awards granted in Year from SCT(a) | Add FV of equity awards granted during the covered fiscal year remains outstanding and unvested at the end of the covered fiscal year(a) | Add FV of equity awards granted during the covered fiscal year and vested during the fiscal year(a) | Change in FV of all the equity awards granted during any prior fiscal year and vested during the fiscal year(a) | Change in FV of equity awards granted during any prior fiscal year that fail to meet the applicable vesting conditions during the covered fiscal year(a) | Granted during any prior fiscal year remains outstanding and unvested as of the end of the covered fiscal year(a) | Compensation Actually Paid | |||||||||||||||||
($) | ($) | ($) | ($) | ($) | ($) | ($) | ($) | |||||||||||||||||
Fiscal 2025 | ||||||||||||||||||||||||
Mr. Heaf | 6,587,902 | 5,043,771 | 2,742,484 | — | — | — | — | 4,286,615 | ||||||||||||||||
Ms. Boswell | 12,567,136 | 8,141,147 | 232,397 | 199,806 | (853,283) | (5,919,359) | (2,854,359) | (4,768,809) | ||||||||||||||||
Non-PEO NEO Average | 3,192,016 | 2,091,179 | 1,207,437 | — | (241,225) | — | (1,204,384) | 862,665 | ||||||||||||||||
Fiscal 2024: | ||||||||||||||||||||||||
Ms. Boswell | 12,570,293 | 8,126,164 | 6,141,959 | — | 37,659 | — | (2,048,047) | 8,575,701 | ||||||||||||||||
Non-PEO NEO Average | 4,138,178 | 1,941,748 | 1,216,202 | — | 73,956 | (609,467) | (370,373) | 2,506,748 | ||||||||||||||||
Fiscal 2023: | ||||||||||||||||||||||||
Ms. Boswell | 11,694,513 | 7,333,900 | 8,738,905 | — | (276,498) | — | (26,161) | 12,796,859 | ||||||||||||||||
Non-PEO NEO Average | 3,749,110 | 1,370,407 | 1,636,606 | — | (152,427) | (253,153) | (625,511) | 2,984,218 | ||||||||||||||||
Fiscal 2022: | ||||||||||||||||||||||||
Ms. Boswell | 6,908,991 | 3,853,024 | 3,973,847 | — | — | — | — | 7,029,815 | ||||||||||||||||
Ms. Nash | 22,795,013 | 17,412,228 | 16,342,298 | — | (43,538) | — | (34,646) | 21,646,899 | ||||||||||||||||
Mr. Meslow | 9,467,439 | — | — | — | (451,632) | (124,395,933) | — | (115,380,126) | ||||||||||||||||
Non-PEO NEO Average | 6,048,032 | 2,642,339 | 2,409,483 | — | (141,718) | — | (302,285) | 5,371,173 | ||||||||||||||||
Fiscal 2021: | ||||||||||||||||||||||||
Mr. Meslow | 17,668,627 | 7,348,518 | 6,102,879 | — | 1,405,205 | — | 72,734,076 | 90,562,269 | ||||||||||||||||
Non-PEO NEO Average | 5,340,605 | 1,126,764 | 1,023,384 | — | 735,793 | (480,289) | 1,454,751 | 6,947,481 | ||||||||||||||||
(a) | Represents the fair value of equity awards calculated in accordance with ASC Topic 718 Compensation—Stock Compensation. |
Stock options are valued on the applicable measurement date using the Black-Scholes option pricing model. Valuation assumptions are based on an expected term calculated as the product of (i) the original expected term, multiplied by (ii) the ratio of remaining and original terms. Dividend yield is calculated based on the projected dividend at the time of measurement over the expected term. Volatility is calculated based on historical volatility at the time of measurement for the same time period as the expected term. The risk-free interest rate is based on U.S. Treasury rates on the measurement date for a time period that most closely aligns with the expected term. |
RSUs and PSUs are valued based on the fair market value of a share of the Company’s common stock on the measurement date, adjusted for anticipated dividend yields. PSU value is determined based on the probable outcome of the performance conditions as of the applicable measurement date. |
Most Important Performance Measures for Fiscal 2025
The following table sets forth a list of the performance measures that we view as the “most important” measures for linking our PEO and other NEO pay to performance for fiscal 2025. While these financial measures are considered the most important measures, additional financial and other measures were also considered to align pay and performance as further described under the heading “—Compensation Discussion and Analysis” beginning on page 29 of this proxy statement.
Performance Measure |
Adjusted operating income |
Net Sales |
Relative total shareholder return |
Cumulative adjusted operating income as a percentage of cumulative sales (“adjusted operating income margin”) |
From the above list of performance measures, we view adjusted operating income as our most important financial performance measure used to link compensation actually paid to our PEOs and other NEOs to Company performance for fiscal 2025. Adjusted operating income is a key component of the Company’s short-term performance-based incentive compensation program and is a performance measure over which our NEOs can have significant impact. In addition, adjusted operating income is directly linked to the Company’s long-term strategic growth plan and performance that drive shareholder value and is highly correlated with fluctuations in our stock price. In fiscal 2025, we adjusted the weighting of the Company’s short-term performance-based incentive compensation program, net sales being weighted at 35%, with absolute adjusted operating income weighted at 65% and continuing to serve as the primary performance metric.
As for the other performance measures listed in the table above, adjusted operating income margin and relative TSR are equally weighted metrics in our long-term performance-based incentive compensation program for fiscal 2025, which was a key component of our NEOs’ pay in 2025.
For additional information regarding how the above listed performance measures were utilized as part of our executive compensation program in fiscal 2025, see “—Compensation Discussion and Analysis” beginning on page 29 of this proxy statement.
(5) | Adjusted operating income is a non-GAAP financial measure that reflects the Company’s operating income excluding certain special items. Attached as Appendix A are reconciliations of the Company’s fiscal 2025, 2024, 2023, 2022 and 2021 adjusted operating income to the Company’s fiscal 2025, 2024, 2023, 2022 and 2021 GAAP operating income, as well as other important disclosures regarding non-GAAP financial measures. For fiscal 2024, 2023 and 2022, we did not make any adjustments to operating income; therefore, for fiscal 2024, 2023 and 2022, adjusted operating income is equal to our GAAP operating income for fiscal 2024, 2023 and 2022, respectively. |